OPERATIONS AND FINANCIAL REVIEW - Mewah Group
OPERATIONS AND FINANCIAL REVIEW - Mewah Group
OPERATIONS AND FINANCIAL REVIEW - Mewah Group

Create successful ePaper yourself
Turn your PDF publications into a flip-book with our unique Google optimized e-Paper software.
ANNUAL REPORT 2012<br />
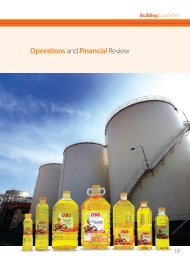
<strong>OPERATIONS</strong> <strong>AND</strong><br />
<strong>FINANCIAL</strong> <strong>REVIEW</strong><br />
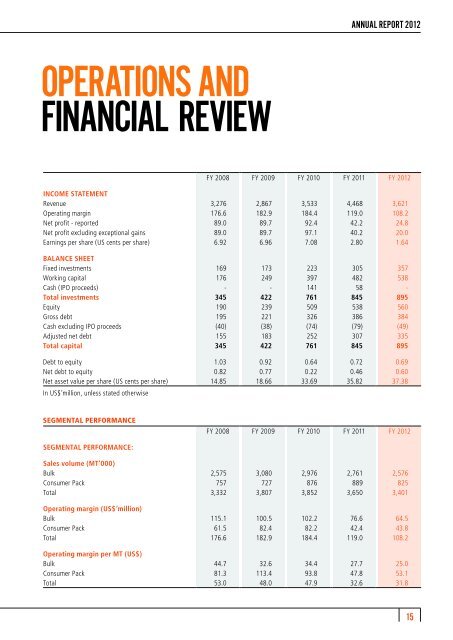
FY 2008 FY 2009 FY 2010 FY 2011 FY 2012<br />
INCOME STATEMENT<br />
Revenue 3,276 2,867 3,533 4,468 3,621<br />
Operating margin 176.6 182.9 184.4 119.0 108.2<br />
Net profit - reported 89.0 89.7 92.4 42.2 24.8<br />
Net profit excluding exceptional gains 89.0 89.7 97.1 40.2 20.0<br />
Earnings per share (US cents per share) 6.92 6.96 7.08 2.80 1.64<br />
BALANCE SHEET<br />
Fixed investments 169 173 223 305 357<br />
Working capital 176 249 397 482 538<br />
Cash (IPO proceeds) - - 141 58 -<br />
Total investments 345 422 761 845 895<br />
Equity 190 239 509 538 560<br />
Gross debt 195 221 326 386 384<br />
Cash excluding IPO proceeds (40) (38) (74) (79) (49)<br />
Adjusted net debt 155 183 252 307 335<br />
Total capital 345 422 761 845 895<br />
Debt to equity 1.03 0.92 0.64 0.72 0.69<br />
Net debt to equity 0.82 0.77 0.22 0.46 0.60<br />
Net asset value per share (US cents per share) 14.85 18.66 33.69 35.82 37.38<br />
In US$’million, unless stated otherwise<br />
SEGMENTAL PERFORMANCE<br />
FY 2008 FY 2009 FY 2010 FY 2011 FY 2012<br />
SEGMENTAL PERFORMANCE:<br />
Sales volume (MT’000)<br />
Bulk 2,575 3,080 2,976 2,761 2,576<br />
Consumer Pack 757 727 876 889 825<br />
Total 3,332 3,807 3,852 3,650 3,401<br />
Operating margin (US$’million)<br />
Bulk 115.1 100.5 102.2 76.6 64.5<br />
Consumer Pack 61.5 82.4 82.2 42.4 43.8<br />
Total 176.6 182.9 184.4 119.0 108.2<br />
Operating margin per MT (US$)<br />
Bulk 44.7 32.6 34.4 27.7 25.0<br />
Consumer Pack 81.3 113.4 93.8 47.8 53.1<br />
Total 53.0 48.0 47.9 32.6 31.8<br />
15
MEWAH INTERNATIONAL INC.<br />
PALM OIL INDUSTRY IN 2012<br />
Challenges for the palm oil industry continued in 2012. While the<br />
production for palm oil continued to grow, demand did not keep<br />
pace with the supply. This resulted in continued inventory build-up<br />
in the producing countries and falling prices throughout the year.<br />
Palm oil prices closed 30% lower at RM2,200 from RM3,150 a year<br />
ago. The prices peaked at RM3,550 in April before plummeting more<br />
than 40% to RM2,050 in December compared to peak of RM3,950<br />
and bottom price of RM2,800 in 2011.<br />
While the palm oil consumption for food continued to be stable,<br />
reduced industrial demand largely from Europe and China affected<br />
the overall demand. Under weak global economic and financials<br />
sentiments coupled with depressed and falling prices for palm oil,<br />
buyers at destinations continued to remain cautious and avoided<br />
building inventories. The past year trend of low inventories at<br />
destinations and high inventories at originations continued<br />
suppressing the prices and the margins for the industry. Conditions<br />
remained tough particularly for Malaysian refiners due to export tax<br />
disadvantage compared to Indonesian peers.<br />
GROUP’S SALES VOLUME<br />
The <strong>Group</strong> continued its cautious approach of participating selectively<br />
in trade flows and selecting its customers and trade terms which<br />
resulted in total sales volume declining by 6.8% to 3,401 thousand<br />
MT for the year. Under difficult operating conditions, volumes for<br />
both Bulk and Consumer Pack segment declined by 6.7% and 7.2%<br />
respectively to 2,576 thousand MT and 825 thousand MT. Consumer<br />
Pack segment continued to contribute strongly at 24.2% of total<br />
sales volume.<br />
Sales Volume (MT’000)<br />
3,807 3,852<br />
3,650<br />
3,332<br />
3,401<br />
727 876<br />
889<br />
757<br />
825<br />
2,575 3,080 2,976 2,761 2,576<br />
FY 2008 FY 2009 FY 2010 FY 2011 FY 2012<br />
Excluding rice sales of 125 thousand MT, sales volume of 3,276<br />
thousand MT was significantly higher than our current installed<br />
capacity of 2,800 thousand MT.<br />
Consumer Pack<br />
Bulk<br />
16
ANNUAL REPORT 2012<br />
GEOGRAPHICAL SPREAD<br />
Total Sales<br />
38% Middle East<br />
49%<br />
Malaysia/<br />
Singapore<br />
51%<br />
Destination<br />
26% Other Asia<br />
20% Africa<br />
16% Rest of the World<br />
WELL DIVERSIFIED SALES REVENUE<br />
Our total sales revenue of US$3,621 million in 2012 was 19.0% lower<br />
than last year due to lower sales volume as well as lower average<br />
selling prices. Sales revenue for the Bulk and Consumer Pack segments<br />
declined by 16.9% and 24.1% respectively. Consumer Pack segment<br />
continued to contribute strongly at 26.8% of total revenue.<br />
As part of our strategy to diversify our range of food products, we<br />
have added rice to our products portfolio. Rice offers significant<br />
synergies to our existing business as we offer rice to our existing<br />
customers in consumer-pack form under our own brands, through<br />
our global distribution networks. We reported sales volume of 125<br />
thousand MT and revenue of US$57.6 million in the first full year of<br />
operations.<br />
We strive to diversify our sales revenue across the globe and our<br />
efforts continued in 2012. Compared to 47% last year, 51% of total<br />
sales were made as destination sales in 2012, to customers with<br />
billing address of countries outside of Malaysia and Singapore.<br />
Destination sales remained diversified with Middle East and Africa<br />
contributing 38% and 20% of total destination sales respectively,<br />
26% of the sales in Asia and the residue of 16% sold to rest of the<br />
world.<br />
Destination sales for both Bulk and Consumer Pack Segments were<br />
strong at 37% and 89% respectively with Middle East and Africa.<br />
Bulk Sales<br />
63%<br />
Ex Malaysia/<br />
Singapore<br />
Consumer Pack Sales<br />
11%<br />
Malaysia/<br />
Singapore<br />
37%<br />
Other<br />
89%<br />
Other<br />
49% Middle East<br />
41% Other Asia<br />
10% Rest of the World<br />
41% Africa<br />
26% Middle East<br />
11% Europe<br />
10% Other Asia<br />
7% Pacific<br />
5% America<br />
17
MEWAH INTERNATIONAL INC.<br />
OPERATING MARGINS<br />
The <strong>Group</strong> measures and tracks the performance in terms of<br />
Operating Margin per MT, sales volume and resultant total<br />
operating margin. OM is calculated as revenue, less cost of sales<br />
(excluding depreciation), selling and distribution expenses and<br />
foreign exchange gains or losses.<br />
Over the last five decades, we have developed a successful integrated<br />
business model of participating in midstream and downstream parts<br />
of the value chain in the attractive palm oil industry, built inherent<br />
operational flexibility, developed sound risk management practices,<br />
and established our own brands and global distribution capabilities<br />
that have helped us to deliver robust and consistent operating<br />
margins throughout the ups and downs of economic cycles.<br />
Despite challenging industry conditions, we achieved operating<br />
margin of US$31.8 per MT though marginally down from<br />
US$32.6 per MT last year. Bulk division which consists mainly<br />
of refining and trading margin dropped from US$27.7 per MT to<br />
US$25.0 per MT. Consumer Pack division which includes branding<br />
and distribution margins was more resilient achieving US$53.1<br />
per MT compared to US$47.8 per MT. Bulk and Consumer Pack<br />
segments contributed 59.6% and 40.4% of total operating margin<br />
respectively.<br />
Operating Margin (US$ in millions)<br />
176.6<br />
182.9<br />
184.4<br />
61.5<br />
82.4<br />
82.2<br />
119.0<br />
108.2<br />
42.4<br />
43.8<br />
115.1 100.5 102.2 76.6 64.5<br />
FY 2008 FY 2009 FY 2010 FY 2011 FY 2012<br />
Consumer Pack<br />
Bulk<br />
Operating Margin per MT (US$)<br />
FY 2008 FY 2009 FY 2010 FY 2011 FY 2012<br />
Total 53.0 48.0 47.9 32.6 31.8<br />
Bulk 44.7 32.6 34.4 27.7 25.0<br />
Consumer Pack 81.3 113.4 93.8 47.8 53.1<br />
18
ANNUAL REPORT 2012<br />
STRONG BALANCE SHEET<br />
We manage our capital structure roubustly by controlling our debt to<br />
equity ratio for fixed investment, current investment and in totality<br />
for the business. Due to the nature of our investments, we aim to<br />
keep net debt to equity ratio to be below 1.0 for fixed investments,<br />
below 2.0 for current investments and below 1.5 on an overall basis.<br />
We maintained healthy debt to equity ratio of 0.69 or net debt to<br />
equity ratio of 0.60 leaving sufficient scope to raise additional debt<br />
to support our growth plans.<br />
We constantly maintain working capital credit lines to support our<br />
business. Our current utilisation of the credit lines available to us is<br />
only at 25%.<br />
Our efficient, large scale, integrated production facilities and strong<br />
distribution network continued to help us keep our cycle time low<br />
on the average of 45 days in 2012. Excluding Readily Marketable<br />
Inventories, our cycle time remained low at 25 days.<br />
DEBT TO EQUITY <strong>AND</strong> NET DEBT TO EQUITY<br />
CYCLE TIME (DAYS)<br />
1.03<br />
0.82<br />
0.92<br />
0.77<br />
0.64<br />
0.72<br />
0.46<br />
0.69<br />
0.60<br />
18<br />
37<br />
27<br />
43<br />
23<br />
42<br />
21<br />
45<br />
25<br />
0.22<br />
10<br />
FY 2008 FY 2009 FY 2010 FY 2011 FY 2012 FY 2008 FY 2009 FY 2010 FY 2011 FY 2012<br />
Debt to equity Net debt to equity Cycle time (days)<br />
Adjusted for Readily<br />
Marketable Inventories<br />
19