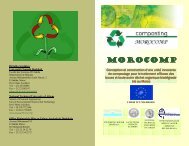
(best examples and good practices) on household organic waste ...
(best examples and good practices) on household organic waste ...
(best examples and good practices) on household organic waste ...

You also want an ePaper? Increase the reach of your titles
YUMPU automatically turns print PDFs into web optimized ePapers that Google loves.
Figure 13.: AD life cycle .......................................................................................................................... 31<br />
Figure 14.: Combusti<strong>on</strong> processes for mass burn incinerati<strong>on</strong> ................................................................. 38<br />
Figure 15. :Three types of incinerators: (a) fixed grate (left), (b) rotary kiln (middle), (c) fluidized<br />
bed(right)............................................................................................................................................... 40<br />
Figure 16.: Grate system structure.......................................................................................................... 41<br />
Figure 17.: Rotary kiln <strong>waste</strong> incinerator ................................................................................................ 42<br />
Figure 18.: HICB type fluidized bed type gasificati<strong>on</strong> furnace sketch drawing ......................................... 43<br />
Figure 19.: TPS circulating fluidized bed gasificati<strong>on</strong> plant <str<strong>on</strong>g>and</str<strong>on</strong>g> gas cleaning plant ................................. 50<br />
Figure 20.: A typical plasma gasificati<strong>on</strong> plant ....................................................................................... 52<br />
Figure 21.: C<strong>on</strong>ceptual design cross secti<strong>on</strong> ............................................................................................ 56<br />
Figure 22.: Andritz drum drying system .................................................................................................. 73<br />
Figure.23.: Magnetic Separati<strong>on</strong> ............................................................................................................ 76<br />
Figure 24.: Optical sorting ...................................................................................................................... 77<br />
Figure 25.: Diagram of MRF process ....................................................................................................... 78<br />
Figure 26.: Generati<strong>on</strong> of municipal <strong>waste</strong> in the EU-27, 1995 <str<strong>on</strong>g>and</str<strong>on</strong>g> 2007................................................. 85<br />
Figure 27.: Percentage of municipal <strong>waste</strong> that is l<str<strong>on</strong>g>and</str<strong>on</strong>g>filled in the EU-27, 1995 <str<strong>on</strong>g>and</str<strong>on</strong>g> 2007 ...................... 86<br />
Figure 28.: Percentage of municipal <strong>waste</strong> that is incinerated in the EU-27, 1995 <str<strong>on</strong>g>and</str<strong>on</strong>g> 2007 ................... 86<br />
Figure 29.: Management of biodegradable municipal <strong>waste</strong> 1995–2005 ................................................ 89<br />
Figure 30.: Separate collecti<strong>on</strong> of biodegradable <strong>waste</strong> in Italy ............................................................. 92<br />
Figure 31.: Schematic operati<strong>on</strong> of M<strong>on</strong>tanaso plant in Italy. ................................................................. 95<br />
Figure 32.: Separate collecti<strong>on</strong> of biodegradable <strong>waste</strong> fracti<strong>on</strong>s in Germany ...................................... 107<br />
Figure 33.:Drying process descripti<strong>on</strong> diagram ..................................................................................... 110<br />
Figure 34.: The schematic flow of the Kaiserslautern plant in Germany. ............................................... 118<br />
Figure 35.: Average compositi<strong>on</strong> of SRF of Dresden plant in Germany .................................................. 123<br />
Figure 36.: Process diagram of the Dresden plant in Germany. ............................................................. 125<br />
Figure 37.: The DDD drying system ...................................................................................................... 126<br />
Figure 38.: Process diagram of the Rennerod plant in Germany. ........................................................... 131<br />
Figure 39.: Schematic operati<strong>on</strong> of the Ludwigslust plant in Germany. ................................................. 133<br />
Figure 40.: Biological treatment through decades in Sweden ............................................................... 141<br />
Figure 41.: Stockholm c<strong>on</strong>cept .............................................................................................................. 145<br />
Figure 42.: Linköping c<strong>on</strong>cept ............................................................................................................... 149<br />
Figure 43.: The life-cycle of the Växtkraft project in Västerås ............................................................... 152