(best examples and good practices) on household organic waste ...
(best examples and good practices) on household organic waste ... (best examples and good practices) on household organic waste ...
163 Meet
164 9.2. Waste quantities 2008 The main target of the English government is to reduce household waste after reuse, recycling
- Page 123 and 124: 112 The sludge is placed into a lar
- Page 125 and 126: 114 Picture 22.: Air mixing mechani
- Page 127 and 128: 116 Finally the dried sludge is bee
- Page 129 and 130: 118 process treats the wastes as co
- Page 131 and 132: 120 consumption is about 0.7 x10⁶ k
- Page 133 and 134: 122 Picture 30.: The heat exchanger
- Page 135 and 136: 124 used for the construction of l<
- Page 137 and 138: 126 International’. In the Drum D
- Page 139 and 140: 128 Picture 34.: Delivery crane in
- Page 141 and 142: 130 industrial processes, where <st
- Page 143 and 144: 132 industry, mixes the waste <stro
- Page 145 and 146: 134 8. Sweden The Swedish strategy
- Page 147 and 148: 136 joint committee or local govern
- Page 149 and 150: 138 upon the number of collected fr
- Page 151 and 152: 140 2004 2005 2006 2007 2008 Hazard
- Page 153 and 154: 142 Anaerobic digestion also produc
- Page 155 and 156: 144 Hässleholm 12,300 10,120 Karls
- Page 157 and 158: 146 distributed either through gas
- Page 159 and 160: 148 mentioned in earlier. (Chemical
- Page 161 and 162: 150 Picture 39.: Public fuelling st
- Page 163 and 164: 152 The pumpable organic waste is b
- Page 165 and 166: 154 purchased by AGA and</s
- Page 167 and 168: 156 Picture 43.: Paper bag with hou
- Page 169 and 170: 158 (Table 8.): The Ljungsjöverket
- Page 171 and 172: 160 Figure 46.: Schematic operation
- Page 173: 162 9. United Kingdom The British S
- Page 177 and 178: 166 9.3. Best practices</st
- Page 179 and 180: 168 The partners collect around 840
- Page 181 and 182: 170 Figure 51.: Quantity of waste c
- Page 183 and 184: 172 The company recycles wood, meta
- Page 185 and 186: 174 (26,650) of all households acro
- Page 187 and 188: 176 Recycling Bins which are emptie
- Page 189 and 190: 178 distance path. Since 1981, the
- Page 191 and 192: 180 The scheme in operation in Wye
- Page 193 and 194: 182 The method of composting the ga
- Page 195 and 196: 184 such as: Waste, Management (of
- Page 197 and 198: 186 heterogeneous in composition <s
- Page 199 and 200: 188 2000 2004 2005 2006 Total 63,24
- Page 201 and 202: 190 All domestic waste/recycling co
- Page 203 and 204: 192 The end product is made into a
- Page 205 and 206: 194 10.4.4. The Moerdijk incinerati
- Page 207 and 208: 196 11. Greece The Greeks Strategy
- Page 209 and 210: 198 The encouragement of rational o
- Page 211 and 212: 200 Picture 55.: Panoramic View of
- Page 213 and 214: 202 Four (4) ballistic separators
- Page 215 and 216: 204 Picture 58.: View of Composting
- Page 217 and 218: 206 Picture 59.: Refinery Unit at A
- Page 219 and 220: 208 Unit for Treatment of Air Emiss
- Page 221 and 222: 210 Picture 60.: Chania MBT plant (
- Page 223 and 224: 212 A biological stabilization is t
164<br />
9.2. Waste quantities 2008<br />
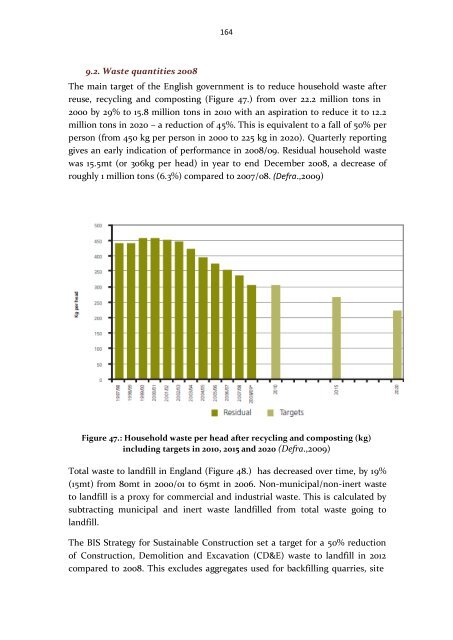
The main target of the English government is to reduce <strong>household</strong> <strong>waste</strong> after<br />
reuse, recycling <str<strong>on</strong>g>and</str<strong>on</strong>g> composting (Figure 47.) from over 22.2 milli<strong>on</strong> t<strong>on</strong>s in<br />
2000 by 29% to 15.8 milli<strong>on</strong> t<strong>on</strong>s in 2010 with an aspirati<strong>on</strong> to reduce it to 12.2<br />
milli<strong>on</strong> t<strong>on</strong>s in 2020 – a reducti<strong>on</strong> of 45%. This is equivalent to a fall of 50% per<br />
pers<strong>on</strong> (from 450 kg per pers<strong>on</strong> in 2000 to 225 kg in 2020). Quarterly reporting<br />
gives an early indicati<strong>on</strong> of performance in 2008/09. Residual <strong>household</strong> <strong>waste</strong><br />
was 15.5mt (or 306kg per head) in year to end December 2008, a decrease of<br />
roughly 1 milli<strong>on</strong> t<strong>on</strong>s (6.3%) compared to 2007/08. (Defra.,2009)<br />
Figure 47.: Household <strong>waste</strong> per head after recycling <str<strong>on</strong>g>and</str<strong>on</strong>g> composting (kg)<br />
including targets in 2010, 2015 <str<strong>on</strong>g>and</str<strong>on</strong>g> 2020 (Defra.,2009)<br />
Total <strong>waste</strong> to l<str<strong>on</strong>g>and</str<strong>on</strong>g>fill in Engl<str<strong>on</strong>g>and</str<strong>on</strong>g> (Figure 48.) has decreased over time, by 19%<br />
(15mt) from 80mt in 2000/01 to 65mt in 2006. N<strong>on</strong>-municipal/n<strong>on</strong>-inert <strong>waste</strong><br />
to l<str<strong>on</strong>g>and</str<strong>on</strong>g>fill is a proxy for commercial <str<strong>on</strong>g>and</str<strong>on</strong>g> industrial <strong>waste</strong>. This is calculated by<br />
subtracting municipal <str<strong>on</strong>g>and</str<strong>on</strong>g> inert <strong>waste</strong> l<str<strong>on</strong>g>and</str<strong>on</strong>g>filled from total <strong>waste</strong> going to<br />
l<str<strong>on</strong>g>and</str<strong>on</strong>g>fill.<br />
The BIS Strategy for Sustainable C<strong>on</strong>structi<strong>on</strong> set a target for a 50% reducti<strong>on</strong><br />
of C<strong>on</strong>structi<strong>on</strong>, Demoliti<strong>on</strong> <str<strong>on</strong>g>and</str<strong>on</strong>g> Excavati<strong>on</strong> (CD&E) <strong>waste</strong> to l<str<strong>on</strong>g>and</str<strong>on</strong>g>fill in 2012<br />
compared to 2008. This excludes aggregates used for backfilling quarries, site


