12B Centripetal Acceleration - Vernier Software & Technology
12B Centripetal Acceleration - Vernier Software & Technology
12B Centripetal Acceleration - Vernier Software & Technology

Create successful ePaper yourself
Turn your PDF publications into a flip-book with our unique Google optimized e-Paper software.
<strong>Centripetal</strong> <strong>Acceleration</strong><br />
Experiment<br />
<strong>12B</strong><br />
INTRODUCTION<br />
The typical response when one hears the word acceleration is to think of an object changing its<br />
speed. You have also learned that velocity has both magnitude and direction. So, an object<br />
traveling at constant speed in a circular path is undergoing an acceleration. In this experiment<br />
you will develop an expression for this type of acceleration.<br />
OBJECTIVES<br />
In this experiment, you will<br />
• Analyze velocity vectors of an object undergoing uniform circular motion to determine<br />
the direction of the acceleration vector at any given moment.<br />
• Collect force, velocity, and radius data for a mass swinging as a pendulum.<br />
• Analyze the force vs. velocity and force vs. radius graphs.<br />
• Determine the relationship between force, mass, velocity, and radius when the force is<br />
perpendicular to the velocity.<br />
• Use this relationship and Newton’s second law to determine an expression for centripetal<br />
acceleration.<br />
MATERIALS<br />
<strong>Vernier</strong> data-collection interface<br />
Logger Pro or LabQuest App<br />
<strong>Vernier</strong> Photogate<br />
<strong>Vernier</strong> Dual-Range Force Sensor<br />
right-angle clamp<br />
mass hanger<br />
PRE-LAB INVESTIGATION<br />
string<br />
ring stand or support rod<br />
rod to support Force Sensor<br />
slotted lab masses<br />
metric tape<br />
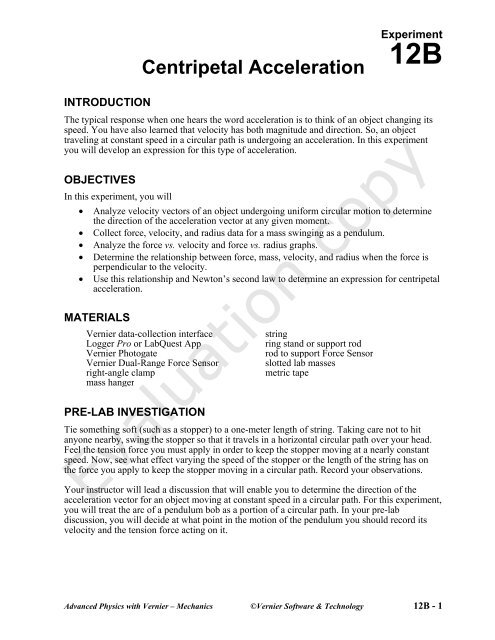
Tie something soft (such as a stopper) to a one-meter length of string. Taking care not to hit<br />
anyone nearby, swing the stopper so that it travels in a horizontal circular path over your head.<br />
Feel the tension force you must apply in order to keep the stopper moving at a nearly constant<br />
speed. Now, see what effect varying the speed of the stopper or the length of the string has on<br />
the force you apply to keep the stopper moving in a circular path. Record your observations.<br />
Evaluation copy<br />
Your instructor will lead a discussion that will enable you to determine the direction of the<br />
acceleration vector for an object moving at constant speed in a circular path. For this experiment,<br />
you will treat the arc of a pendulum bob as a portion of a circular path. In your pre-lab<br />
discussion, you will decide at what point in the motion of the pendulum you should record its<br />
velocity and the tension force acting on it.<br />
Advanced Physics with <strong>Vernier</strong> – Mechanics ©<strong>Vernier</strong> <strong>Software</strong> & <strong>Technology</strong> <strong>12B</strong> - 1
Experiment <strong>12B</strong><br />
PROCEDURE<br />
1. Secure a Dual-Range Force Sensor to a support rod connected with a right angle clamp to a<br />
longer rod or ring stand, as shown in Figure 1. The sensor should be in the vertical position.<br />
2. Tie a mass hanger to one end of a length of string (0.7 to 1.0 m) and make a loop at the other<br />
end that will allow the hanger to swing freely from the hook on the force sensor.<br />
3. Place a Photogate on the floor beneath the mass hanger so that the hanger (plus the additional<br />
mass you place on it) can swing freely through the arms of the Photogate, as shown in<br />
Figure 2.<br />
Figure 1 Figure 2<br />
4. Connect the force sensor and the photogate to the interface and start the data-collection<br />
program.<br />
5. Set up data collection.<br />
Using Logger Pro<br />
a. Use time-based data-collection mode. Change the data-collection rate to<br />
50 samples/second and the data-collection length to 10 seconds.<br />
b. Choose Set Up Sensors ►Show All Interfaces from the Experiment menu.<br />
c. Click the image of the Photogate and choose Gate Timing.<br />
d. Click again on the image of the Photogate to set the Distance or Length to the<br />
measured diameter of the object that will block the Photogate as it swings through its<br />
arms.<br />
Using LabQuest as a standalone device<br />
a. Tap Mode. Select Time Based data collection. Set the data-collection rate to<br />
50 samples/second, and the duration to 10 seconds.<br />
b. In the same mode dialog, scroll down to the Photogate Mode section, and expand the<br />
section by tapping on the arrow.<br />
c. Choose Gate Timing. Change the length to the measured diameter of the object that<br />
will block the Photogate as it swings through its arms.<br />
d. Select OK to accept these settings.<br />
<strong>12B</strong> - 2<br />
Advanced Physics with <strong>Vernier</strong> - Mechanics
<strong>Centripetal</strong> <strong>Acceleration</strong><br />
With either program, make the necessary adjustments so that two graphs, force vs. time and<br />
velocity vs. time, appear in the graph window.<br />
Part 1 Force vs. velocity<br />
1. Record the mass of the object serving as your pendulum bob. For this<br />
experiment, we are treating the hanger and weight as an idealized bob, that<br />
is, as a point mass. Its center of mass (CM) is the position where you could<br />
theoretically balance it on your finger if it were lying sideways. Measure<br />
and record the distance from the hook on the force sensor to the center of mass of the bob<br />
that will swing through the photogate.<br />
2. Pull the bob back 15 to 20° from its resting position<br />
and release it. If it appears to be swinging smoothly<br />
through the photogate, begin collecting data;<br />
otherwise, repeat.<br />
3. Select a region of the force vs. time graph where the<br />
maximum force appears to be nearly constant for at<br />
least three cycles. Choose Statistics and record the<br />
maximum value of the force.<br />
4. Choose Statistics for this same portion of the velocity<br />
vs. time graph and record the maximum velocity.<br />
5. Repeat Steps 2–4, gradually increasing the distance you pull the object back from the<br />
vertical, until you have at least seven data points. Your final velocity reading should be at<br />
least four times as large as your initial value.<br />
Part 2 Force vs. radius<br />
6. Measure and record the distance from the hook on the force sensor to the center of mass of<br />
the bob that swings through the photogate. This initial value of the radius should be at least<br />
0.9 m.<br />
7. Pull the bob back about 15–20° from its resting position and release it. Observe the trace on<br />
the velocity vs. time graph. In order to keep the velocity relatively constant as you vary the<br />
radius, choose some value of the velocity that appears to be easily reproducible and record<br />
this value.<br />
8. Pull the bob back as you did before and release it. When its velocity nears your target value,<br />
select a region of the force vs. time graph and record the maximum value of the force as you<br />
did in Step 3.<br />
9. Shorten the length of string connecting your mass hanger to the force sensor, measure and<br />
record the distance from the hook on the force sensor to the center of mass of the bob.<br />
Repeat Step 8.<br />
10. Continue until you have at least six data points. Your minimum radius should be less than<br />
half of your starting value.<br />
Advanced Physics with <strong>Vernier</strong> – Mechanics <strong>12B</strong> - 3
Experiment <strong>12B</strong><br />
EVALUATION OF DATA<br />
While it is possible to evaluate the data for this experiment in LabQuest App, it is easier to use<br />
Logger Pro. With LabQuest App, you should disconnect the sensors and start a new file for each<br />
part. In Logger Pro, you should disconnect the interface from the computer before starting a new<br />
file.<br />
Part 1 Force vs. velocity<br />
1. Start a new file and manually enter the data you have recorded.<br />
2. Write a statement that describes the relationship between the peak tension force acting on the<br />
object and its maximum velocity.<br />
3. If your graph of F vs. v max is not linear, take steps to modify a column so as to produce a<br />
linear relationship. When you have done so, save your file and sketch your original and then<br />
linearized graph.<br />
4. Write the equation of the line that best fits your linearized graph. Simplify the units of your<br />
slope as much as possible.<br />
Part 2 Force vs. radius<br />
5. Start a new file and manually enter the data you have recorded.<br />
6. Write a statement that describes the relationship between the peak tension force acting on the<br />
object and the radius of the arc described by the swinging object.<br />
7. If your graph of F vs. r is not linear, take steps to modify a column so as to produce a linear<br />
relationship. When you have done so, save your file and sketch your original and then<br />
linearized graph.<br />
8. Write the equation of the line that best fits your linearized graph. Simplify the units of your<br />
slope as much as possible.<br />
Part 3 Consolidation of your findings<br />
9. Prepare a summary of your analysis of data (whiteboard or chart paper) for either or both<br />
parts of the experiment, as directed by your instructor. Include the original and linearized<br />
graph and the equation of the line of best fit. Also report the system mass and the value of the<br />
parameter you held constant. In your class discussion you will compare your findings with<br />
those of other groups.<br />
10. If your linearized graphs have a relatively large vertical intercept, the relationship between<br />
the variables is not proportional. Discuss what adjustment you need to make and why this<br />
adjustment is appropriate. Open your saved files and make the necessary adjustments in<br />
order to obtain graphs depicting proportional relationships. If possible, print these graphs.<br />
11. When a quantity (in this case, net force) is a function of more than one variable, it is usually<br />
the case that the slope of the graph is related to the parameters held constant during the<br />
experiment. Examine the units of the slope of your graph of F net vs. v 2 ; simplify these to find<br />
an expression involving these parameters. How closely does the value of this expression<br />
agree with that of the slope? From what you have learned, write an equation for the net force<br />
in terms of all three variables. Confirm this by performing a similar analysis of your<br />
F net vs. 1/r graph.<br />
<strong>12B</strong> - 4<br />
Advanced Physics with <strong>Vernier</strong> - Mechanics
<strong>Centripetal</strong> <strong>Acceleration</strong><br />
12. Use what you have learned in Step 11 and Newton’s second law to write an equation for the<br />
acceleration of the object at the point in its path when the net force acts perpendicular to the<br />
object’s velocity. Use your text or a web resource to determine the meaning of the term<br />
“centripetal.”<br />
EXTENSION<br />
Wikipedia warns that the centripetal force is not to be confused with centrifugal force. It<br />
describes the latter as a fictitious or inertial force. Describe an example of such a force that you<br />
have experienced and how this interaction might better be explained in terms of centripetal force.<br />
Advanced Physics with <strong>Vernier</strong> – Mechanics <strong>12B</strong> - 5
<strong>Vernier</strong> Lab Safety Instructions Disclaimer<br />
THIS IS AN EVALUATION COPY OF THE VERNIER STUDENT LAB.<br />
This copy does not include:<br />
• Essential instructor information including discussions on how to lead students<br />
to a successful activity<br />
• Sample data<br />
• Important tips for successfully doing these labs<br />
• Answers to questions and extensions<br />
The complete Advanced Physics with <strong>Vernier</strong> – Mechanics lab manual includes 4 Introductory<br />
Activities and 19 experiments, as well as essential teacher information. The full lab book is<br />
available for purchase at: http://www.vernier.com/cmat/phys-am.html<br />
<strong>Vernier</strong> <strong>Software</strong> & <strong>Technology</strong><br />
13979 S.W. Millikan Way • Beaverton, OR 97005-2886<br />
Toll Free (888) 837-6437 • (503) 277-2299 • FAX (503) 277-2440<br />
info@vernier.com • www.vernier.com