Ambulatory Care Use - Washington State Hospital Association
Ambulatory Care Use - Washington State Hospital Association
Ambulatory Care Use - Washington State Hospital Association

Create successful ePaper yourself
Turn your PDF publications into a flip-book with our unique Google optimized e-Paper software.
September 2010<br />
Outpatient Series:<br />
<strong>Ambulatory</strong> <strong>Care</strong> <strong>Use</strong>
<strong>Washington</strong> <strong>State</strong> <strong>Hospital</strong> <strong>Association</strong><br />
<strong>Ambulatory</strong> <strong>Care</strong> <strong>Use</strong>:<br />
What Can Be Learned from Western<br />
<strong>Washington</strong><br />
Developed by WSHA’s Health Information Program<br />
For information contact:<br />
Jim Cannon, Executive Director, Health Information Program<br />
jimc@wsha.org or (206) 216-2551<br />
Jane Feldman, Director, Analytic Services, Health Information Program<br />
janef@wsha.org or (206) 216-2505<br />
September 2010
Table of Contents<br />
1. Introduction<br />
2. Geographic Classification System<br />
3. Utilization Rates: Overall, Urban, and Non-Urban<br />
4. Outpatient Utilization Trends and Utilization by <strong>Care</strong> Setting<br />
6. Regional Variation by Setting of <strong>Care</strong><br />
7. Utilization Rate Variation by Region<br />
8. Variation by Procedure: CT Scan<br />
9. Variation by Procedure: MRI and Nuclear Medicine<br />
10. Variation by Procedure: Musculoskeletal and Arthroscopy<br />
11. Variation by Procedure: Digestive System and Colonoscopy<br />
13. Conclusion<br />
Appendix 1: Methodology<br />
Appendix 2: CPT Codes<br />
Appendix 3. Data Suppliers<br />
Appendix 4. Zip Codes
Introduction<br />
WSHA <strong>Ambulatory</strong> <strong>Care</strong> Report<br />
The Outpatient Series<br />
<strong>Ambulatory</strong> care service use is growing, but data about it are in short supply. Changes in outpatient services<br />
are causing hospitals to shift resources to adapt to changing care delivery. Currently, hospitals have few tools<br />
to plan for outpatient services or determine market share. To date there has not been a reliable source for<br />
ambulatory use rates in <strong>Washington</strong> <strong>State</strong>.<br />
For several years, at the request of its members, the <strong>Washington</strong> <strong>State</strong> <strong>Hospital</strong> <strong>Association</strong>’s Health Information<br />
Program (HIP) has worked to develop sources of outpatient information. This report is a result of those<br />
efforts and summarizes the association’s first successful acquisition of ambulatory use information. Currently,<br />
there is no outpatient equivalent to the state’s inpatient data set. The association, however, was able to secure<br />
ambulatory care utilization data through a request to the Puget Sound Health Alliance. The Alliance is a regional<br />
partnership working to improve quality and efficiency of health care in five western <strong>Washington</strong> counties (King,<br />
Kitsap, Pierce, Snohomish and Thurston). Alliance members include employers, patients, health plans, physicians,<br />
hospitals, and government.<br />
This fi rst report is limited to only a portion of the state due to limitations of the data source. In the coming<br />
months, HIP will release statewide reports on outpatient use by the Medicare population and on the use of<br />
emergency department services. To ensure that future reports meet your needs, please take a few minutes to<br />
complete the six question online survey at https://www.surveymonkey.com/s/outpatientreport1.<br />
This Report<br />
For this initial report, summary information is discussed from the Alliance data set for three broad service lines:<br />
total radiology services, digestive system procedures, and musculoskeletal procedures. Within these service<br />
lines, five specific services are discussed: computed tomography (CT), magnetic resonance imaging (MRI),<br />
and nuclear medicine for radiology services, colonoscopies for digestive system procedures, and arthroscopies<br />
for musculoskeletal services. These services were selected because many of them are provided in non-hospital<br />
ambulatory settings and they represent a wide array of outpatient services. Service lines were defined by CPT<br />
code, as listed in Appendix 2.<br />
Based on the association’s request, the Alliance provided a series of detailed data reports. The claims data set<br />
used in this analysis includes all paid claims from fourteen health insurers and large, self-funded employers<br />
from January 1, 2006 through June 30, 2008. It is the only source of local information about outpatient use<br />
currently available to providers, payers, and the public. The data represent complete utilization profiles for<br />
more than two million residents of western <strong>Washington</strong>. The data set includes 2.26 million lives in 2006, 2.30<br />
million in 2007, and 2.08 million in 2008.<br />
September 2010 1
WSHA <strong>Ambulatory</strong> <strong>Care</strong> Report<br />
An important caveat must be kept in mind when examining this report’s findings. Since Medicare claims are<br />
not included in the data set, the information primarily reflects an under age 65 population. Only about five percent<br />
of the data is from people age 65 and above.<br />
Even without the Medicare population, the information is a rich resource for planning and policy purposes. It<br />
represents the first-ever analyses of local ambulatory care utilization rates and trends, and gives a much more<br />
precise and valid picture of these rates and trends than has been possible using national data sources or data<br />
from a single insurer. Further, the level of local area detail allows examination of in- and out-migration patterns<br />
for specific service lines, in both hospital-based and non-hospital outpatient care.<br />
This report includes an overview analysis of the data available. In the coming weeks, HIP will make the detailed<br />
data tables available for further analysis through the WSHA web site.<br />
Geographic Classification System<br />
Rates presented in this report are defined per 1,000 covered lives, with a reminder that these lives are almost<br />
all in the under-age 65 population. Rates are based upon the residence of the beneficiary, not where service is<br />
provided. Each ambulatory care service is linked both to the area in which it was provided and to the health<br />
service area of the patient receiving the service. Health service areas are aggregated into five regions, as illustrated<br />
in the map below. This report is limited to the five region area as a result of limitations of the data source.<br />
It focuses on these regions, though more detailed information is available by county and by sub-county areas.<br />
<strong>State</strong>wide reports from other data sources will be produced in the coming months.<br />
San<br />
Juan<br />
Whatcom<br />
Skagit<br />
Everett Region<br />
Clallam<br />
Snohomish<br />
Seattle Region<br />
Jefferson<br />
Kitsap<br />
King<br />
Tacoma Region<br />
Grays<br />
Harbor<br />
Mason<br />
Olympia Region<br />
Thurston<br />
Pierce<br />
Other Western <strong>Washington</strong><br />
Pacific<br />
Lewis<br />
September 2010 2
Findings<br />
WSHA <strong>Ambulatory</strong> <strong>Care</strong> Report<br />
Overall Rates<br />
This chart summarizes the 2008 use rates for the eight services discussed in this report. In several areas the<br />
range between highest and lowest regional rate is relatively small; it is more significant in CT scans and<br />
digestive system procedures.<br />
Utilization Rates for All <strong>Ambulatory</strong> <strong>Care</strong> Settings<br />
per 1,000 Covered Lives - 2008<br />
Western WA Lowest Regional<br />
Rate<br />
Highest Regional<br />
Rate<br />
Total Radiology 655.0 648.0 (Tacoma) 679.1 (Everett)<br />
CT Scans 81.0 67.6 (Olympia) 86.8 (Everett)<br />
MRIs 41.7 38.6 (Olympia) 46.0 (Everett)<br />
Nuclear Medicine 16.9 16.2 (Seattle) 20.0 (Tacoma)<br />
Digestive System 71.0 55.4 (Everett) 73.4 (Seattle)<br />
Colonoscopies 19.8 17.9 (Tacoma) 20.6 (Seattle)<br />
Musculoskeletal System 64.6 61.6 (Seattle) 74.2 (Olympia)<br />
Arthroscopies 1.8 1.6 (Olympia) 2.0 (Everett)<br />
Urban Rates<br />
The rates and findings presented above may be applicable to other urban regions in <strong>Washington</strong> <strong>State</strong> as the<br />
findings are based on <strong>Washington</strong> practices and may be more relevant than other estimates including the publicly<br />
available utilization estimates derived from Medicare data (such as the Dartmouth Atlas).<br />
Non-Urban Rates<br />
Currently, there is limited information available through the Alliance that relates specifically to non-urban<br />
areas. Of the four regions studied, Everett and Olympia include large non-urban areas, although the bulk of<br />
the population is concentrated in the urban area for which the region is named. However, a few key findings for<br />
non-urban areas are noteworthy:<br />
• <strong>Use</strong> rates for ambulatory care services are not dramatically different for non-urban areas compared to<br />
more urbanized areas. It should be reassuring to non-urban providers that most local residents remain<br />
local for outpatient services. For common service lines, if there is service availability, individuals tend to<br />
stay close to home.<br />
• More-urban areas have a higher percentage of hospital-based procedures than less-urban areas for the<br />
eight service lines examined in this report. This is somewhat surprising, as the local hospital is often<br />
the major service provider in non-urban areas.<br />
• There is out-migration to urban areas for more complex services, often because the service is not<br />
offered in non-urban areas.<br />
September 2010 3
Outpatient Utilization Trends<br />
WSHA <strong>Ambulatory</strong> <strong>Care</strong> Report<br />
While rates of change varied among specific service lines, all had modest increases in 2007 and considerably<br />
higher rates for the first half of 2008. This was true for annual use rates in all service lines and nearly all<br />
geographic areas. This finding was consistent across the eight service lines examined.<br />
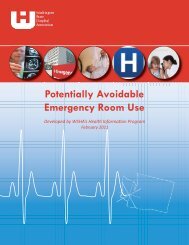
An example of the considerable increase seen in 2008 is demonstrated in the graph below. For total<br />
ambulatory radiology, there was a slight increase observed in 2007 (up 2.6 percent from 2006 use rates),<br />
followed by a much larger increase in the first half of 2008 (where use rates were 16.1 percent higher than in<br />
2007). <strong>Use</strong> rates for selected ambulatory surgical procedures also increased over time, but the increases were<br />
not as large as for radiology. This finding is consistent with national data showing hospitals gaining market<br />
share in diagnostic imaging, especially MRIs. One study of Medicare claims data showed a tripling of MRI<br />
procedures between 1995 and 2005. The study also found CT procedures more than doubled over the same<br />
time period.<br />
Rate per 1,000 Covered Lives<br />
680<br />
660<br />
640<br />
620<br />
600<br />
580<br />
560<br />
540<br />
520<br />
500<br />
480<br />
Total <strong>Ambulatory</strong> <strong>Care</strong> Radiology <strong>Use</strong> Rate<br />
Change Over Time - Puget Sound Region<br />
2006 2007 2008 (est.)<br />
Outpatient Utilization by Setting of <strong>Care</strong><br />
In the Western <strong>Washington</strong> area, more outpatient care in the services examined is being provided in hospitals<br />
than in non-hospital settings. The one exception is colonoscopies where more services were provided in<br />
non-hospital settings. Some regional exceptions to this finding are probably based on service capacity. The<br />
chart on the next page summarizes the 2008 distribution of hospital versus non-hospital settings by service line.<br />
These findings appear to be very stable over time.<br />
September 2010 4
WSHA <strong>Ambulatory</strong> <strong>Care</strong> Report<br />
<strong>Ambulatory</strong> Utilization Rates by Service Line, Setting, and Year<br />
Procedures per 1,000 covered lives (under 65 population) - total Western <strong>Washington</strong><br />
Service Line 2006 2007 Estimated 2008<br />
<strong>Hospital</strong><br />
Nonhospital<br />
Total <strong>Hospital</strong> Nonhospital<br />
Total <strong>Hospital</strong> Nonhospital<br />
Musculoskeletal 29.39 28.31 57.52 29.89 28.22 58.11 34.76 29.81 64.57<br />
System<br />
Arthroscopies 0.82 0.66 1.48 0.79 0.75 1.54 1.02 0.77 1.79<br />
Digestive System 42.44 18.46 60.91 44.09 19.52 63.61 48.83 22.17 71<br />
Colonoscopies 6.87 9.56 16.42 6.94 10.46 17.41 7.85 11.91 19.76<br />
Total Radiology 361.68 188.16 549.85 371.25 192.93 564.18 440.97 214.02 654.99<br />
CT Scans 54.74 11.07 65.81 57.84 11.75 69.59 68.24 12.8 81.04<br />
MRIs 21.04 14.25 35.3 21.43 15.04 36.47 25.12 16.54 41.66<br />
Nuclear Medicine 11.48 3.53 15.01 11.42 3.74 15.16 12.82 4.1 16.92<br />
Total<br />
The split between hospital and non-hospital use rates varies by type of procedure. Almost half (46 percent) of<br />
all ambulatory care musculoskeletal procedures are performed in non-hospital settings, while more than two<br />
thirds of ambulatory care digestive system procedures are performed in hospitals. The chart above presents<br />
rates over time and by setting for specific service lines.<br />
The complexity and capital demands of a procedure appear to factor into the setting where a procedure is<br />
performed. While the bulk of digestive system procedures are performed in hospital-based settings,<br />
colonoscopies, a relatively simple procedure with low capital requirements, were more likely to occur in nonhospital<br />
settings. Conversely, the majority of radiology services were provided in hospital-based settings,<br />
particularly for the services requiring high cost radiology equipment such as CT or MRI.<br />
Three radiology service lines (CT scans, MRIs, and nuclear medicine) account for about 24 percent of the<br />
hospital-based total radiology services. These three service lines make up only 15 percent of the total nonhospital<br />
ambulatory radiology services, where less capital-intensive radiology services (simple x-rays, for<br />
example) are the bulk of radiology services performed. While this finding is expected, the number of<br />
capital-intensive services performed in non-hospital settings is somewhat surprising.<br />
September 2010 5
WSHA <strong>Ambulatory</strong> <strong>Care</strong> Report<br />
90%<br />
Percent of <strong>Ambulatory</strong> <strong>Care</strong> Procedures That Were <strong>Hospital</strong> Based - 2008<br />
80%<br />
70%<br />
60%<br />
50%<br />
40%<br />
30%<br />
20%<br />
10%<br />
0%<br />
Total Radiology CT Scans MRIs<br />
Nuclear<br />
Medicine<br />
Musculoskeleta<br />
l System<br />
Arthroscopies<br />
Digestive<br />
System<br />
Colonoscopies<br />
Percent 67% 84% 60% 76% 54% 57% 69% 40%<br />
Differences in percentage of services by setting can be seen graphically on the chart above. The data graphed<br />
are for 2008, but there was almost no change over time in these hospital-based percentages.<br />
Regional Variation by Setting of <strong>Care</strong><br />
While there was consistency over time in percent of procedures performed in a hospital versus a non-hospital<br />
setting, there was considerable variation among regions. More urbanized areas had a higher percentage of<br />
hospital based procedures.<br />
90%<br />
Percent of <strong>Ambulatory</strong> <strong>Care</strong> Procedures Which Were <strong>Hospital</strong>-Based - by Region, 2006<br />
80%<br />
70%<br />
60%<br />
50%<br />
40%<br />
30%<br />
20%<br />
10%<br />
0%<br />
Total Radiology CT Scans MRIs Nuclear<br />
Medicine<br />
Musculoskeletal<br />
System<br />
Arthroscopies Digestive System Colonoscopies<br />
Overall Everett Olympia Seattle Tacoma<br />
September 2010 6
Utilization Rate Variation by Region<br />
WSHA <strong>Ambulatory</strong> <strong>Care</strong> Report<br />
Across all regions, the use of ambulatory services is increasing. However, use rates varied among regions.<br />
For radiology services, regional variation has increased between 2006 and 2008. In 2006, minimal variation<br />
existed in CT procedures, MRI or nuclear medicine.<br />
• For CT procedures in 2008, the Olympia region use rate was 16 percent lower than the overall average,<br />
and 22 percent lower than the Everett and Tacoma regions.<br />
• The Everett region’s MRI use rate was 10 percent higher than the average and 18 percent higher than the<br />
Olympia and Tacoma regions in 2008.<br />
• The Tacoma region’s use of nuclear medicine for 2008 was 18 percent higher than the overall average and<br />
23 percent higher than the Seattle region.<br />
In surgical procedures, regional variation appeared across time and procedures.<br />
• In 2006, the Olympia musculoskeletal procedures rate was 30 percent higher than the overall average,<br />
and the variation remained fairly consistent over the two year period.<br />
• The Everett region had a 12 percent higher than average use rate of arthroscopy procedures. The region’s<br />
use rate was 25 percent higher than the Olympia region.<br />
• In 2008, the use rate for digestive system procedures in Seattle was 32 percent higher than in Everett and<br />
15 percent higher than in Olympia or Tacoma.<br />
A number of factors could account for this variation, including the opening of new facilities or differences in<br />
availability of a service in a region.<br />
Patient Migration Analysis - Sample<br />
One of the strengths of these data is the ability to extract detailed information on patient migration across areas.<br />
Patient migration would show where the patients from a given geographic area go to receive services. One<br />
example, using Pierce County, is shown below. For 2007, only two thirds of Pierce County residents received<br />
outpatient radiology in Pierce County.<br />
Where Tacoma Health Service Area Residents<br />
Dispersion of <strong>Ambulatory</strong> <strong>Care</strong> Radiology Services<br />
Received<br />
Tacoma<br />
<strong>Ambulatory</strong><br />
Health Service<br />
<strong>Care</strong><br />
Area<br />
Radiology<br />
Residents<br />
Services<br />
- 2007<br />
- 2007<br />
3%<br />
3% 3% 6%<br />
4%<br />
14%<br />
67%<br />
Tacoma<br />
Federal Way<br />
Puyallup<br />
Seattle North<br />
Seattle Central<br />
Olympia<br />
All Other<br />
September 2010 7
WSHA <strong>Ambulatory</strong> <strong>Care</strong> Report<br />
Of the out-migrants, the most common destination was the Federal Way health service area, with the remainder<br />
spread among destinations east, north, and south. Referral patterns for the two large health systems based in<br />
the Tacoma region may be driving some of the observed out-migration, particularly to the Federal Way and<br />
Puyallup health service areas. The above analysis also demonstrates the artificiality of county boundaries in<br />
defining and evaluating patient migration patterns for receiving health services.<br />
The Health Information Program can use the Alliance reports to create many permutations of this type of<br />
analysis − information can be varied by year, service line, procedure, hospital-based versus non-hospital<br />
settings, and health service area source and destination. The many options result in a very large number of<br />
in- and out-migration analyses − a number far too large for inclusion in this overview. The example on the<br />
previous page, however, is an indication of the unique power of the resource, providing an unprecedented<br />
ability look at ambulatory care utilization patterns in western <strong>Washington</strong>. Similar analysis can be created using<br />
the detailed data tables that will be available to members in the coming weeks.<br />
Variation by Procedure<br />
Radiology<br />
CT Procedures<br />
There was minimal variation in outpatient computerized tomography (CT) scan utilization rates among regions<br />
in 2006, but by 2008 there was noticeable variation, especially in the Olympia region, where the use rate was 16<br />
percent lower than the overall average and 22 percent lower than the Everett and Tacoma regions. The slower<br />
growth in the Olympia region may be due to capacity constraints or other local factors. The other regions all<br />
have similar use rates and similar growth patterns, suggesting the overall rate is the best one to use for planning.<br />
<strong>Ambulatory</strong> <strong>Care</strong> CT Scan Utilization Rates<br />
Variation by Region Over Time<br />
Rate per 1,000 Covered Lives<br />
100<br />
90<br />
80<br />
70<br />
60<br />
50<br />
40<br />
30<br />
20<br />
10<br />
0<br />
2006 2007 2008 (est)<br />
Overall<br />
Everett<br />
Olympia<br />
Seattle<br />
Tacoma<br />
September 2010 8
WSHA <strong>Ambulatory</strong> <strong>Care</strong> Report<br />
MRI Procedures<br />
Again there was minimal variation in outpatient medical resonance imaging (MRI) utilization rates among<br />
regions in 2006, by 2008 there was noticeable variation, especially the Everett region, where the use rate was<br />
ten percent higher than the overall average and 18 percent higher than the Olympia and Tacoma regions.<br />
Rate per 1,000 Covered Lives<br />
50<br />
45<br />
40<br />
35<br />
30<br />
25<br />
20<br />
15<br />
10<br />
5<br />
0<br />
<strong>Ambulatory</strong> <strong>Care</strong> MRI Utilization Rates<br />
Variation by Region Over Time<br />
2006 2007 2008 (est)<br />
Overall<br />
Everett<br />
Olympia<br />
Seattle<br />
Tacoma<br />
Nuclear Medicine Procedures<br />
Some variation in outpatient nuclear medicine utilization rates was observed among regions, but the relatively<br />
small number of procedures makes this variation appear larger than it actually is. By 2008, the Tacoma region<br />
use rate was 18 percent higher than the overall average and 23 percent higher than the Seattle region. This<br />
faster growth in the Tacoma region may be due to the opening of a new facility in the region.<br />
25<br />
<strong>Ambulatory</strong> <strong>Care</strong> <strong>Care</strong> Nuclear MedicineUtilization Utilitzation Rates<br />
Variation by Region Over Time<br />
Rate per 1,000 Covered Lives<br />
20<br />
15<br />
10<br />
5<br />
Overall<br />
Everett<br />
Olympia<br />
Seattle<br />
Tacoma<br />
0<br />
2006 2007 2008 (est)<br />
September 2010 9
Surgical<br />
WSHA <strong>Ambulatory</strong> <strong>Care</strong> Report<br />
Musculoskeletal Procedures (tendon repairs, dislocations, fracture repair, etc.)<br />
Noticeable variation in outpatient musculoskeletal procedure utilization was observed among regions,<br />
particularly for the Olympia region. In 2006, the Olympia use rate was 30 percent higher than the overall<br />
average and 39 percent higher than the Seattle region. There was virtually no growth in the Olympia region rate<br />
over the three year, however, and by 2008 growth in the other regions had somewhat reduced the variation.<br />
Rate per 1,000 Covered Lives<br />
80<br />
70<br />
60<br />
50<br />
40<br />
30<br />
20<br />
10<br />
0<br />
<strong>Ambulatory</strong> <strong>Care</strong> Musculoskeletal Procedure Rates<br />
Variation by Region Over Time<br />
2006 2007 2008 (est)<br />
Overall<br />
Everett<br />
Olympia<br />
Seattle<br />
Tacoma<br />
Outpatient Arthroscopy Procedures<br />
The utilization rate per 1,000 covered lives for outpatient arthroscopy is much smaller than for the other service<br />
lines, but there were still more than 3,500 procedures in the study area each year. This means the data are<br />
reliable. As seen in the graph, there is variation among the regions in the use rate, particularly for the<br />
Everett region. In 2008, the Everett region use rate was 12 percent higher than the overall average and 25<br />
percent higher than the use rate for arthroscopy procedures in Olympia.<br />
2.5<br />
<strong>Ambulatory</strong> <strong>Care</strong> Arthroscopic Procedure Rates<br />
Variation by Region Over Time<br />
Rate per 1,000 Covered Lives<br />
2.0<br />
1.5<br />
1.0<br />
0.5<br />
Overall<br />
Everett<br />
Olympia<br />
Seattle<br />
Tacoma<br />
0.0<br />
2006 2007 2008 (est)<br />
September 2010 10
WSHA <strong>Ambulatory</strong> <strong>Care</strong> Report<br />
Outpatient Digestive System Procedures<br />
(esophagus or stomach endoscopy, gallbladder removal, etc.)<br />
Notable regional variation in outpatient digestive system procedure utilization rates was observed, particularly<br />
for Olympia in the first two years and for Seattle and Everett in 2008. In 2008, the use rate in Seattle was 32<br />
percent higher than in Everett and 15 percent higher than in Olympia or Tacoma. The marked reduction in the<br />
Everett region for 2008 is worth further investigation. It is also interesting to note the degree to which the much<br />
larger population in the Seattle region influences the overall average, as seen clearly in the 2008 data.<br />
Rate per 1,000 Covered Lives<br />
80<br />
70<br />
60<br />
50<br />
40<br />
30<br />
20<br />
10<br />
0<br />
<strong>Ambulatory</strong> <strong>Care</strong> Digestive System Procedure Rates<br />
Variation by Region Over Time<br />
2006 2007 2008 (est)<br />
Overall<br />
Everett<br />
Olympia<br />
Seattle<br />
Tacoma<br />
Colonoscopy Procedures<br />
There was steady growth in the use rate over time for all regions, but there was some variation in 2006<br />
colonoscopy rates among regions. Over time, the rates for regions converged. By the first half of 2008 there<br />
was only minor observed variation.<br />
25<br />
<strong>Ambulatory</strong> <strong>Care</strong> Colonoscopy Procedure Rates<br />
Variation by Region Over Time<br />
Rate per 1,000 Covered Lives<br />
20<br />
15<br />
10<br />
5<br />
Overall<br />
Everett<br />
Olympia<br />
Seattle<br />
Tacoma<br />
0<br />
2006 2007 2008 (est)<br />
September 2010 11
WSHA <strong>Ambulatory</strong> <strong>Care</strong> Report<br />
Even where there does not appear to be much regional variation, such as for colonoscopies in 2007, the<br />
underlying data often reveal considerable differences in the setting of care, as illustrated below. This chart<br />
shows hospital-based and non-hospital outpatient utilization rates for colonoscopy procedures. In 2007, nearly<br />
half of the outpatient colonoscopies in the Everett region were hospital-based, compared to only 25 percent in<br />
the Olympia region. (Seattle had 42 percent hospital-based, and Tacoma had 36 percent hospital-based.) These<br />
variations probably reflect the differences in regional service capability.<br />
Rate per 1,000 Covered Lives<br />
20<br />
15<br />
10<br />
5<br />
0<br />
Outpatient Colonoscopy Procedure Rates 2007<br />
Highlighting the Differences in Setting by Region<br />
Everett Olympia Seattle Tacoma<br />
<strong>Hospital</strong>-based<br />
Non-<strong>Hospital</strong><br />
September 2010 12
Conclusion<br />
WSHA <strong>Ambulatory</strong> <strong>Care</strong> Report<br />
This report is the first opportunity HIP has had to analyze outpatient data. The <strong>Washington</strong> <strong>State</strong> <strong>Hospital</strong><br />
<strong>Association</strong> is continuing to develop additional resources for outpatient information. In the coming months,<br />
statewide reports on outpatient services use by the Medicare population and an analysis of emergency department<br />
use will be published. We hope the analysis presented here is a strong first step into helping members<br />
understand how the residence of <strong>Washington</strong> are using ambulatory services and provides a powerful tool to plan<br />
for the future.<br />
Detailed data tables for each of the service lines will be made available to members in the coming weeks on the<br />
WSHA web site. For more information about the findings presented in this report, please contact Jim Cannon,<br />
executive director of the Health Information Program, at (206) 216-2551 or via e-mail at jimc@wsha.org. For<br />
technical assistance, please contact Jane Feldman, director of analytic services, at (206) 216-2505 or janef@<br />
wsha.org.<br />
Jim Cannon<br />
Executive Director, Health Information Program<br />
<strong>Washington</strong> <strong>State</strong> <strong>Hospital</strong> <strong>Association</strong><br />
Jane Feldman<br />
Director, Analytic Services, Health Information Program<br />
<strong>Washington</strong> <strong>State</strong> <strong>Hospital</strong> <strong>Association</strong><br />
Special thanks to Thom Rees and Beth Zborowski for their work in the production of this report.<br />
September 2010 13
Appendix 1: Methodology<br />
WSHA <strong>Ambulatory</strong> <strong>Care</strong> Report<br />
The information in this report is extracted from a set of outpatient utilization reports prepared earlier this<br />
year by the Puget Sound Health Alliance. The Alliance’s reports were done at the request of the <strong>Washington</strong><br />
<strong>State</strong> <strong>Hospital</strong> <strong>Association</strong>’s Health Information Program. The outpatient reports were derived from the Alliance’s<br />
comprehensive claims database of all paid claims from over two million residents of western <strong>Washington</strong>,<br />
representing the claims from the 14 data suppliers (insurers and self-funded employers and trusts — see<br />
Appendix 3).<br />
The Alliance reports consist of detailed counts of ambulatory care services for eight service lines (defined by<br />
ranges of CPT codes), indicating how many services or procedures were delivered each year in 30 health service<br />
areas to residents of the 30 different health service areas. The result — for each year and service line — was a<br />
30 by 30 grid of the count of services in each cell, separated into whether the service was delivered in a hospitalbased<br />
or non-hospital setting. For example, one cell of the colonoscopy table for 2007 would include the number<br />
of procedures performed in Central Seattle for residents of Bellingham, split into counts of hospital-based and<br />
non-hospital procedures.<br />
For any cell with fewer than ten observations in either setting category, the Alliance suppressed the data count in<br />
order to preserve patient anonymity. The suppressed data are included in the Western <strong>Washington</strong> aggregate totals<br />
for that year and service line. For all years and all service lines except arthroscopy, the suppressed data accounted<br />
for less than 0.1 percent of the totals, meaning the rates calculated overall and by region are essentially unaffected<br />
by data suppression. Due to the small number of arthroscopies, data suppression for this service line was about<br />
one percent of the total in 2006 and 2007. For the half year of 2008, data suppression accounted for 2.5 percent<br />
of the hospital-based services and 5.3 percent of the non-hospital services, for an overall 3.7 percent data suppression<br />
for arthroscopies for the first half of 2008. This means that the actual rates of ambulatory care arthroscopies<br />
are slightly understated at the regional level, especially for the first half of 2008.<br />
September 2010 14
Appendix 2: CPT Codes<br />
WSHA <strong>Ambulatory</strong> <strong>Care</strong> Report<br />
Description<br />
<strong>Ambulatory</strong> <strong>Care</strong> Outpatient Reports<br />
Puget Sound Health Alliance - CPT Codes in Each Service Line<br />
CPT-4 Code<br />
Ranges<br />
Description<br />
CPT-4 Code<br />
Ranges<br />
Description<br />
CPT-4 Code<br />
Ranges<br />
Musculoskeletal<br />
System<br />
20000-29999 Radiology 70010-79999 CT Scans 70450<br />
70460<br />
Arthroscopy 29805-29807 Nuclear 78000-79999 70470<br />
29819 Medicine<br />
70480-70482<br />
29820 MRI 70336 70486<br />
29822-29827 70540 70487<br />
29834 70543-70545 70490<br />
29835 70547 70491<br />
29837 70548 70492<br />
29838 70551-70553 70496<br />
29846 71550 70498<br />
29848 71555 71250<br />
29862 72141 71260<br />
29863 72142 71270<br />
29870 72146 71275<br />
29873-29384 72148 72125<br />
29886-29888 72149 72126<br />
29891 72156-72158 72128<br />
29895 72195-72197 72129<br />
29897 73218 72131<br />
29898 73220-73223 72132<br />
Digestive System 40490-49999 73718 72191-72194<br />
73720 73200<br />
Colonscopy 44388 73721-73723 73202<br />
74181-74183 73700<br />
44394 74185 73701<br />
45378 75554 73702<br />
45380 75556 74150<br />
45381 76094 74160<br />
45383 76393 74170<br />
45384 76400 74175<br />
45385 75635<br />
45391 76070<br />
45392 76360<br />
76370<br />
76376<br />
76380<br />
September 2010 15
Appendix 3: Data Suppliers<br />
WSHA <strong>Ambulatory</strong> <strong>Care</strong> Report<br />
<strong>Ambulatory</strong> <strong>Care</strong> Outpatient Reports<br />
Puget Sound Health Alliance - Data Sources<br />
2006 2007 2008<br />
1. Carpenters Trust X X X<br />
2. Community Health Plan X X X<br />
3. City of Seattle X X X<br />
4. DSHS - Medicaid Fee-for-Service X X X<br />
5. First Choice Health Plan X X X<br />
6. Group Health Cooperative X X X<br />
7. Health <strong>Care</strong> Authority - UMP X X X<br />
8. King County X X X<br />
9. Molina Health <strong>Care</strong> X X X<br />
10. Premera X X X<br />
11. REI X X X<br />
12. Retail Drugs Trust X X X<br />
13. Snohomish County X X X<br />
14. Teamsters Trust X X X<br />
September 2010 16
Appendix 4: Zip Codes<br />
WSHA <strong>Ambulatory</strong> <strong>Care</strong> Report<br />
Puget Sound Health Alliance - Regions<br />
Dartmouth Atlas Zip Code Definitions<br />
Everett Region<br />
Health<br />
Service Area<br />
Anacortes<br />
10 Zip Codes<br />
Arlington<br />
3 Zip codes<br />
Coupeville<br />
7 Zip Codes<br />
Everett<br />
16 Zip Codes<br />
Zip<br />
Code<br />
98221<br />
98222<br />
98243<br />
98245<br />
98250<br />
98261<br />
98279<br />
98280<br />
98286<br />
98297<br />
98223<br />
98241<br />
98259<br />
98236<br />
98239<br />
98249<br />
98253<br />
98260<br />
98277<br />
98278<br />
98201<br />
98203<br />
98204<br />
98205<br />
98206<br />
Monroe<br />
7 Zip Codes<br />
Mount Vernon<br />
16 Zip Codes<br />
Olympia Region<br />
Health<br />
Service Area<br />
Centralia<br />
17 Zip Codes<br />
98224<br />
98251<br />
98256<br />
98272<br />
98288<br />
98293<br />
98294<br />
98232<br />
98233<br />
98235<br />
98237<br />
98238<br />
98255<br />
98257<br />
98263<br />
98267<br />
98273<br />
98274<br />
98282<br />
98283<br />
98284<br />
98287<br />
98292<br />
Zip<br />
Code<br />
98522<br />
98531<br />
Morton<br />
4 Zip Codes<br />
Olympia<br />
25 Zip Codes<br />
98336<br />
98356<br />
98361<br />
98377<br />
98501<br />
98502<br />
98503<br />
98504<br />
98505<br />
98506<br />
98507<br />
98508<br />
98509<br />
98511<br />
98512<br />
98513<br />
98516<br />
98530<br />
98540<br />
98541<br />
98556<br />
98557<br />
98559<br />
98576<br />
98579<br />
98583<br />
98589<br />
98597<br />
Seattle Region<br />
Health Service<br />
Area<br />
Aberdeen<br />
18 Zip Codes<br />
May be reclassified<br />
into other<br />
western<br />
<strong>Washington</strong><br />
(rural)<br />
Auburn<br />
4 Zip codes<br />
Bellevue<br />
18 Zip Codes<br />
Zip<br />
Code<br />
98520<br />
98526<br />
98535<br />
98536<br />
98537<br />
98547<br />
98550<br />
98552<br />
98560<br />
98562<br />
98563<br />
98566<br />
98569<br />
98571<br />
98575<br />
98587<br />
98590<br />
98595<br />
98001<br />
98002<br />
98047<br />
98071<br />
98004<br />
98005<br />
98006<br />
98207<br />
98532<br />
98599<br />
98007<br />
98208<br />
98213<br />
98533<br />
98538<br />
Shelton<br />
4 Zip Codes<br />
98548<br />
98555<br />
98008<br />
98009<br />
98252<br />
98539<br />
98584<br />
98014<br />
98258<br />
98542<br />
98592<br />
98015<br />
98270<br />
98271<br />
98544<br />
98564<br />
South Bend<br />
5 Zip Codes<br />
98527<br />
98554<br />
98024<br />
98027<br />
98275<br />
98565<br />
98561<br />
98029<br />
98290<br />
98568<br />
98577<br />
98039<br />
98291<br />
98570<br />
98586<br />
98045<br />
98296<br />
98572<br />
98050<br />
98582<br />
98053<br />
98585<br />
98065<br />
98591<br />
98074<br />
September 2010<br />
98596<br />
98075
Appendix 4: Zip Codes Continued<br />
WSHA <strong>Ambulatory</strong> <strong>Care</strong> Report<br />
Bellingham<br />
18 Zip Codes<br />
May be<br />
reclassified<br />
into other<br />
western<br />
<strong>Washington</strong><br />
(rural)<br />
Bremerton<br />
27 Zip Codes<br />
May be reclassified<br />
into other<br />
Western<br />
<strong>Washington</strong><br />
(rural)<br />
98220<br />
98225<br />
98226<br />
98227<br />
98228<br />
98229<br />
98230<br />
98231<br />
98240<br />
98244<br />
98247<br />
98248<br />
98262<br />
98264<br />
98266<br />
98276<br />
98281<br />
98295<br />
98310<br />
98311<br />
98312<br />
98314<br />
98315<br />
98322<br />
98337<br />
98340<br />
98342<br />
98345<br />
98346<br />
98353<br />
98364<br />
98366<br />
98367<br />
98370<br />
98378<br />
98380<br />
98383<br />
98384<br />
98386<br />
98392<br />
98393<br />
98524<br />
98528<br />
98546<br />
98588<br />
Edmonds<br />
7 Zip Codes<br />
Enumclaw<br />
4 Zip Codes<br />
Federal Way<br />
5 Zip Codes<br />
Forks<br />
3 Zip Codes<br />
May be<br />
reclassified<br />
Kirkland<br />
8 Zip Codes<br />
Port Angeles<br />
8 Zip Codes<br />
May be<br />
reclassified<br />
into other<br />
Western<br />
<strong>Washington</strong><br />
(rural)<br />
Port Townsend<br />
7 Zip Codes<br />
May be<br />
reclassified<br />
into other<br />
western<br />
<strong>Washington</strong><br />
(rural)<br />
98020<br />
98026<br />
98036<br />
98037<br />
98043<br />
98046<br />
98087<br />
98010<br />
98022<br />
98051<br />
98092<br />
98003<br />
98023<br />
98054<br />
98063<br />
98093<br />
98305<br />
98331<br />
98350<br />
98019<br />
98033<br />
98034<br />
98052<br />
98072<br />
98073<br />
98077<br />
98083<br />
98324<br />
98326<br />
98343<br />
98357<br />
98362<br />
98363<br />
98381<br />
98382<br />
98320<br />
98325<br />
98339<br />
98358<br />
98365<br />
98368<br />
98376<br />
Renton<br />
13 Zip Codes<br />
Seattle Central<br />
33 Zip Codes<br />
98025<br />
98030<br />
98031<br />
98035<br />
98038<br />
98042<br />
98055<br />
98056<br />
98057<br />
98058<br />
98059<br />
98064<br />
98089<br />
98040<br />
98061<br />
98101<br />
98102<br />
98104<br />
98106<br />
98108<br />
98109<br />
98110<br />
98114<br />
98116<br />
98118<br />
98119<br />
98121<br />
98122<br />
98124<br />
98126<br />
98129<br />
98134<br />
98136<br />
98139<br />
98141<br />
98144<br />
98154<br />
98161<br />
98164<br />
98170<br />
98174<br />
98181<br />
98184<br />
98191<br />
98194<br />
Seattle North<br />
24 Zip Codes<br />
Seattle South<br />
19 Zip Codes<br />
98011<br />
98012<br />
98021<br />
98028<br />
98041<br />
98082<br />
98103<br />
98105<br />
98107<br />
98111<br />
98112<br />
98115<br />
98117<br />
98125<br />
98127<br />
98133<br />
98145<br />
98155<br />
98160<br />
98165<br />
98175<br />
98177<br />
98185<br />
98195<br />
98013<br />
98032<br />
98062<br />
98070<br />
98113<br />
98131<br />
98132<br />
98138<br />
98146<br />
98148<br />
98151<br />
98158<br />
98166<br />
98168<br />
98171<br />
98178<br />
98188<br />
98190<br />
98198<br />
98199<br />
September 2010 18
Appendix 4: Zip Codes Continued<br />
WSHA <strong>Ambulatory</strong> <strong>Care</strong> Report<br />
Tacoma Region<br />
Health Service<br />
Area<br />
Zip<br />
Code<br />
Tacoma<br />
49 Zip Codes<br />
98327<br />
98354<br />
98387<br />
98445<br />
98447<br />
98450<br />
Puyallup<br />
23 Zip codes<br />
98304<br />
98321<br />
98388<br />
98401<br />
98455<br />
98460<br />
98323<br />
98402<br />
98464<br />
98328<br />
98403<br />
98465<br />
98330<br />
98404<br />
98466<br />
98338<br />
98405<br />
98467<br />
98344<br />
98406<br />
98471<br />
98348<br />
98407<br />
98477<br />
98352<br />
98408<br />
98481<br />
98355<br />
98409<br />
98492<br />
98360<br />
98411<br />
98493<br />
98371<br />
98412<br />
98497<br />
98372<br />
98413<br />
98498<br />
98373<br />
98415<br />
98499<br />
98374<br />
98416<br />
98558<br />
98375<br />
98418<br />
98580<br />
98385<br />
98421<br />
412 Zip Codes Defined<br />
98390<br />
98422<br />
98391<br />
98424<br />
98396<br />
98430<br />
98397<br />
98431<br />
98398<br />
98433<br />
98446<br />
98438<br />
Gig Harbor<br />
10 Zip Codes<br />
98303<br />
98329<br />
98439<br />
98442<br />
98332<br />
98443<br />
98333<br />
98444<br />
98335<br />
98349<br />
98351<br />
98359<br />
98394<br />
98395<br />
September 2010 19