FAST GC AND GC-MS ANALYSIS OF EXPLOSIVES
FAST GC AND GC-MS ANALYSIS OF EXPLOSIVES
FAST GC AND GC-MS ANALYSIS OF EXPLOSIVES

You also want an ePaper? Increase the reach of your titles
YUMPU automatically turns print PDFs into web optimized ePapers that Google loves.
Peet trool<br />
lleeuum & Cooaal ll<br />
IISSN 1337-7027<br />
Available online at www.vurup.sk/pc<br />
Petroleum & Coal 49 (2), 72-79, 2007<br />
<strong>FAST</strong> <strong>GC</strong> <strong>AND</strong> <strong>GC</strong>-<strong>MS</strong> <strong>ANALYSIS</strong> <strong>OF</strong> <strong>EXPLOSIVES</strong><br />
Michal Kirchner, Eva Matisová * , Svetlana Hrouzková, Renáta Húšková<br />
Institute of Analytical Chemistry, Faculty of Chemical and Food<br />
Technology, Slovak University of Technology, Radlinského 9, Bratislava<br />
812 37, Slovak Republic. michal.kirchner@gmail.com, eva.matisova@stuba.sk,<br />
svetlana.hrouzkova@stuba.sk, renata.huskova@stuba.sk<br />
Received April 2, 2007 accepted June 12, 2007<br />
Abstract<br />
In this paper fast <strong>GC</strong>-ECD and <strong>GC</strong>-<strong>MS</strong> utilizing short narrow-bore capillary columns was evaluated for separation<br />
and detection of selected explosives. For injection splitless and on-column inlets were tested. In the case of <strong>MS</strong><br />
detection different energies of electrons were tested in order to improve detectability of analyzed compounds. To<br />
eliminate strong adsorption of difficult explosives analyte protectants, formerly developed for <strong>GC</strong> analysis of<br />
pesticide residues, were tested. Significant improvements of peak shapes, linearity of responses and LODs were<br />
reached.<br />
Keywords: explosives, fast gas chromatography, fast <strong>GC</strong>-<strong>MS</strong>, analyte protectants, matrix effects<br />
1. Introduction<br />
High explosives encountered in the forensic laboratory may be either pure or nearly pure<br />
compounds: nitroaromatics, nitrate esters, nitramines, or mixtures of these with or without other<br />
ingredients [1] . Gas chromatography (<strong>GC</strong>) methods with the advantage of a high resolving power are<br />
important to the trace analysis of explosives [2] . The highly efficient <strong>GC</strong> separation with the capillary<br />
columns permits the analysis of explosive oils, isomers of nitroaromatics and the high explosive<br />
pentaerythritol tetranitrate (PETN) and hexogen (RDX) in one run [3] .<br />
The importance of <strong>GC</strong> and also the distinct advantage over capillary electrophoresis and highperformance<br />
liquid chromatography is based on its compatibility with different detectors, rewieved by<br />
Yinon and Zitrin [4] and also by D.S. Moore [5] . <strong>GC</strong> can be interfaced the flame-ionization detector (FID),<br />
mass spectrometer (<strong>MS</strong>), nitrogen-phosphorus detector (NPD), electron capture detector (ECD) and<br />
thermal energy analyzer (TEA). The most selective detector for explosives is the TEA, which detects<br />
only compounds that produce NO and NO 2 . The NPD is less selective than the TEA, but insensitive to<br />
nitrate esters. The ECD is less selective, but is more sensitive for nitroaromatics than the TEA or<br />
NPD [6,7,8] .<br />
Mass spectroscopic techniques have received perhaps the most extensive study for the detection<br />
of explosives. A mass spectrometer separates materials according to the mass to charge ratio of the<br />
parent ion and its fragments [5] . <strong>GC</strong>-<strong>MS</strong> with temperature-programmed injector was used by Yinon also<br />
for some thermally labile explosives [9] . Detailed study of injector conditions and extraction solvents on<br />
the detectability of nitroaromatic compounds was realised by Emmrich [10] . It was demonstrated that<br />
the packing material of the liner strongly influences the detectability of trinitrotoluene isomers.<br />
As HMX and tetryl is difficult to analyze due to the thermal decomposition or the <strong>MS</strong> fragmentation<br />
is not sufficient for positive identification, the gas chromatography- tandem mass spectrometry (<strong>GC</strong>-<br />
<strong>MS</strong>/<strong>MS</strong>) can improve the selectivity and sensitivity by improving the differentiation of the target<br />
compounds from interfering and co-eluting compounds and reducing the background noise within an<br />
explosive debris sample [11,12] .<br />
Utilization of fast gas chromatography (fast <strong>GC</strong>) with narrow-bore capillary columns is<br />
advantageous for the use in routine laboratories due to the higher sample throughput, the same and<br />
even higher separation efficiency than conventional capillary <strong>GC</strong>, higher sensitivity and/or precision<br />
and simultaneous reduction of operating costs of a <strong>GC</strong> analysis [13,14] .
Michal Kirchner et al./Petroleum & Coal 49(2) 72-79 (2007) 73<br />
The aim of this work was to study possibilities to reduce thermal decomposition and/or elimination<br />
of adsorption of selected explosives in order to improve quantitative data utilizing fast <strong>GC</strong> with narrowbore<br />
capillary columns.<br />
2. Experimental<br />
All measurements were performed on narrow-bore capillary column CP-Sil 8 CB/Low Bleed – <strong>MS</strong>,<br />
5 m long, I.D. 0.15 mm, film thickness 0.15 µm (Varian, Middelburg, The Netherlands) with 5 %<br />
diphenyl 95 % dimethylsiloxane stationary phase. Column was coupled to 1 m long retention gap, I.D.<br />
0.32 mm with non-polar deactivation (Supelco, Bellefonte, USA) via press fit connector and sealed<br />
with polyimide resin (Supelco, Bellefonte, USA).<br />
<strong>GC</strong>–<strong>MS</strong> measurements were performed on an Agilent 6890N <strong>GC</strong> coupled to 5973 <strong>MS</strong>D (Agilent<br />
Technologies, Avondale, PA, USA) equipped with PTV and autoinjector Agilent 7683. <strong>MS</strong> with<br />
electron impact ionization (EI) mode (70 eV) was operated in Full Scan and SIM mode; for each<br />
explosive two specific ions were selected (table I) and sorted into groups; the used dwell time was 10<br />
ms. PTV was operated in splitless mode. The injection volume was 2 μl. Helium with purity 5.0 (Linde<br />
Technoplyn, Bratislava, Slovak Republic) was used as the carrier gas. Separations were performed at<br />
constant flow carrier gas conditions 1.2 ml/min and temperature program, 50°C (0.5 min), 90°C/min,<br />
280°C. PTV inlet conditions: 175°C, split vent open time 0.5 min; flow rate 100 ml/min.<br />
<strong>GC</strong>-<strong>MS</strong> measurements with analyte protectants were performed with PTV in solvent vent mode at<br />
following conditions: initial temperature 40°C (0.1 min), vent flow 50 ml/min (0.1 min), temperature<br />
ramp 300°C/min to 175°C, purge time 1.13 min, purge flow 100 ml/min. Oven temperature program:<br />
50°C (1.13 min), ramp 90°C/min to 220°C.<br />
<strong>GC</strong>-ECD measurements were performed on a HP 6890 gas chromatograph (Hewlett-Packard,<br />
Avondale, PA, USA) equipped with an on-column inlet operated in the oven-track mode. As a carrier<br />
gas, hydrogen (purity 99.99 %) was used (Linde, Technoplyn, Bratislava, Slovak Republic) with<br />
constant flow 1.5 ml/min. Temperature of ECD was 320°C, auxiliary gas flow rate was 60 ml/min and<br />
anode gas flow rate was 6 ml/min, nitrogen was used as auxiliary gas (99.999, Linde, Technolplyn,<br />
Bratislava, Slovak Republic). Data acquisition rate was 50 Hz.<br />
Standards of explosives were obtained from different sources; standards mixture solution was<br />
prepared at the concentration 1 mg/ml in acetonitrile. For further work diluted standard solutions were<br />
prepared in acetone. All solvents used were suprasolv grade (Suprasolv, Merck, Darmstad, Germany).<br />
As analyte protectants 3 compounds were used: 3-ethoxy-1,2-propanediol (98%), D-sorbitol<br />
(99%), L-gulonic acid χ-lactone (97%) (Aldrich, Germany); protectants solution at approximate<br />
concentration 40, 4, 4 mg/ml, respectively was prepared in the acetonitrile and water mixture (7:3). To<br />
1 ml of explosives solution to be analyzed 20 µl of analyte protectants solution were added.<br />
Table I. List of coumpounds under study, ions measured in SIM mode, SIM groups starts time for the<br />
methods for PTV in splitess mode and PTV in solvent vent mode. Ions in bold were used for<br />
quantitation.<br />
Compound<br />
SIM ions<br />
[m/z]<br />
PTV splitless<br />
SIM groups start times<br />
[min]<br />
PTV solvent vent<br />
SIM groups start times<br />
[min]<br />
Nitrobenzene (NB) 77, 123 1 -<br />
2-nitrotoluene (2-NT) 92, 120 1.18 -<br />
3-nitrotoluene (3-NT) 91, 137 1.25<br />
-<br />
4-nitrotoluene (4-NT) 91, 137<br />
-<br />
2,6-dinitrotoluene (2,6-DNT) 148, 165<br />
1.50 2<br />
2,4-dinitrotoluene (2,4-DNT) 89, 165<br />
Trinitrotoluene (TNT) 180, 210<br />
1.90 2.50<br />
Pentrite 46, 760<br />
RDX 120, 128 2.13 2.75<br />
- not monitored
Michal Kirchner et al./Petroleum & Coal 49(2) 72-79 (2007) 74<br />
3. Results and Discussion<br />
3. 1. Fast <strong>GC</strong> method development<br />
3. 1.1 Set-up with splitless injection and <strong>MS</strong> detection<br />
In fast <strong>GC</strong> with narrow-bore capillary columns when splitless injection is applied, retention gap or<br />
pre-column must be utilized. To obtain the narrow input-band width (to preserve the column efficiency)<br />
and to increase the transfer rate of solutes from the inlet to the column, solvent recondensation in the<br />
retention gap is required [15,16] . Moreover, volatile explosive analytes, such as nitrobenzene and<br />
nitrotoluenes also require solvent effect for proper peak focusation. Therefore, 1 m long 0.32 mm I.D.<br />
retention gap with non-polar deactivation was connected to the analytical column. The oven initial<br />
temperature was set to 50°C in order to achieve conditions for solvent (acetone) recondensation. This<br />
temperature is 37°C below the pressure corrected boiling point of acetone.<br />
The base for fast <strong>GC</strong> and <strong>GC</strong>-<strong>MS</strong> method development was the use of Speed Optimized Flow<br />
(S<strong>OF</strong>) of carrier gas for which a simple formula was derived by Blumberg [17] :<br />
S<strong>OF</strong>=S<strong>OF</strong> 100µm x 0.01 x I.D. (µm),where S<strong>OF</strong> 100µm is 1.0 ml/min for hydrogen and 0.8 ml/min is for<br />
helium.<br />
The used PTV inlet in splitless mode has an advantage of significantly smaller internal volume of<br />
150 µl instead of conventional splitless inlet with internal volume in the ranges of 250 – 980 µl. Smaller<br />
internal volume is advantageous for the analysis of thermolabile compounds due to the shorter<br />
residence time of sample vapors in a hot vaporizing chamber and thus decreased thermal<br />
decomposition is expected. However, other important parameter preventing thermal decomposition is<br />
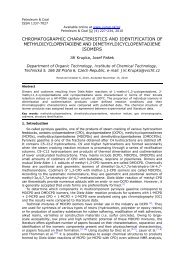
the temperature of <strong>GC</strong> inlet. In figure 1, average relative responses (calculated to 2,6-DNT, n=3) of<br />
thermolabile compounds under study are presented for different inlet temperatures. The highest<br />
relative responses for TNT, pentrite and RDX were obtained for 150 and 175°C, respectively. The<br />
increase of relative responses of RDX is visible increasing the temperature from 125°C to 150, 175°C<br />
due to the better vaporization process. At these temperatures a slight degradation of pentrite starts. At<br />
the higher inlet temperatures (>175°C) a decrease of relative responses is caused by the thermal<br />
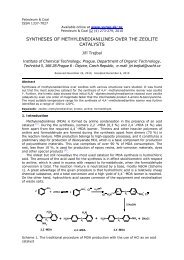
degradation of all tested compounds. In figure 2, the relative standard deviations (RSD, n=3) of<br />
relative responses are presented. RSDs generally increase with increasing temperatures; the lowest<br />
values were found at temperatures 150 and 175°C. For further work temperature 175°C was chosen.<br />
1.8<br />
1.6<br />
1.4<br />
Relative response<br />
1.2<br />
1<br />
0.8<br />
0.6<br />
0.4<br />
0.2<br />
TNT<br />
Pentrite<br />
RDX<br />
0<br />
125 150 175 200 225 250 275<br />
[°C]<br />
Fig. 1. Average relative response (n=3), calculated to 2,6 DNT, for problematic compounds in the<br />
dependence on temperatures of PTV in splitless mode, concentration 10 ng/µl, injected volume 0.5 µl.<br />
As the PTV has small internal volume, the hot splitless injection can suffer from overloading the<br />
vaporizing chamber by the sample vapor resulting in the loss of a sample via septum purge vent.<br />
Therefore, also capacity of PTV multibaffled liner was checked by the injection of different volumes:<br />
0.2, 1 and 2 μl of solution of explosives at the concentration 1 ng/μl in acetone. Average responses<br />
(n=3) were linear over the interval tested, what means that no losses of sample occurred.
Michal Kirchner et al./Petroleum & Coal 49(2) 72-79 (2007) 75<br />
70<br />
60<br />
50<br />
RSD [%]<br />
40<br />
30<br />
TNT<br />
Pentrite<br />
RDX<br />
20<br />
10<br />
0<br />
125 150 175 200 225 250 275<br />
T inlet [°C]<br />
Fig. 2. Dependence of relative standard deviations of relative responses (n=3) of problematic<br />
compounds on temperatures of PTV inlet in splitless mode.<br />
An optimal temperature ramp rate for <strong>GC</strong> is that which renders the best separation in the least<br />
time. Blumberg and Klee recommend such a ramp rate: 10 °C per void time (t M ) [18] . At S<strong>OF</strong> conditions<br />
(1.2 ml/min) and the used column, the void time is 5.1 s and the temperature ramp required is<br />
117°C/min. The maximal temperature ramp provided by <strong>GC</strong> Agilent 6890 over wide temperature range<br />
is 90 °C/min. The influence of oven temperature ramp on the detectability of compounds under study<br />
expressed as signal to noise ratio was compared at two different temperature ramps, 30 and<br />
90°C/min, respectively. The use of lower temperature ramp resulted in significantly decreased S/N<br />
ratios (table II) what is supposed to be caused by the increased peak widths obtained when compared<br />
to the higher ramp (table II). The analysis time was 4 and 2.2 min for 30 and 90°C/min, respectively.<br />
Therefore, for further work 90°C/min temperature ramp was used.<br />
Table II. Comparison of signal to noise ratios and peak widths of explosives at different oven<br />
temperature ramps.<br />
Compound (m/z)<br />
30°C/min<br />
90°C/min<br />
S/N W 1/2<br />
[min]<br />
S/N W 1/2<br />
[min]<br />
NB (123) 310 0,008 390 0,008<br />
2-NT (120) 287 0,009 2450 0,008<br />
3-NT (137) 536 0,015 816 0,005<br />
4-NT (137) 213 0,017 379 0,009<br />
2,6-DNT (165) 221 0,021 259 0,009<br />
2,4-DNT (165) 54 0,022 91 0,011<br />
TNT (210) 203 0,021 498 0,014<br />
The last tested parameter that could influence the detectability of explosives under study was the<br />
electron energy used for electron impact ionization (EI). The conventional energy of electrons used is<br />
70 eV; in the range of electron energies around 70 eV the influence on the fragmentation process of<br />
most of the organic compounds molecules is not significant. Therefore, the checked electron energies<br />
for explosives were 70, 50, 30, 10 and 5 eV. The significant change of mass spectra occurred only at<br />
5 eV. The significant decrease of absolute ion abundances was observed with the decreasing electron<br />
energies. However, also noise level was decreasing and resulted in compounds dependent S/N ratios<br />
(figure 3) measured for quantification ions, which were either almost constant, or changed. The
Michal Kirchner et al./Petroleum & Coal 49(2) 72-79 (2007) 76<br />
decrease of ion abundances is probably caused by the decreased ionization efficiency at lower<br />
potentials.<br />
6000<br />
x 10<br />
5000<br />
4000<br />
3000<br />
2000<br />
70<br />
50<br />
30<br />
20<br />
15<br />
10<br />
5<br />
1000<br />
0<br />
2,6-DNT<br />
(165)<br />
TNT (210) Pentrite (46) Pentrite (76) RDX (120) RDX (128)<br />
Fig. 3. Dependence of signal to noise ratios of explosives for EI electron energies, injected volume<br />
1 µl, concentration 10 ng/µl.<br />
3.1.2 Set up - on-column injection with ECD<br />
The other experimental set-up tested was fast <strong>GC</strong> with on-column inlet, hydrogen as carrier gas<br />
and electron capture detection (ECD). In the case of on-column inlet, an initial oven temperature is<br />
critical for compounds focusation. The initial oven temperature has to be below the pressure corrected<br />
boiling point of the used solvent. At excessively low temperatures and/or insufficient lengths of<br />
retention gap for the given injection volume the injected liquid can be transported by the stream of<br />
carrier gas to the analytical column and subsequently peak shape distortion occurs [19,20] . The optimum<br />
initial temperature for injection of 2 µl was found to be 60°C utilizing 1 m long retention gap.<br />
The other investigated parameter was the flow of an auxiliary gas for ECD – nitrogen tested in<br />
order to decrease the peak widths and peak tailing, but even at the maximal flow (200 ml/min and 12<br />
ml/min anode) no improvement of peak shape was observed.<br />
3.1.3 Utilisation of analyte protectants<br />
Polar organic compound to be analyzed by <strong>GC</strong> suffer from their adsorption on active sites on the<br />
surface of inlet liner, retention gap and/or analytical column. Typical example widely studied in<br />
literature are pesticides residues [21,22,23] . Their responses are strongly dependent on the presence of<br />
co-extracted matrix components. In the real sample analysis ever present matrix co-extractives are<br />
retained by active sites of the separation system used more strongly than the analytes and thus higher<br />
amount of pesticide residues is transported to the detector, what increase their response. This effect is<br />
in the analysis of pesticide residues practice called chromatographic matrix induced response<br />
enhancement, or shortly matrix effect. To reduce the matrix effect and thus eliminate arising errors in<br />
quantitation, novel approach has been adopted by Anastassiades and Lehotay et al. [24,25] . In this<br />
concept special compounds called analyte protectants are added to the sample and to the standards<br />
solution in a neat solvent. The role of these compounds is to adsorb on the active sites and thus<br />
decrease their number in the separation system, predominantly on the injector site. Subsequently
Michal Kirchner et al./Petroleum & Coal 49(2) 72-79 (2007) 77<br />
lower amount of polar analytes are adsorbed and the higher response is obtained on the detector site.<br />
Except the improvement of response, also significant peak tailing elimination has been observed with<br />
the application of analyte protectants [25] . As effective combination of analyte protectants 3-ethoxy-1,2-<br />
propanediol, D-sorbitol, L-gulonic acid χ-lactone were proposed. A mixture solution of these three<br />
compounds is prepared in the acetonitrile and water mixture (7:3). A small portion of analyte<br />
protectants is added to the sample. Water present in the solution can adversely influence the<br />
stationary phase in the column. Therefore, we decided to use PTV inlet in solvent vent mode to<br />
eliminate the solvent and water and <strong>MS</strong> detection.<br />
In table III average peak tailing for the searched explosives is presented; as can be seen,<br />
significant improvement of peak tailing is observed for all compounds.<br />
Table III. Improvement of peak tailing with application of analyte protectants in<br />
<strong>GC</strong>-<strong>MS</strong> measurement at concentration level 0.1 ng/µl.<br />
Peak tailing<br />
Without AP With AP<br />
2,6-DNT 2.57 0.81<br />
2,4-DNT 3.30 1.00<br />
TNT 2.00 0.93<br />
Pentrite 3.20 1.35<br />
RDX 3.37 1.60<br />
AP – analyte protectants<br />
During the optimization of PTV inlet in solvent vent mode no conditions were found suitable for the<br />
proper solvent elimination without a loss of volatile explosives (NB, 2-NT, 3-NT and 4-NT). Therefore,<br />
only DNTs, TNT, pentrite and RDX were evaluated. In figure 4, chromatograms measured in SIM<br />
mode at the concentration level 0.1 ng/µl is presented.<br />
Abundance<br />
60000<br />
35000<br />
1<br />
2<br />
With analyte protectants<br />
4<br />
3<br />
5<br />
Abundance<br />
35000<br />
1<br />
2<br />
Without analyte protectants<br />
4<br />
3 5<br />
5000<br />
5000<br />
Time--><br />
2.10 2.20 2.30 2.40 2.50 2.60 2.70 2.80 2.90<br />
Time--><br />
1.60 1.65 1.70 1.75 1.80 1.85 1.90 1.95 2.00 2.05 2.10 2.15 2.20 2.25<br />
Fig. 4. SIM chromatograms of explosives with and without analyte protectants, concentration 0.1 ng/µl,<br />
injection volume 2 µl; other experimental conditions - in experimental part; 1 – 2,6 DNT, 2 – 2,4 DNT,<br />
3 – TNT, 4 – pentrite, 5 – RDX.<br />
3.2. Calibration<br />
Calibration of <strong>GC</strong>-<strong>MS</strong> with solutions of explosives in a neat acetone and with addition of analyte<br />
protectants and <strong>GC</strong>-ECD was performed at the following concentration levels: 0.001, 0.005, 0.01,<br />
0.05, 0.1, 0.5, 1 and 5 ng/µl. For <strong>GC</strong>-<strong>MS</strong> linear calibration model was used, while for <strong>GC</strong>-ECD<br />
polynomial line of 2nd order was chosen. In table IV coefficients of determination, limits of detection<br />
(LOD) and limits of quantification (LOQ) are presented.
Michal Kirchner et al./Petroleum & Coal 49(2) 72-79 (2007) 78<br />
Table IV. Coefficients of determination (R 2 ), LODs, LOQs for <strong>GC</strong>-<strong>MS</strong> calibration experiments: with and<br />
without application of analyte protectants and <strong>GC</strong>-ECD set-up.<br />
<strong>GC</strong>-<strong>MS</strong><br />
<strong>GC</strong>-<strong>MS</strong> <strong>GC</strong>-<strong>MS</strong> +AP ECD <strong>GC</strong>-<strong>MS</strong> +AP ECD <strong>GC</strong>-<strong>MS</strong> <strong>GC</strong>-<strong>MS</strong> +AP ECD<br />
R 2 R 2 R 2 pg/µl pg/µl pg/µl pg/µl pg/µl pg/µl<br />
LOD S/N LOD S/N LOD LOQ S/N LOQ S/N LOQ<br />
NB 0.9999 - 0.9995 0.071 - 0.32 0.24 - 1.1<br />
2-NT 0.9998 - 0.9996 0.28 - 0.22 0.95 - 0.72<br />
3-NT 0.9996 - 0.9997 0.17 - 0.55 0.57 - 1.8<br />
4-NT 0.9993 - 0.9997 0.065 - 1.1 0.22 - 3.6<br />
2,6-DNT 0.9994 0.9998 0.9993 0.088 0.028 0.18 0.29 0.093 0.61<br />
2,4-DNT 0.9987 0.9996 0.9989 0.063 0.035 0.41 0.21 0.12 1.4<br />
TNT 0.9966 0.9976 0.9997 0.029 0.042 0.41 0.096 0.14 1.4<br />
Pentrite 0.9989 0.9991 0.9984 0.13 0.15 33 0.44 0.51 110<br />
RDX 0.9996 0.9997 0.9996 27 0.19 0.60 89 0.63 2.0<br />
Coefficients of determination are slightly higher for the calibration with the addition of analyte<br />
protectans except of TNT. LODs and LOQs were calculated from signal to noise ratios, for LOD three<br />
times the noise and for LOQ ten times the noise level was taken. LODs and LOQs are better for <strong>GC</strong>-<br />
<strong>MS</strong> set-up than <strong>GC</strong>-ECD set-up for all compounds except of 2-NT. The use of analyte protectants has<br />
the highest positive impact on RDX for which LOD increased from 0.027 ng/µl to 0.00019 ng/µl.<br />
Improvement of the searched parameters with analyte protectants has been observed also for DNTs.<br />
4. Conclusions<br />
For separation and detection of explosives fast <strong>GC</strong> with ECD and fast <strong>GC</strong> with quadrupole <strong>MS</strong><br />
detector were employed. In order to improve detectability of tested explosives, several parameters of<br />
experimental set-up were optimized. In the case of splitless injection great effect of inlet temperature<br />
on the decomposition of problematic compounds was observed. Small internal volume of the PTV inlet<br />
in the splitless mode provided very fast transport of solutes to the column and enabled injection of 2 ul<br />
of acetone solution of explosives. Energy of electrons for EI ionization was found to have no significant<br />
influence on the detectability of the searched explosives. In the case of ECD utilized for detection,<br />
significant band broadening was observed in the cell of the detector and increase of auxiliary gas flow<br />
rate had no positive effect on the peak shapes. <strong>GC</strong> separation of polar explosives suffers from their<br />
adsorption in the chromatographic system resulting in decreased response and peak tailing.<br />
Application of analyte protectants has significantly lowered the degree of explosives adsorption in the<br />
system resulting in improved peak shapes, linearity of response and LODs and LOQs, mainly for<br />
dinitrotoluenes and RDX.<br />
Acknowledgements<br />
This work was supported by Ministry of Education of Slovak Republic in the frame of EUREKA<br />
E!3109 project and by the Slovak Research and Development Agency under the contract No. APVV-<br />
20-000705.<br />
References<br />
[1] Midkiff C. R. Jr.: Encyklopedia of Analytical Science, 2 nd edition, Academic Press, London.<br />
[2] EPA Method 8059 Explosives by Gas Chromatography,<br />
http://www.epa.gov/epaoswer/hazwaste/test/pdfs/8095.pdf.<br />
[3] Kolla P.: J. Chromatogr. A., 1994, 674, 309.<br />
[4] Yinon J., Zitrin S.: Modern methods and Applications in Analysis of Explosives, John Wiley and<br />
Sons LTD., West Sussex, England, 1993, pp. 42-66.<br />
[5] Moore D. S.: Review of Scientific Instruments, 2004, 75, 2499.<br />
[6] Feltes J., Levsen K., Volmer D., Spiekermann M.: J. Chromatogr. 1990, 518, 21.<br />
[7] Levsen K., Mussmann P., Berger-Preiss E., Preiss A., Volmer D., Wunsch G.: Acta Hydrochim.<br />
Hydrobiol. 1993, 21, 153<br />
[8] Walsh M. E.: Talanta 2001, 54, 427.<br />
[9] Yinon J., J. Chromatogr.: 1996, 742, 205.<br />
[10] Emmrich M., Lahrz T., Spyra W.: J. Chromatogr. 2001, 918, 121.
Michal Kirchner et al./Petroleum & Coal 49(2) 72-79 (2007) 79<br />
[11] Hable M., Stern C., Asowata C., Williams K.: J. Chromatogr.Sci, 1991, 292, 131.<br />
[12] Perr J. M., Furton K. G., Almirall J. R.: Talanta 2005, 67, 430.<br />
[13] Korytár P., Janssen H.-G., Matisová E., Brinkman U. A. Th.: Trends. Anal. Chem., 2002, 21,<br />
558.<br />
[14] Matisová E., Dömötörová M.: J. Chromatogr. A, 2003, 1000, 199.<br />
[15] Kirchner M., Matisová E., Dömötörová M., de Zeeuw J.: J. Chromatogr. A, 2004, 1055, 159.<br />
[16] Dömötörová M., Kirchner M., Matisová E., de Zeeuw J.: J. Sep. Sci., 2005, 29, 1051.<br />
[17] Blumberg L. M.: Anal. Chem., 1999, 22, 403.<br />
[18] Blumberg L. M., Klee M. S.: J. Micro. Sep., 2000, 12, 508.<br />
[19] Korytár P., Matisová E., Lefflerová, H.: J. High Resol. Chromatogr., 2000, 23, 149.<br />
[20] Matisová E., Šimeková M., Hrouzková S., Korytár P., Dömötörová M.: J. Sep. Sci., 2002, 25,<br />
1325.<br />
[21] Kirchner M., Matisová E., Otrekal R., Hercegová A., de Zeeuw J.: J. Chromatogr. A, 2005,<br />
1084, 63.<br />
[22] Hajšlová J., Zrostlíková J.: J. Chromatogr. A, 2003, 1000, 181.<br />
[23] Húšková R., Kirchner M., Matisová E.: Chem. Listy, in print<br />
[24] Anastassiades M., Maštovská K., Lehotay S. J.: J. Chromatogr. A, 2003, 1015, 163.<br />
[25] Anastassiades M., Lehotay S. J., Stajnbaher D., Schenck F. J.: J. AOAC Int., 2003, 86, 412.