visualisation and analysis of high dimensional data and complex ...
visualisation and analysis of high dimensional data and complex ...
visualisation and analysis of high dimensional data and complex ...

You also want an ePaper? Increase the reach of your titles
YUMPU automatically turns print PDFs into web optimized ePapers that Google loves.
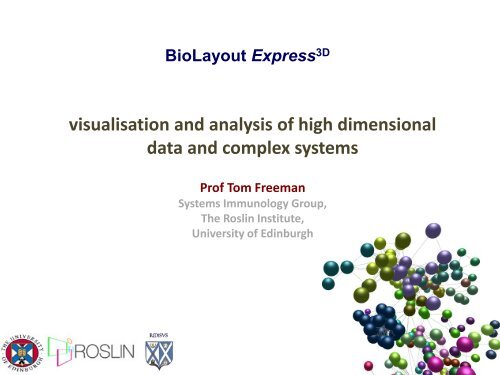
BioLayout Express 3D<br />
<strong>visualisation</strong> <strong>and</strong> <strong>analysis</strong> <strong>of</strong> <strong>high</strong> <strong>dimensional</strong><br />
<strong>data</strong> <strong>and</strong> <strong>complex</strong> systems<br />
Pr<strong>of</strong> Tom Freeman<br />
Systems Immunology Group,<br />
The Roslin Institute,<br />
University <strong>of</strong> Edinburgh
functional genomics<br />
<strong>and</strong> systems biology<br />
paradigm<br />
model<br />
manipulate<br />
HCS<br />
mine<br />
measure
PLoS Comp Biol. 3:2032-42 (2007)<br />
Nature Protocols, 4:1535-50 (2009)<br />
BioLayout Express 3D Team<br />
Tom Freeman, Thanasis Theocharidis,<br />
Tim Angus, Derek Wright<br />
The Roslin Institute<br />
www.biolayout.org<br />
Anton Enright, Stijn van Dongen, +1<br />
EMBL-EBI
current status<br />
• open source program, now on 12 th version<br />
• development funded by BBSRC until Oct. 2013, further funding obtained<br />
(until Oct 2014) with EMBL-EBI for use in <strong>analysis</strong> <strong>of</strong> NGS <strong>data</strong><br />
• program used approx. 4,000 time per month by about 500 users worldwide,<br />
web site accesses ~3,000 per month<br />
applications in <strong>analysis</strong> <strong>of</strong><br />
• expression <strong>data</strong><br />
• proteomics <strong>data</strong><br />
• multi-parameter FACs <strong>data</strong><br />
• DNA sequence <strong>analysis</strong><br />
• pathway modelling <strong>and</strong> simulation
current capabilities<br />
• OS-independent, multi-platform compatibility (Windows, Mac, Linux).<br />
• available as installer version, webstart or platform independent (.jar) file<br />
• supports input <strong>of</strong> multiple file types:<br />
‣ text (.txt)<br />
‣ simple interaction (.sif, tgf)<br />
‣ layout files (.layout)<br />
‣ expression files (.expression)<br />
‣ matrix (.matrix)<br />
‣ yEd GraphML files (.graphml)<br />
• interactive rendering <strong>of</strong> very large network graphs (60,000 nodes, millions<br />
<strong>of</strong> edges) in 2/3D<br />
• built in clustering <strong>and</strong> exploration capabilities<br />
• graph animation<br />
• full support for mEPN pathway notation scheme<br />
• implementation <strong>of</strong> modified Signaling Petri Net (SPN) algorithm
<strong>high</strong> <strong>dimensional</strong> <strong>data</strong><br />
100’s columns, thous<strong>and</strong>s rows<br />
BioLayout Express 3D<br />
<strong>analysis</strong> pipeline for <strong>high</strong><br />
<strong>dimensional</strong> <strong>data</strong><br />
calculate<br />
correlation matrix<br />
Layout, dynamic <strong>visualisation</strong> <strong>and</strong><br />
clustering <strong>of</strong> graphs (10’s thous<strong>and</strong>s<br />
nodes, millions <strong>of</strong> edges) in 2D or 3D<br />
minutes<br />
<strong>data</strong> integration <strong>and</strong> exploration
http://www.macrophages.com/pig-atlas<br />
http://biogps.org/
Modelling <strong>of</strong> Pathway Knowledge<br />
Molecular Interaction Map <strong>of</strong> a Macrophage<br />
Oda K, Kimura T, Matsuoka Y, Funahashi A, Muramatsu M, Kitano 2004
Sources <strong>of</strong> ‘Pathway Data’<br />
the literature (reviews)<br />
pathway <strong>data</strong>bases<br />
• KEGG<br />
• NetPath<br />
• Upstate<br />
• Panther<br />
• Reactome<br />
• WikiPathways<br />
• GenMapp…….<br />
for comprehensive list see:<br />
http://www.pathguide.org/<br />
interaction <strong>data</strong>bases<br />
• BIND<br />
• String<br />
• Ingenuity……<br />
gene lists<br />
• pathway membership – <strong>data</strong>bases/array designs/reviews
4 views <strong>of</strong> apoptosis<br />
need for a st<strong>and</strong>ardised approach for presenting <strong>and</strong> modelling biological<br />
pathways
http://www.sbgn.org
network modelling <strong>of</strong> biological pathways <strong>and</strong> systems<br />
aim<br />
to construct models <strong>of</strong> the current consensus view <strong>of</strong> the biological pathways<br />
underpinning the biological systems, particularly the macrophage <strong>and</strong> its role in<br />
the innate immune response<br />
pathway models should:<br />
• logically depict molecular interactions using st<strong>and</strong>ardised notation<br />
• unambiguously depict the identity <strong>of</strong> components<br />
• depict state transitions <strong>of</strong> components<br />
• capture the semantics <strong>of</strong> relationships between components <strong>of</strong> the pathway as<br />
described in the literature<br />
• be useful in the <strong>analysis</strong> <strong>of</strong> genomics <strong>data</strong> <strong>and</strong> hypothesis generation<br />
• provide a resource for the computational modelling <strong>of</strong> pathways<br />
• easily understood <strong>and</strong> constructed by biologists
IFNB Pathway Diagram<br />
Interferon B (IFNB1) is a cytokine released from many cell<br />
types in response to immune stimulation. It homodimerises<br />
<strong>and</strong> binds to its cell surface receptor <strong>complex</strong> composed <strong>of</strong><br />
the receptor proteins IFNAR1 <strong>and</strong> IFNAR2 <strong>and</strong> the<br />
intracellular kinases TYK2 <strong>and</strong> JAK1. The <strong>complex</strong> is<br />
composed <strong>of</strong> 2 <strong>of</strong> each <strong>of</strong> these proteins. Binding causes a<br />
conformation change in the <strong>complex</strong> resulting in the<br />
autophosphorylation <strong>of</strong> JAK1. Once activated the <strong>complex</strong><br />
catalyses the phosphorylation <strong>of</strong> STAT2 which forms a<br />
heterodimer with STAT1. This <strong>complex</strong> then binds<br />
interferon regulatory factor 9 (IRF9) forming the <strong>complex</strong><br />
<strong>of</strong>ten referred to as ISGF3 <strong>and</strong> translocates to the nucleus.<br />
Here it binds to the IRF sequence in the promotor <strong>of</strong> a<br />
number <strong>of</strong> genes including IRF2, IL12B, STAT1, IL15,<br />
TAP1, GBP1, PSMB9, SOCS3. In turn SOCS3 inhibits the<br />
atuophosphorylation <strong>of</strong> the receptor thereby inhibiting<br />
further activation.
Freeman et al., BMC Systems Biology 4:65, 2010
Framework Map <strong>of</strong> Macrophage<br />
Signalling Pathways<br />
140 proteins, 99 <strong>complex</strong>es, 44 genes<br />
285 interactions<br />
Raza et al., BMC Systems Biology. 2:36-51, 2008
non-TLR pathogen sensing<br />
antigen presentation, proteosome, Ub<br />
oxidative<br />
phosphorylation<br />
NF-kB<br />
cell cycle<br />
TLR, kinase cascades<br />
glucorticoid<br />
system<br />
cholesterol metabolism
Integrated View <strong>of</strong><br />
Macrophage Activation <strong>and</strong><br />
Effector Pathways<br />
Raza et al., BMC Systems Biology 4:63 2010<br />
current activities<br />
• mapping <strong>of</strong> new pathway systems based on<br />
literature <strong>and</strong> transcriptional signatures<br />
• better integration <strong>of</strong> transcription factor<br />
networks/gene expression networks<br />
• mapping to SBGN/SBML<br />
2,031<br />
Nodes<br />
2,494<br />
Edges
<strong>analysis</strong> <strong>and</strong> visualization <strong>of</strong> rule-based stochastic flow<br />
through biological pathways<br />
objectives<br />
• to explore the possibility <strong>of</strong><br />
using the pathway diagrams<br />
constructed by us as a resource<br />
for pathway simulation<br />
modelling<br />
• to model pathways activity using<br />
a method that is scalable <strong>and</strong><br />
does not require knowledge <strong>of</strong><br />
kinetic parameters
Petri nets<br />
• Petri nets were first proposed by Carl Petri in 1938<br />
• they are a formal, graphical, executable technique for<br />
the specification <strong>and</strong> <strong>analysis</strong> <strong>of</strong> concurrent, discreteevent<br />
dynamic systems<br />
• they bipartite graphs composed <strong>of</strong> places, transitions<br />
<strong>and</strong> edges (bipartite graphs - place-transition-place)<br />
• a place generally represents an entity or in our case a<br />
pathway component<br />
• a transition represents a process between places <strong>and</strong><br />
can be used to model dependencies between places<br />
(AND/OR)<br />
• an edge depicts the relationships between on place <strong>and</strong><br />
another via a transition. All are the same with the<br />
exception <strong>of</strong> inhibition edges
Signaling Petri Net: stochastic flow simulation<br />
• the Signaling Petri Net (SPN) is a new algorithm<br />
proposed for use in simulations <strong>of</strong> biological pathways<br />
see: Ruths et al. PLoS Comp Biol. 4:76 (2008)<br />
• the algorithm models the stochastic flow <strong>of</strong> a variable<br />
number <strong>of</strong> tokens<br />
• it doesn't need kinetic parameters <strong>of</strong><br />
reactions/transitions<br />
• fast computational times
Conversion <strong>of</strong> mEPN concepts to Petri net
graphical <strong>and</strong> computation pathway notation system (mEPN v2.0, 2012)
starting assumptions<br />
•the ‘rate’ <strong>of</strong> any given reaction in vivo is not known <strong>and</strong> can not be<br />
determined. Even if this was not the case, individually these factors would<br />
have little affect on the overall dynamics <strong>of</strong> the system (see below).<br />
•activity ‘flow’ through biological pathways is primarily determined by the<br />
connections between components i.e. the network topology <strong>and</strong> the amount <strong>of</strong><br />
any given component<br />
•the pathway network forms the basis <strong>of</strong> the model <strong>and</strong> the amount <strong>of</strong> any<br />
given component can be measured or inferred<br />
•biological systems are stochastic i.e. is one whose behaviour is nondeterministic<br />
<strong>and</strong> based on r<strong>and</strong>om events<br />
•the model may be incorrect <strong>and</strong> these assumptions may only be<br />
approximations <strong>of</strong> the truth
Screenshot 1
Screenshot 2
modelling <strong>and</strong> visualization <strong>of</strong> stochastic flow through<br />
large network systems<br />
1. pathway models drawn in yEd graph<br />
editor, parameterized <strong>and</strong> saved as<br />
.graphml files<br />
2. models imported into<br />
BioLayout <strong>and</strong> SPN<br />
algorithm used to calculate<br />
time-dependent stochastic<br />
flow through network<br />
3. the results <strong>of</strong> flow simulations can<br />
be visualised as graphs (mouse-over<br />
function) or viewed as real-time<br />
animations where the size <strong>and</strong><br />
colour <strong>of</strong> nodes is used to represent<br />
their activity
BioLayout Express 3D Team<br />
Roslin Institute<br />
Tom Freeman<br />
Thansis Theocharidis<br />
Ben Boyer<br />
Tim Angus<br />
Derek Wright<br />
www.biolayout.org<br />
EMBL-EBI<br />
Anton Enright<br />
Stijn van Dongen