- Page 1 and 2:
POSTER SW: SOIL AND WATER ENGINEERI
- Page 3 and 4:
Presenter: Jose Euclides Paterniani
- Page 5 and 6: 1 Faculdade de Engenharia Agricola
- Page 7 and 8: Matsura Department of hydraulic and
- Page 9 and 10: P-2064 MULTIVARIATE STATISTICAL OF
- Page 11 and 12: temperature-based (e.g., Thornthwai
- Page 13 and 14: two types of reference surfaces rep
- Page 15 and 16: (d) Baft (c) Bam (b) Kerma n (a) Ji
- Page 17 and 18: Estevez, J., Gavilan, P., & Berenge
- Page 19 and 20: 2. Materials and Methods 2.1 The hy
- Page 21 and 22: Ia = n × v ec Equation 3 which: Ia
- Page 23 and 24: 5. References ALLEN, R.G.; PEREIRA,
- Page 25 and 26: The density analysis was performed
- Page 27 and 28: Figure1 - Relationship between the
- Page 29 and 30: 4 Conclusions • The density obtai
- Page 31 and 32: characteristics resulting from of g
- Page 33 and 34: Table1. Morphological characteristi
- Page 35 and 36: Transpiration of Eucalyptus spp see
- Page 37 and 38: The fertilization growth and harden
- Page 39 and 40: Cool, J. B., Rodrigo, G. N., Garcí
- Page 41 and 42: Abstract Agriculture and water sour
- Page 43 and 44: In 1985 and 1986 hygienic protectio
- Page 45 and 46: spring area. It is also prohibited
- Page 47 and 48: Biological Nitrogen Fixation In Gen
- Page 49 and 50: We used a completely randomized in
- Page 51 and 52: 5. References AYERS, R.S.; WESTCOT,
- Page 53 and 54: 2 However, the cultures are not alw
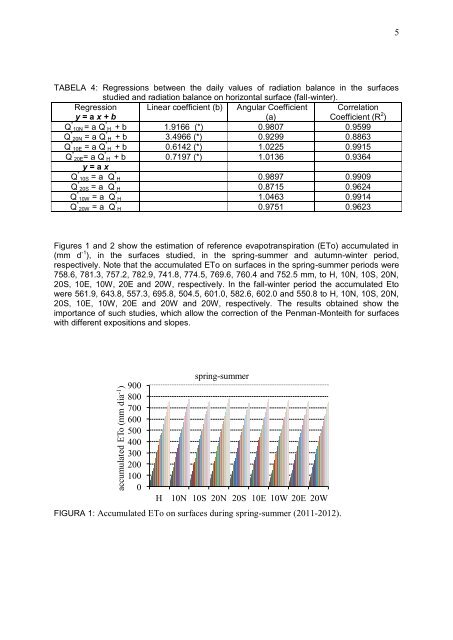
- Page 55: 4 TABEL 2: Mean values of radiation
- Page 59 and 60: only the expansion of agricultural
- Page 61 and 62: FIGURE 2: Content of chlorophyll a,
- Page 63 and 64: Evapotranspiration and Crop Coeffic
- Page 65 and 66: were respectively applied in the fi
- Page 67 and 68: TABLE 1: Irrigation depth and actua
- Page 69 and 70: NUTRIENT RETENTION IN WETLANDS USIN
- Page 71 and 72: Table 2. Daily affluent concentrati
- Page 73 and 74: IMPORTANCE OF DRY GEAR MASS CULTURE
- Page 75 and 76: mobilizing assimilated exerted by c
- Page 77 and 78: This method consists of covering th
- Page 79 and 80: uncovered ones, that mixed the wate
- Page 81 and 82: coliforms and E-coli that might hav
- Page 83 and 84: WATER TREATMENT BY COAGULATION WITH
- Page 85 and 86: in a grinder and passed through a 0
- Page 87 and 88: 3.2. Determination of the required
- Page 89 and 90: ANALYSIS OF LEVELS OF LAND DEGRADAT
- Page 91 and 92: This methodology consists of a sequ
- Page 93 and 94: FIGURE 5. A - Area of exploitation
- Page 95 and 96: Water technology improvements and t
- Page 97 and 98: The Multiattribute Utility Theory (
- Page 99 and 100: higher demand than those of scenari
- Page 101 and 102: YIELD AND BEAN SIZE OF COFFEA ARABI
- Page 103 and 104: uniformity of flowering. The irriga
- Page 105 and 106: Table 3 - Analysis of variance for
- Page 107 and 108:
SUGARCANE FERTIRRIGATED WITH MINERA
- Page 109 and 110:
3. Results and Discussion The value
- Page 111 and 112:
espectively, compared to that obser
- Page 113 and 114:
Optimal Reservoir Operation Model w
- Page 115 and 116:
all periods are computed using Eq.
- Page 117 and 118:
(a) Calibration (b) Verification Fi
- Page 119 and 120:
Characteristics of Heavy Metal Cont
- Page 121 and 122:
2. Materials and Method 2.1. Study
- Page 123 and 124:
TABLE 2: Devices for collecting of
- Page 125 and 126:
Calibration of Hargreaves Equation
- Page 127 and 128:
Relative error (RE): Index of agree
- Page 129 and 130:
Stochastic modelling of Contaminant
- Page 131 and 132:
widely used for various fields such
- Page 133 and 134:
show that Extvalue and Logistic dis
- Page 135 and 136:
Efficiency of water and energy use
- Page 137 and 138:
Pressure: it was obtained by means
- Page 139 and 140:
them cover similar percentages. Dur
- Page 141 and 142:
Relationship among compaction, mois
- Page 143 and 144:
Cylindrical containers (191mm diame
- Page 145 and 146:
Figure 9 High compaction. Bulk dens
- Page 147 and 148:
Simulation of water flow with root
- Page 149 and 150:
water contents were almost greater
- Page 151 and 152:
Operation and Energy Optimization M
- Page 153 and 154:
Urmia Salt Lake Urmia FIGURE 1: Gha
- Page 155 and 156:
changes have been done in system. F
- Page 157 and 158:
Application of Surface Cover and So
- Page 159 and 160:
significantly lower than those from
- Page 161 and 162:
Choi, J. D., (1997). Effect of Rura
- Page 163 and 164:
1.1. Scope and aim The growth of th
- Page 165 and 166:
Therefore, the remaining works are
- Page 167 and 168:
network makes such volumes unaccept
- Page 169 and 170:
Reclaimed wastewater reuse has been
- Page 171 and 172:
Fig. 2 shows the monitoring results
- Page 173 and 174:
3. Conclusions Reclaimed wastewater
- Page 175 and 176:
Q P Ia 2 P Ia S for P≥Ia Q 0
- Page 177 and 178:
data P (mm), gauged in 130 pluviogr
- Page 179 and 180:
TABLE 2: CN emp values obtained for
- Page 181 and 182:
References Chapman, T. G. & Maxwell
- Page 183 and 184:
This work, after applying Kennessey
- Page 185 and 186:
TABLE 2 - Partial runoff coefficien
- Page 187 and 188:
Figure 3 also reports a comparison
- Page 189 and 190:
2. Material and Methods The experim
- Page 191 and 192:
TABLE 2: Summary of variance analys
- Page 193 and 194:
BEZERRA, I. L.; GHEYI, H. R.; FERNA
- Page 195 and 196:
2. Materials and Methods The study
- Page 197 and 198:
Figure 3. Hourly values of ET estim
- Page 199 and 200:
Ortega-Farias, S.O., Cuenca, R.H.,
- Page 201 and 202:
2 Material end methods The wastewat
- Page 203 and 204:
Queiroz et al. (2004) and (Fonseca
- Page 205 and 206:
Reference list CEREDA, M.P. (2001)
- Page 207 and 208:
2. Data and Methods 2.1. Methods Ir
- Page 209 and 210:
3. Results The water balance model
- Page 211 and 212:
Acknowledgments This work was carri
- Page 213 and 214:
and the need to reduce costs, it be
- Page 215 and 216:
40 mm 65.30 59.00 8.70 8.10 60 mm 6
- Page 217 and 218:
REFERENCES BERTRAND, J. P. et al. L
- Page 219 and 220:
The mathematical modeling in the wa
- Page 221 and 222:
OD (mg L -1 ) OD obs (mg L -1 ) TAB
- Page 223 and 224:
OD (mg L -1 ) DBO (mg L -1 ) 8,00 7
- Page 225 and 226:
Effect of Rice Straw Mulch on Runof
- Page 227 and 228:
mg/L, 14.6 mg/L, and 1.2 mg/L, resp
- Page 229 and 230:
1 PAPAYA SEEDLINGS PRODUCTION FROM
- Page 231 and 232:
3 into an oven with circulating air
- Page 233 and 234:
5 14 12 Stem diameter (mm) 10 8 6 4
- Page 235 and 236:
7 Root dry matter (g plant -1 ) 8 7
- Page 237 and 238:
CAVALCANTE, L. F.; CORDEIRO, J. C.;
- Page 239 and 240:
This document was created with Win2
- Page 241 and 242:
extractable and non-extractable bou
- Page 243 and 244:
MOD-E and MOD-B, and 65.99% and 80.
- Page 245 and 246:
Houot, S., Barriuso, E., Bergheaud,
- Page 247 and 248:
measures water content and electric
- Page 249 and 250:
As observed, increasing the dischar
- Page 251 and 252:
irrigation: a comparison of point a
- Page 253 and 254:
field operations (STRECK et al., 20
- Page 255 and 256:
3. Results and discussions Table 1
- Page 257 and 258:
4. Conclusions It can be concluded
- Page 259 and 260:
water maintenance. At the same time
- Page 261 and 262:
TABLE 1 Stream discharge for each m
- Page 263 and 264:
TABLE 5 Correlation analysis of wat
- Page 265 and 266:
turbulent flow energy produced by w
- Page 267 and 268:
The numerical model was validated a
- Page 269 and 270:
4. Conclusion FIGURE 6: The shape o
- Page 271 and 272:
2.1 Case study The Zayandeh-Rud bas
- Page 273 and 274:
economic factors. In this is a very
- Page 275 and 276:
FIGURE 1. Location of the Wuliangsu
- Page 277 and 278:
WT( o C) (a) 30 25 20 15 10 5 0 -5
- Page 279 and 280:
(a) (b) (c) (d) (e) (f) (g) (h) (i)
- Page 281 and 282:
• The effectiveness of the crop c
- Page 283 and 284:
As evidenced by Rana et al. (2005),
- Page 285 and 286:
1.20 1.20 2010 2011 0.90 0.90 K c 0
- Page 287 and 288:
elationships. There is forest area,
- Page 289 and 290:
B = ( c − a) A − ( c − d) c
- Page 291 and 292:
References Choi, W.-J., Lee, S.-M.,
- Page 293 and 294:
of faecal bacteria (Kummerer, 2004;
- Page 295 and 296:
FIGURE 1 - Project tasks and links
- Page 297 and 298:
Oliveira, A.B. & Henriques, M. (201
- Page 299 and 300:
1 Introduction To irrigate is to su
- Page 301 and 302:
the inverter that provides a refere
- Page 303 and 304:
OLIVEIRA FILHO, D. ; SAMPAIO, R. P.
- Page 305 and 306:
1.1 Description of the Study Area T
- Page 307 and 308:
Refrences: Bruce J.P. (1994). Natur
- Page 309 and 310:
RE because it has the advantages ov
- Page 311 and 312:
with L 1 2 com obs J ( k ) = ∑{ f
- Page 313 and 314:
Relative hydraulic conductivity r 1
- Page 315 and 316:
surfaces requires information on th
- Page 317 and 318:
climate. Therefore a special coeffi
- Page 319 and 320:
FIGURE 2: The relation between K pa
- Page 321 and 322:
Coagulation using Moringa oleifera
- Page 323 and 324:
After the assembly of the experimen
- Page 325 and 326:
For the positive control test, the
- Page 327 and 328:
MULTIVARIATE STATISTICAL OF PRINCIP
- Page 329 and 330:
The multiple regression equations w
- Page 331 and 332:
Table 3 - Regression models that be
- Page 333 and 334:
Is Imaging Analysis Quantifying the
- Page 335 and 336:
of the computer. All additional ima
- Page 337 and 338:
The final enhanced images were segm
- Page 339 and 340:
image analysis is well suited and f
- Page 341 and 342:
EVALUATION OF CROP CANOPY EFFECT ON
- Page 343 and 344:
∂e ∂e ∂e + u + v ∂t ∂x
- Page 345 and 346:
4. Results and discussion 4.1. Spat
- Page 347 and 348:
Benchmarking of Irrigated Agricultu
- Page 349 and 350:
Indicators can be thought of as sta
- Page 351 and 352:
total area is about 13,700 km2. The