poster - International Conference of Agricultural Engineering
poster - International Conference of Agricultural Engineering poster - International Conference of Agricultural Engineering
As the DM production was increased in the range of slides were evaluated, it is understood that not worked with the blade that maximizes the productivity of the grass, but the values are higher than those quoted by Mitidiere (1983) and Correa (1999), demonstrating that there is no restriction on the use of wastewater for irrigation and fertilization of grass. He also noted that there is a direct relationship between height and DM yield of grass. Figure 1 - Relationship between plant height (H), dry matter yield (DM) and the blades mean of WW applied in the area (L). Evaluating the results shown in Figure 2 it is observed that in the 0 to 0.20 m estimates of Sb according to AR applied blades reach a maximum of increase of 0.212 cmol c dm- 3 to the blade of 200 mm and the layer 0.20 to 0.40 m depth Sb maximum, .802 cmol c dm -3 was estimated with the blade of 270 mm. It is also observed that the addition of Sb was higher in the layer of 0.20 to 0.40 m in depth and that the reduction of Sb in the descending part of both curves results in leaching of the bases for the deeper regions of the soil. Figure 2 - Alteration in the sum of bases 0-20 and 20-40 cm soil depth
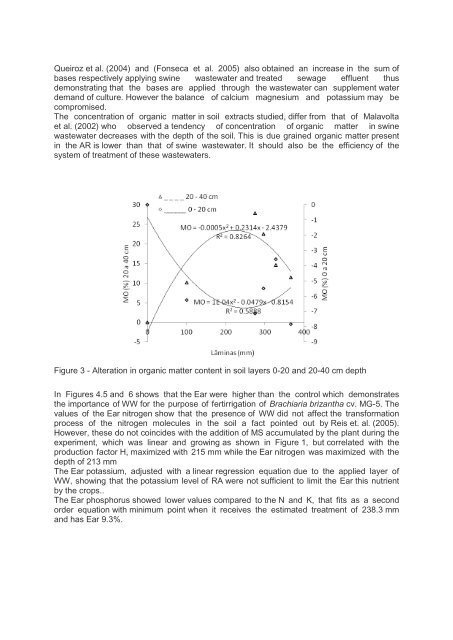
Queiroz et al. (2004) and (Fonseca et al. 2005) also obtained an increase in the sum of bases respectively applying swine wastewater and treated sewage effluent thus demonstrating that the bases are applied through the wastewater can supplement water demand of culture. However the balance of calcium magnesium and potassium may be compromised. The concentration of organic matter in soil extracts studied, differ from that of Malavolta et al. (2002) who observed a tendency of concentration of organic matter in swine wastewater decreases with the depth of the soil. This is due grained organic matter present in the AR is lower than that of swine wastewater. It should also be the efficiency of the system of treatment of these wastewaters. Figure 3 - Alteration in organic matter content in soil layers 0-20 and 20-40 cm depth In Figures 4.5 and 6 shows that the Ear were higher than the control which demonstrates the importance of WW for the purpose of fertirrigation of Brachiaria brizantha cv. MG-5. The values of the Ear nitrogen show that the presence of WW did not affect the transformation process of the nitrogen molecules in the soil a fact pointed out by Reis et. al. (2005). However, these do not coincides with the addition of MS accumulated by the plant during the experiment, which was linear and growing as shown in Figure 1, but correlated with the production factor H, maximized with 215 mm while the Ear nitrogen was maximized with the depth of 213 mm The Ear potassium, adjusted with a linear regression equation due to the applied layer of WW, showing that the potassium level of RA were not sufficient to limit the Ear this nutrient by the crops.. The Ear phosphorus showed lower values compared to the N and K, that fits as a second order equation with minimum point when it receives the estimated treatment of 238.3 mm and has Ear 9.3%.
- Page 151 and 152: Operation and Energy Optimization M
- Page 153 and 154: Urmia Salt Lake Urmia FIGURE 1: Gha
- Page 155 and 156: changes have been done in system. F
- Page 157 and 158: Application of Surface Cover and So
- Page 159 and 160: significantly lower than those from
- Page 161 and 162: Choi, J. D., (1997). Effect of Rura
- Page 163 and 164: 1.1. Scope and aim The growth of th
- Page 165 and 166: Therefore, the remaining works are
- Page 167 and 168: network makes such volumes unaccept
- Page 169 and 170: Reclaimed wastewater reuse has been
- Page 171 and 172: Fig. 2 shows the monitoring results
- Page 173 and 174: 3. Conclusions Reclaimed wastewater
- Page 175 and 176: Q P Ia 2 P Ia S for P≥Ia Q 0
- Page 177 and 178: data P (mm), gauged in 130 pluviogr
- Page 179 and 180: TABLE 2: CN emp values obtained for
- Page 181 and 182: References Chapman, T. G. & Maxwell
- Page 183 and 184: This work, after applying Kennessey
- Page 185 and 186: TABLE 2 - Partial runoff coefficien
- Page 187 and 188: Figure 3 also reports a comparison
- Page 189 and 190: 2. Material and Methods The experim
- Page 191 and 192: TABLE 2: Summary of variance analys
- Page 193 and 194: BEZERRA, I. L.; GHEYI, H. R.; FERNA
- Page 195 and 196: 2. Materials and Methods The study
- Page 197 and 198: Figure 3. Hourly values of ET estim
- Page 199 and 200: Ortega-Farias, S.O., Cuenca, R.H.,
- Page 201: 2 Material end methods The wastewat
- Page 205 and 206: Reference list CEREDA, M.P. (2001)
- Page 207 and 208: 2. Data and Methods 2.1. Methods Ir
- Page 209 and 210: 3. Results The water balance model
- Page 211 and 212: Acknowledgments This work was carri
- Page 213 and 214: and the need to reduce costs, it be
- Page 215 and 216: 40 mm 65.30 59.00 8.70 8.10 60 mm 6
- Page 217 and 218: REFERENCES BERTRAND, J. P. et al. L
- Page 219 and 220: The mathematical modeling in the wa
- Page 221 and 222: OD (mg L -1 ) OD obs (mg L -1 ) TAB
- Page 223 and 224: OD (mg L -1 ) DBO (mg L -1 ) 8,00 7
- Page 225 and 226: Effect of Rice Straw Mulch on Runof
- Page 227 and 228: mg/L, 14.6 mg/L, and 1.2 mg/L, resp
- Page 229 and 230: 1 PAPAYA SEEDLINGS PRODUCTION FROM
- Page 231 and 232: 3 into an oven with circulating air
- Page 233 and 234: 5 14 12 Stem diameter (mm) 10 8 6 4
- Page 235 and 236: 7 Root dry matter (g plant -1 ) 8 7
- Page 237 and 238: CAVALCANTE, L. F.; CORDEIRO, J. C.;
- Page 239 and 240: This document was created with Win2
- Page 241 and 242: extractable and non-extractable bou
- Page 243 and 244: MOD-E and MOD-B, and 65.99% and 80.
- Page 245 and 246: Houot, S., Barriuso, E., Bergheaud,
- Page 247 and 248: measures water content and electric
- Page 249 and 250: As observed, increasing the dischar
- Page 251 and 252: irrigation: a comparison of point a
Queiroz et al. (2004) and (Fonseca et al. 2005) also obtained an increase in the sum <strong>of</strong><br />
bases respectively applying swine wastewater and treated sewage effluent thus<br />
demonstrating that the bases are applied through the wastewater can supplement water<br />
demand <strong>of</strong> culture. However the balance <strong>of</strong> calcium magnesium and potassium may be<br />
compromised.<br />
The concentration <strong>of</strong> organic matter in soil extracts studied, differ from that <strong>of</strong> Malavolta<br />
et al. (2002) who observed a tendency <strong>of</strong> concentration <strong>of</strong> organic matter in swine<br />
wastewater decreases with the depth <strong>of</strong> the soil. This is due grained organic matter present<br />
in the AR is lower than that <strong>of</strong> swine wastewater. It should also be the efficiency <strong>of</strong> the<br />
system <strong>of</strong> treatment <strong>of</strong> these wastewaters.<br />
Figure 3 - Alteration in organic matter content in soil layers 0-20 and 20-40 cm depth<br />
In Figures 4.5 and 6 shows that the Ear were higher than the control which demonstrates<br />
the importance <strong>of</strong> WW for the purpose <strong>of</strong> fertirrigation <strong>of</strong> Brachiaria brizantha cv. MG-5. The<br />
values <strong>of</strong> the Ear nitrogen show that the presence <strong>of</strong> WW did not affect the transformation<br />
process <strong>of</strong> the nitrogen molecules in the soil a fact pointed out by Reis et. al. (2005).<br />
However, these do not coincides with the addition <strong>of</strong> MS accumulated by the plant during the<br />
experiment, which was linear and growing as shown in Figure 1, but correlated with the<br />
production factor H, maximized with 215 mm while the Ear nitrogen was maximized with the<br />
depth <strong>of</strong> 213 mm<br />
The Ear potassium, adjusted with a linear regression equation due to the applied layer <strong>of</strong><br />
WW, showing that the potassium level <strong>of</strong> RA were not sufficient to limit the Ear this nutrient<br />
by the crops..<br />
The Ear phosphorus showed lower values compared to the N and K, that fits as a second<br />
order equation with minimum point when it receives the estimated treatment <strong>of</strong> 238.3 mm<br />
and has Ear 9.3%.


