poster - International Conference of Agricultural Engineering
poster - International Conference of Agricultural Engineering poster - International Conference of Agricultural Engineering
Maximum total contracted active energy is a data supplied by the energy supply company. The energy cost per unit irrigation supply (CENV T ) is 0.044 €·m -3 . The average values obtained in the studied farm were very similar to the average WUA values in this area (from 0.025 to 0.129 €·m -3 , according to the WUA data in the province of Alicante, Spain). The value of energy load index (ICE) corresponds with the maximum operating pressure value of the pump, which is the highest value of the piezometric level of the irrigation network. The average energy efficiency of the pumping system (EEB) was obtained by the aid of the simultaneously measurements of the water and energy parameters cited in chapter 2.2. Efficiency of the energy supply (ESE) quantifies the energy supply according to the topology of the irrigation network, and relates the energy demanded by the irrigation network with the energy supplied by the pump. The product of EEB and ESE presents the general energy efficiency (EEG) of the irrigation system. According to the calculated parameters and the protocol for WUA, the studied irrigation system was classified as a consumer system, into the forth group of energy consumption (600
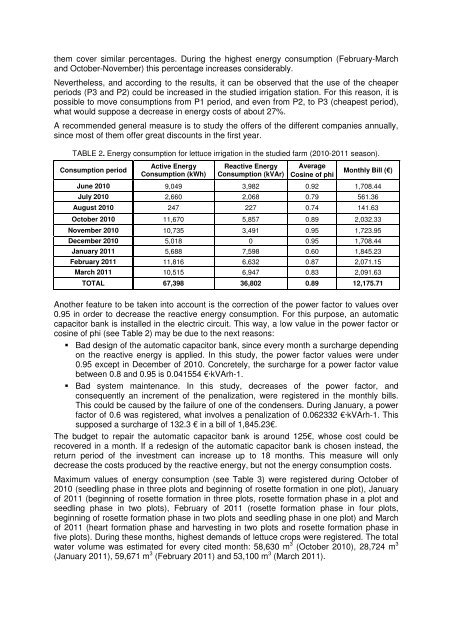
them cover similar percentages. During the highest energy consumption (February-March and October-November) this percentage increases considerably. Nevertheless, and according to the results, it can be observed that the use of the cheaper periods (P3 and P2) could be increased in the studied irrigation station. For this reason, it is possible to move consumptions from P1 period, and even from P2, to P3 (cheapest period), what would suppose a decrease in energy costs of about 27%. A recommended general measure is to study the offers of the different companies annually, since most of them offer great discounts in the first year. TABLE 2. Energy consumption for lettuce irrigation in the studied farm (2010-2011 season). Consumption period Active Energy Consumption (kWh) Reactive Energy Consumption (kVAr) Average Cosine of phi Monthly Bill (€) June 2010 9,049 3,982 0.92 1,708.44 July 2010 2,660 2,068 0.79 561.36 August 2010 247 227 0.74 141.63 October 2010 11,670 5,857 0.89 2,032.33 November 2010 10,735 3,491 0.95 1,723.95 December 2010 5,018 0 0.95 1,708.44 January 2011 5,688 7,598 0.60 1,845.23 February 2011 11,816 6,632 0.87 2,071.15 March 2011 10,515 6,947 0.83 2,091.63 TOTAL 67,398 36,802 0.89 12,175.71 Another feature to be taken into account is the correction of the power factor to values over 0.95 in order to decrease the reactive energy consumption. For this purpose, an automatic capacitor bank is installed in the electric circuit. This way, a low value in the power factor or cosine of phi (see Table 2) may be due to the next reasons: Bad design of the automatic capacitor bank, since every month a surcharge depending on the reactive energy is applied. In this study, the power factor values were under 0.95 except in December of 2010. Concretely, the surcharge for a power factor value between 0.8 and 0.95 is 0.041554 €·kVArh-1. Bad system maintenance. In this study, decreases of the power factor, and consequently an increment of the penalization, were registered in the monthly bills. This could be caused by the failure of one of the condensers. During January, a power factor of 0.6 was registered, what involves a penalization of 0.062332 €·kVArh-1. This supposed a surcharge of 132.3 € in a bill of 1,845.23€. The budget to repair the automatic capacitor bank is around 125€, whose cost could be recovered in a month. If a redesign of the automatic capacitor bank is chosen instead, the return period of the investment can increase up to 18 months. This measure will only decrease the costs produced by the reactive energy, but not the energy consumption costs. Maximum values of energy consumption (see Table 3) were registered during October of 2010 (seedling phase in three plots and beginning of rosette formation in one plot), January of 2011 (beginning of rosette formation in three plots, rosette formation phase in a plot and seedling phase in two plots), February of 2011 (rosette formation phase in four plots, beginning of rosette formation phase in two plots and seedling phase in one plot) and March of 2011 (heart formation phase and harvesting in two plots and rosette formation phase in five plots). During these months, highest demands of lettuce crops were registered. The total water volume was estimated for every cited month: 58,630 m 3 (October 2010), 28,724 m 3 (January 2011), 59,671 m 3 (February 2011) and 53,100 m 3 (March 2011).
- Page 87 and 88: 3.2. Determination of the required
- Page 89 and 90: ANALYSIS OF LEVELS OF LAND DEGRADAT
- Page 91 and 92: This methodology consists of a sequ
- Page 93 and 94: FIGURE 5. A - Area of exploitation
- Page 95 and 96: Water technology improvements and t
- Page 97 and 98: The Multiattribute Utility Theory (
- Page 99 and 100: higher demand than those of scenari
- Page 101 and 102: YIELD AND BEAN SIZE OF COFFEA ARABI
- Page 103 and 104: uniformity of flowering. The irriga
- Page 105 and 106: Table 3 - Analysis of variance for
- Page 107 and 108: SUGARCANE FERTIRRIGATED WITH MINERA
- Page 109 and 110: 3. Results and Discussion The value
- Page 111 and 112: espectively, compared to that obser
- Page 113 and 114: Optimal Reservoir Operation Model w
- Page 115 and 116: all periods are computed using Eq.
- Page 117 and 118: (a) Calibration (b) Verification Fi
- Page 119 and 120: Characteristics of Heavy Metal Cont
- Page 121 and 122: 2. Materials and Method 2.1. Study
- Page 123 and 124: TABLE 2: Devices for collecting of
- Page 125 and 126: Calibration of Hargreaves Equation
- Page 127 and 128: Relative error (RE): Index of agree
- Page 129 and 130: Stochastic modelling of Contaminant
- Page 131 and 132: widely used for various fields such
- Page 133 and 134: show that Extvalue and Logistic dis
- Page 135 and 136: Efficiency of water and energy use
- Page 137: Pressure: it was obtained by means
- Page 141 and 142: Relationship among compaction, mois
- Page 143 and 144: Cylindrical containers (191mm diame
- Page 145 and 146: Figure 9 High compaction. Bulk dens
- Page 147 and 148: Simulation of water flow with root
- Page 149 and 150: water contents were almost greater
- Page 151 and 152: Operation and Energy Optimization M
- Page 153 and 154: Urmia Salt Lake Urmia FIGURE 1: Gha
- Page 155 and 156: changes have been done in system. F
- Page 157 and 158: Application of Surface Cover and So
- Page 159 and 160: significantly lower than those from
- Page 161 and 162: Choi, J. D., (1997). Effect of Rura
- Page 163 and 164: 1.1. Scope and aim The growth of th
- Page 165 and 166: Therefore, the remaining works are
- Page 167 and 168: network makes such volumes unaccept
- Page 169 and 170: Reclaimed wastewater reuse has been
- Page 171 and 172: Fig. 2 shows the monitoring results
- Page 173 and 174: 3. Conclusions Reclaimed wastewater
- Page 175 and 176: Q P Ia 2 P Ia S for P≥Ia Q 0
- Page 177 and 178: data P (mm), gauged in 130 pluviogr
- Page 179 and 180: TABLE 2: CN emp values obtained for
- Page 181 and 182: References Chapman, T. G. & Maxwell
- Page 183 and 184: This work, after applying Kennessey
- Page 185 and 186: TABLE 2 - Partial runoff coefficien
- Page 187 and 188: Figure 3 also reports a comparison
them cover similar percentages. During the highest energy consumption (February-March<br />
and October-November) this percentage increases considerably.<br />
Nevertheless, and according to the results, it can be observed that the use <strong>of</strong> the cheaper<br />
periods (P3 and P2) could be increased in the studied irrigation station. For this reason, it is<br />
possible to move consumptions from P1 period, and even from P2, to P3 (cheapest period),<br />
what would suppose a decrease in energy costs <strong>of</strong> about 27%.<br />
A recommended general measure is to study the <strong>of</strong>fers <strong>of</strong> the different companies annually,<br />
since most <strong>of</strong> them <strong>of</strong>fer great discounts in the first year.<br />
TABLE 2. Energy consumption for lettuce irrigation in the studied farm (2010-2011 season).<br />
Consumption period<br />
Active Energy<br />
Consumption (kWh)<br />
Reactive Energy<br />
Consumption (kVAr)<br />
Average<br />
Cosine <strong>of</strong> phi<br />
Monthly Bill (€)<br />
June 2010 9,049 3,982 0.92 1,708.44<br />
July 2010 2,660 2,068 0.79 561.36<br />
August 2010 247 227 0.74 141.63<br />
October 2010 11,670 5,857 0.89 2,032.33<br />
November 2010 10,735 3,491 0.95 1,723.95<br />
December 2010 5,018 0 0.95 1,708.44<br />
January 2011 5,688 7,598 0.60 1,845.23<br />
February 2011 11,816 6,632 0.87 2,071.15<br />
March 2011 10,515 6,947 0.83 2,091.63<br />
TOTAL 67,398 36,802 0.89 12,175.71<br />
Another feature to be taken into account is the correction <strong>of</strong> the power factor to values over<br />
0.95 in order to decrease the reactive energy consumption. For this purpose, an automatic<br />
capacitor bank is installed in the electric circuit. This way, a low value in the power factor or<br />
cosine <strong>of</strong> phi (see Table 2) may be due to the next reasons:<br />
Bad design <strong>of</strong> the automatic capacitor bank, since every month a surcharge depending<br />
on the reactive energy is applied. In this study, the power factor values were under<br />
0.95 except in December <strong>of</strong> 2010. Concretely, the surcharge for a power factor value<br />
between 0.8 and 0.95 is 0.041554 €·kVArh-1.<br />
Bad system maintenance. In this study, decreases <strong>of</strong> the power factor, and<br />
consequently an increment <strong>of</strong> the penalization, were registered in the monthly bills.<br />
This could be caused by the failure <strong>of</strong> one <strong>of</strong> the condensers. During January, a power<br />
factor <strong>of</strong> 0.6 was registered, what involves a penalization <strong>of</strong> 0.062332 €·kVArh-1. This<br />
supposed a surcharge <strong>of</strong> 132.3 € in a bill <strong>of</strong> 1,845.23€.<br />
The budget to repair the automatic capacitor bank is around 125€, whose cost could be<br />
recovered in a month. If a redesign <strong>of</strong> the automatic capacitor bank is chosen instead, the<br />
return period <strong>of</strong> the investment can increase up to 18 months. This measure will only<br />
decrease the costs produced by the reactive energy, but not the energy consumption costs.<br />
Maximum values <strong>of</strong> energy consumption (see Table 3) were registered during October <strong>of</strong><br />
2010 (seedling phase in three plots and beginning <strong>of</strong> rosette formation in one plot), January<br />
<strong>of</strong> 2011 (beginning <strong>of</strong> rosette formation in three plots, rosette formation phase in a plot and<br />
seedling phase in two plots), February <strong>of</strong> 2011 (rosette formation phase in four plots,<br />
beginning <strong>of</strong> rosette formation phase in two plots and seedling phase in one plot) and March<br />
<strong>of</strong> 2011 (heart formation phase and harvesting in two plots and rosette formation phase in<br />
five plots). During these months, highest demands <strong>of</strong> lettuce crops were registered. The total<br />
water volume was estimated for every cited month: 58,630 m 3 (October 2010), 28,724 m 3<br />
(January 2011), 59,671 m 3 (February 2011) and 53,100 m 3 (March 2011).


