poster - International Conference of Agricultural Engineering
poster - International Conference of Agricultural Engineering
poster - International Conference of Agricultural Engineering

Create successful ePaper yourself
Turn your PDF publications into a flip-book with our unique Google optimized e-Paper software.
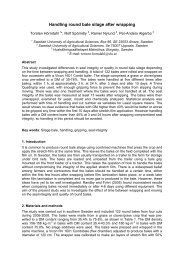
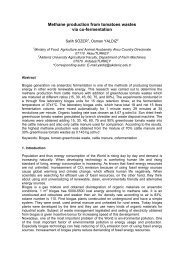
Daily Penman-Monteith sensitivity analysis in many subclasses climates<br />
based on extended-De Martonne classification<br />
Bahram Bakhtiari 1* , Amin Baghizadeh<br />
1 Department <strong>of</strong> Water <strong>Engineering</strong>, College <strong>of</strong> Agriculture, Shahid Bahonar University <strong>of</strong><br />
Kerman, Kerman, Iran<br />
2<br />
<strong>International</strong> Center for Science, High Technology & Environmental Sciences, Kerman, Iran<br />
Corresponding Author. Email: Drbakhtiari@uk.ac.ir<br />
Abstract<br />
ASCE daily Penman-Monteith model used in reference evapotranspiration (ET o ) estimation,<br />
has many climatic parameters. To get useful results from the model, every parameter is<br />
required to have a sensible value. In this study, a local sensitivity analysis <strong>of</strong> the<br />
standardized daily ASCE Penman-Monteith evapotranspiration equation to time variation <strong>of</strong><br />
four climatic variables, net radiation (R n ), vapor pressure deficit (VPD), wind speed (U 2 ) and<br />
air temperature (T) have been realized. Four different types <strong>of</strong> subclasses <strong>of</strong> arid and<br />
semiarid climates in Kerman province (South east <strong>of</strong> Iran) have been studied using daily<br />
data over a 17-year period (1998-2005) database. The studied regions <strong>of</strong> Kerman province<br />
based on extended-De Martonne classification as follows: Baft (semiarid cool), Bam (arid<br />
moderate), Kerman (arid cool) and Jir<strong>of</strong>t (arid warm). The results showed that, sensitivity<br />
coefficients <strong>of</strong> studied climatic variables were positive in all stations. Net radiation was the<br />
most sensitive variable in general, followed by, vapor pressure deficit, wind speed and air<br />
temperature. The sensitivity <strong>of</strong> evapotranspimtion rates to changes in vapor pressure deficit,<br />
wind speed, and air temperature is less in arid warm area than in arid and semiarid cool<br />
regions.<br />
Keywords: Climate data, Daily Penman–Monteith, evapotranspiration, Sensitivity coefficients<br />
1. Introduction<br />
Precise quantifications <strong>of</strong> crop evapotranspiration (ET c ) in irrigated agriculture are<br />
consequential for scheduling irrigation. With increasing pressure on water resources from<br />
competing sectors, great emphasis has been placed on water use efficiency in irrigated<br />
fields (Hatfield et al., 1996), particularly in semiarid environment irrigation projects. Accurate<br />
estimation <strong>of</strong> ET c is also essential for optimizing crop production and management practices<br />
to minimize surface and groundwater degradation. The quantification <strong>of</strong> evapotranspiration is<br />
normally based on the determination <strong>of</strong> reference evapotranspiration (ET o ). Reference<br />
evapotranspiration is defined as ‘‘the rate <strong>of</strong> evapotranspiration from an extensive area <strong>of</strong><br />
0.08–0.15 m high, uniform, actively growing, green grass that completely shades the soil and<br />
is provided with unlimited water and nutrients’’ (Allen et al., 1994). More recently, Allen et al.<br />
(1998) elaborated on the concept <strong>of</strong> ET o , referring to an ideal 0.12 m high crop with a fixed<br />
surface resistance <strong>of</strong> 70 s m-1 and an albedo <strong>of</strong> 0.23. ET o is widely used to estimate crop<br />
water use and water requirements by using appropriate crop coefficients (K c ). The crop<br />
coefficient is a dimensionless number that is multiplied by the ET o value to arrive at a crop<br />
ET (ET c ) estimate; ET c = K c ×ET o . The K c represents the integrated effect <strong>of</strong> changes in leaf<br />
area, plant height, irrigation method, rate <strong>of</strong> crop development, crop planting date, leaf area,<br />
canopy resistance, albedo, soil and climate conditions, and management practices<br />
(Doorenbos and Pruitt 1977). Different equations have been developed in attempts to model<br />
ET o , including water budget (e.g., Guitjens, 1982), mass-transfer (e.g., Harbeck, 1962),<br />
combination (e.g., Penman, 1948), radiation (e.g., Priestley and Taylor, 1972), and<br />
1