annual report 2011-12 - Heavy Engineering Corporation Limited
annual report 2011-12 - Heavy Engineering Corporation Limited annual report 2011-12 - Heavy Engineering Corporation Limited
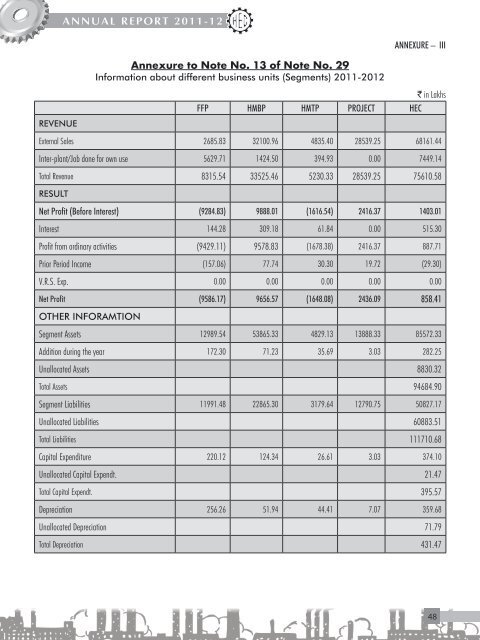
ANNUAL REPORT 2011-12 ANNEXURE – III REVENUE Annexure to Note No. 13 of Note No. 29 Information about different business units (Segments) 2011-2012 ` in Lakhs FFP HMBP HMTP PROJECT HEC External Sales 2685.83 32100.96 4835.40 28539.25 68161.44 Inter-plant/Job done for own use 5629.71 1424.50 394.93 0.00 7449.14 Total Revenue 8315.54 33525.46 5230.33 28539.25 75610.58 RESULT Net Profit (Before Interest) (9284.83) 9888.01 (1616.54) 2416.37 1403.01 Interest 144.28 309.18 61.84 0.00 515.30 Profit from ordinary activities (9429.11) 9578.83 (1678.38) 2416.37 887.71 Prior Period Income (157.06) 77.74 30.30 19.72 (29.30) V.R.S. Exp. 0.00 0.00 0.00 0.00 0.00 Net Profit (9586.17) 9656.57 (1648.08) 2436.09 858.41 OTHER INFORAMTION Segment Assets 12989.54 53865.33 4829.13 13888.33 85572.33 Addition during the year 172.30 71.23 35.69 3.03 282.25 Unallocated Assets 8830.32 Total Assets 94684.90 Segment Liabilities 11991.48 22865.30 3179.64 12790.75 50827.17 Unallocated Liabilities 60883.51 Total Liabilities 111710.68 Capital Expenditure 220.12 124.34 26.61 3.03 374.10 Unallocated Capital Expendt. 21.47 Total Capital Expendt. 395.57 Depreciation 256.26 51.94 44.41 7.07 359.68 Unallocated Depreciation 71.79 Total Depreciation 431.47 48
ANNUAL REPORT 2011-12 Additional Information Pursuant to the Provision Paragraph of 4A, 4B, 4C & 4D of Part -II Schedule - VI to the Companies Act. 1956 (` in Lakhs) Current Year Previous Year A.1 Employees who were in receipt of or were entitled to receive emoluments (including benefits) of ` 24,00,000.00 or more for the year (and ` 2,00,000 or more per month when employed for apart of the year for current year). A.2 Auditor's Expenses Nil Nil i Statutory Auditors Remuneration 1.44 1.44 ii Tax Audit Fees 0.20 0.20 B. Capacity and Production Licensed Capacity Installed Capacity Actual Production 2011-12 2010-11 2011-12 2010-11 2011-12 2010-11 III / II III / II Goods Manufactured :- Stage in Stage in M.T. M.T. M.T. M.T. M.T. M.T. Foundry Forge Plant. Grey Iron Castings 33345 33345 33345 33345 1450 1644 Steel Castings 40182 40182 40182 40182 3640 4340 Forging and Forged Rolls 41463 41463 41463 41463 3769 2052 Non Ferrous Castings 700 700 700 700 59 65 G.I. Moulds 1110 1110 1110 1110 169 82 Steel Ingots, Core and Synthetic Iron 40000 40000 40000 40000 3110 2933 Rolls (G.I. & Steel) 17740 17740 17740 17740 0 0 Bye-Product-Coal Tar 2039 2434 174540 174540 174540 174540 14236 13550 Notes : Production Figures are inclusive of production for inte plant transfer of 3932.52 MT (Prev.Yr 3594.61 MT ) & Job done for internal use of 6160.75 MT ( Prev.Yr 4665.73 MT) and are indicated on the production of individual shop against each license. Some of the finished products are used as inputs in other Shops. Production figures are as certified by the management 49
- Page 5 and 6: CONTENTS ANNUAL REPORT 2011-12 1. N
- Page 7 and 8: BOARD OF DIRECTORS (As on 30.11.201
- Page 9 and 10: ANNUAL REPORT 2011-12 DIRECTORS' RE
- Page 11 and 12: ANNUAL REPORT 2011-12 Gross Margin
- Page 13 and 14: ANNUAL REPORT 2011-12 The company d
- Page 15 and 16: ANNUAL REPORT 2011-12 iii) that the
- Page 17 and 18: • Replacement of centralized comp
- Page 19 and 20: ANNUAL REPORT 2011-12 Attendance of
- Page 21 and 22: Annexure to the Auditors Report ANN
- Page 23 and 24: 9. Statutory Dues A. According to t
- Page 25: ANNUAL REPORT 2011-12 COMMENTS OF T
- Page 28 and 29: OUR PROJECTS Conveyor System at New
- Page 30 and 31: OUR PRODUCTS CNC Deep Hole Boring M
- Page 32 and 33: ANNUAL REPORT 2011-12 service cost,
- Page 34 and 35: ANNUAL REPORT 2011-12 STATEMENT OF
- Page 36 and 37: ANNUAL REPORT 2011-12 NOTES FORMING
- Page 38 and 39: NOTE NO.-9 ANNUAL REPORT 2011-12 Ty
- Page 40 and 41: ANNUAL REPORT 2011-12 NOTES FORMING
- Page 42 and 43: ANNUAL REPORT 2011-12 NOTES FORMING
- Page 44 and 45: ANNUAL REPORT 2011-12 NOTES FORMING
- Page 46 and 47: ANNUAL REPORT 2011-12 NOTES FORMING
- Page 48 and 49: ANNUAL REPORT 2011-12 NOTES FORMING
- Page 50 and 51: ANNUAL REPORT 2011-12 NOTE NO. 29 N
- Page 52 and 53: ANNUAL REPORT 2011-12 12.11.2010. C
- Page 54 and 55: ANNUAL REPORT 2011-12 ANNEXURE - I
- Page 58 and 59: ANNUAL REPORT 2011-12 Heavy Machine
- Page 60 and 61: ANNUAL REPORT 2011-12 D. STOCK OF F
- Page 62 and 63: ANNUAL REPORT 2011-12 2011-12 2010-
- Page 65 and 66: kebâheveer keâer keâeÙe&#ecelee
ANNUAL REPORT <strong>2011</strong>-<strong>12</strong><br />
ANNEXURE – III<br />
REVENUE<br />
Annexure to Note No. 13 of Note No. 29<br />
Information about different business units (Segments) <strong>2011</strong>-20<strong>12</strong><br />
` in Lakhs<br />
FFP HMBP HMTP PROJECT HEC<br />
External Sales 2685.83 32100.96 4835.40 28539.25 68161.44<br />
Inter-plant/Job done for own use 5629.71 1424.50 394.93 0.00 7449.14<br />
Total Revenue 8315.54 33525.46 5230.33 28539.25 75610.58<br />
RESULT<br />
Net Profit (Before Interest) (9284.83) 9888.01 (1616.54) 2416.37 1403.01<br />
Interest 144.28 309.18 61.84 0.00 515.30<br />
Profit from ordinary activities (9429.11) 9578.83 (1678.38) 2416.37 887.71<br />
Prior Period Income (157.06) 77.74 30.30 19.72 (29.30)<br />
V.R.S. Exp. 0.00 0.00 0.00 0.00 0.00<br />
Net Profit (9586.17) 9656.57 (1648.08) 2436.09 858.41<br />
OTHER INFORAMTION<br />
Segment Assets <strong>12</strong>989.54 53865.33 4829.13 13888.33 85572.33<br />
Addition during the year 172.30 71.23 35.69 3.03 282.25<br />
Unallocated Assets 8830.32<br />
Total Assets 94684.90<br />
Segment Liabilities 11991.48 22865.30 3179.64 <strong>12</strong>790.75 50827.17<br />
Unallocated Liabilities 60883.51<br />
Total Liabilities 111710.68<br />
Capital Expenditure 220.<strong>12</strong> <strong>12</strong>4.34 26.61 3.03 374.10<br />
Unallocated Capital Expendt. 21.47<br />
Total Capital Expendt. 395.57<br />
Depreciation 256.26 51.94 44.41 7.07 359.68<br />
Unallocated Depreciation 71.79<br />
Total Depreciation 431.47<br />
48


