PMBOK 4th Edition Errata Sheet
PMBOK 4th Edition Errata Sheet
PMBOK 4th Edition Errata Sheet

You also want an ePaper? Increase the reach of your titles
YUMPU automatically turns print PDFs into web optimized ePapers that Google loves.
<strong>PMBOK</strong> ® Guide – Fourth <strong>Edition</strong><br />
<strong>Errata</strong><br />
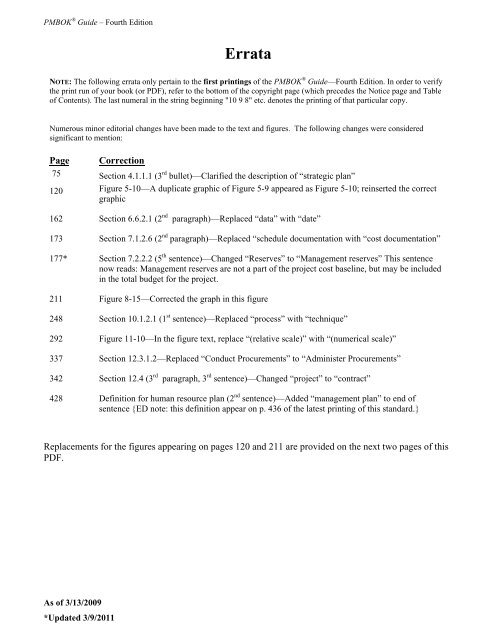
NOTE: The following errata only pertain to the first printings of the <strong>PMBOK</strong> ® Guide—Fourth <strong>Edition</strong>. In order to verify<br />
the print run of your book (or PDF), refer to the bottom of the copyright page (which precedes the Notice page and Table<br />
of Contents). The last numeral in the string beginning "10 9 8" etc. denotes the printing of that particular copy.<br />
Numerous minor editorial changes have been made to the text and figures. The following changes were considered<br />
significant to mention:<br />
Page<br />
75<br />
Correction<br />
Section 4.1.1.1 (3 rd bullet)—Clarified the description of “strategic plan”<br />
120 Figure 5-10—A duplicate graphic of Figure 5-9 appeared as Figure 5-10; reinserted the correct<br />
graphic<br />
162 Section 6.6.2.1 (2 nd paragraph)—Replaced “data” with “date”<br />
173 Section 7.1.2.6 (2 nd paragraph)—Replaced “schedule documentation with “cost documentation”<br />
177* Section 7.2.2.2 (5 th sentence)—Changed “Reserves” to “Management reserves” This sentence<br />
now reads: Management reserves are not a part of the project cost baseline, but may be included<br />
in the total budget for the project.<br />
211 Figure 8-15—Corrected the graph in this figure<br />
248 Section 10.1.2.1 (1 st sentence)—Replaced “process” with “technique”<br />
292 Figure 11-10—In the figure text, replace “(relative scale)” with “(numerical scale)”<br />
337 Section 12.3.1.2—Replaced “Conduct Procurements” to “Administer Procurements”<br />
342 Section 12.4 (3 rd paragraph, 3 rd sentence)—Changed “project” to “contract”<br />
428 Definition for human resource plan (2 nd sentence)—Added “management plan” to end of<br />
sentence {ED note: this definition appear on p. 436 of the latest printing of this standard.}<br />
Replacements for the figures appearing on pages 120 and 211 are provided on the next two pages of this<br />
PDF.<br />
As of 3/13/2009<br />
*Updated 3/9/2011
5 CHAPTER 5 − PRojECT SCoPE MAnAgEMEnT<br />
Aircraft<br />
System<br />
Project<br />
Management<br />
Training<br />
Data<br />
Air<br />
Vehicle<br />
Support<br />
Equipment<br />
Facilities<br />
Test and<br />
Evaluation<br />
System<br />
Engineering<br />
Management<br />
Equipment<br />
Training<br />
Technical<br />
Orders<br />
Organizational<br />
Level SE<br />
Base<br />
Buildings<br />
Mock-ups<br />
Supporting<br />
PM Activities<br />
Facilities<br />
Training<br />
Engineering<br />
Data<br />
Intermediate<br />
Level SE<br />
Maintenance<br />
Facility<br />
Operational<br />
Test<br />
Services<br />
Training<br />
Management<br />
Data<br />
Depot<br />
Level SE<br />
Developmental<br />
Test<br />
Test<br />
Airframe<br />
Engine<br />
Communication<br />
System<br />
Navigation<br />
System<br />
Fire Control<br />
System<br />
The WBS is illustrative only. It is not intended to represent the full project scope of any specific project,<br />
nor to imply that this is the only way to organize a WBS on this type of project.<br />
Figure 5-10. Sample Work Breakdown with Major Deliverables<br />
A Guide to the Project Management Body of Knowledge (<strong>PMBOK</strong> ® Guide) – Fourth <strong>Edition</strong>. ©2008 Project Management Institute, Inc. All Rights Reserved.<br />
Figure 5-10. Sample Work Breakdown with Major Deliverables<br />
Decomposition of the upper level WBS components requires subdividing the work for each of the<br />
deliverables or subprojects into its fundamental components, where the WBS components represent<br />
verifiable products, services, or results. The WBS can be structured as an outline, an organizational<br />
chart, a fishbone diagram, or other method. Verifying the correctness of the decomposition requires<br />
determining that the lower-level WBS components are those that are necessary and sufficient for<br />
completion of the corresponding higher level deliverables. Different deliverables can have different<br />
levels of decomposition. To arrive at a work package, the work for some deliverables needs to be<br />
decomposed only to the next level, while others need additional levels of decomposition. As the work<br />
is decomposed to greater levels of detail, the ability to plan, manage, and control the work is enhanced.<br />
However, excessive decomposition can lead to non-productive management effort, inefficient use of<br />
resources, and decreased efficiency in performing the work.<br />
Decomposition may not be possible for a deliverable or subproject that will be accomplished far<br />
into the future. The project management team usually waits until the deliverable or subproject is<br />
clarified so the details of the WBS can be developed. This technique is sometimes referred to as rolling<br />
wave planning.<br />
120<br />
A Guide to the Project Management Body of Knowledge (<strong>PMBOK</strong> ® Guide) — Fourth <strong>Edition</strong><br />
©2008 Project Management Institute, 14 Campus Blvd., Newtown Square, PA 19073-3299 USA
CHAPTER 8 − PRojECT QuAliTy MAnAgEMEnT<br />
8<br />
Pareto diagrams are conceptually related to Pareto’s Law, which holds that a relatively small number<br />
of causes will typically produce a majority of the problems or defects. This is commonly referred to as<br />
the 80/20 principle, where 80% of the problems are due to 20% of the causes. Pareto diagrams can<br />
also be used to summarize various types of data for 80/20 analyses.<br />
Rate of Defects<br />
40<br />
35<br />
30<br />
25<br />
20<br />
15<br />
10<br />
5<br />
0<br />
Frequency<br />
Cumulative<br />
Process<br />
Instructions<br />
Pareto Diagram of Causes of Late Time Entries<br />
Insufficient<br />
Time<br />
Travel<br />
System<br />
Failure<br />
Occurrences<br />
Management<br />
Direction<br />
Other<br />
30 25 15 11 5 14<br />
30% 55% 70% 81% 86% 100%<br />
100%<br />
90%<br />
80%<br />
70%<br />
60%<br />
50%<br />
40%<br />
30%<br />
20%<br />
10%<br />
0%<br />
Percent of Defects<br />
Figure 8-15. Pareto Diagram<br />
Figure 8-15. Pareto Diagram<br />
A Guide to the Project Management Body of Knowledge (<strong>PMBOK</strong> ® Guide) – Fourth <strong>Edition</strong>. ©2008 Project Management Institute, Inc. All Rights Reserved.<br />
.6 Run Chart<br />
Similar to a control chart without displayed limits, a run chart shows the history and pattern of<br />
variation. A run chart is a line graph that shows data points plotted in the order in which they occur.<br />
Run charts show trends in a process over time, variation over time, or declines or improvements in a<br />
process over time. Trend analysis is performed using run charts and involves mathematical techniques<br />
to forecast future outcomes based on historical results. Trend analysis is often used to monitor:<br />
A Guide to the Project Management Body of Knowledge (<strong>PMBOK</strong> ® Guide) — Fourth <strong>Edition</strong><br />
©2008 Project Management Institute, 14 Campus Blvd., Newtown Square, PA 19073-3299 USA<br />
211