Mortality Surveillance - Western Cape Government
Mortality Surveillance - Western Cape Government
Mortality Surveillance - Western Cape Government

You also want an ePaper? Increase the reach of your titles
YUMPU automatically turns print PDFs into web optimized ePapers that Google loves.
<strong>Western</strong> <strong>Cape</strong> Burden of Disease<br />
Reduction Project<br />
Volume 2 of 7<br />
Institutionalising a mortality<br />
surveillance system in the<br />
<strong>Western</strong> <strong>Cape</strong> Province<br />
to measure the Burden of<br />
Disease and the impact of<br />
preventive interventions<br />
Final Report 2007<br />
D Bourne<br />
D Bradshaw<br />
P Groenewald<br />
L Brody<br />
R Laubscher<br />
J Daniels<br />
D Jefferies<br />
R Matzopoulos<br />
N Shaikh<br />
NT Naledi<br />
D Blease<br />
N Zinyaktira<br />
M van Niekerk<br />
W van der Merwe
<strong>Western</strong> <strong>Cape</strong> Burden of Disease<br />
Reduction Project<br />
Volume 2 of 7<br />
Institutionalising a mortality<br />
surveillance system in the<br />
<strong>Western</strong> <strong>Cape</strong> Province to<br />
measure the Burden of Disease<br />
and the impact of<br />
preventive interventions<br />
Final Report 2007<br />
D Bourne, R Matzopoulos, D Bradshaw, N Shaikh,<br />
P Groenewald, NT Naledi, L Brody, D Blease,<br />
R Laubscher, N Zinyaktira, J Daniels, M van Niekerk,<br />
D Jefferies, W van der Merwe<br />
Copies of this report may be downloaded from<br />
http://www.publichealth.uct.ac.za/
Contents<br />
Executive Summary: Workteam One ………………………………………………………… i<br />
Selected Results ………………………………………………………………………………vi<br />
<strong>Cape</strong> Town …………………………………………………………………………… vi<br />
Boland-Overberg Region …………………………………………………… viii<br />
<strong>Western</strong> <strong>Cape</strong> Province ……………………………………………………… ix<br />
Conclusions and Recommendations …………………………………………… x<br />
1. Report on cause of death and premature mortality in <strong>Cape</strong> Town,<br />
2001-2004 …………………………………………………………………………………… 1<br />
2. Report on cause of death and premature mortality in the Boland-<br />
Overberg Region, 2004-2005 ……………………………………………………… 76<br />
3. Report on <strong>Western</strong> <strong>Cape</strong> Province <strong>Mortality</strong>, 1997–2002.<br />
An analysis of empirical cause of death data collected<br />
by Statistics South Africa from death notifications …………………… 113<br />
Appendix: A comparative risk assessment for South Africa, 2000 …… 164
Executive Summary: Workteam One<br />
David Bourne<br />
Background<br />
The main task of Workteam One in the Burden of Disease (BoD) Project<br />
has been to review the empirical data available for Burden of Disease<br />
estimation in the province and through this to examine the prospects, and<br />
prepare, for the institutionalization of mortality surveillance within the<br />
Provincial <strong>Government</strong> system, in particular within the Department of<br />
Health.<br />
The BoD measure involves calculations using mortality and morbidity.<br />
<strong>Mortality</strong> is a crucial component of the BoD and captures a large part of<br />
the burden (with the exception of mental health disorders) and morbidity<br />
estimates can usually be derived from knowledge of morbidity/mortality<br />
ratios in the WHO Global Burden of Disease Study [Murray & Lopez,<br />
1996].<br />
The MRC Burden of Disease Unit, which is a contributor to the Provincial<br />
BoD Project, has produced estimates of the BoD, both for South Africa as<br />
a whole, as well as provincial estimates of mortality for the year 2000.<br />
The MRC is also currently preparing a comparative risk assessment which<br />
examines risk factors for the various components of the BoD for the year<br />
2000 for South Africa The year 2000 estimates assisted in the<br />
identification of the reviews that have been conducted in the BoD project<br />
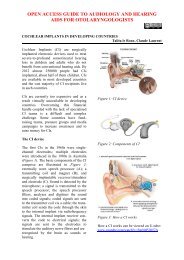
Official mortality statistics are currently produced by Statistics South<br />
Africa. Since 1997 official mortality statistics have not been broken down<br />
by Province but are available on a national basis only. The current official<br />
system for processing death data is shown in schematic form in Figure 1<br />
overleaf. In contrast, <strong>Cape</strong> Town Metropole has been collecting its own<br />
cause of death statistics which can be analysed at sub-district level. This<br />
system has been extended to the Boland/Overberg health region. The<br />
MRC/UNISA Crime, Violence and Injury Lead Programme has been<br />
collecting information from mortuaries on injury related deaths. The MRC<br />
BoD Research Unit has established a rapid mortality surveillance system<br />
based on basic details of deaths that are included on the population<br />
register.<br />
Methods<br />
In order to provide a more up-to-date mortality assessment, Workteam<br />
One has mainly been involved in developing systems to provide mortality<br />
data for the <strong>Western</strong> <strong>Cape</strong> that are accurate, timely, and capable of fine<br />
spatial dis-aggregation within the Province.<br />
i
Fig 1 Current official system for processing mortality data<br />
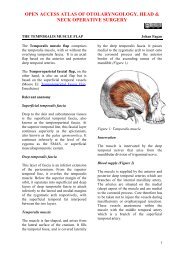
Workteam One has thus adopted a four-fold approach to collecting better<br />
data.<br />
1. The first approach involves consolidating the current mortality<br />
surveillance systems and refining the system to do it in-house, as a<br />
special project involving the MRC BoD Unit, the <strong>Cape</strong> Town<br />
Metropole, the Provincial Health Department and Project members,<br />
with better quality controls for data collection and analysis. This<br />
builds on the local level mortality surveillance system that has been<br />
instituted in the Metropole for over five years as a collaborative<br />
project between the Metropole, MRC and UCT. A similar system was<br />
instituted in the Boland/Overberg Region, beginning in 2004.<br />
This system is illustrated in Figure 2, and shows the source of the<br />
data utilised in Paper 1 in this volume for <strong>Cape</strong> Town mortality and<br />
in Paper 2 for mortality in Boland/Overberg.<br />
ii
Fig 2 Current Burden of Disease Project system for processing<br />
mortality data<br />
The BoD project has enabled a common reporting format and<br />
methodology to be established between the Metropole and the<br />
Province. This is one of the key steps in the process of<br />
institutionalising the mortality surveillance system within<br />
government. It is the intention that the Provincial <strong>Government</strong> roll<br />
out such systems to cover the four remaining health districts in the<br />
Province with the institutionalisation will involve a close and formal<br />
relation between the Provincial Department of Health and the Dept<br />
of Home Affairs.<br />
The proposed, finally institutionalized local mortality surveillance<br />
system is shown in Figure 3 on the following page.<br />
2. The second approach has been to utilise data from Statistics South<br />
Africa, which has generated Paper 3 for <strong>Western</strong> <strong>Cape</strong> mortality as<br />
a whole. These data have been specially tabulated on a complete<br />
provincial basis, though not with any further spatial disaggregation.<br />
This data is still available for analysis up to 2002, although data up<br />
to 2005 will become available later this year. The results of analysis<br />
of these data have been somewhat disappointing, in that, although<br />
they have indicated a considerable and rapid change in mortality in<br />
iii
Fig 3. Proposed <strong>Western</strong> <strong>Cape</strong> system for processing mortality data<br />
the province, the data are temporally very far behind those that can<br />
be collected directly using the first approach above. The absence of<br />
detailed spatial breakdown below the provincial level is a serious<br />
drawback, as is the lack of information regarding the causes of<br />
injury deaths. There have also been serious errors detected in the<br />
coding of causes of death among infants, which makes much of the<br />
Statistics SA data for this age group invalid.<br />
3. The third approach has been to obtain data directly from the<br />
Population Register of the Dept of Home Affairs. This data is not<br />
publicly available. It has the disadvantage of only recording those<br />
deaths which have an official ID number, which has nevertheless<br />
proved generally adequate. It is also the most up-to-date of all<br />
systems discussed above with data being available within a month<br />
or two after death. There are problems with the cause-of-death<br />
classification and it has proved possible to use only a crude<br />
classification, separating causes of death into natural and nonnatural<br />
(i.e. external) categories.<br />
Spatial disaggregation is limited by the distribution of the various<br />
offices of the Department of Home Affairs. It does however have<br />
considerable utility as an audit tool for checking the completeness<br />
of the data currently being collected in the Metropole and Boland/<br />
Overberg. Ongoing analysis of these data, which is not yet<br />
iv
complete, has led to very up to date information on provincial postneonatal<br />
mortality rates, revealing a likely effect of the Provincial<br />
Prevention of Mother-To-Child Transmission (PMTCT) intervention<br />
programme to interrupt vertical HIV transmission. Childhood<br />
diseases have been identified by this Project as one of the top 5<br />
contributors to the BoD. Consequently, linking this source of<br />
mortality data to registered births (which are known at municipal<br />
level) can lead to extremely useful and rapid information on<br />
neonatal, infant and child mortality, as well as maternal mortality<br />
and the situation with regard to orphans.<br />
4. The fourth approach is to integrate data from the mortuaries in the<br />
<strong>Western</strong> <strong>Cape</strong> (now a Provincial responsibility falling under the<br />
Department of Health) into these other systems to provide a level<br />
of detail on violent death not currently obtainable in the national<br />
systems. The UNISA/MRC Non-natural Injury <strong>Surveillance</strong> System<br />
is an example of an existing system based on mortuary data.<br />
Thus a combination of data collected directly from Home Affairs coded and<br />
analysed within the province, with input from UCT and the MRC,<br />
combined with an audit from the population register, and injury data from<br />
the mortuaries will provide the province with an institutionalized and<br />
integrated rapid mortality surveillance system, as depicted in Figure 3 that<br />
can not only be used for Burden of Disease estimates, but also for<br />
monitoring and evaluation of Provincial inequity and interventions<br />
intended to reduce the Provincial BoD. This remains the principal aim of<br />
the Provincial BoD project.<br />
Workteam One is currently working on the improvement of estimates for<br />
morbidity arising from mental health disorders as this BoD category has a<br />
larger morbidity component than a mortality component.<br />
v
Selected Results<br />
<strong>Cape</strong> Town<br />
The <strong>Cape</strong> Town routine local mortality surveillance system provides a wealth of<br />
data on the health of the population in <strong>Cape</strong> Town. This data has provided an<br />
opportunity to assess priority health intervention programmes in terms of<br />
mortality, where appropriate, for the first time.<br />
<strong>Cape</strong> Town is experiencing a changing pattern of mortality.<br />
For females, while the overall age standardized mortality rate has not<br />
changed during these 4 years, there has been an increase in HIV/AIDS<br />
mortality and a decrease in the non-communicable disease death rate.<br />
The overall age standardized mortality rate for males is much higher<br />
than that for females and has also declined slightly during this period. The<br />
death rates from injuries and from non-communicable disease have decreased<br />
while there has been an increase in the HIV/AIDS mortality rates.<br />
The differential pattern of mortality between the various subdistricts is<br />
marked, and shows the still existing patterns of inequity in the City. Such<br />
differentials can be masked when mortality measures are aggregated,<br />
making the point that it is essential that health information be collected at the<br />
lowest or smallest possible level of spatial disaggregation.<br />
While HIV/AIDS mortality has increased dramatically since 2001, it<br />
appears to have stabilised in 2004, possibly demonstrating the impact of<br />
the PMTCT and ARV programmes (the <strong>Cape</strong> Town data for 2005 is not yet<br />
complete)<br />
The data for 2001 to 2004 show that HIV mortality has become the<br />
leading cause of premature mortality in the city, and that TB remains in<br />
third place. HIV/AIDS and TB are now closely linked. Aside from TB being one<br />
of the indicator conditions for AIDS, there is clear evidence that the TB<br />
epidemic is being fuelled by the HIV epidemic. These data therefore<br />
reflect the impact of the dual HIV/AIDS and TB epidemics in this province.<br />
Where HIV/AIDS and TB were reported on the death certificate the underlying<br />
cause was assume to be HIV/AIDS in accordance with ICD 10 guidelines.<br />
However, for TB programme purposes this co-morbidity was recorded.<br />
vi
<strong>Cape</strong> Town (Contd.)<br />
<strong>Mortality</strong> due to injuries is extremely high although there is evidence<br />
of a declining trend. However, injury mortality rates particularly homicide<br />
and road traffic fatalities are still amongst the highest in the world,<br />
particularly amongst men. Of particular concern are the high homicide and<br />
road traffic injury fatality rates among the male youth. This is linked to<br />
alcohol and other substance abuse but limited routine data is collected in<br />
this area. Urgent attention needs to be given to identifying and implementing<br />
strategies to prevent injuries.<br />
Diabetes, stroke and ischaemic heart disease are all among the leading<br />
causes of premature mortality and have shifted rankings over this short<br />
period of surveillance with diabetes going from 8 th in 2001 to 5 th place in<br />
2004. <strong>Mortality</strong> rates due to non communicable diseases are high with<br />
variations along the lines of the epidemiological transition. Non communicable<br />
diseases account for a high proportion of premature mortality in adult women.<br />
Smoking rates are high in the “coloured” population especially among<br />
females.<br />
Child mortality appears to have remained constant over this period but<br />
there is an unexpected increase in mortality from low birth weight that<br />
needs further investigation. There is a suggestion that child mortality due to<br />
HIV/AIDS has started decreasing. However, as indicated above, the study<br />
period over which this has been observed covers only the beginning of the full<br />
scale PMTCT roll out.<br />
The absence of the impact of mental health disorders is noted when<br />
using only mortality data.<br />
As a consequence of the information emerging from the <strong>Cape</strong> Town mortality<br />
surveillance system, emerging health issues and vulnerable groups can<br />
be identified and targeted for interventions. Moreover, interventions can<br />
be monitored using these same data.<br />
Khayelitsha and Nyanga have a considerably higher BoD than other subdistricts<br />
in the Metropole. However, despite an increase in HIV/AIDS mortality<br />
in Khayelitsha, overall mortality has decreased in this sub-district, mainly due<br />
to a reduction in injury mortality. This may be partly due to a multisectoral<br />
intervention led by the Department of Safety and Security, which prioritised<br />
certain police stations, including Khayelitsha, for additional resources and<br />
attention In Khayelitsha, for example, an operational centre and 2 new police<br />
stations were built and resourced, sector policing was introduced, community<br />
partnerships were forged and shebeen trading hours were restricted.<br />
vii
Boland /Overberg<br />
Boland/Overberg is experiencing an even more rapid changing pattern<br />
of mortality.<br />
In the Boland/Overberg region or district changing mortality is noticed<br />
over even a very short period. The top four causes of death have<br />
remained the same between 2004 and 2005 but the ranking has changed.<br />
Tuberculosis has become the leading cause of premature mortality in 2005<br />
after ranking second to homicide in 2004. Homicide now ranks third after<br />
HIV/AIDS in second place, with road traffic accidents ranking fourth. These<br />
top four conditions account for 40% of the premature mortality in the region.<br />
Spatial variation between sub-districts is marked for many conditions.<br />
Some highlights of the findings for the Boland/Overberg region are:<br />
Tuberculosis is the leading cause of mortality in the region with mortality<br />
rates much higher than those experienced in <strong>Cape</strong> Town:<br />
(86 per 100 000 vs 50 per 100 000 in 2004).<br />
HIV/AIDS mortality rates have continued to increase, but are lower than<br />
those in <strong>Cape</strong> Town (50 per 100 000 vs 80 per 100 000). The increase in<br />
mortality in Witzenberg, due to a significant increase in HIV/AIDS mortality<br />
and a marked increase in mortality due to tuberculosis, is cause for concern.<br />
Homicide mortality rates decreased between 2004 and 2005, amongst<br />
males. The profile of homicide is quite different from that found in <strong>Cape</strong><br />
Town: the use of firearms is very limited in the Boland/Overberg and homicide<br />
rates amongst females are almost double those experienced in <strong>Cape</strong> Town.<br />
(This differentiation of the causes of violent death is not possible when using<br />
Statistics South Africa data).<br />
Overall, mortality rates due to non-communicable diseases in Boland Overberg<br />
are slightly lower than those in <strong>Cape</strong> Town (577 vs 626 per 100 000). There<br />
are however differences in the profile, with mortality rates due to<br />
cardiovascular conditions and cancers being similar whilst mortality due to<br />
respiratory conditions is higher in the Boland/Overberg than in <strong>Cape</strong><br />
Town, and diabetes mortality rates are lower.<br />
Infant mortality has remained fairly constant in the Boland Overberg since<br />
1997 with the suggestion of a downward trend. However, there is marked<br />
variation between sub-districts with Witzenberg having the highest rates.<br />
Infant mortality rates in the Boland Overberg (about 31 per 1000 LB) are<br />
higher than in <strong>Cape</strong> Town (24 per 1000 LB). Prematurity and low birth<br />
weight are the leading cause of neonatal deaths while the leading<br />
cause of death in infants is diarrhoea. Ill-defined deaths rank second and<br />
account for a high proportion of deaths in late neonatal and post-neonatal<br />
infants.<br />
viii
<strong>Western</strong> <strong>Cape</strong> Province (from Statistics South Africa Data)<br />
In spite of its lack of timeliness, and spatial disaggregation, this analysis of a<br />
special tabulation of data for the <strong>Western</strong> <strong>Cape</strong>, supplied by Statistics South<br />
Africa has revealed much about the mortality in the province. It is clear that<br />
the mortality profile is somewhat different from the national profile.<br />
The <strong>Western</strong> <strong>Cape</strong> also experiences the quadruple burden that has been<br />
described as the combination of pre-transitional conditions related to underdevelopment,<br />
non-communicable diseases, injuries and HIV/AIDS. However,<br />
this data shows that the HIV/AIDS epidemic is at a lower scale than in<br />
other provinces and that injuries and non-communicable diseases are<br />
more pronounced.<br />
There are pronounced gender differences in the registered deaths. There<br />
are consistently more male deaths than females, with the province having<br />
more females than males. Child mortality is generally higher for males<br />
than for females, which is also reflected in the <strong>Western</strong> <strong>Cape</strong> data. In the age<br />
groups over 5 years, the high injury burden contributes substantially to the<br />
higher numbers of male deaths. However, in 1997 there was also a<br />
consistently higher number of male deaths from natural causes across all<br />
ages. This appears to be a result of the higher number of TB deaths among<br />
males as well as cardiovascular and respiratory causes which would be<br />
related to the higher tobacco and alcohol use among males. Over the period<br />
1997 to 2002, there was a rapid increase in the number of young adult<br />
deaths between 20 and 59 in males and 15 and 49 in females, resulting from<br />
increases in HIV/AIDS and related conditions. By 2002, the number of<br />
natural deaths among women aged 20- 29 years exceeded the number<br />
of deaths among males. In the 60+ age group the numbers of male and<br />
female deaths are similar, but the female deaths occur at much older ages<br />
than males. The nature of non-communicable diseases differs between males<br />
and females. Stroke is a major cause of death in the province. However,<br />
males appear to have the occurrence of ischaemic heart at younger ages while<br />
females have diabetes at younger ages. It will be important to calculate age<br />
specific rates in the older ages to assess the trends.<br />
Nevertheless, the data collected directly from Home Affairs data (currently for<br />
<strong>Cape</strong> Town and the Boland/Overberg region) provides very much better quality<br />
than that which can be supplied by Statistics South Africa, and should<br />
continue to be the primary source of mortality data.<br />
ix
Conclusions and Recommendations<br />
Some progress has been made during the first year of the Provincial BoD<br />
Project in institutionalising an integrated mortality surveillance system drawing<br />
from all available sources of mortality data in the most appropriate manner for<br />
the task at hand.<br />
The richness of the information arising from mortality data for the Province<br />
and the value that has already been added and could be added on an ongoing<br />
basis into the future are illustrated by the 3 papers produced by Workteam 1.<br />
This work provides a substantial and concrete basis for an intelligence function<br />
of government which may be repeatedly used to establish where the Province<br />
is with regard to its health status, and to monitor and evaluation governmental<br />
and other intervention programmes aimed at the reduction of the BoD over<br />
time. There is also possibility for transforming the pattern or profile of the<br />
BoD based on this type of intelligence system.<br />
The BoD project is small while the mortality surveillance task is large. During<br />
the course of this first year it became obvious that the Project resources are<br />
not able to substitute for Provincial <strong>Government</strong> institutionalisation in<br />
operating this surveillance system. A strong recommendation from Workteam<br />
1 is that the Provincial Department of Health create the appropriate permanent<br />
and routine structures and allocate the necessary resources to sustainably roll<br />
out the integrated mortality surveillance system (as depicted in Figure 3) to all<br />
6 districts over the next few years. The role of Project members in this<br />
process became increasingly clear over the past year as that of guidance,<br />
support and training in the collection and processing of quality data allowing<br />
valid information on the state and trends for mortality in the Province.<br />
Additionally, the project members are able to assist with analysis of these<br />
improved data and with the further institutionalisation of analytic methods and<br />
the production of appropriate indicators by Provincial staff.<br />
For Year 2 Workteam 1 envisages aligning its activities with those listed at the<br />
end of the Overview Chapter of the full Report. Specifically, this includes<br />
continuing with the Provincial institutionalisation of mortality surveillance<br />
through the rollout of the rapid mortality surveillance system to more districts.<br />
It is also hoped that Workteam 1 can become involved together with the other<br />
members of the Project in an integrated intervention in a multiply deprived<br />
setting as outlined at the end of the Overview Chapter.<br />
x
References<br />
Murray C, Lopez A eds. (1996) The Global Burden of Disease, vol. 1.<br />
Cambridge, MA: Harvard University Press.<br />
Reports which follow in Volume 2<br />
Groenewald P, Bradshaw D, Daniels J, Matzopoulos R, Bourne D, Shaikh N,<br />
Blease D, Naledi NT. (2007) Report on cause of death and premature<br />
mortality in <strong>Cape</strong> Town, 2001-2004<br />
Groenewald P, Bradshaw D, van Niekerk M, Jefferies D , van der Merwe W.<br />
(2007) Report on cause of death and premature mortality in the Boland<br />
Overberg Region, 2004-2005<br />
Brody L, Bradshaw D, Bourne D, Laubscher J (2007) Report on <strong>Western</strong> <strong>Cape</strong><br />
Province <strong>Mortality</strong> 1997 – 2002. An analysis of empirical cause of death<br />
data collected by Statistics South Africa from death notifications<br />
xi
REPORT 1<br />
Cause of death and premature mortality<br />
in <strong>Cape</strong> Town, 2001-2004<br />
Pam Groenewald, Debbie Bradshaw,<br />
Johan Daniels, Richard Matzopoulos,<br />
David Bourne, Najma Shaikh,<br />
David Blease, Nesbert Zinyakatira<br />
and Tracy Naledi<br />
May 2007
Contents<br />
Abstract ..........................................................................................................1<br />
Introduction ..........................................................................................................3<br />
Methods and data quality ........................................................................................5<br />
Cause of death data......................................................................................5<br />
Population estimates for the health sub-districts ...............................................9<br />
<strong>Mortality</strong> in <strong>Cape</strong> Town..........................................................................................10<br />
Overview of mortality..................................................................................10<br />
Trends in premature mortality......................................................................13<br />
Sub-district variations .................................................................................16<br />
Important conditions ............................................................................................20<br />
HIV and TB................................................................................................20<br />
Variation between sub-districts.....................................................................20<br />
Age and gender differences..........................................................................21<br />
Injuries.....................................................................................................22<br />
Non-communicable diseases ........................................................................28<br />
Child health ...............................................................................................35<br />
Infant mortality..........................................................................................36<br />
Child mortality (1 - 4 years).........................................................................42<br />
Children of 5 - 9 years ................................................................................46<br />
Children of 10 - 14 years.............................................................................47<br />
Children of 15 - 19 years.............................................................................48<br />
Women’s health .........................................................................................49<br />
Men’s health ..............................................................................................52<br />
Discussion ........................................................................................................54<br />
Recommendations ................................................................................................56<br />
Appendix 1: Exclusions from <strong>Cape</strong> Town mortality surveillance data 2001 - 2004 ..........58<br />
Appendix 2: Completeness of vital registration in <strong>Cape</strong> Town......................................59<br />
Appendix 3: CARe Population estimates for <strong>Cape</strong> Town Metropole, 2001-2004 12 ............64<br />
Appendix 4: Population estimates for males for sub-districts of <strong>Cape</strong> Town<br />
Metropole, 2001 – 2004.......................................................................65<br />
Appendix 5: Population estimates for females for sub-districts of <strong>Cape</strong> Town<br />
Metropole, 2001 – 2004.......................................................................69<br />
References ........................................................................................................73
List of Tables<br />
Table 1:<br />
Table 2:<br />
Table 3:<br />
Socio-economic indicators for <strong>Cape</strong> Town by old and interim sub-districts........8<br />
Leading 10 causes of premature mortality (YLLs) for <strong>Cape</strong> Town and old<br />
sub-districts, 2004.................................................................................16<br />
Comparison of National, <strong>Western</strong> <strong>Cape</strong>, and <strong>Cape</strong> Town<br />
age-standardised mortality rates for non-communicable diseases .................28<br />
Table 4: Epidemiological transition of cardiovascular diseases 20 ................................30<br />
Table 5: Age distribution of deaths under 19 years .................................................35<br />
Table 6: Childhood mortality rates, <strong>Cape</strong> Town 2004...............................................36<br />
List of Figures<br />
Figure 1: Map showing old health sub-districts in the <strong>Cape</strong> Metropole ........................7<br />
Figure 2: Age distribution of deaths by cause group and gender,<br />
<strong>Cape</strong> Town, 2004 ................................................................................11<br />
Figure 3: Age-standardised mortality rate by broad cause group by sex for<br />
<strong>Cape</strong> Town, 2001-2004........................................................................12<br />
Figure 4: Top 10 causes of premature mortality (YLLs) for <strong>Cape</strong> Town, 2001<br />
and 2004 ...........................................................................................13<br />
Figure 5: Top 10 causes of premature mortality (YLLs) by sex for <strong>Cape</strong> Town,<br />
2001 and 2004 ...................................................................................14<br />
Figure 6: Age-standardised premature mortality rates per 100 000 by broad<br />
cause group for <strong>Cape</strong> Town sub-districts, 2001 and 2004..........................18<br />
Figure 7: YLLs per 100 000 by cause group and HIV/AIDS for <strong>Cape</strong> Town and<br />
sub-districts, 2001 and 2004 ................................................................19<br />
Figure 8: Age-standardised death rates for TB, HIV+TB and HIV for persons<br />
by sub-district, <strong>Cape</strong> Town, 2001 and 2004 ............................................21<br />
Figure 9: Age-specific death rates for HIV and TB by gender,<strong>Cape</strong> Town,<br />
2001 and 2004 ...................................................................................22<br />
Figure 10: Age-standardised death rates (pooled estimates) due to injuries by<br />
sub-district, <strong>Cape</strong> Town 2001 – 2004.....................................................23<br />
Figure 11: Firearm and non-firearm homicide rates in <strong>Cape</strong> Town, 2001 - 2004 7 .........24<br />
Figure 12: Age-standardised death rates (average) due to homicide by<br />
sub-district, <strong>Cape</strong> Town 2001 – 2004.....................................................25<br />
Figure 13: Age-specific homicide death rates by gender, <strong>Cape</strong> Town, 2001 – 2004 ......26<br />
Figure 14: Age-standardised death rates (pooled estimates) due to road traffic<br />
injuries by sub-district, <strong>Cape</strong> Town, 2001 – 2004.....................................27<br />
Figure 15: Age-standardised cause of death rates (pooled estimates) for<br />
non-communicable diseases by sub-district, <strong>Cape</strong> Town, 2001 - 2004 ........29<br />
Figure 16: Age-standardised death rates (pooled estimates) for IHD,<br />
stroke, hypertension and diabetes by gender and sub-district,<br />
<strong>Cape</strong> Town, 2001 - 2004......................................................................31<br />
Figure 17: Trends in age-standardised death rates per 100 000 population for<br />
selected non-communicable diseases, <strong>Cape</strong> Town, 2001 - 2004 .................32<br />
Figure 18: Age-standardised death rates (pooled estimates) for COPD and lung<br />
cancer by gender and sub-district, <strong>Cape</strong> Town, 2001 - 2004......................33<br />
Figure 19: Age-standardised death rates (pooled estimates) for oesophagus<br />
cancer and colon cancer by gender and sub-district, <strong>Cape</strong> Town,<br />
2001 - 2004.......................................................................................34<br />
Figure 20: Trends in infant mortality rate per 1000 live births, <strong>Cape</strong> Town,<br />
2001 - 2004.......................................................................................37
Figure 21: Trends in
Abstract<br />
This report covers detailed cause of death data for the <strong>Cape</strong> Town Metropole for<br />
the period 2001 to 2004 (data for 2005 were incomplete). Local mortality<br />
surveillance is required as mortality reports published by Statistics South Africa<br />
are not released below a national level. The information in this report has been<br />
collected directly from the local offices of the Department of Home Affairs and<br />
supplemented by information collected from local mortuaries. The cause of death<br />
coding has been done by trained clerks at the City of <strong>Cape</strong> Town. Deaths are<br />
analysed by age, cause and gender for 11 sub-districts. Premature mortality and<br />
age-standardised rates are calculated and compared across sub-districts.<br />
Temporal trends are given for major cause groupings. Up-to-date population<br />
estimates for each sub-district and estimates of the completeness of death<br />
registration were calculated.<br />
The <strong>Cape</strong> Town routine local mortality surveillance system provides a wealth of<br />
data on the health of the population in <strong>Cape</strong> Town. For the first time, these data<br />
have provided an opportunity to assess priority programmes in terms of<br />
mortality, where appropriate. In addition, emerging health issues and vulnerable<br />
groups can be identified and targeted for interventions.<br />
HIV/AIDS mortality has increased dramatically since 2001; however, it appears<br />
to have stabilised in 2004, possibly demonstrating the impact of the prevention<br />
of mother-to-child transmission (PMTCT) and antiretroviral (ARV) programmes.<br />
<strong>Mortality</strong> due to injuries is extremely high although, there is evidence of a<br />
declining trend. However, injury mortality rates - particularly homicide and road<br />
traffic injuries - are still among the highest in the world, particularly in men. Of<br />
particular concern are the high homicide and road traffic injury fatality rates<br />
among the male youth. This is linked to alcohol and other substance abuse, but<br />
limited routine data are collected on this aspect. Urgent attention needs to be<br />
given to identifying and implementing strategies to prevent injuries.<br />
<strong>Mortality</strong> rates due to non-communicable diseases are high, with variations along<br />
the lines of the epidemiological transition. Non-communicable diseases account<br />
for a high proportion of premature mortality, particularly among adult women.<br />
Smoking rates are particularly high in the coloured population, especially among<br />
females.<br />
Child mortality appears to have remained constant over this period, but there is<br />
a peculiar increase in mortality from low birthweight that needs further<br />
investigation. There is a suggestion that child mortality due to HIV/AIDS has<br />
started decreasing (however, this study period covers only the beginning of the<br />
full-scale PMTCT roll-out).<br />
Analysis of the 2001 mortality data for the City of <strong>Cape</strong> Town highlighted the<br />
differentials in levels of mortality across the city, as well as the quadruple burden<br />
of disease (infectious diseases; injuries, especially among young adults; noncommunicable<br />
diseases later in life; and the growing HIV/AIDS epidemic) that is<br />
1
experienced across all the sub-districts. Interventions to address the high burden<br />
of violence and homicide must be planned, implemented, monitored and<br />
evaluated multi-sectorally. Efforts to curb the HIV/AIDS epidemic, as well as<br />
tuberculosis, need to continue to be strengthened. The emerging epidemic of<br />
non-communicable diseases must be tackled through strengthening primary care<br />
management on the one hand and promoting healthy lifestyles on the other.<br />
Finally, equity must be prioritised in resource allocation between the subdistricts.<br />
2
Introduction<br />
The burden of disease in a population is a reflection not only of the health<br />
problems in the community but also of the amount of health care already being<br />
provided and the effects of all other actions that protect or damage health. These<br />
actions and effects include smoking, safe water, safe roads, alcohol and nutrition<br />
as well as more upstream factors such as education and poverty. The availability<br />
of timeous and accurate cause of death statistics is an essential component for<br />
planning, monitoring and evaluating interventions to address the burden of<br />
disease in a population.<br />
The City of <strong>Cape</strong> Town has collected cause of death statistics for more than 100<br />
years as part of its public health programme. In recent years an evaluation of the<br />
system identified the need for standardization of the coding and a more public<br />
health-oriented analysis of the statistics. The cause of death and premature<br />
mortality study done in the <strong>Cape</strong> Town Metropole in 2001 1 highlighted the fact<br />
that HIV/AIDS had created a quadruple burden of disease together with injuries,<br />
the degenerative, chronic diseases and childhood illnesses and other infectious<br />
diseases, particularly tuberculosis (TB). There were marked variations in the<br />
levels of mortality across the city, with some sub-districts having rates that were<br />
twice as high as others. These disparities reflected socio-economic differences<br />
embedded in the city.<br />
In line with National Policy 2 and the specific burden of disease in the <strong>Western</strong><br />
<strong>Cape</strong> Province, the City of <strong>Cape</strong> Town and the Provincial Department of Health<br />
have identified the following programme priorities for the <strong>Western</strong> <strong>Cape</strong>: 3<br />
1. HIV/AIDS<br />
2. TB<br />
3. Chronic Diseases<br />
4. Child Health<br />
5. Woman’s Health<br />
Together with these programmes, the establishment of a District Health System,<br />
the effective functioning of District Hospitals and the establishment of<br />
community-based services to form a local safety net and to complement the<br />
facility-based services in a seamless continuum of care have been identified as<br />
health system priorities.<br />
Significant public resources are used to achieve health outcomes related to these<br />
key priorities. Therefore, analysis of the trend in causes of death and premature<br />
mortality with a focus on the five programme priorities will help identify key<br />
successes and failures, and inform further planning and prioritization of<br />
3
interventions at a local level. In the context of limited resources and disparity in<br />
health outcomes, sub-population data become critical to identify and monitor<br />
inequalities in health status and to inform the process of prioritisation of<br />
interventions, services and research at a local level. This report presents the key<br />
findings from the trend analysis of the cause of death statistics for <strong>Cape</strong> Town<br />
Metropole and the 11 old sub-districts for 2001-2004.<br />
The collection of cause of death statistics developed in the City of <strong>Cape</strong> Town has<br />
been extended to the Boland/Overberg and has played an important role in<br />
monitoring and planning for that health region. 4 Plans are currently under way<br />
for the system to be implemented in the other health regions of the province.<br />
This analysis of the <strong>Cape</strong> Town data forms the first of a series of reports which<br />
will eventually cover mortality in all the health districts of the <strong>Western</strong> <strong>Cape</strong><br />
using a common methodology of data collection and analysis.<br />
4
Methods and data quality<br />
Cause of death data<br />
<strong>Cape</strong> Town has a well established system of routinely compiling death statistics.<br />
Local health authorities collect copies of death certificates from the Department<br />
of Home Affairs. The underlying cause of death is identified and coded using a<br />
shortlist based on ICD-10 5 (Table 2 webversion only,<br />
http://www.who.int/bulletin), captured and processed by the local municipality.<br />
The shortlist is based upon the most prevalent conditions in <strong>Cape</strong> Town as well<br />
as diseases of public health importance. The list also allows for the capture of<br />
selected combinations of diseases such as diabetes and ischaemic heart disease<br />
(IHD), which are difficult to attribute to a single cause. Deaths attributed to HIV<br />
on the death certificates or obvious euphemisms for AIDS were coded to HIV as<br />
the underlying cause. The combination of HIV and TB on the death certificate is<br />
captured as a combination but analysed with HIV as underlying cause for general<br />
comparison. Similarly, when diabetes is recorded in association with a<br />
cardiovascular co-morbidity, diabetes is identified as the underlying cause in the<br />
general analysis.<br />
The mortality data for 2001 – 2004 were obtained electronically from the <strong>Cape</strong><br />
Town City Health Department. The data were cleaned and analysed using<br />
Microsoft Excel and Stata software. Stillbirths were excluded prior to any<br />
analysis. In addition, duplicate records, those where gender was missing and<br />
records where the cause of death code was inappropriate for the age or gender<br />
were excluded from further analysis (see Appendix 1).<br />
The completeness of death registration for adults in the City of <strong>Cape</strong> Town during<br />
the period 2001 until 2004 was estimated to be 96%, about 55% for children 0 –<br />
4 years, and about 70% for infants (see Appendix 2). 6 The total number of injury<br />
deaths registered by the City of <strong>Cape</strong> Town comprised more than 90% of the<br />
injury fatalities reported by the National Injury <strong>Mortality</strong> <strong>Surveillance</strong> System<br />
(NIMSS) 7 for the City of <strong>Cape</strong> Town for all the years under study except 2003,<br />
where only 84% of the injury deaths reported by NIMSS were registered by the<br />
City of <strong>Cape</strong> Town (see Appendix 3). One would expect the NIMSS to have<br />
slightly more deaths registered than the City of <strong>Cape</strong> Town, since the City only<br />
registers deaths for residents whereas NIMSS registers all injury deaths<br />
occurring in the Metropole. However, there are variations in the profile of the<br />
manner of death. Homicide deaths registered on the City system account for<br />
more than 90% of the homicide deaths registered on NIMSS, and are therefore<br />
likely to be fairly complete. However, the number of deaths due to road traffic<br />
injuries and suicide are lower (approximately 80% of NIMSS deaths), while<br />
deaths due to unintentional injuries in the City system are higher than the<br />
number reported by NIMSS.<br />
5
After cleaning, the shortlist cause of death codes were aggregated according to<br />
the South African National Burden of Disease Study, 8 based on an adapted<br />
version of the 1990 Global Burden of Disease Study. 9 The Groups are:<br />
Group I: the pre-transitional causes - communicable diseases, maternal causes,<br />
perinatal conditions, and nutritional deficiencies. (HIV/AIDS is part of Group I but<br />
is kept separate in the South African National Burden of Disease analysis due to<br />
the size of the burden that it contributes in South Africa.)<br />
Group II: the non-communicable causes.<br />
Group III: the injuries.<br />
The deaths at unknown ages were redistributed proportionally by age and sex for<br />
each cause of death. The ill-defined cardiovascular deaths (heart failure) were<br />
redistributed by age and sex across rheumatic heart disease, IHDs, hypertensive<br />
heart diseases, pulmonary heart diseases and other cardiovascular diseases. The<br />
ill-defined respiratory deaths (respiratory failure) were redistributed<br />
proportionally by age and sex across COPD, asthma and other respiratory<br />
diseases. The deaths coded to ill-defined natural causes were redistributed<br />
proportionally by age and sex across all pre-transitional and non-communicable<br />
causes. The ill-defined injury deaths were redistributed proportionally by age and<br />
sex across all intentional and unintentional causes.<br />
The data were analysed for <strong>Cape</strong> Town and for each of the previous 11 subdistricts<br />
within <strong>Cape</strong> Town (Figure 1). The boundaries of the sub-districts have<br />
been changed twice since 2001 and will be referred to as “old”, “interim” and<br />
“current”. Preliminary analysis of the death data by the interim sub-districts<br />
suggested that the inequities in mortality rates that are so evident in the old subdistricts<br />
are masked or diluted. Nyanga sub-district is a very good example of<br />
this. According to the new boundaries, the former Nyanga sub-district is divided<br />
between the new sub-districts of Klipfontein and Mitchell’s Plain. As can be seen<br />
from Table 1, the socio-economic conditions in Klipfontein are much better than<br />
for the old Nyanga sub-district. Because of this, and the time required to convert<br />
the data into the current sub-districts, it was decided to stick to the old subdistricts<br />
for this report.<br />
6
Blaauwberg<br />
Tygerberg East<br />
Oostenberg<br />
Tygerberg<br />
West<br />
Central<br />
Athlone<br />
Nyanga<br />
South Peninsula<br />
Khayelitsha<br />
Mitchells Plain<br />
Helderberg<br />
Figure 1: Map showing old health sub-districts in the <strong>Cape</strong> Metropole<br />
7
Table 1: Socio-economic indicators for <strong>Cape</strong> Town by old and interim<br />
sub-districts 10,11<br />
SUB-DISTRICT<br />
%<br />
Not on<br />
Medical<br />
Aid<br />
%<br />
Informal<br />
dwelling<br />
%<br />
No<br />
electricity<br />
%<br />
No piped<br />
water in<br />
dwelling<br />
or on site<br />
%<br />
Not<br />
completed<br />
Matric<br />
%<br />
Unemployed<br />
of the<br />
employable<br />
%<br />
Households<br />
below<br />
poverty line<br />
Old sub-districts<br />
Athlone 75 4 1 1 75 25 24<br />
Blaauwberg 57 8 9 6 64 20 24<br />
Central 52 7 9 5 44 17 21<br />
Helderberg 66 14 8 8 57 18 18<br />
Khayelitsha 97 80 32 26 86 47 55<br />
Mitchells Plain 81 6 4 5 80 24 18<br />
Nyanga 97 64 54 29 85 50 57<br />
Oostenberg 57 18 13 11 67 20 18<br />
South<br />
Peninsula<br />
52 8 5 4 60 17 16<br />
Tygerberg East 55 7 6 5 54 18 16<br />
Tygerberg<br />
West<br />
68 4 2 1 69 22 17<br />
Interim sub-districts<br />
Central 45 6 7 4 8 16 19<br />
Eastern 70 14 9 8 16 20 18<br />
Khayelitsha 99 80 32 26 26 47 55<br />
Klipfontein 84 23 20 15 20 36 37<br />
Mitchell’s<br />
Plain<br />
88 41 23 21 20 33 30<br />
N. Panorama 41 12 10 9 16 18 20<br />
Southern 58 10 7 5 15 19 17<br />
Tygerberg 49 4 2 0 15 22 17<br />
Total 69 20 13 10 17 26 25<br />
8
Population estimates for the health sub-districts<br />
Population censuses were conducted by Statistics South Africa in 1996 and 2001,<br />
making it necessary to use projected population estimates for the years 2001 -<br />
2004. It was decided against using the population estimates and projections from<br />
the provincial Department of Health, since although based on the official<br />
statistics from Statistics South Africa, these had not adjusted for undercount in<br />
specific age groups. Alternative estimates were used that are consistent with the<br />
annual estimates of the total population for the <strong>Cape</strong> Town Metropole from the<br />
demographic projections undertaken by the University of <strong>Cape</strong> Town Centre for<br />
Actuarial Research for the City of <strong>Cape</strong> Town. 12 These yearly estimates were<br />
projected using the ASSA (Actuarial Society of South Africa) model from 1985 to<br />
2004, having made adjustment to the 1996 and 2001 census data and allowing<br />
for the impact of AIDS.<br />
As mentioned earlier, the health sub-districts of <strong>Cape</strong> Town have been changed<br />
twice since 2001. In the first instance, population estimates by age and sex were<br />
estimated for each of the eight interim health sub-districts. The populations by<br />
age and sex for each of the interim health sub-districts were obtained from the<br />
community profile data sets for the 1996 and 2001 census and adjusted<br />
proportionately to match the total population estimates derived by Dorrington 12<br />
for these years. It should be noted that the 1996 census had unspecified ages by<br />
sex which were reapportioned to all the ages above 20, based on the assumption<br />
that age reporting below 20 is more accurately and completely reported. The<br />
populations in the interim health sub-districts were then interpolated and<br />
projected by age and sex to 2004 using the ratio method, assuming an<br />
exponential rate of change in the percent distributions between the two censuses<br />
and reaching stability in the population after 60 years from 1996. The population<br />
was effectively adjusted, on a pro rata basis, so that the sum of the projected<br />
population by age and sex in the eight interim health sub-districts equalled the<br />
projected total populations of the interim health sub-districts in the ASSA model.<br />
In the second instance, the populations for the old health sub-districts were<br />
estimated from those of the interim health sub-districts, based on an<br />
extrapolation of the proportional composition of the old health districts when<br />
compared to the interim sub-districts (by age and sex group). The common<br />
census sub-place names were identified for each of the old health sub-districts<br />
compared to the interim health sub-districts to calculate the proportions in 1996<br />
and 2001 for each age and sex group. These proportions were extrapolated<br />
beyond 2001 and used to estimate the old health sub-districts from the<br />
estimates of the interim health sub-districts.<br />
9
<strong>Mortality</strong> in <strong>Cape</strong> Town<br />
Overview of mortality<br />
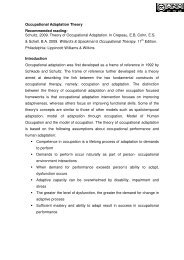
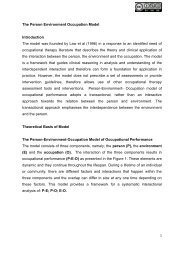
The age pattern of deaths in <strong>Cape</strong> Town in 2004 is shown for males and females<br />
in Figure 2. This pattern is very similar to that observed in 2001, 1 and is typical<br />
of the quadruple burden of disease experienced by societies undergoing a<br />
transition in their mortality patterns 8 : infectious disease mortality, primarily<br />
among young children; high levels of mortality due to violence and injuries<br />
among young adults; non-communicable diseases later in life; and the growing<br />
HIV/AIDS epidemic impacting on young adults and young children. There are<br />
considerable gender differences, with young adult males experiencing much<br />
larger numbers of deaths than females, mainly due to violence and injuries.<br />
HIV/AIDS accounts for a large proportion of deaths in young women.<br />
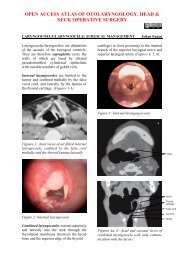
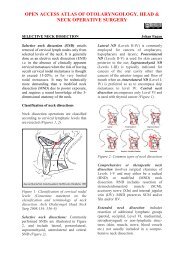
Figure 3 shows the trend in the age-standardised mortality rates. The overall<br />
age-standardised mortality rate for females did not change during the 4 years.<br />
However, there was an increase in HIV/AIDS mortality and a decrease in the<br />
non-communicable disease death rate. The overall age-standardised mortality<br />
rate for males is much higher than that for females and declined slightly during<br />
this period. The death rates from injuries and from non-communicable disease<br />
decreased while there was an increase in HIV/AIDS mortality rates.<br />
Age standardisation. A technique which eliminates differences in observed<br />
mortality rates caused by differences in the age structure of the population in<br />
different areas, rather than by differences in the force of the underlying<br />
mortality.<br />
10
Females<br />
900<br />
800<br />
700<br />
Deaths per 100 000<br />
600<br />
500<br />
400<br />
300<br />
200<br />
100<br />
0<br />
2001 2002 2003 2004<br />
Injuries 54 52 46 49<br />
Non-communicable 574 550 549 542<br />
HIV 58 69 80 83<br />
Comm excl HIV, mat, peri, nut 113 110 106 103<br />
Males<br />
1400<br />
1200<br />
1000<br />
Deaths per 100 000<br />
800<br />
600<br />
400<br />
200<br />
0<br />
2001 2002 2003 2004<br />
Injuries 239 241 206 198<br />
Non-communicable 803 763 752 740<br />
HIV 53 69 81 79<br />
Comm excl HIV, mat, peri, nut 168 172 157 164<br />
Figure 2: Age distribution of deaths by cause group and gender,<br />
<strong>Cape</strong> Town, 2004<br />
11
1300<br />
FEMALES<br />
N=10866<br />
1200<br />
1100<br />
1000<br />
900<br />
800<br />
Deaths<br />
700<br />
600<br />
500<br />
400<br />
300<br />
200<br />
100<br />
0<br />
0 1 to 4 5 to 9 10 to 14 15 to 19 20 to 24 25 to 29 30 to 34 35 to 39 40 to 44 45 to 49 50 to 54 55 to 59 60 to 64 65 to 69 70 to 74 75 to 79 80 to 84 85+<br />
Comm excl HIV, mat, peri, nut HIV/AIDS Non-communicable Injuries Ill defined<br />
MALES<br />
N=13523<br />
1300<br />
1200<br />
1100<br />
1000<br />
900<br />
800<br />
Deaths<br />
700<br />
600<br />
500<br />
400<br />
300<br />
200<br />
100<br />
0<br />
0 1 to 4 5 to<br />
9<br />
10 to<br />
14<br />
15 to<br />
19<br />
20 to<br />
24<br />
25 to<br />
29<br />
30 to<br />
34<br />
35 to<br />
39<br />
40 to<br />
44<br />
45 to<br />
49<br />
50 to<br />
54<br />
55 to<br />
59<br />
60 to<br />
64<br />
65 to<br />
69<br />
70 to<br />
74<br />
75 to<br />
79<br />
Comm excl HIV, mat,peri, nut HIV/AIDS Non Communicable Injuries Ill defined<br />
80 to<br />
84<br />
85+<br />
Figure 3: Age-standardised mortality rate by broad cause group<br />
by sex for <strong>Cape</strong> Town, 2001-2004<br />
12
Trends in premature mortality<br />
A comparison of the leading causes of premature death over the period 2001-<br />
2004 shows that since 2001 violent deaths have declined, but deaths due to<br />
HIV/AIDS have increased, with HIV/AIDS now replacing violence as the leading<br />
cause of death (see Figure 4). The four leading causes of death in <strong>Cape</strong> Town,<br />
namely homicide, HIV/AIDS, TB and road traffic injuries, accounted for 43.6% of<br />
all premature mortality in 2004.<br />
2001<br />
Homicide<br />
18.0<br />
HIV/AIDS<br />
12.2<br />
Tuberculosis<br />
7.8<br />
Road traffic<br />
5.8<br />
Ischaemic heart disease<br />
Stroke<br />
Lower Respiratory infections<br />
4.0<br />
3.8<br />
3.6<br />
Diabetes Mellitus<br />
Low birth weight and RDS<br />
Trachea/bronchi/lung cancer<br />
2.5<br />
2.4<br />
2.9<br />
0 2 4 6 8 10 12 14 16 18 20<br />
Percent<br />
2004<br />
HIV/AIDS<br />
17.6<br />
Homicide<br />
12.4<br />
Tuberculosis<br />
8.1<br />
Road traffic<br />
5.7<br />
Diabetes Mellitus<br />
Stroke<br />
Low birth weight and RDS<br />
Ischaemic heart disease<br />
Lower Respiratory infections<br />
3.7<br />
3.5<br />
3.4<br />
3.4<br />
3.4<br />
Trachea/bronchi/lung cancer<br />
2.4<br />
0 2 4 6 8 10 12 14 16 18 20<br />
Percent<br />
Figure 4: Top 10 causes of premature mortality (YLLs) for <strong>Cape</strong> Town,<br />
2001 and 2004<br />
Figure 5 shows the leading causes of premature mortality for males and females<br />
in 2001 and 2004. Although homicide continues to be the leading cause of<br />
premature mortality for males, it accounts for a lower proportion in 2004<br />
compared with 2001. HIV/AIDS remains the leading cause for females. During<br />
13
this period HIV/AIDS accounts for an increasing proportion of the YLLS and<br />
deaths during the perinatal period, rising in the ranking of the causes.<br />
YLL Years of life lost<br />
Premature mortality has been estimated using the standard Global Burden of Disease<br />
(GBD) approach to calculate years of life lost (YLLs) 9 . Age weighting, time discounting<br />
of 3% per annum and standard life expectancies based on the West model levels 25<br />
and 26 (considered to a maximum life expectancy) have been used. The younger the<br />
age of death the greater the years of life lost 1 .<br />
Males 2001<br />
Males 2004<br />
Homicide<br />
26.0<br />
Homicide<br />
18.7<br />
HIV/AIDS<br />
8.7<br />
HIV/AIDS<br />
13.0<br />
Tuberculosis<br />
7.6<br />
Tuberculosis<br />
8.4<br />
Road traffic<br />
7.0<br />
Road traffic<br />
7.4<br />
Ischaemic heart disease<br />
4.1<br />
Ischaemic heart disease<br />
3.6<br />
Stroke<br />
3.0<br />
Low birth weight and RDS<br />
3.3<br />
Lower Respiratory infections<br />
2.9<br />
Lower Respiratory infections<br />
3.1<br />
Trachea/bronchi/lung cancer<br />
2.7<br />
Stroke<br />
3.0<br />
Suicide and self-inflicted<br />
2.3<br />
Suicide and self-inflicted<br />
2.7<br />
COPD<br />
2.1<br />
Trachea/bronchi/lung cancer<br />
2.6<br />
0 5 10 15 20 25 30<br />
Percent<br />
0 5 10 15 20 25 30<br />
Percent<br />
Females 2001<br />
Females 2004<br />
HIV/AIDS<br />
17.8<br />
HIV/AIDS<br />
24.4<br />
Tuberculosis<br />
8.1<br />
Tuberculosis<br />
7.5<br />
Stroke<br />
5.2<br />
Diabetes Mellitus<br />
5.6<br />
Homicide<br />
5.2<br />
Stroke<br />
4.3<br />
Lower Respiratory infections<br />
4.7<br />
Lower Respiratory infections<br />
3.7<br />
Diabetes Mellitus<br />
4.4<br />
Low birth weight and RDS<br />
3.6<br />
Ischaemic heart disease<br />
4.0<br />
Homicide<br />
3.4<br />
Road traffic<br />
3.8<br />
Road traffic<br />
3.3<br />
Low birth weight and RDS<br />
3.3<br />
Hypertensive heart disease<br />
3.2<br />
Hypertensive heart disease<br />
2.8<br />
Ischaemic heart disease<br />
3.1<br />
0 5 10 15 20 25 30<br />
Percent<br />
0 5 10 15 20 25 30<br />
Percent<br />
Figure 5: Top 10 causes of premature mortality (YLLs) by sex for <strong>Cape</strong><br />
Town, 2001 and 2004<br />
Table 2 shows the ranking of conditions based on YLLS for each health subdistrict<br />
in 2004, and Figure 6 shows the YLL rates in 2001 and 2004 by subdistrict.<br />
It can be seen that HIV/AIDS was the number one cause of premature<br />
death in all sub-districts except Athlone, where diabetes was the leading cause of<br />
death, Mitchell’s Plain, where homicide was the leading cause, and Tygerberg<br />
West, where TB was the leading cause. HIV/AIDS ranks much lower in Athlone<br />
(4th) and Tygerberg West (7th). The reason for this is not clear.<br />
14
The impact of HIV/AIDS is most prominent in Khayelitsha and Nyanga subdistricts,<br />
where it accounted for almost 30% of premature mortality. This mirrors<br />
the antenatal HIV prevalences in these sub-districts which are the highest in the<br />
province. Khayelitsha and Nyanga were among the first sub-districts to have<br />
access to the public sector ARV programme in 2001. By the year 2004, 2327<br />
patients were on ARVs at 16 sites in the province, most of which were in<br />
Khayelitsha and Nyanga. Even though this was a significant achievement for the<br />
province, it was not able to mitigate the impact of HIV/AIDS. TB, which is often<br />
HIV/AIDS-related, is the third cause of premature death in most sub-districts.<br />
HIV/AIDS and TB account for about a quarter of all premature mortality in the<br />
City.<br />
Homicide accounts for a significant burden of disease throughout <strong>Cape</strong> Town, and<br />
ranks second in leading causes of premature death in all the sub-districts in the<br />
City, except in Mitchell’s Plain - where it ranks first. This picture is reflective of<br />
the prevalent culture of gang violence in the province, compounded by poverty,<br />
unemployment and substance abuse. Road traffic injuries are the fourth leading<br />
cause of premature mortality in more than half of the sub-districts. One in five<br />
people in the City die prematurely due to homicide or road traffic injuries.<br />
Athlone, more than any of the other sub-districts, shows a sub-district in a health<br />
transition that is dominated by non-communicable diseases; Athlone is followed<br />
closely by Mitchell’s Plain (Figure 6). Non-communicable diseases have<br />
traditionally been associated with increasing wealth. However, as has also been<br />
shown in previous reports, these conditions have a significant impact on poor<br />
communities as well. If we consider diabetes mellitus, IHD, stroke and<br />
hypertensive heart disease together, it is evident that the greatest impact of<br />
these conditions is in Athlone, Mitchell’s Plain and Tygerberg West.<br />
15
Sub-district variations<br />
Table 2: Leading 10 causes of premature mortality (YLLs) for <strong>Cape</strong> Town and old sub-districts, 2004<br />
Rank Athlone Blaawberg Central Helderberg Khayelitsha Mitchells Plain Nyanga Oostenberg South<br />
Peninsula<br />
1<br />
Diabetes<br />
HIV/AIDS HIV/AIDS HIV/AIDS HIV/AIDS Homicide HIV/AIDS HIV/AIDS HIV/AIDS<br />
mellitus<br />
(14.4%) (16.2%)<br />
(14.9%) (27.3%) (11.8%) (28.5%) (18.3%) (9.7%)<br />
(8.7%)<br />
Tygerberg<br />
East<br />
HIV/AIDS<br />
(16.6%)<br />
Tygerberg<br />
West<br />
Tuberculosis<br />
(7.1%)<br />
<strong>Cape</strong> Town<br />
HIV/AIDS<br />
(17.6%)<br />
2<br />
Homicide<br />
(8.3%)<br />
Homicide<br />
(11.8%)<br />
Homicide<br />
(10.1%)<br />
Homicide<br />
(11%)<br />
Homicide<br />
(16.9%)<br />
HIV/AIDS<br />
(10.3%)<br />
Homicide<br />
(18.6%)<br />
Homicide<br />
(12%)<br />
Homicide<br />
(6.9%)<br />
Homicide<br />
(10.2%)<br />
Homicide<br />
(6.8%)<br />
Homicide<br />
(12.4%)<br />
3<br />
Ischaemic heart<br />
disease<br />
(6.3%)<br />
Tuberculosis<br />
(8.1%)<br />
Tuberculosis<br />
(5.4%)<br />
Tuberculosis<br />
(9.5%)<br />
Tuberculosis<br />
(10.8%)<br />
Diabetes<br />
mellitus<br />
(7.7%)<br />
Tuberculosis<br />
(8.5%)<br />
Tuberculosis<br />
(9.2%)<br />
Ischaemic<br />
heart disease<br />
(6.0%)<br />
Tuberculosis<br />
(9.0%)<br />
Stroke<br />
(6.4%)<br />
Tuberculosis<br />
(8.1%)<br />
4<br />
5<br />
6<br />
7<br />
8<br />
9<br />
10<br />
HIV/AIDS<br />
(5.9%)<br />
Tuberculosis<br />
(5.7%)<br />
Road traffic<br />
(5.6%)<br />
Stroke<br />
(5.4%)<br />
Hypertensive<br />
heart disease<br />
(5.3%)<br />
COPD<br />
(4.6%)<br />
Lung cancer<br />
(4.3%)<br />
Road traffic<br />
(7.4%)<br />
Ischaemic heart<br />
disease<br />
(5.3%)<br />
Low birth<br />
weight<br />
(3.5%)<br />
Stroke<br />
(3.3%)<br />
COPD<br />
(2.9%)<br />
Lower<br />
respiratory<br />
infections<br />
(2.6%)<br />
Lung cancer<br />
(2.4%)<br />
Ischaemic heart<br />
disease<br />
(4.5%)<br />
Road traffic<br />
(4.5%)<br />
Diabetes<br />
mellitus<br />
(4.4%)<br />
Stroke<br />
(4.1%)<br />
Lower<br />
respiratory<br />
infections<br />
(3.7%)<br />
Low birth<br />
weight and<br />
RDS<br />
(3.3%)<br />
Hypertensive<br />
heart disease<br />
(3.1%)<br />
Ischaemic heart<br />
disease<br />
(6.9%)<br />
Lower respiratory<br />
infections<br />
(5.4%)<br />
Road traffic<br />
(5.2%)<br />
Fires<br />
(4.3%)<br />
Stroke<br />
(3.8%)<br />
Suicide<br />
(2.5)<br />
Diarrhoeal<br />
diseases<br />
(2.4%)<br />
Road traffic<br />
(5.6%)<br />
Diarrhoeal<br />
Diseases<br />
(4.6%)<br />
Lower<br />
respiratory<br />
infections<br />
(3.5%)<br />
Low birth<br />
weight and<br />
RDS<br />
(2.9%)<br />
Fires<br />
(2.1%)<br />
Stroke<br />
(1.7%)<br />
Diabetes<br />
mellitus<br />
(1.7%)<br />
Low birth<br />
weight and<br />
RDS<br />
(5.7%)<br />
Tuberculosis<br />
(5.6%)<br />
Road traffic<br />
4.8%)<br />
Stroke<br />
(4.7%)<br />
Ischaemic<br />
heart disease<br />
(4.2%)<br />
Lung cancer<br />
(3.6 %)<br />
Lower<br />
respiratory<br />
infections<br />
(2.9%)<br />
Road traffic<br />
(5.2%)<br />
Lower<br />
respiratory<br />
infections<br />
(3.9%)<br />
Diarrhoeal<br />
diseases<br />
(3.4%)<br />
Low birth<br />
weight and<br />
RDS<br />
( 3.0%)<br />
Fires<br />
(2.4%)<br />
Hypertensive<br />
heart disease<br />
(2.3%)<br />
Stroke<br />
(2.1%)<br />
Road traffic<br />
(8.5%)<br />
Suicide<br />
(4.1%)<br />
Ischaemic<br />
heart disease<br />
(3.9%)<br />
Lower<br />
Respiratory<br />
infections<br />
(3.6%)<br />
Stroke<br />
(3.2%)<br />
Diabetes<br />
mellitus<br />
(3.1%)<br />
Low birth<br />
weight and<br />
RDS<br />
(2.7%)<br />
Tuberculosis<br />
(5.5%)<br />
Diabetes<br />
mellitus<br />
(5.3%)<br />
Stroke<br />
(4.5%)<br />
Road traffic<br />
(4.1%)<br />
Lung cancer<br />
(3.8%)<br />
Low birth<br />
weight and<br />
RDS<br />
(3.1%)<br />
Lower<br />
respiratory<br />
infections<br />
(3.1%)<br />
Road traffic<br />
(6.3%)<br />
Low birth<br />
weight and<br />
RDS<br />
(5.1%)<br />
Ischaemic<br />
heart disease<br />
(3.5%)<br />
Stroke<br />
(3.5%)<br />
Diabetes<br />
mellitus<br />
(3.2%)<br />
Lower<br />
Respiratory<br />
infections<br />
(2.8%)<br />
Lung cancer<br />
(2.7%)<br />
Road traffic<br />
(6.0%)<br />
Diabetes<br />
Mellitus<br />
(5.9%)<br />
Ischaemic<br />
heart disease<br />
(5.6%)<br />
HIV/AIDS<br />
(5.3%)<br />
Low birth<br />
weight and<br />
RDS<br />
(5.2%)<br />
Lung cancer<br />
(5.0%)<br />
Hypertensive<br />
heart disease<br />
(4.5%)<br />
Road traffic<br />
(5.7%)<br />
Diabetes<br />
Mellitus<br />
(3.7%)<br />
Stroke<br />
(3.5%)<br />
Low birth<br />
weight<br />
(3.4%)<br />
Ischaemic<br />
heart disease<br />
(3.4%)<br />
Lower<br />
Respiratory<br />
infections<br />
(3.4%)<br />
Lung cancer<br />
(2.4%)<br />
16
Premature mortality due to childhood illness is most prevalent in Khayelitsha and<br />
Nyanga, depicting the relative poverty associated with these sub-districts.<br />
As shown in the league table above, the poorest communities are often those<br />
worst affected by the quadruple burden of disease. Addressing this burden is<br />
challenging and requires unprecedented multi-sectoral partnerships to reduce it.<br />
From Figure 7 it can be seen that Khayelitsha and Nyanga continue to have the<br />
highest burden of premature mortality per 100 000 population, even though the<br />
rates in Khayelitsha have dropped since 2001. The rates in Blaauwberg and<br />
Tygerberg East have increased during this period. In the case of Blaauwberg,<br />
deaths are underreported across all conditions in 2001 due to staff changes in<br />
that year (Figure 6). In Tygerberg East there is an increase in HIV/AIDS and<br />
other type 1 conditions (not defined in this report yet) (Figure 6). The YLL rates<br />
in Central have declined from these conditions, resulting in an overall decline.<br />
There has also been a decline in the YLL rates in Athlone, largely from injuries<br />
and deaths due to non-communicable diseases.<br />
17
Comm excl HIV, mat, peri YLLs per 100 000 population<br />
HIV/AIDS YLLs per 100 000 population<br />
7000<br />
7000<br />
6000<br />
6000<br />
5000<br />
5000<br />
4000<br />
3000<br />
2001<br />
2004<br />
4000<br />
3000<br />
2001<br />
2004<br />
2000<br />
2000<br />
1000<br />
1000<br />
0<br />
Athlone Blaauw Central Helder Khay M Plain Nyanga Oos SPD Tyg E Tyg W<br />
0<br />
Athlone Blaauw Central Helder Khay M Plain Nyanga Oos SPD Tyg E Tyg W<br />
Non-communicable YLLs per 100 000 population<br />
Injury YLLs per 100 000 population<br />
9000<br />
9000<br />
8000<br />
8000<br />
7000<br />
7000<br />
6000<br />
5000<br />
4000<br />
2001<br />
2004<br />
6000<br />
5000<br />
4000<br />
2001<br />
2004<br />
3000<br />
3000<br />
2000<br />
2000<br />
1000<br />
1000<br />
0<br />
Athlone Blaauw Central Helder Khay M Plain Nyanga Oos SPD Tyg E Tyg W<br />
0<br />
Athlone Blaauw Central Helder Khay M Plain Nyanga Oos SPD Tyg E Tyg W<br />
Figure 6: Age-standardised premature mortality rates per 100 000 by broad cause group<br />
for <strong>Cape</strong> Town sub-districts, 2001 and 2004<br />
18
2001<br />
25000<br />
20000<br />
YLLs per 100 000<br />
15000<br />
10000<br />
5000<br />
0<br />
Athlone Blaauw Central Helder Khay M Plain Nyanga Oos SPD Tyg Eas Tyg Wes<br />
III. Injuries 3347 1616 2351 4022 6789 3220 5710 4401 2148 3064 3151<br />
II. Non-communicable diseases 8024 3208 5771 5347 7483 7776 7627 7499 5224 5265 6669<br />
HIV/AIDS 676 869 2007 1459 3223 626 4034 1681 320 780 246<br />
Comm excl HIV, mat, peri, nut 1795 780 2245 3267 6322 1566 4309 2712 1410 1711 1970<br />
2004<br />
25000<br />
20000<br />
YLLs per 100 000<br />
15000<br />
10000<br />
5000<br />
0<br />
Athlone Blaauw Central Helder Khay M Plain Nyanga Oos SPD Tyg Eas Tyg Wes<br />
III. Injuries 2266 2168 2187 3899 4954 2251 5663 3110 1743 2685 2020<br />
II. Non-communicable diseases 7651 4061 4274 5293 7636 7417 6897 5720 4875 5918 5983<br />
HIV/AIDS 664 1036 1540 2018 5064 973 5571 1913 824 1968 496<br />
Comm excl HIV, mat, peri, nut 1559 1466 1738 3330 5451 1812 4427 2515 1454 2726 1843<br />
Figure 7: YLLs per 100 000 by cause group and HIV/AIDS for <strong>Cape</strong><br />
Town and sub-districts, 2001 and 2004<br />
19
Important conditions<br />
HIV and TB<br />
The data for 2001 - 2004 show that HIV mortality has become the leading cause<br />
of premature mortality in the city, and that TB remains the third. HIV/AIDS and<br />
TB are now closely linked. Aside from TB being one of the indicator conditions for<br />
AIDS, there is clear evidence that the TB epidemic is being fuelled by the HIV<br />
epidemic. These data therefore reflect the impact of the dual HIV/AIDS and TB<br />
epidemics in this province. Where HIV/AIDS and TB were reported on the death<br />
certificate the underlying cause was assume to be HIV/AIDS, in accordance with<br />
ICD 10 guidelines.13 However, for TB programme purposes this co-morbidity<br />
was recorded, and has been reported in Figure 6 as “HIV/AIDS excluding TB” and<br />
“HIV/AIDS + TB”. In the rest of the document figures reported for HIV/AIDS<br />
include both of the above. TB refers to deaths certified with TB as the underlying<br />
cause with no mention of HIV/AIDS.<br />
Variation between sub-districts<br />
As with HIV prevalence patterns, there is evidence of wide differentials in the<br />
HIV-related mortality rates by age, gender and geographic area. 14 The HIVrelated<br />
mortality rates at the health sub-district level in the City of <strong>Cape</strong> Town<br />
vary in terms of both magnitude and trends (Figure 8). In 2004 deaths due to<br />
HIV/AIDS excluding TB ranged from the lowest rate of 14/100 000 in the Athlone<br />
sub-district to the highest in Nyanga (131/100 000). In 2004 the South<br />
Peninsula sub-district (25/100 000) reported the lowest mortality rates for TB<br />
excluding HIV/AIDS and Khayelitsha the highest at 178/100 000. Death rates<br />
due to both HIV/AIDS and TB were highest in the Nyanga (101/100 000) and<br />
Khayelitsha (104/100 000) sub-districts respectively, and lowest in the<br />
Tygerberg West (8/100 000) and Athlone (11/100 000) sub-districts in 2004.<br />
<strong>Mortality</strong> trends due to HIV/AIDS and/TB showed an increase in nine of the 11<br />
health sub-districts in the <strong>Cape</strong> Metropolitan area. The Nyanga health sub-district<br />
not only reported the highest levels of mortality due to HIV/AIDS, but also<br />
showed a dramatic increase, from 51/100 000 in 2001 to 101/100 000 in 2004.<br />
Underlying cause of death. In accordance with ICD 10<br />
guidelines 13 , HIV/AIDS was selected as the underlying causes<br />
when both tuberculosis and HIV/AIDS appeared on the death<br />
certificate.<br />
20
450<br />
400<br />
350<br />
300<br />
Deaths per 100 000<br />
250<br />
200<br />
150<br />
100<br />
50<br />
0<br />
2001 2004 2001 2004 2001 2004 2001 2004 2001 2004 2001 2004 2001 2004 2001 2004 2001 2004 2001 2004 2001 2004<br />
Athlone Blaauw Central Helder Khay M Plain Nyanga Oosten SPD Tyg East Tyg Wes<br />
HIV/AIDS excl TB 17 14 14 26 51 33 36 44 69 112 15 22 103 131 46 52 7 19 20 48 7 13<br />
HIV/AIDS + TB 9 11 19 15 23 26 18 32 56 104 10 14 51 101 20 26 5 12 10 29 3 8<br />
Tuberculosis 48 36 16 31 39 24 69 63 195 178 32 32 128 115 50 53 17 25 25 54 37 32<br />
Tuberculosis HIV/AIDS + TB HIV/AIDS excl TB<br />
Figure 8: Age-standardised death rates for TB, HIV+TB and HIV for<br />
persons by sub-district, <strong>Cape</strong> Town, 2001 and 2004<br />
Age and gender differences<br />
Trends of age standardised deaths due to HIV/AIDS revealed a notable increase<br />
in mortality for both males and females for the period 2001 to 2004 (Figure 9).<br />
However, HIV/AIDS-related mortality by age distribution revealed that the<br />
highest rates were observed in younger women, with the deaths rates peaking in<br />
women at 25-34 years of age (580). In contrast, deaths due to HIV/AIDS in<br />
males peaked a decade later, at 35-44 years of age (413). The relative<br />
proportion of the causes of deaths by age and gender showed that HIV/AIDS was<br />
the leading cause of death among women. For males HIV/AIDS ranked second to<br />
homicide as a leading cause of death.<br />
Examining the top ten causes of premature mortality for 2001 and 2004 revealed<br />
that in 2001, HIV/AIDS ranked as the second highest cause of premature death<br />
(12.2%), while in 2004 it became the leading cause of premature death in adults<br />
(17.6%). This highlights the impact of a maturing epidemic in the City of <strong>Cape</strong><br />
Town, with the changes evident both in the absolute terms and in the ranking of<br />
the leading causes of premature death among adults.<br />
21
HIV/AIDS males<br />
HIV/AIDS females<br />
200<br />
200<br />
150<br />
150<br />
Deaths per 100 000<br />
100<br />
Deaths per 100 000<br />
100<br />
2001<br />
2004<br />
50<br />
50<br />
0<br />
0-4 5-14 15-24 25-34 35-44 45-54 55-64 65-74 75+<br />
0<br />
0-4 5-14 15-24 25-34 35-44 45-54 55-64 65-74 75+<br />
TB Females<br />
TB Males<br />
200<br />
200<br />
150<br />
150<br />
Deaths per 100 000<br />
100<br />
Deaths per 100 000<br />
100<br />
2001<br />
2004<br />
50<br />
50<br />
0<br />
0-4 5-14 15-24 25-34 35-44 45-54 55-64 65-74 75+<br />
0<br />
0-4 5-14 15-24 25-34 35-44 45-54 55-64 65-74 75+<br />
Figure 9: Age-specific death rates for HIV and TB by gender,<br />
<strong>Cape</strong> Town, 2001 and 2004<br />
The age-specific mortality rates due to TB are shown for males and females in<br />
Figure 9. It is evident that there are stark differences in the magnitude of deaths<br />
by age distribution for males and females. In 2001 and 2004 there were far more<br />
TB-related deaths reported among males than females. However, for the period<br />
2001 to 2004, temporal trends revealed a notable decline in TB deaths among<br />
males aged 45 years or older. For women, on the other hand, the magnitude of<br />
deaths due to TB showed no significant change for the same period.<br />
An examination of the top 10 causes of premature mortality across the health<br />
sub-districts revealed that 9 out of 11 health sub-districts in the <strong>Cape</strong> Metropole<br />
reported HIV/AIDS as the leading cause of premature mortality in 2004 (see<br />
Table 2). In 2001 HIV/AIDS ranked first in only one sub-district and second in six<br />
sub-districts. 1<br />
The mortality profile of HIV/AIDS-related deaths among children closely follows<br />
the distribution of adult mortality at the health sub-district level. This is<br />
discussed in more detail in the section on child health.<br />
Injuries<br />
Despite the dramatic increase in deaths due to HIV/AIDS between 2001 and<br />
2004, deaths due to non-natural causes (i.e. violence and injuries) remain<br />
among the greatest contributors to premature mortality among <strong>Cape</strong>tonians.<br />
Although there is not a specific health programme to address injuries, it is clear<br />
22
that a co-ordinated effort is required across different sectors including health.<br />
The most common causes of injury in 2004 were homicide, accounting for 12.4%<br />
of YLLs in the city, road traffic injuries (5.8%), suicide (2%), fires (1.8%), other<br />
unintentional injuries (2.2%) and other transport (0.7%). Combined, these injury<br />
deaths accounted for 35.3% of YLLs among males and 11.7% among females.<br />
The injury mortality rates in South Africa are approximately six times higher than<br />
the global average. 15 Homicide is eight times the global rate and road traffic<br />
injuries are double. Within South Africa city-level comparisons from the NIMSS<br />
indicate that the proportions of non-natural deaths due to homicide in <strong>Cape</strong> Town<br />
and Durban are significantly higher than those in Johannesburg and Pretoria. 16<br />
Analysis of the data by sub-district indicates considerable disparities in the rates<br />
of fatal injuries across all categories (Figure 10). Most striking is the comparison<br />
of homicide rates - from the relatively low levels of under 35/100 000 population<br />
in Blaauwberg and the South Peninsula to more than 120/100 000 in Khayelitsha<br />
and Nyanga (132/100 000). These areas also correspond in terms of the lowest<br />
and highest rates of road traffic fatalities.<br />
Deaths in the “other transport” category are also concentrated in three key subdistricts:<br />
Nyanga, Khayelitsha and Mitchell’s Plain, and the higher incidence of<br />
deaths from fires in Khaelitsha, Nyanga and Helderberg is probably a function of<br />
the housing stock and fuel usage patterns in these areas, which are<br />
characterised by large informal settlements.<br />
There was little variation in suicide rates between seven of the sub-districts, at<br />
between 5 and 11 per 100 000. However, the suicide rates in two sub-districts,<br />
Helderberg and Oostenberg, were much higher, at 17 and 16 per 100 000<br />
respectively.<br />
250<br />
200<br />
Deaths per 100 000<br />
150<br />
100<br />
50<br />
0<br />
Athlone Blaauw Central Helder Khay M Plain Nyanga Oos SPD Tyg Eas Tyg Wes City<br />
Homicide 53 35 42 69 120 56 132 70 33 44 43 66<br />
Suicide 5 7 6 17 8 5 6 16 7 10 10 9<br />
Other unintentional 19 22 19 22 21 15 20 13 24 14 15 19<br />
Fires 5 6 5 20 22 3 16 7 5 6 5 8<br />
Other transport 2 1 3 4 6 3 11 3 1 1 4 4<br />
Road traffic 26 19 19 32 44 27 41 39 9 26 24 27<br />
Figure 10: Age-standardised death rates (pooled estimates)<br />
due to injuries by sub-district, <strong>Cape</strong> Town 2001 – 2004<br />
23
Homicide remains the leading cause of premature mortality among males in <strong>Cape</strong><br />
Town, but its contribution to total YLLs in the city has dropped from 26% to<br />
18.7%. Similarly, the contribution of homicide to premature mortality among<br />
females has dropped from 5.2% to 3.4%, and its rank dropped from fourth to<br />
seventh position between 2001 and 2004.<br />
The NIMSS data indicate that the decrease in homicide between 2001 and 2004<br />
is largely due to the significant decrease in firearm-related homicides, whereas<br />
non-firearm homicide rates have remained fairly stable (Figure 11). 7 This<br />
decrease could be ascribed to several factors, including heightened public<br />
awareness prior to the introduction of stricter gun control legislation, as well as<br />
the effectiveness of targeted policing initiatives. However, the evidence as to the<br />
actual drivers still needs to be established.<br />
Firearm homicide<br />
Non-firearm homicide<br />
Age standardised mortality rate per<br />
100,000 population<br />
45<br />
40<br />
35<br />
30<br />
25<br />
20<br />
15<br />
10<br />
5<br />
0<br />
2001 2002 2003 2004<br />
Figure 11: Firearm and non-firearm homicide rates<br />
in <strong>Cape</strong> Town, 2001 - 2004 7<br />
24
Nevertheless, the analysis of homicide rates by sub-district has further<br />
implications for firearm control interventions. As well as the high rates of gun<br />
violence in the sub-districts already noted for high homicide rates (i.e. Nyanga<br />
and Khayelitsha), a disproportionately large percentage of firearm homicides<br />
were recorded in Athlone and Mitchell’s Plain (Figure 12).<br />
140<br />
Homicide<br />
120<br />
100<br />
69<br />
62<br />
Deaths per 100 000<br />
80<br />
60<br />
40<br />
20<br />
0<br />
21<br />
55<br />
24<br />
51<br />
22<br />
71<br />
59<br />
29<br />
23<br />
20<br />
17<br />
31<br />
32<br />
15<br />
20<br />
14<br />
20 17 16<br />
21<br />
Athlone Blaauw Central Helder Khay M Plain Nyanga Oos SPD Tyg East Tyg Wes<br />
Homicide with firearm<br />
Homicide without firearm<br />
Figure 12: Age-standardised death rates (average) due to homicide by<br />
sub-district, <strong>Cape</strong> Town 2001 – 2004<br />
The gender ratio of homicide in <strong>Cape</strong> Town is 7.5 male deaths for every female<br />
death (see Figure 13). Among males there was a distinct peak in the 15-24-year<br />
age group between 2001 and 2004, that tapered-off with increasing age and rose<br />
again after the age of 65 years (except in 2003, where the rate was lower in the<br />
older age categories). Comparison of the age profile from 2001 to 2004 also<br />
revealed a decrease in mortality across all age groups, but particularly among<br />
young adults, which is consistent with a decrease in firearm homicide and<br />
community violence.<br />
25
Males<br />
350<br />
300<br />
250<br />
Deaths per 100 000<br />
200<br />
150<br />
100<br />
50<br />
0<br />
0-4 5 to 14 15 to 24 25 to 34 35 to 44 45 to 54 55 to 64 65 to 74 75+<br />
2001 8 10 264 279 186 103 54 19 56<br />
2002 7 7 311 270 173 95 75 41 91<br />
2003 4 7 256 206 132 95 49 41 29<br />
2004 3 5 196 176 115 79 38 16 46<br />
Females<br />
350<br />
300<br />
250<br />
Deaths per 100 000<br />
200<br />
150<br />
100<br />
50<br />
0<br />
0-4 5 to 14 15 to 24 25 to 34 35 to 44 45 to 54 55 to 64 65 to 74 75+<br />
2001 6 5 21 30 29 18 11 8 27<br />
2002 4 4 28 22 28 16 17 5 12<br />
2003 3 7 18 21 19 12 10 14 14<br />
2004 1 1 19 21 15 16 14 5 8<br />
Figure 13: Age-specific homicide death rates by gender,<br />
<strong>Cape</strong> Town, 2001 – 2004<br />
Of the four major cities with full NIMSS coverage, <strong>Cape</strong> Town recorded the<br />
highest percentage of alcohol-positive deaths, with 58% of all homicides in 2004<br />
testing positive for blood alcohol concentration. Levels of intoxication were also<br />
significantly higher than in Johannesburg and Durban. 17<br />
The second major cause of non-natural mortality, road traffic injuries (including<br />
pedestrians), has not experienced the same level of decrease as homicide over<br />
the four-year period. Road traffic injuries are still ranked as the 4 th and 8 th<br />
leading causes of premature mortality among males and females respectively.<br />
Among females the contribution has dropped from 3.8% to 3.3% of YLLs in the<br />
city, but among males it has increased from 7.0% to 7.4%.<br />
26
Although the NIMSS data for 2001 to 2004 show a slight decrease in agestandardised<br />
mortality rates, from 33 to 30/100 000 population, the findings<br />
point to the relative ineffectiveness of current road traffic injury prevention<br />
efforts compared to violence prevention. The NIMSS data reveal two major<br />
problem areas, viz.: (1) the high percentage of pedestrian deaths, which<br />
accounted for approximately 60% of all road traffic fatalities in the city in 2004;<br />
and (2) the alcohol-relatedness of road deaths. The latest NIMSS report for <strong>Cape</strong><br />
Town reveals that in 2004 more than half of drivers (51%) and a staggering 63%<br />
of pedestrians killed on <strong>Cape</strong> Town roads tested positive for alcohol. The fatality<br />
rates by sub-district (Figure 14) indicate that the sub-districts with the lowest<br />
number of fatalities are more developed in terms of road infrastructure, are more<br />
affluent, and have smaller pedestrian populations.<br />
Road traffic accidents<br />
50<br />
45<br />
43.6<br />
41.2<br />
40<br />
38.7<br />
35<br />
31.8<br />
Deaths per 100 000<br />
30<br />
25<br />
20<br />
25.6<br />
19.2 18.9<br />
27.4<br />
26.1<br />
24.2<br />
15<br />
10<br />
9.2<br />
5<br />
0<br />
Athlone Blaauw Central Helder Khay M Plain Nyanga Oos SPD Tyg Eas Tyg Wes<br />
Figure 14: Age-standardised death rates (pooled estimates)<br />
due to road traffic injuries by sub-district, <strong>Cape</strong> Town, 2001 – 2004<br />
Suicide rates (9/100 000) are low in comparison with homicide (66) and road<br />
traffic injuries (27), and have remained fairly stable between 2001 and 2004.<br />
The gender ratio for suicide is four male deaths for every female one. Since it<br />
may take months or years for the final manner of death to be determined<br />
through an inquest, particularly for suicides, some of these may be reported as<br />
‘undetermined’ manner of death. Thus, it is probable that suicide deaths are<br />
underreported in these data.<br />
Although suicide rates in <strong>Cape</strong> Town are similar to the global average, this<br />
should not be construed as an indicator of good mental health, since it should be<br />
recognised that only a small fraction of those with mental health problems<br />
commit suicide. Other injury mortality data also provide proxy measures for the<br />
extent of mental health problems. Homicide rates may also be a good indicator<br />
of mental illness in the community, as well as information on substance abuse,<br />
27
which falls within the spectrum of mental illness. As indicated earlier in this<br />
chapter, homicide rates in <strong>Cape</strong> Town are abnormally high, and the majority of<br />
deaths due to violence and traffic were alcohol-positive. The importance of<br />
recognising the weighty contribution of mental health problems to YLLs in the<br />
province relates to the necessity to plan for mental health and substance abuse<br />
services in the context of the <strong>Western</strong> <strong>Cape</strong> having the highest proportions of<br />
premature deaths due to homicide, road traffic injuries and suicides in the<br />
country.<br />
Non-communicable diseases<br />
Overall, non-communicable disease mortality in <strong>Cape</strong> Town is lower than the<br />
provincial and national averages (Table 3). <strong>Mortality</strong> rates for IHD and stroke are<br />
lower and those for diabetes and cancer of the lung are higher than national<br />
rates. In the case of diabetes, IHD and stroke, this may be due to differences in<br />
the coding practice between the <strong>Cape</strong> Town system and the national vital<br />
registration system. Smoking prevalence is very high among the coloured<br />
population, which is concentrated in the <strong>Western</strong> <strong>Cape</strong>. This may contribute to<br />
the higher mortality rates from cancer of the lung.<br />
Table 3: Comparison of National, <strong>Western</strong> <strong>Cape</strong>, and <strong>Cape</strong> Town<br />
age-standardised mortality rates for non-communicable diseases<br />
Condition<br />
Age-standardised mortality rates per 100 000<br />
SA 2000 18 WC 2000 18 CT 2001<br />
IHD 123 169 101<br />
Hypertension 68 28 42<br />
Stroke 124 122 86<br />
Diabetes 53 52 63<br />
Chronic obstructive<br />
pulmonary<br />
(COPD)<br />
disease<br />
49 52 42<br />
Lung cancer 24 56 41<br />
Oesophageal cancer 17 15 12<br />
Colon cancer 9 15 15<br />
All non-communicable 756 768 674<br />
From Figure 2 it can be seen that non-communicable diseases are the leading<br />
cause of death among both genders over the age of 40 years. These mainly<br />
28
comprise cardiovascular diseases, cancers (neoplasms), respiratory diseases and<br />
diabetes, as shown in the age-standardised rates across the sub-districts in<br />
Figure 15. Conspicuous among these causes are the consequences of the<br />
community syndrome of hypertension, atherosclerosis and diabetes on the one<br />
hand and tobacco use on the other. This confirms earlier work suggesting that<br />
non-communicable disease occurs among poor communities as well as the rich. 19<br />
However, the causes of non-communicable disease mortality differ across the<br />
sub-districts, indicating that they are in different stages of the health transition.<br />
1000<br />
900<br />
800<br />
Deaths per 100 000<br />
700<br />
600<br />
500<br />
400<br />
300<br />
200<br />
100<br />
0<br />
Athlone Blaauw Central Helder Khay M Plain Nyanga Oos SPD Tyg Eas Tyg Wes<br />
Other 89 38 82 61 98 95 108 87 64 55 69<br />
Congenital 3 1 3 2 1 4 2 4 2 3 2<br />
Respiratory 75 36 49 56 100 85 83 80 55 52 65<br />
Diabetes 114 28 44 29 67 140 95 83 57 45 76<br />
Neoplasms 202 123 155 147 171 199 176 182 163 137 181<br />
Cardiovascular 336 174 216 280 249 361 305 292 231 212 288<br />
Figure 15: Age-standardised cause of death rates (pooled estimates) for<br />
non-communicable diseases by sub-district, <strong>Cape</strong> Town, 2001 - 2004<br />
The cardiovascular transition is described by Yusuf et al. 20 as having 5 stages, as<br />
shown in Table 4. As populations move from conditions of under-development<br />
towards industrialised societies, the cardiovascular disease profile changes from<br />
one related to infections and undernutrition. In the second stage, hypertensive<br />
heart disease and haemorrhagic stroke predominate. This is followed by the<br />
stage of increasing obesity, diabetes, all forms of stroke and IHD affecting young<br />
ages. The fourth stage is indicated by a shift in the IHD and stroke mortality to<br />
older ages, and is the current experience of many <strong>Western</strong> countries. Yusuf et al.<br />
have added the final stage based on the experience in parts of Eastern Europe,<br />
with the re-emergence of conditions related to infections and alcohol.<br />
29
Table 4: Epidemiological transition of cardiovascular diseases 20<br />
Stages/ages<br />
1. Pestilence and<br />
famine<br />
2. Receding<br />
pandemics<br />
3. Degenerative<br />
diseases<br />
4. Delayed<br />
degenerative<br />
disease<br />
5. Regression and<br />
social upheaval<br />
CVD<br />
deaths<br />
% of total<br />
Predominant CVD and risk factors<br />
5 – 10 Rheumatic heart, infectious and<br />
nutritional cardiomyopathies<br />
10 - 35 Hypertensive heart disease and<br />
haemorrhagic stroke<br />
35 - 50 All forms of stroke, IHD at young<br />
ages, increasing obesity and diabetes<br />
< 50 Stroke and IHD at old age<br />
35 - 50 Re-emergence of rheumatic heart<br />
disease, infections, increased<br />
alcoholism and violence, increased<br />
CVD in young.<br />
Figure 16 shows the variations in mortality resulting from IHD, stroke,<br />
hypertensive disease and diabetes. IHD mortality is very high in Athlone,<br />
Helderberg, Oostenberg and Tygerberg West but low in Khayelitsha and Nyanga.<br />
The rates are consistently higher for men. Hypertension is very high in Nyanga,<br />
Khayelitsha and Mitchell’s Plain. Stroke is particularly high in Nyanga. Athlone,<br />
Mitchell’s Plain and Nyanga have high diabetes mellitus death rates. The rate for<br />
Nyanga is noticeably higher than Khayelitsha, possibly indicating differing levels<br />
of care of diabetes. There is a marked excess of female mortality from diabetes<br />
in Nyanga. Compared to the national mortality rates in 2000, the mortality rates<br />
from IHD, stroke and hypertensive disease are somewhat lower. However, the<br />
mortality rate from diabetes is higher than the national average. These data<br />
would suggest that Khayelitsha and Nyanga are in the second stage of the<br />
cardiovascular transition, while the other sub-districts are further into it.<br />
30
Stroke<br />
200<br />
180<br />
177<br />
Ischaemic heart disease<br />
140<br />
120<br />
115<br />
130<br />
118<br />
123<br />
Deaths per 100 000<br />
160<br />
140<br />
120<br />
100<br />
80<br />
60<br />
144<br />
79<br />
106<br />
60<br />
93<br />
56<br />
116<br />
115<br />
62<br />
164<br />
95<br />
110<br />
63<br />
105<br />
60<br />
135<br />
78<br />
Deaths per 100 000<br />
100<br />
80<br />
60<br />
40<br />
90<br />
36<br />
42<br />
65<br />
83<br />
65 66<br />
87<br />
85<br />
107<br />
104<br />
104<br />
76<br />
79<br />
62 62<br />
96<br />
81<br />
40<br />
20<br />
36<br />
22<br />
23<br />
22<br />
20<br />
0<br />
Athlone Blaauw Central Helder Khay M Plain Nyanga Oos SPD Tyg Eas Tyg Wes<br />
0<br />
Athlone Blaauw Central Helder Khay M Plain Nyanga Oos SPD Tyg Eas Tyg Wes<br />
Males Females<br />
Males Females<br />
Hypertensive disease<br />
Diabetes<br />
120<br />
111<br />
113<br />
160<br />
152<br />
100<br />
97<br />
95<br />
98<br />
140<br />
Deaths per 100 000<br />
80<br />
60<br />
40<br />
20<br />
73<br />
76<br />
23<br />
31<br />
29<br />
34<br />
25<br />
19<br />
78<br />
21<br />
37<br />
28<br />
26 25<br />
23<br />
48<br />
50<br />
Deaths per 100 000<br />
120<br />
100<br />
80<br />
60<br />
40<br />
105<br />
119<br />
27<br />
28<br />
46<br />
43<br />
33<br />
26<br />
55<br />
78<br />
123<br />
77<br />
109<br />
70<br />
93<br />
60<br />
54<br />
42<br />
47<br />
71<br />
79<br />
20<br />
0<br />
Athlone Blaauw Central Helder Khay M Plain Nyanga Oos SPD Tyg Eas Tyg Wes<br />
0<br />
Athlone Blaauw Central Helder Khay M Plain Nyanga Oos SPD Tyg Eas Tyg Wes<br />
Males<br />
Females<br />
Males Females<br />
Figure 16: Age-standardised death rates (pooled estimates) for IHD, stroke, hypertension and diabetes<br />
by gender and sub-district, <strong>Cape</strong> Town, 2001 - 2004<br />
31
120<br />
100<br />
Deaths per 100 000 population<br />
80<br />
60<br />
40<br />
20<br />
0<br />
2001 2002 2003 2004<br />
Diabetes mellitus 63 64 66 73<br />
Ischaemic heart disease 101 93 91 76<br />
Stroke 86 89 82 71<br />
Hypertensive heart disease 42 43 37 55<br />
Figure 17. Trends in age-standardised death rates per 100 000 population<br />
for selected non-communicable diseases, <strong>Cape</strong> Town, 2001 - 2004<br />
Death rates due to IHD and stroke declined between 2001 and 2004, while death<br />
rates due to diabetes and hypertensive disease increased (Figure 17). It is difficult<br />
to interpret these trends. While they could reflect the transition of a stratified<br />
population, with part of the population in the more advanced stages of the<br />
cardiovascular transition and part in the early stages, they could also reflect specific<br />
trends in the major risk factors - a possible reduction in smoking but worsening diet<br />
and physical inactivity. Alternatively there might be health interventions such as the<br />
development of stroke units that play a role, or perhaps the change in the coding<br />
shortlist introduced during 2004 has contributed to the trend. The data require more<br />
careful analysis to investigate this.<br />
Figure 18 shows the mortality rates due to COPD. These are high in Athlone,<br />
Mitchell’s Plain, Oostenberg, Southern Peninsula, Tygerberg East and Tygerberg<br />
West. The gender differential consistently shows higher rates for men, which is<br />
probably related to smoking. The same sub-districts also display high rates for lung<br />
cancer (Figure 18), and show the same gender differential.<br />
32
COPD<br />
120<br />
100<br />
98<br />
Deaths per 100 000<br />
80<br />
60<br />
40<br />
20<br />
86<br />
24<br />
29<br />
21<br />
39<br />
18<br />
50<br />
27<br />
47<br />
10<br />
27<br />
50<br />
15<br />
82<br />
31<br />
62<br />
23<br />
55<br />
19<br />
74<br />
25<br />
0<br />
Athlone Blaauw Central Helder Khay M Plain Nyanga Oos SPD Tyg Eas Tyg Wes<br />
Males<br />
Females<br />
Lung Ca<br />
100<br />
90<br />
94<br />
91<br />
80<br />
77<br />
Deaths per 100 000<br />
70<br />
60<br />
50<br />
40<br />
35<br />
44<br />
47<br />
59<br />
54<br />
63<br />
56<br />
53<br />
30<br />
20<br />
25<br />
23 23<br />
19<br />
12<br />
29<br />
13<br />
28<br />
23<br />
21<br />
29<br />
10<br />
0<br />
Athlone Blaauw Central Helder Khay M Plain Nyanga Oos SPD Tyg Eas Tyg Wes<br />
Males<br />
Females<br />
Figure 18: Age-standardised death rates (pooled estimates) for COPD and<br />
lung cancer by gender and sub-district, <strong>Cape</strong> Town, 2001 - 2004<br />
33
Cancer of the oesophagus (Figure 19) is very high in Khayelitsha and Nyanga.<br />
These high rates may possibly be a result of migration from the Transkei, which has<br />
very high rates. On the other hand, colon cancer (Figure 19) is very low in Nyanga<br />
and Khayelitsha.<br />
Oesophagus Ca<br />
50<br />
45<br />
40<br />
44<br />
41<br />
38<br />
35<br />
Deaths per 100 000<br />
30<br />
25<br />
20<br />
17<br />
29<br />
22<br />
15<br />
10<br />
5<br />
11<br />
2<br />
9<br />
3<br />
13<br />
6<br />
4<br />
13<br />
6<br />
4<br />
9<br />
3<br />
13<br />
3<br />
14<br />
5<br />
0<br />
Athlone Blaauw Central Helder Khay M Plain Nyanga Oos SPD Tyg Eas Tyg Wes<br />
Males<br />
Females<br />
Colon Ca<br />
25<br />
20<br />
20<br />
Deaths per 100 000<br />
15<br />
10<br />
17<br />
11<br />
14<br />
10<br />
15<br />
13<br />
12<br />
11<br />
15<br />
9<br />
17<br />
10<br />
12<br />
15<br />
16<br />
11 11<br />
5<br />
4<br />
2<br />
3<br />
3<br />
0<br />
Athlone Blaauw Central Helder Khay M Plain Nyanga Oos SPD Tyg Eas Tyg Wes<br />
Males<br />
Females<br />
Figure 19: Age-standardised death rates (pooled estimates) for<br />
oesophagus cancer and colon cancer by gender and sub-district, <strong>Cape</strong><br />
Town, 2001 - 2004<br />
34
Child health<br />
Trends in the mortality of children and adolescents can contribute to assessing the<br />
impact of child health programmes and assist in identifying priorities. In 2004 there<br />
were 2456 deaths in children and adolescents up to 19 years of age. We report<br />
trends in rates for infant deaths (
Table 6: Childhood mortality rates, <strong>Cape</strong> Town, 2004<br />
<strong>Mortality</strong> rates per 1000 live births<br />
Neonatal 9<br />
Infant 24<br />
<strong>Mortality</strong> rates per 100 000 population<br />
Male<br />
Female<br />
1 – 4 years 145 124<br />
5 – 14 years 53 35<br />
15 – 19 years 264 96<br />
Infant mortality<br />
There has been a steady increase in the number of births in the city, with a<br />
relatively large increase in the births reported between 2003 and 2004 in the <strong>Cape</strong><br />
Town Metropole (from 53 000 to 58 000). However, infant mortality rates in <strong>Cape</strong><br />
Town appear to have remained fairly constant, at about 24 deaths per 1000 live<br />
births over the period 2001 until 2004 (Figure 20). The trends in cause-specific<br />
rates for infants per 100 000 population are difficult to interpret. The death rate due<br />
to low birthweight and respiratory distress syndrome has increased markedly<br />
between 2002 and 2004 (Figure 21). This is accompanied by a decrease in the<br />
mortality rate from other conditions originating in the perinatal period, and more<br />
recently a decrease in HIV/AIDS mortality. <strong>Mortality</strong> from diarrhoea and lower<br />
respiratory infections, however, increased in 2004. This increase coincides with an<br />
increase in diarrhoea cases noted at public health facilities in 2004 (Tony Westwood<br />
- personal communication), suggesting that this increase is probably not a misclassification<br />
of HIV-related deaths but due to an outbreak of diarrhoeal disease.<br />
The increase in mortality from low birthweight and prematurity warrants further<br />
investigation.<br />
36
30<br />
Infant deaths per 1000 live births<br />
20<br />
10<br />
24.0 23.7<br />
24.4<br />
23.5<br />
0<br />
2001 2002 2003 2004<br />
Figure 20: Trends in infant mortality rate per 1000 live births,<br />
<strong>Cape</strong> Town, 2001 - 2004<br />
Infants: Trends in death rates for selected causes<br />
800<br />
700<br />
600<br />
Deaths per 100 000 population<br />
500<br />
400<br />
300<br />
200<br />
HIV/AIDS<br />
Low birth weight and RDS<br />
Diarrhoeal Diseases<br />
Lower Respiratory infections<br />
Other perinatal<br />
Congenital abnormalities<br />
100<br />
0<br />
2001 2002 2003 2004<br />
Figure 21: Trends in
There is substantial variation in levels and trends in infant mortality between subdistricts<br />
(Figure 22). The infant mortality rates in Nyanga and Khayelitsha were<br />
almost double the average for the Metropole, and much higher than the other subdistricts.<br />
Some areas have shown little change over the period – while some have<br />
increased and some decreased. Increases have been experienced in Mitchell’s Plain<br />
and South Peninsula – and may well reflect the changing demographic structure of<br />
the population towards a higher proportion of the population being African. While<br />
the rates for Nyanga and Khayelitsha are much higher than other areas, they have<br />
shown some decline over the period.<br />
Infant mortality rates per 1000 live births by sub-district, <strong>Cape</strong> Town 2001 - 2004<br />
60<br />
50<br />
Infant deaths per 1000 live births<br />
40<br />
30<br />
20<br />
10<br />
0<br />
Athlone Blaawberg Central Helderberg Khayelitsha Mitchells<br />
Plain<br />
Nyanga<br />
Oostenber<br />
g<br />
South<br />
Peninsula<br />
Tyg East Tyg West <strong>Cape</strong> Town<br />
2001 12.0 14.6 17.7 28.2 41.6 14.1 56.7 25.5 11.7 22.5 17.5 24.0<br />
2002 14.8 15.6 13.8 26.2 41.6 16.3 44.2 29.6 12.2 18.0 17.6 23.7<br />
2003 18.0 18.6 14.6 30.6 42.1 16.2 38.0 25.1 16.4 21.7 18.2 24.6<br />
2004 13.9 18.8 16.1 25.3 36.2 20.7 41.9 19.9 17.0 22.6 17.0 23.6<br />
Figure 22: Infant mortality rates per 1000 live births by sub-district,<br />
<strong>Cape</strong> Town, 2001 - 2004<br />
In children < 1 year of age, HIV/AIDS ranked as the second highest cause of deaths<br />
in 2001 and 2004, following short gestation and low birthweight. However, more<br />
encouraging is the decline in the proportion of deaths due to HIV in the under-1 age<br />
group, from 20.4% in 2001 to 14.6% in 2004 (data not shown), relative to other<br />
causes of death. The current PMTCT programme in the <strong>Western</strong> <strong>Cape</strong> revealed a<br />
reduction in the transmission rate of 5.5% in 2006. However, this reduction reflects<br />
transmission rates for the first 14 weeks of life only.<br />
The cause of death profile for all neonatal deaths (early and late) is shown in Figure<br />
23. Prematurity/low birthweight accounted for the majority of deaths, followed by<br />
asphyxia and infections. Ten per cent of deaths in this group were ill-defined. The<br />
38
high proportion of deaths resulting from prematurity/low birthweight indicates that<br />
the shortlist for coding should be revised to allow for better differentiation of the<br />
causes. A code must be included for asphyxia and separate codes for the small for<br />
dates low birthweight neonate, distinct from prematurity.<br />
Neonatal Deaths, <strong>Cape</strong> Town 2004<br />
N=540<br />
Congenital<br />
7%<br />
Ill-defined<br />
10%<br />
Other<br />
6%<br />
External<br />
3%<br />
Infection<br />
10%<br />
Asphyxia<br />
11%<br />
Diarrhoea<br />
2%<br />
Other perinatal<br />
6%<br />
Preterm/ low bwt<br />
45%<br />
Figure 23: Neonatal cause of death profile, <strong>Cape</strong> Town, 2004<br />
39
Figure 24 shows the leading causes of death during the early neonatal period (0 - 7<br />
days) and the last neonatal period (8 - 30 days) respectively. Not unexpectedly, the<br />
leading cause of early neonatal deaths in 2004 was prematurity (54.9%), followed<br />
by respiratory distress syndrome (11.9%). Ill-defined deaths accounted for 3.6% of<br />
the perinatal deaths. About a quarter of the deaths in the late neonatal period were<br />
due to ill-defined causes (26.0%). Prematurity was the leading defined cause of<br />
death in this age group, accounting for 23.4% of these deaths. This was followed by<br />
respiratory distress syndrome, lower respiratory infection and congenital<br />
abnormalities. HIV/AIDS accounted for 1.9% of these deaths.<br />
Early neonatal deaths N = 386<br />
Short gestation and Low birth weight<br />
54.9<br />
RDS<br />
11.9<br />
Congenital abnormalities<br />
7.8<br />
Other perinatal<br />
7.3<br />
Ill defined natural 3.6<br />
Neonatal infections 3.4<br />
Other unintentional injuries specified 1.8<br />
Injuries undetermined whether intent or unintent 1.0<br />
Hypertensive disease 1.0<br />
Diarrhoeal Diseases 0.8 Late Neonatal deaths<br />
N = 154<br />
Lower Respiratory infections 0.8<br />
Remainder of diseases of nervous system 0.8<br />
Other Ill defined cardiovascular natural 0.8<br />
26.0<br />
Short gestation Diarrhoeal and Low birth Diseases weight 0.8<br />
23.4<br />
Remainder of diseases of digestive system RDS 0.5<br />
7.8<br />
Lower Respiratory infections<br />
5.8<br />
0 10 20 30 40 50 60<br />
Congenital abnormalities<br />
Septicaemia<br />
Diarrhoeal Diseases<br />
Neonatal infections<br />
Other perinatal<br />
5.8<br />
5.2<br />
4.5<br />
3.9<br />
3.2<br />
Percent<br />
HIV/AIDS<br />
Other respiratory<br />
Other unintentional injuries specified<br />
Bacterial Meningitis and meningococcaemia<br />
Ill defined CVS<br />
1.9<br />
1.9<br />
1.9<br />
1.3<br />
1.3<br />
0 5 10 15 20 25 30<br />
Percent<br />
Figure 24: Leading<br />
causes of deaths in early neonatal infants (0 - 7 days) and late neonatal<br />
infants (8 - 28 days), <strong>Cape</strong> Town, 2004<br />
Ill-defined deaths accounted for an even larger proportion of deaths (28.2%) in the<br />
post-neonatal infants (1 – 11 months) than in the younger age groups (Figures 25<br />
and 26). HIV/AIDS (18%) was the leading defined cause of death, followed by<br />
diarrhoea and lower respiratory infection.<br />
40
Post-neonatal Deaths, <strong>Cape</strong> Town 2004<br />
N=851<br />
External<br />
6.0%<br />
HIV/AIDS<br />
18.0%<br />
Ill-defined<br />
28.2%<br />
Diarhoea<br />
15.4%<br />
Other<br />
9.6%<br />
Congenital<br />
2.6%<br />
Preterm and other<br />
perinatal<br />
3.5%<br />
Other infectious<br />
and parasitic<br />
4.8%<br />
LRI<br />
11.9%<br />
Figure 25: Cause of death profile, post-neonatal infants (1-11 months),<br />
<strong>Cape</strong> Town, 2004<br />
1 - 11 months<br />
N = 851<br />
Ill defined natural<br />
HIV/AIDS<br />
Diarrhoeal Diseases<br />
Lower Respiratory infections<br />
Other respiratory<br />
Congenital abnormalities<br />
Other unintentional injuries specified<br />
Injuries undetermined whether intent or unintent<br />
Septicaemia<br />
Short gestation and Low birth weight<br />
Bacterial Meningitis and meningococcaemia<br />
Tuberculosis<br />
Protein-energy malnutrition<br />
Other perinatal<br />
Remainder of diseases of nervous system<br />
3.4<br />
2.6<br />
2.5<br />
2.4<br />
2.1<br />
2.0<br />
1.5<br />
1.2<br />
1.1<br />
0.7<br />
0.7<br />
11.9<br />
15.7<br />
18.0<br />
27.7<br />
0 5 10 15 20 25 30<br />
Percent<br />
Figure 26: Leading causes of deaths in post neonatal infants<br />
(1 – 11 months), <strong>Cape</strong> Town 2004<br />
41
Child mortality (1 - 4 years)<br />
In contrast to the steady trend in infant mortality, there was a slight increase in the<br />
1 – 4-year mortality rates between 2001 and 2002 and then a decrease to 2004,<br />
mainly due to a decrease in infections including HIV/AIDS and nutritional conditions<br />
(Figure 27). A decrease in the HIV/AIDS death rate would not be unexpected due to<br />
the roll-out of the PMTCT programme which commenced in 2001, and the<br />
availability of ARVs in public hospitals since 2003, but it is encouraging to note the<br />
decrease in the other infections and nutritional conditions as well. The injury<br />
mortality rate does not show any consistent trend.<br />
160<br />
140<br />
120<br />
35 42<br />
37<br />
42<br />
Deaths per 100 000<br />
100<br />
80<br />
60<br />
30 21<br />
35 44<br />
27<br />
40<br />
20<br />
38<br />
40<br />
20<br />
42 39 37 34<br />
0<br />
2001 2002 2003 2004<br />
I. Comm excl HIV, mat, peri and nutrit conditions HIV/AIDS II. Non-communicable diseases III. Injuries<br />
Figure 27: Trend in 1 – 4-year mortality rates per 100 000,<br />
<strong>Cape</strong> Town, 2001 – 2004<br />
The trends in the 1 – 4-year mortality rates per 100 000 population for selected<br />
conditions are shown in Figure 28. This shows very clearly that the death rates due<br />
to HIV/AIDS peaked in 2002 and declined thereafter, and that the HIV/AIDS death<br />
rates are double those of any other condition. There appears to be a slight increase<br />
in death rates due to road traffic injuries and other unintentional injuries between<br />
2002 and 2004. Diarrhoea mortality rates have remained fairly stable over this<br />
period, while death rates due to lower respiratory infections have declined.<br />
42
50<br />
45<br />
40<br />
HIV<br />
Deaths per 100 000 population<br />
35<br />
30<br />
25<br />
20<br />
15<br />
10<br />
Road traffic<br />
Diarrhoeal Diseases<br />
Other unintentional<br />
injuries specified<br />
Lower Respiratory<br />
infections<br />
Fires<br />
Tuberculosis<br />
Drowning<br />
5<br />
0<br />
2001 2002 2003 2004<br />
Figure 28: Trend in 1 – 4-year mortality rates per 100 000 population<br />
for selected conditions, <strong>Cape</strong> Town 2001 - 2004<br />
Pooled estimates of the child (1 - 4 years) mortality rates per 100 000 population<br />
for the period 2001-2004 show large variations by sub-district (Figure 29). Similar<br />
to the geographic differentials in child mortality, Khayelitsha and Nyanga have the<br />
highest rates and South Peninsula the lowest. Over the period 2001 - 2004, the<br />
highest HIV/AIDS-related death rates in children under the age of five were<br />
observed in Nyanga (303/100 000) and Khayelitsha 245/100 000. The lowest were<br />
observed in Tygerberg West (15/100 000) and South Peninsula (37/100 000). This<br />
wide difference in mortality rate of 288 demonstrates the stark differences in<br />
paediatric HIV/AIDS-related mortality across the sub-districts. It also highlights that<br />
the paediatric AIDS epidemic remains a public health challenge, despite the fact<br />
that there are evidence-based and proven interventions such as PMTCT that can<br />
reduce its impact. These findings also underscore the importance of improving the<br />
coverage and assessing the impact of these interventions at sub-district level. For<br />
example, Khayelitsha sub-district, which reported one of the highest mortality rates,<br />
has the most established PMTCT programme in this province.<br />
43
300<br />
250<br />
Deaths per 100 000<br />
200<br />
150<br />
100<br />
50<br />
0<br />
Athlone Blaauw Central Helder Khay M Plain Nyanga Oos SPD Tyg East Tyg Wes<br />
III. Injuries 37 21 34 44 59 27 46 53 21 44 30<br />
II. Non-communicable diseases 13 9 26 10 42 25 27 28 20 31 20<br />
HIV/AIDS 23 24 55 27 87 16 111 36 7 20 4<br />
I. Comm excl HIV, mat, peri, nut 10 20 16 69 86 16 79 33 21 36 15<br />
Figure 29: 1 – 4-year mortality rates (pooled rates) per 100 000 by subdistrict,<br />
<strong>Cape</strong> Town, 2001 – 2004<br />
HIV/AIDS was the leading cause of death among children aged 1-4 years,<br />
accounting for 25.2% of the deaths. This was followed by road traffic injuries, other<br />
unintentional injuries and diarrhoea (Figures 30 and 31). Ill-defined deaths<br />
accounted for 7.3% of deaths in this age group. Males had a larger proportion of<br />
injury deaths excluding fires, while females had a higher proportion of diarrhoea<br />
deaths and deaths due to fires.<br />
44
Deaths in children 1- 4 years, <strong>Cape</strong> Town 2004<br />
N=313<br />
Other external<br />
12.1%<br />
Drowning<br />
3.2%<br />
Fire<br />
3.8%<br />
HIV/AIDS<br />
25.2%<br />
Road traffic<br />
11.8%<br />
Ill-defined<br />
7.3%<br />
Diarhoea<br />
8.6%<br />
LRI<br />
3.5%<br />
Other<br />
17.9%<br />
Other infectious and<br />
parasitic<br />
6.4%<br />
Figure 30: Cause of death profile, children 1 – 4 years,<br />
<strong>Cape</strong> Town, 2004<br />
1 - 4 years (N = 313 )<br />
Male<br />
Female<br />
HIV/AIDS<br />
Road Traffic<br />
Other unintentional injuries specified<br />
Diarrhoeal Diseases<br />
Ill defined natural<br />
Fires<br />
Lower Respiratory infections<br />
Drowning<br />
Tuberculosis<br />
Protein-energy malnutrition<br />
Bacterial Meningitis and meningococcaemia<br />
Injuries undetermined whether intent or unintent<br />
Remainder of diseases of nervous system<br />
Septicaemia<br />
Leukaemia<br />
Epilepsy<br />
15 10 5 0 5 10 15<br />
Figure 31: Leading causes of death in the 1 – 4-year age group,<br />
<strong>Cape</strong> Town, 2004<br />
45
Children of 5-9 years<br />
In age group 5 – 9 years, road traffic injuries (36.1%) move up in the ranking to<br />
the leading cause of death, followed by HIV/AIDS (11.5%) and lower respiratory<br />
infections (6.6%). Homicide ranked ninth and accounted for 4.1% of deaths in this<br />
age group. It is interesting to note the gender differential, with males having a<br />
much higher proportion of deaths due to road traffic injuries than females. The<br />
ranking of the causes is shown by gender in Figure 32 below.<br />
5 - 9 years (N = 122)<br />
Male<br />
Female<br />
Road traffic<br />
HIV/AIDS<br />
Lower Respiratory infections<br />
Injuries undetermined whether intent or unintent<br />
Other unintentional injuries specified<br />
Tuberculosis<br />
Remainder of diseases of nervous system<br />
Drowning<br />
Brain, meninges and CNS cancer<br />
Homicide<br />
Diarrhoeal Diseases<br />
50 40 30 20 10 0 10 20 30<br />
Figure 32: Leading causes of death in 5 – 9-year age group,<br />
<strong>Cape</strong> Town, 2004<br />
46
Children of 10 - 14 years<br />
A similar picture was found for the 10 – 14-year age group, with injuries dominating<br />
the causes of death and with homicide ranking second and accounting for 9.9% of<br />
deaths in this age group. Suicide ranked fifth, accounting for 4.5% of deaths. Again<br />
the males had higher proportions of injury deaths than females, particularly for<br />
homicide. The ranking of causes is shown by gender in Figure 33 below.<br />
10 - 14 years (N = 111)<br />
Males<br />
Females<br />
Road traffic<br />
Homicide<br />
Ill defined natural<br />
Injuries undetermined whether intent or unintent<br />
Suicide and self-inflicted<br />
Tuberculosis<br />
Remainder of diseases of nervous system<br />
Stroke<br />
Drowning<br />
Other unintentional injuries specified<br />
Other malignant neoplasms<br />
Fires<br />
HIV/AIDS<br />
Diarrhoeal Diseases<br />
Pulmonary heart and circulatory disease<br />
20 15 10 5 0 5 10 15<br />
Figure 33: Leading causes of death in 10 – 14-year age group,<br />
<strong>Cape</strong> Town, 2004<br />
47
Children of 15 - 19 years<br />
In the 15 – 19-year age group it is shocking to note that homicide ranks first and<br />
accounts for almost half of the deaths (42.3%). Road traffic ranks second, followed<br />
by suicide and then HIV/AIDS. The ranking by gender is shown in Figure 34. Males<br />
in this age group are at much higher risk of dying than females, with 2.7 male<br />
deaths for every female death from all causes, and 6.6 male deaths for each female<br />
death from injury.<br />
15 - 19 years (N = 499)<br />
Males<br />
Females<br />
Homicide<br />
Road traffic<br />
Suicide and self-inflicted<br />
HIV/AIDS<br />
Tuberculosis<br />
Injuries undetermined whether intent or unintent<br />
Other transport accidents<br />
Ill defined natural<br />
Other unintentional injuries specified<br />
Fires<br />
Septicaemia<br />
Lower Respiratory infections<br />
Epilepsy<br />
Drowning<br />
Other cardiovascular<br />
45 40 35 30 25 20 15 10 5 0 5 10<br />
Figure 34: Leading causes of death in 15 – 19-year age group,<br />
<strong>Cape</strong> Town, 2004<br />
48
Women’s health<br />
The City of <strong>Cape</strong> Town has introduced a women’s health programme that aims to<br />
improve reproductive health services and provide cervical cancer screening.<br />
<strong>Mortality</strong> indicators specific to the programme would include maternal mortality and<br />
cervical cancer. However, in the context of women’s health it would also be useful<br />
to review breast cancer mortality and the overall mortality pattern among adult<br />
women.<br />
From 2001 - 2004 there were 33 deaths reported as being due to maternal<br />
conditions on death notifications for <strong>Cape</strong> Town. This gives a maternal mortality<br />
ratio of 15 deaths per 100 000 births, somewhat lower than the maternal mortality<br />
ratio of 112 per 100 000 for deliveries in health facilities in 2002 that was reported<br />
by Fawcus et al. 21 based on a review of the Peninsula Maternal and Neonatal Service<br />
data. The most recent report from the Confidential Enquiry into Maternal Deaths<br />
based on the notifications of maternal deaths indicates that there were 207<br />
maternal deaths in the whole of the <strong>Western</strong> <strong>Cape</strong> Province between 2002 and<br />
2004. Since approximately half the deaths in the <strong>Western</strong> <strong>Cape</strong> occur in the <strong>Cape</strong><br />
Town Metropole, one might expect about 100 maternal deaths during this period.<br />
The programme needs to obtain the Metropole data provided through the<br />
confidential enquiry, but the quality of the cause of death data regarding maternal<br />
deaths also needs to be improved. Training is needed to sensitise the coders on the<br />
one hand and improve quality of certification on the other. The number of maternal<br />
deaths recorded through the death certification system is likely to be an<br />
underestimate.<br />
Death from cancer of the cervix is eminently preventable. The screening programme<br />
aims to identify cases of cancer in the early stage of the disease when appropriate<br />
treatment can prevent the fatal consequence. At this stage there is no public<br />
programme for breast cancer screening since such a programme is much more<br />
costly. Age-standardised rates for cervical cancer and breast cancer mortality are<br />
shown for the sub-districts of <strong>Cape</strong> Town in Figure 35. There is considerable<br />
variation, partly reflecting differential access to health services. Cervical cancer<br />
mortality rates are highest in Nyanga (26/100 000 females) and Khayelitsha<br />
(20/100 000 females). In all the other sub-districts breast cancer death rates are<br />
higher than cervical cancer rates.<br />
49
35<br />
30<br />
25<br />
30<br />
25<br />
23<br />
28<br />
26<br />
27<br />
25<br />
27<br />
Deaths per 100 000<br />
20<br />
15<br />
13<br />
19<br />
15<br />
20<br />
15<br />
18<br />
14<br />
20<br />
10<br />
10<br />
8<br />
9<br />
7<br />
9<br />
6<br />
5<br />
0<br />
Athlone Blaauw Central Helder Khay M Plain Nyanga Oos SPD Tyg Eas Tyg Wes<br />
Breast cancer<br />
Cervix and uterus cancer<br />
Figure 35: Age-standardised mortality rates (pooled estimates) for cervix<br />
and breast cancer by sub-district, <strong>Cape</strong> Town, 2001 – 2004<br />
The premature mortality experienced in 2004 by women aged 15 years and older is<br />
presented in Figure 36. This shows that breast cancer accounts for 3%, cervical for<br />
1% and maternal deaths for less than 1%, and that the major causes of death are<br />
conditions that affect both men and women. HIV/AIDS and TB together account for<br />
a third of the premature mortality. Among young women HIV/AIDS is the leading<br />
cause of death, while at later ages non-communicable diseases dominate (see<br />
Figure 2). Non-communicable diseases account for almost half of the premature<br />
mortality among adult women. The cardiovascular causes together with diabetes<br />
account for a quarter of the premature mortality among women. While the focus of<br />
a women’s health programme needs to continue to address the concerns of<br />
women’s specific conditions, it is clear that reducing the premature mortality burden<br />
for women will require interventions targeting HIV/AIDS and TB on the one hand<br />
and cardiovascular diseases and diabetes on the other.<br />
50
Females 15+ years<br />
Unintentional<br />
6%<br />
Intentional<br />
5%<br />
Inf and para<br />
3%<br />
Resp infections<br />
3%<br />
Maternal<br />
0%<br />
TB<br />
9%<br />
Other non communicable<br />
10%<br />
Other CVD<br />
4%<br />
Hypertension<br />
4%<br />
HIV<br />
26%<br />
Stroke<br />
5%<br />
IHD<br />
4%<br />
Diabetes<br />
7%<br />
Other CA<br />
7%<br />
Breast Ca<br />
3%<br />
Lung Ca<br />
3%<br />
Cervix Ca<br />
1%<br />
Figure 36: Premature mortality (YLLs) cause profile for women of 15+<br />
years, <strong>Cape</strong> Town, 2004<br />
51
Men’s health<br />
There is currently no men’s health programme. Among men, injuries account for<br />
40% of premature mortality (Figure 37). Injuries predominate in early adulthood,<br />
and the majority are the result of interpersonal violence. HIV/AIDS and TB also<br />
account for a quarter of the premature mortality among men. A variety of chronic<br />
conditions occurring later in life account for about a third of premature mortality.<br />
These feature not only the cardiovascular and diabetes combination, as reflected in<br />
the profile for women, but also the respiratory conditions, including COPD and lung<br />
cancer. The data would indicate a need to focus on violence and injuries, HIV/AIDS<br />
and TB, smoking and other risk factors for chronic diseases.<br />
Males 15+ years<br />
Suicide<br />
3%<br />
Inf and para Resp infections<br />
2% 2%<br />
TB<br />
10%<br />
Homicide<br />
22%<br />
HIV<br />
13%<br />
Other unint<br />
7%<br />
Road traffic<br />
7%<br />
Other non communicable<br />
7%<br />
COPD<br />
3%<br />
Other CVD<br />
3%<br />
IHD<br />
4%<br />
Stroke<br />
3%<br />
Hypertension<br />
2%<br />
Diabetes<br />
3%<br />
Lung Ca<br />
3%<br />
Oesophagus Ca<br />
1%<br />
Stomach Ca<br />
1%<br />
Prostate Ca<br />
1%<br />
Other Ca<br />
5%<br />
Figure 37: Premature mortality (YLLs) cause profile for men<br />
15+ years, <strong>Cape</strong> Town, 2004<br />
Prostate cancer is the only condition that is specific to men. It accounts for 1% of<br />
the overall premature mortality. The age-standardised rates for the sub-districts are<br />
shown in Figure 38. These compare to the estimate of 32/100 000 for the <strong>Western</strong><br />
<strong>Cape</strong> Province and a national estimate of 27/100 000 in 2000. 18 The rates are<br />
particularly low in Khayelitsha (15/100 000 males), while Athlone, Mitchell’s Plain<br />
and Oostenberg all have rates over 30/100 000 males. It is not clear whether these<br />
variations reflect real differences in the incidence of the condition, variations in<br />
access to treatment, or whether they also include the differences in diagnosis.<br />
52
Prostate cancer<br />
40<br />
35<br />
32<br />
35<br />
35<br />
Deaths per 100 000<br />
30<br />
25<br />
20<br />
15<br />
26<br />
20<br />
28<br />
15<br />
27<br />
27<br />
19<br />
28<br />
10<br />
5<br />
0<br />
Athlone Blaauw Central Helder Khay M Plain Nyanga Oos SPD Tyg Eas Tyg Wes<br />
Figure 38: Age-standardised mortality rates (pooled estimates) for<br />
prostate cancer by sub-district, <strong>Cape</strong> Town, 2001 – 2004<br />
53
Discussion<br />
The <strong>Cape</strong> Town routine local mortality surveillance system provides a wealth of data<br />
on the health of the population in <strong>Cape</strong> Town. Analysis of these data has provided<br />
an opportunity to assess priority programmes in terms of mortality for the first<br />
time. The analysis also points to emerging health issues and vulnerable groups who<br />
can be identified and targeted for interventions.<br />
It is clear that HIV/AIDS mortality has increased dramatically since 2001. <strong>Mortality</strong><br />
from HIV/AIDS appears to have stabilised in 2004, possibly demonstrating the<br />
impact of the PMTCT and ARV programmes. However, ongoing monitoring is<br />
required in order to confirm this trend. Unfortunately, during 2005 data collection<br />
became a problem, and the data for this year are not complete enough to assess<br />
trends. Continued efforts to reduce the spread of HIV and provide appropriate<br />
treatment and care for people with AIDS is a priority. The coding practice with<br />
regard to HIV/AIDS used in the Metropole is different from that used by Stats SA,<br />
where euphemisms and abbreviations for HIV such as ‘RVD’ and ‘immune<br />
suppression’ are not coded to HIV. The interpretive coding practice used in the<br />
Metropole provides more meaningful statistics regarding HIV/AIDS. Nonetheless,<br />
the tendency to certify the indicator conditions and not disclose HIV would result in<br />
an under-estimate of the HIV/AIDS mortality rates.<br />
<strong>Mortality</strong> due to injuries, particularly homicide, is extremely high in the City of <strong>Cape</strong><br />
Town. There is evidence of a declining trend during this period. However, injury<br />
mortality rates, particularly homicide and road traffic injuries, remain among the<br />
highest in the world. The homicide rates are exceedingly high for men. Of particular<br />
concern are the high homicide and road traffic injury fatality rates among the male<br />
youth. This is likely to be linked to alcohol and other substance abuse, but limited<br />
routine data are collected in this area. Urgent attention needs to be given to<br />
identifying and implementing strategies to prevent injuries.<br />
<strong>Mortality</strong> rates due to non-communicable diseases are relatively high, with<br />
geographic variations along the lines of the epidemiological transition. Diabetes<br />
mortality rates are very high when compared to developed countries, suggesting<br />
that there is scope for better management of the condition, particularly at primary<br />
care level. While the mortality rates for other cardiovascular conditions are lower<br />
than the national average, they nonetheless can be reduced further through health<br />
promotion, improved risk factor management at primary care, and secondary<br />
prevention after a cardiovascular event. Non-communicable diseases account for a<br />
high proportion of premature mortality in adult women. Smoking rates are high in<br />
the coloured population, especially among females. 22<br />
Child mortality appears to have remained constant over this period, but there is an<br />
unusual increase in mortality from low birthweight that needs further investigation.<br />
The data would suggest that child mortality due to HIV/AIDS has started<br />
decreasing, even although this study period covers only the beginning of the full-<br />
54
scale PMTCT roll-out. In view of the fact that HIV/AIDS remains a leading cause of<br />
death in children under 5 years of age, it highlights the need to link the PMTCT<br />
interventions to the broader maternal and child health programmes and<br />
interventions that extend beyond the first few months of life. <strong>Cape</strong> Town also<br />
experienced an increase in diarrhoea death rate in 2004 that was accompanied by<br />
an increase in the number of cases attending hospital; this appears to be related to<br />
an outbreak rather than being related to HIV/AIDS.<br />
Khayelitsha and Nyanga have a considerably higher burden than other sub-districts.<br />
Despite an increase in HIV/AIDS mortality in Khayelitsha, overall mortality has<br />
decreased in this sub-district, mainly due to a reduction in injuries. This may be<br />
partly due to an intervention by the Department of Safety and Security, which<br />
prioritised certain police stations (including Khayelitsha) for additional resources and<br />
attention. In Khayelitsha, for example, an operational centre and two new police<br />
stations were built and resourced, sector policing was introduced, community<br />
partnerships were forged and shebeen trading hours were restricted.<br />
We consider the <strong>Cape</strong> Town surveillance system to consist of fairly robust statistics<br />
for between 2001 and 2004. Assessment of the completeness of adult death data<br />
indicates that there is little under-registration. Estimates of the population at subdistrict<br />
level are from the projections done for the City using the ASSA model. The<br />
number of births is taken from the City of <strong>Cape</strong> Town’s birth data. It should be<br />
recognised that there is a level of uncertainty in these numbers. However, initial<br />
analysis of the 2005 data suggests that there has been some deterioration in the<br />
system that requires urgent attention. In addition, the higher caseload recorded by<br />
the NIMSS for injuries underscores the importance of developing a sustainable<br />
mortuary-based data collection system.<br />
55
Recommendations<br />
Analysis of the 2001 mortality data for the City of <strong>Cape</strong> Town highlighted the<br />
differentials in levels of mortality across the city as well as the quadruple burden<br />
that is experienced across all the sub-districts. For the first time an analysis of the<br />
emerging trends in mortality has been undertaken covering the period 2001 - 2004.<br />
This shows that HIV/AIDS has taken over from homicide as the leading cause of<br />
premature mortality, partly as a result of a decline in homicides in this period as<br />
well as an increase in HIV/AIDS. Diabetes, stroke and IHD are all among the leading<br />
causes of premature mortality and have shifted rankings, with diabetes going from<br />
eighth in 2001 to fifth in 2004.<br />
The broad recommendations made on the basis of the 2001 data are still highly<br />
pertinent. While there are indications that there have been some gains in reducing<br />
the burden of violence and homicide, the extremely high mortality rates, particularly<br />
in some areas, highlight the urgency of addressing the underlying determinants of<br />
the high levels of violence. Efforts to curb the HIV/AIDS epidemic as well as TB need<br />
to continue to be strengthened. The emerging epidemic of non-communicable<br />
diseases must also be tackled through strengthening primary care management on<br />
the one hand and promoting healthy lifestyles on the other. Finally, equity must be<br />
prioritised in resource allocation between the sub-districts.<br />
Focusing on child health shows that the effective implementation of the PMTCT<br />
programme will impact on mortality in the age group 1 - 4 years, and that there is a<br />
need to investigate the increase in mortality from low birthweight and prematurity<br />
reflected among infants during this period. Road traffic injuries and other<br />
unintentional injuries among the young children and homicide among the older<br />
children are also issues of concern, particularly for boys. The inequities in health<br />
status are marked in the child mortality indicators, making these mortality rates a<br />
sensitive indicator to monitor progress in reducing the inequities in the future.<br />
The local mortality surveillance system is providing mortality information for the<br />
region. However, in order to ensure the sustainability, improve the quality of the<br />
data collected, and ensure that the results are optimally utilised, integration with<br />
other systems such as Home Affairs, the mortuaries, NIMSS, Stats SA, South<br />
African Police Services and the Departments of Transport and Education, must be<br />
improved. Linking the NIMSS data with the <strong>Cape</strong> Town surveillance system will<br />
improve the quality of injury death data, particularly relating to the manner of<br />
death.<br />
56
Interventions must be planned, implemented, monitored and evaluated multisectorally.<br />
Vulnerable groups/areas identified through the system must be targeted<br />
for interventions. Men’s health has traditionally been overlooked, which is of<br />
concern given the high death rates among young adult men. Injuries are the<br />
predominant cause of death among, men for which structural and social<br />
interventions are needed.<br />
57
Appendix 1: Exclusions from <strong>Cape</strong> Town mortality surveillance data 2001 -<br />
2004<br />
2001 2002 2003 2004<br />
Total deaths 23 818 24 196 24 069 24 449<br />
No gender 3 5 2 0<br />
Duplicates 120 87 10 34<br />
Invalid cause of<br />
death<br />
Total deaths<br />
analysed<br />
17 15 8 25<br />
23 681 24 089 24 049 24 389<br />
58
Appendix 2: Completeness of vital registration in <strong>Cape</strong> Town<br />
Assessing the completeness of death registration is difficult. Although there are<br />
techniques available, they either require that migration be negligible in comparison<br />
with the deaths (which is unlikely for small populations), or - if adapted to allow for<br />
migration - that one has a reasonably accurate measure of net migration. Since we<br />
do not have such an accurate measure of migration for <strong>Cape</strong> Town, an alternative<br />
approach was necessary: the numbers of deaths registered by the City of <strong>Cape</strong><br />
Town were compared to those reported by households in the 2001 census.<br />
However, before this could be done, it was necessary to adjust the numbers of<br />
deaths reported by households in the census for any incompleteness of reporting.<br />
This was done at a national level by Dorrington, Moultrie and Timaeus (2004), and<br />
we used their correction factors by population group on the assumption that the<br />
quality of reporting by households was independent of geographical area. 1<br />
Unfortunately, since this method relies on the assumption that completeness of<br />
reporting of deaths by households is constant with respect to age, it is only reliable<br />
for estimating the completeness of reporting of adult deaths (e.g. those 15 and<br />
older). For children, in the absence of any recent independent estimates of child<br />
mortality, we were forced to assess completeness by comparing the number of<br />
recorded deaths against those estimated by the ASSA2003 model for the City<br />
(Dorrington, 2005).<br />
Completeness of adult deaths<br />
The number of adult deaths from the <strong>Cape</strong> Town vital registration in 2001 is<br />
compared with the number of deaths reported by households based on the 2001<br />
census, once the household deaths had been adjusted for under-reporting. 2 Table<br />
2.1 shows a summary of the comparison that was done by age and sex. This<br />
indicates that the 2001 vital registration of deaths among adults in <strong>Cape</strong> Town can<br />
be considered to be around 95% complete. Although completeness was pretty<br />
constant with respect to age for females, there was a steady downward trend in<br />
completeness with age for males which is difficult to interpret and needs further<br />
analysis.<br />
1<br />
Dorrington, R. E., Moultrie, T.A., Timaeus I.A. (2004). Estimation of mortality using the South African 2001<br />
census data. Monograph 11. <strong>Cape</strong> Town, Centre for Actuarial Research, University of <strong>Cape</strong> Town.<br />
2 Zinyaktira N. (2006). Preparatory work for MPhil thesis at UCT.<br />
59
Table 2.1: Completeness ratios of vital registration in <strong>Cape</strong> Town (2001) (%)<br />
Age Male Female Total<br />
Median (15 - 85+) 96.8 94.5 96.2<br />
Average (15 - 85+) 95.8 96.5 96.8<br />
Median (20 - 85+) 95.7 93.9 95.9<br />
Average (20 - 85+) 94.9 95.2 95.9<br />
As the census data are only available for a single year, it is necessary to assess<br />
whether the levels of completeness of death registration in <strong>Cape</strong> Town have<br />
changed over time. In order to do this we examined the ratio of the rates of<br />
mortality in each year to that in 2001 for non-lung and non-oesophageal cancers<br />
combined, as well as the overall mortality rates in the 10-14 and 60+ age groups<br />
(which are not expected to be influenced by AIDS). Trends in these ratios suggest<br />
that it is reasonable to assume that the levels of completeness have not changed<br />
much during this period 2001 to 2004. 1<br />
Table 2.2 shows the number of deaths on the population register registered in the<br />
regional offices of Home Affairs based in <strong>Cape</strong> Town. The number of deaths in the<br />
population of 15 years and older compares well with those registered on the<br />
population register. However, in 2005 the proportion drops to 84%, suggesting that<br />
there was a problem in the system of collecting the death certificates in that year.<br />
For this reason, 2005 has been excluded from the analysis.<br />
1 Zinyaktira N. (2006). Preparatory work for MPhil thesis at UCT.<br />
60
Table 2.2: Numbers of deaths in those aged 15+ years reported by <strong>Cape</strong> Town<br />
Metropole and on the population register<br />
Year<br />
<strong>Cape</strong> Town<br />
deaths<br />
Population register (<strong>Cape</strong><br />
Town offices of Home<br />
Affairs)<br />
% of population<br />
register deaths<br />
2001 21 809 20 921 104.2%<br />
2002 22 216 22 318 99.5%<br />
2003 22 156 22 616 98.0%<br />
2004 22 459 22 663 99.1%<br />
2005 19 989 23 804 84.0%<br />
Completeness in children and infant death data<br />
The ratio of the number of deaths of children aged 0 - 4 to the number of women<br />
aged 15 -49 1 was obtained from the ASSA model in each year from 1996 to 2004<br />
for Africans, whites and coloureds (Indians are included with coloureds due to their<br />
small numbers in the city). Using the proportion of women aged 15 to 49 in each<br />
population group (with coloured and Indian proportions combined) as weights, a<br />
weighted average of the mortality ratio of the children to women of child-bearing<br />
age was calculated from the model. From this the expected numbers of deaths in<br />
each year were then estimated by multiplying the weighted average ratios of the<br />
children (0 - 4) with the total female population aged between 15 and 49.<br />
The expected deaths are calculated for both sexes combined as there is no reason<br />
to suppose that the completeness between the male and female children is<br />
different. This was also done for infants alone. Table 2.3 compares the number of<br />
deaths from the <strong>Cape</strong> Town death surveillance system with these estimates. While<br />
this could suggest considerable under-registration of child deaths, it is more likely to<br />
suggest the need to reconsider the assumptions that are made in the ASSA model<br />
regarding child mortality. While it is known that there is considerable under-<br />
1 Women aged 15-49 are the population giving birth to children at risk of dying. This ratio was used in<br />
preference to a mortality rate since there is significant under registration of births, and under count of<br />
children in the census.<br />
61
egistration of child deaths in rural areas, 1 the problem has not previously been<br />
identified in the in the urban areas.<br />
Table 2.3: Completeness in infants and children<br />
Infants Children (0 - 4)<br />
2001 66.9 53.3<br />
2002 65.4 51.6<br />
2003 70.1 53.6<br />
2004 78.1 58.6<br />
Completeness of injury deaths<br />
Table 2.4 shows a comparison of the total number of injury deaths in the <strong>Cape</strong><br />
Town mortality surveillance with data from the National Injury <strong>Mortality</strong> <strong>Surveillance</strong><br />
System (NIMSS), which has maintained coverage of the two <strong>Cape</strong> Town mortuaries<br />
at Salt River and Tygerberg over the four–year period from 2001 to 2004. 2 Deaths<br />
that occur in Helderberg present to Stellenbosch mortuary, so these data are<br />
removed from the <strong>Cape</strong> Town mortality surveillance data for the comparison.<br />
As may be expected, there are more deaths recorded in the NIMSS for all years,<br />
since the <strong>Cape</strong> Town mortality surveillance system includes deaths based on place<br />
of residence while the NIMSS records the place of death for the deceased. Thus<br />
deaths among recent migrants into the city, many of whom are young adults most<br />
at risk of injuries, will not be reflected in the <strong>Cape</strong> Town mortality surveillance<br />
system but will be reflected in NIMMS. The comparison suggests that suicides might<br />
be under-reported in the <strong>Cape</strong> Town mortality surveillance. However, more detailed<br />
investigation is needed to understand the differences between the two data sets.<br />
1 Kahn K. Dying for change reports that in the rural area of Agincourt, registration of child deaths<br />
increased from 20% in the early 1990’ to 30% by the year 2000.<br />
2 Matzopoulos R (editor). A profile of fatal injuries in South Africa: 6 th annual report of the National<br />
Injury <strong>Mortality</strong> <strong>Surveillance</strong> System, 2004. <strong>Cape</strong> Town: Crime, Violence and Injury Lead Programme,<br />
Medical Research Council/University of South Africa, 2005.<br />
62
Table 2.4: City of <strong>Cape</strong> Town* injury deaths as % of NIMSS deaths<br />
2001 2002 2003 2004<br />
Homicide 93.3 95.1 86.3 88.2<br />
with firearm 102.9 98.8 91.8 95.4<br />
Suicide 77.2 73.7 61.4 82.8<br />
Road traffic 79.4 77.9 77.8 86.2<br />
Unintentional 122.8 136.8 116.9 150.0<br />
Undetermined 71.0 130.7 50.4 83.8<br />
Total 91.6 97.7 84.3 95.4<br />
* Deaths in the sub-distract of Helderberg have been removed<br />
63
Appendix 3: CARe * population estimates for <strong>Cape</strong> Town Metropole, 2001 - 2004 12<br />
Age<br />
Males Females Persons<br />
group 2001 2002 2003 2004 2001 2002 2003 2004 2001 2002 2003 2004<br />
0 30066 30681 31112 31386 29583 30197 30626 30899 59649 60878 61738 62284<br />
1-4 112996 113885 115215 116867 111317 112243 113593 115251 224312 226128 228808 232118<br />
5-9 130287 131944 133710 135527 127690 129549 131385 133271 257978 261493 265096 268798<br />
10-14 132580 132323 132040 131655 131380 130682 130203 129746 263961 263005 262242 261401<br />
15-19 145290 143571 140965 138282 147002 145465 142750 139494 292292 289036 283714 277777<br />
20-24 145224 149247 152722 155021 148822 153153 156653 159246 294046 302400 309375 314268<br />
25-29 144967 147770 149485 150773 149332 151884 153777 155020 294299 299654 303262 305794<br />
30-34 132660 135399 138381 141119 136129 139403 142371 145175 268789 274803 280752 286294<br />
35-39 116724 120001 122665 125079 124740 126971 128868 130388 241464 246972 251533 255467<br />
40-44 97187 100791 104097 106985 105839 110167 113898 117171 203026 210958 217995 224156<br />
45-49 73130 76803 80765 84986 82397 86334 90638 94938 155526 163137 171403 179925<br />
50-54 57956 60068 62021 63867 65210 68171 70806 73457 123167 128239 132828 137324<br />
55-59 42139 44140 46313 48704 48226 50392 53256 56361 90366 94532 99569 105065<br />
60-64 34026 34766 35349 35717 40903 41750 42285 43011 74929 76516 77634 78728<br />
65-69 23386 24272 25385 26779 31483 32700 34033 35136 54869 56972 59417 61915<br />
70-74 16780 17094 17336 17461 24259 24674 25077 25670 41039 41768 42413 43132<br />
75-79 10640 10849 11069 11317 16749 17270 17832 18364 27389 28119 28901 29681<br />
80-84 5873 6042 6218 6361 10455 10853 11128 11403 16328 16895 17345 17764<br />
85+ 3235 3379 3512 3661 8113 8229 8457 8698 11348 11608 11969 12359<br />
Total 1455149 1483025 1508359 1531549 1539630 1570085 1597636 1622700 2994779 3053111 3105994 3154249<br />
* CARe – Centre for Actuarial Research, University of <strong>Cape</strong> Town<br />
64
Appendix 4: Population estimates for males for sub-districts of <strong>Cape</strong> Town Metropole, 2001 – 2004<br />
2001 males<br />
Age<br />
group<br />
Athlone Blaauwberg Central Helderberg Khayelitsha Mitchell’s<br />
Plain<br />
Nyanga Oostenberg South<br />
Pen<br />
Tyg<br />
East<br />
Tyg<br />
west<br />
<strong>Cape</strong><br />
Town<br />
0 1881 1735 2213 1345 3945 3054 3536 3359 3044 2637 3317 30066<br />
1-4 7389 6514 7408 5256 13660 11705 12337 12929 12635 10301 12864 112996<br />
5-9 9010 7003 8492 6183 14848 13781 13222 14456 14839 12399 16055 130287<br />
10-14 9570 6978 9063 5999 14517 14905 12309 14310 15493 12925 16511 132580<br />
15-19 9567 7384 11697 6165 16114 16199 14212 14459 17677 13902 17914 145290<br />
20-24 7782 7378 16255 6228 18285 13273 17247 13882 16640 12340 15914 145224<br />
25-29 7557 8503 14704 6699 19086 11877 18725 14484 16227 11819 15286 144967<br />
30-34 7278 8194 12291 6079 15217 10684 14346 15140 16263 12259 14908 132660<br />
35-39 6683 7065 9810 5414 12570 10005 11182 13607 14731 11538 14118 116724<br />
40-44 5499 5814 8587 4644 9253 9190 7813 11059 12712 10229 12387 97187<br />
45-49 4284 4229 6904 3549 6437 7610 5905 7695 9560 7414 9543 73130<br />
50-54 3679 3305 6365 2802 4156 5775 4373 5288 8421 5771 8022 57956<br />
55-59 3131 2416 5149 2214 2317 3660 2823 3702 6485 4387 5856 42139<br />
60-64 2851 1886 4262 2001 1622 2484 2010 2755 5674 3387 5093 34026<br />
65-69 2140 1267 3201 1510 714 1414 1056 1721 4146 2338 3879 23386<br />
70-74 1334 944 2885 1213 442 775 789 1006 3182 1503 2708 16780<br />
75-79 798 564 1964 896 230 299 567 610 2116 1052 1546 10640<br />
80-84 285 276 1648 528 148 116 297 296 1075 475 727 5873<br />
85+ 145 133 914 344 52 51 146 138 666 318 327 3235<br />
Total 90863 81588 133813 69069 153614 136858 142896 150896 181584 136994 176974 1455149<br />
65
2002 males<br />
Age<br />
group<br />
Athlone Blaauwberg Central Helderberg Khayelitsha Mitchell’s<br />
Plain<br />
Nyanga Oostenberg South<br />
Pen<br />
Tyg<br />
East<br />
Tyg<br />
west<br />
<strong>Cape</strong><br />
Town<br />
0 1913 1790 2255 1389 3962 3135 3621 3467 3071 2705 3372 30681<br />
1-4 7410 6679 7554 5312 13561 11796 12405 13155 12753 10390 12870 113885<br />
5-9 9105 7162 8638 6278 15032 13833 13308 14726 15013 12590 16258 131944<br />
10-14 9576 6973 9058 6005 14716 14718 12227 14314 15490 12875 16371 132323<br />
15-19 9419 7350 11344 6166 16165 15877 13959 14430 17365 13804 17692 143571<br />
20-24 7866 7756 16547 6505 18778 13693 17631 14550 16916 12734 16270 149247<br />
25-29 7591 8862 14869 6815 19489 12315 19186 14936 16285 12012 15409 147770<br />
30-34 7407 8588 12583 6127 15258 10897 14629 15570 16462 12575 15304 135399<br />
35-39 6892 7317 9951 5571 12849 10219 11466 14044 15119 11933 14641 120001<br />
40-44 5682 6081 8777 4891 9449 9358 8007 11610 13175 10744 13017 100791<br />
45-49 4503 4472 7002 3789 6783 7990 6206 8176 9907 7863 10110 76803<br />
50-54 3794 3444 6498 2882 4359 6068 4553 5474 8622 6005 8369 60068<br />
55-59 3259 2566 5338 2305 2381 3859 2955 3895 6774 4632 6177 44140<br />
60-64 2868 1967 4269 2029 1695 2571 2046 2835 5819 3474 5193 34766<br />
65-69 2210 1346 3238 1553 711 1482 1096 1800 4290 2463 4083 24272<br />
70-74 1338 990 2904 1197 444 806 800 1026 3245 1553 2792 17094<br />
75-79 820 602 1962 882 226 286 574 627 2157 1101 1612 10849<br />
80-84 298 289 1711 518 162 116 309 300 1094 492 755 6042<br />
85+ 152 145 957 352 52 51 150 147 689 337 346 3379<br />
Total 92103 84378 135454 70566 156072 139068 145127 155083 184247 140285 180642 1483025<br />
66
2003 males<br />
Age<br />
group<br />
Athlone Blaauwberg Central Helderberg Khayelitsha Mitchell’s<br />
Plain<br />
Nyanga Oostenberg South<br />
Pen<br />
Tyg<br />
East<br />
Tyg<br />
west<br />
<strong>Cape</strong><br />
Town<br />
0 1934 1833 2283 1425 3957 3199 3684 3554 3081 2756 3406 31112<br />
1-4 7460 6867 7732 5386 13524 11932 12522 13428 12921 10517 12923 115215<br />
5-9 9208 7324 8794 6378 15237 13897 13406 15004 15203 12789 16470 133710<br />
10-14 9580 6962 9053 6008 14918 14533 12146 14309 15485 12820 16225 132040<br />
15-19 9216 7263 10938 6125 16115 15462 13624 14299 16953 13613 17356 140965<br />
20-24 7919 8108 16778 6762 19208 14062 17949 15171 17125 13081 16558 152722<br />
25-29 7569 9154 14926 6877 19756 12668 19510 15275 16221 12113 15415 149485<br />
30-34 7548 9003 12901 6182 15330 11128 14937 16028 16687 12912 15724 138381<br />
35-39 7068 7528 10041 5699 13067 10379 11691 14406 15432 12265 15091 122665<br />
40-44 5848 6329 8937 5127 9616 9492 8173 12130 13600 11232 13614 104097<br />
45-49 4740 4731 7118 4048 7159 8399 6530 8692 10285 8345 10719 80765<br />
50-54 3898 3571 6612 2953 4557 6351 4722 5643 8798 6223 8694 62021<br />
55-59 3398 2728 5545 2405 2451 4076 3099 4104 7088 4895 6524 46313<br />
60-64 2871 2039 4256 2047 1762 2647 2072 2903 5938 3545 5268 35349<br />
65-69 2300 1438 3302 1609 713 1565 1146 1896 4475 2613 4328 25385<br />
70-74 1336 1031 2910 1176 445 834 808 1042 3295 1596 2865 17336<br />
75-79 842 641 1961 868 223 274 583 645 2199 1153 1681 11069<br />
80-84 312 301 1776 508 176 115 321 303 1113 509 783 6218<br />
85+ 159 157 997 358 51 50 154 155 710 356 364 3512<br />
Total 93206 87009 136861 71943 158265 141063 147075 158987 186610 143333 184007 1508359<br />
67
2004 males<br />
Age<br />
group<br />
Athlone Blaauwberg Central Helderberg Khayelitsha Mitchell’s<br />
Plain<br />
Nyanga Oostenberg South<br />
Pen<br />
Tyg<br />
East<br />
Tyg<br />
west<br />
<strong>Cape</strong><br />
Town<br />
0 1945 1865 2300 1454 3934 3246 3729 3623 3075 2793 3421 31386<br />
1-4 7531 7072 7937 5475 13532 12101 12674 13736 13127 10672 13009 116867<br />
5-9 9316 7486 8957 6479 15455 13966 13510 15284 15399 12989 16685 135527<br />
10-14 9577 6942 9043 6006 15114 14342 12058 14288 15469 12751 16065 131655<br />
15-19 9009 7166 10543 6077 16054 15047 13286 14150 16539 13408 17005 138282<br />
20-24 7910 8399 16882 6968 19498 14323 18126 15677 17200 13326 16713 155021<br />
25-29 7525 9417 14942 6918 19972 12988 19782 15566 16113 12176 15373 150773<br />
30-34 7675 9406 13201 6225 15379 11338 15216 16459 16882 13225 16113 141119<br />
35-39 7230 7720 10114 5814 13264 10517 11892 14734 15715 12571 15509 125079<br />
40-44 5989 6550 9060 5346 9744 9583 8303 12604 13971 11677 14159 106985<br />
45-49 4991 5003 7246 4325 7564 8834 6874 9240 10687 8856 11365 84986<br />
50-54 3995 3691 6714 3017 4751 6628 4884 5800 8955 6428 9003 63867<br />
55-59 3552 2903 5777 2514 2532 4314 3258 4333 7436 5183 6903 48704<br />
60-64 2857 2099 4219 2052 1821 2707 2085 2951 6023 3594 5309 35717<br />
65-69 2413 1549 3398 1682 723 1666 1209 2013 4709 2794 4623 26779<br />
70-74 1325 1066 2898 1148 442 857 810 1050 3322 1628 2917 17461<br />
75-79 867 683 1964 856 220 263 593 665 2246 1207 1753 11317<br />
80-84 324 312 1832 496 190 115 331 305 1127 524 806 6361<br />
85+ 166 171 1042 366 50 49 159 165 733 376 384 3661<br />
Total 94197 89501 138070 73219 160237 142883 148778 162644 188727 146177 187116 1531549<br />
68
Appendix 5: Population Estimates for females for sub-districts of <strong>Cape</strong> Town Metropole, 2001–2004<br />
2001 females<br />
Age<br />
group<br />
Athlone Blaauwberg Central Helderberg Khayelitsha Mitchell’s<br />
Plain<br />
Nyanga Oostenberg South<br />
Pen<br />
Tyg<br />
East<br />
Tyg<br />
west<br />
<strong>Cape</strong><br />
Town<br />
0 1742 1666 2166 1393 3958 3013 3489 3218 3094 2603 3240 29583<br />
1-4 7455 6213 7327 5249 13480 11631 12395 12529 12020 10161 12857 111317<br />
5-9 8690 6843 8198 5875 15034 13644 13447 14186 14387 11951 15437 127690<br />
10-14 9342 6893 8562 5803 15367 14616 13180 13805 14981 12527 16306 131380<br />
15-19 9300 7158 11973 6180 18476 15767 16533 14510 15699 13905 17501 147002<br />
20-24 8274 7500 16043 6299 20107 13577 19147 13703 14643 13565 15963 148822<br />
25-29 8113 8627 14894 6708 20747 12231 18841 15265 15574 12812 15521 149332<br />
30-34 8056 8376 11963 6005 15673 10998 13821 15465 16095 13294 16385 136129<br />
35-39 7768 7310 10680 5548 13060 10939 11326 14054 15526 13105 15424 124740<br />
40-44 6487 6075 9614 4702 9782 10796 8648 11356 13801 11060 13517 105839<br />
45-49 5438 4653 8345 3829 6567 8836 6594 7898 10926 8221 11089 82397<br />
50-54 4932 3631 7516 3096 3836 6509 4517 5596 9574 6491 9511 65210<br />
55-59 4053 2679 6055 2568 2332 4078 2932 3769 7694 4894 7173 48226<br />
60-64 3872 2176 5138 2363 1787 2920 2446 2953 6698 3946 6604 40903<br />
65-69 3227 1629 4352 1861 929 1915 1627 1996 5570 2883 5492 31483<br />
70-74 2216 1250 3922 1810 505 1106 1203 1427 4614 2186 4018 24259<br />
75-79 1383 887 3268 1433 260 629 692 902 3167 1619 2510 16749<br />
80-84 734 454 2375 972 158 325 423 547 2049 1045 1372 10455<br />
85+ 498 356 2235 715 101 231 217 341 1583 846 990 8113<br />
Total 101579 84375 144628 72409 162160 143763 151479 153519 187695 147116 190908 1539630<br />
69
2002 females<br />
Age<br />
group<br />
Athlone Blaauwberg Central Helderberg Khayelitsha Mitchell’s<br />
Plain<br />
Nyanga Oostenberg South<br />
Pen<br />
Tyg<br />
East<br />
Tyg<br />
west<br />
<strong>Cape</strong><br />
Town<br />
0 1767 1711 2220 1447 3975 3079 3554 3325 3155 2673 3292 30197<br />
1-4 7504 6337 7488 5324 13339 11717 12484 12740 12111 10275 12924 112243<br />
5-9 8779 7013 8353 5971 15255 13789 13588 14472 14549 12144 15637 129549<br />
10-14 9306 6885 8493 5794 15479 14365 13027 13786 14974 12451 16122 130682<br />
15-19 9139 7156 11810 6155 18508 15495 16246 14477 15447 13783 17249 145465<br />
20-24 8407 7815 16445 6588 20530 14111 19704 14305 14970 13983 16295 153153<br />
25-29 8161 8868 15184 6783 21344 12647 19275 15572 15646 12911 15492 151884<br />
30-34 8193 8754 12287 6074 15962 11213 14077 15894 16408 13669 16872 139403<br />
35-39 7915 7468 10735 5681 13367 10934 11412 14377 15788 13438 15854 126971<br />
40-44 6697 6386 9803 4958 10264 11107 8905 11956 14381 11596 14115 110167<br />
45-49 5687 4903 8534 4045 7089 9319 6925 8333 11299 8624 11577 86334<br />
50-54 5137 3828 7733 3204 4028 6928 4752 5846 9903 6814 9997 68171<br />
55-59 4168 2869 6314 2647 2394 4303 3048 3963 8043 5146 7497 50392<br />
60-64 3883 2297 5173 2377 1855 3036 2488 3050 6798 4059 6733 41750<br />
65-69 3368 1722 4437 1868 955 2003 1699 2060 5775 3028 5786 32700<br />
70-74 2289 1290 3909 1788 509 1120 1237 1441 4704 2248 4139 24674<br />
75-79 1453 937 3332 1421 251 633 722 923 3250 1703 2644 17270<br />
80-84 778 480 2414 997 170 340 447 568 2115 1100 1443 10853<br />
85+ 502 376 2247 693 104 232 218 343 1606 879 1028 8229<br />
Total 103133 87095 146912 73814 165378 146371 153810 157432 190921 150525 194695 1570085<br />
70
2003 females<br />
Age<br />
group<br />
Athlone Blaauwberg Central Helderberg Khayelitsha Mitchell’s<br />
Plain<br />
Nyanga Oostenberg South<br />
Pen<br />
Tyg<br />
East<br />
Tyg<br />
west<br />
<strong>Cape</strong><br />
Town<br />
0 1781 1745 2261 1493 3968 3126 3598 3412 3196 2725 3322 30626<br />
1-4 7581 6482 7680 5418 13258 11847 12621 12997 12247 10426 13037 113593<br />
5-9 8868 7180 8508 6066 15482 13931 13728 14753 14707 12332 15831 131385<br />
10-14 9287 6883 8440 5794 15621 14143 12899 13785 14990 12394 15965 130203<br />
15-19 8907 7089 11555 6079 18390 15102 15834 14319 15073 13546 16857 142750<br />
20-24 8493 8088 16757 6846 20845 14572 20156 14833 15209 14324 16530 156653<br />
25-29 8173 9067 15408 6827 21861 13012 19629 15807 15648 12951 15393 153777<br />
30-34 8311 9115 12586 6129 16220 11402 14301 16288 16681 14014 17322 142371<br />
35-39 8041 7603 10763 5800 13648 10900 11469 14659 16007 13734 16243 128868<br />
40-44 6869 6662 9932 5190 10699 11350 9109 12497 14884 12072 14634 113898<br />
45-49 5958 5173 8748 4280 7667 9844 7286 8804 11708 9062 12108 90638<br />
50-54 5316 4007 7908 3295 4204 7325 4966 6065 10179 7104 10436 70806<br />
55-59 4336 3104 6660 2760 2488 4591 3205 4215 8502 5472 7924 53256<br />
60-64 3864 2402 5169 2373 1911 3131 2512 3125 6844 4143 6811 42285<br />
65-69 3522 1822 4534 1878 983 2098 1777 2131 5999 3184 6103 34033<br />
70-74 2361 1330 3894 1765 512 1134 1271 1455 4791 2309 4256 25077<br />
75-79 1529 989 3401 1411 244 638 754 946 3339 1792 2787 17832<br />
80-84 815 500 2425 1009 180 352 467 583 2156 1143 1499 11128<br />
85+ 513 401 2288 681 109 237 223 350 1651 924 1081 8457<br />
Total 104526 89642 148917 75094 168291 148736 155805 161023 193812 153651 198140 1597636<br />
71
2004 females<br />
Age<br />
group<br />
Athlone Blaauwberg Central Helderberg Khayelitsha Mitchell’s<br />
Plain<br />
Nyanga Oostenberg South<br />
Pen<br />
Tyg<br />
East<br />
Tyg<br />
west<br />
<strong>Cape</strong><br />
Town<br />
0 1786 1769 2290 1531 3944 3156 3622 3481 3220 2764 3334 30899<br />
1-4 7680 6642 7896 5528 13221 12008 12791 13286 12414 10603 13182 115251<br />
5-9 8961 7347 8668 6163 15721 14078 13873 15038 14870 12524 16027 133271<br />
10-14 9269 6879 8391 5795 15770 13930 12777 13782 15005 12337 15811 129746<br />
15-19 8646 6988 11259 5978 18199 14658 15369 14097 14646 13254 16401 139494<br />
20-24 8528 8312 16971 7068 21045 14952 20492 15277 15357 14580 16664 159246<br />
25-29 8151 9222 15568 6841 22295 13325 19903 15968 15582 12935 15230 155020<br />
30-34 8420 9468 12873 6175 16465 11576 14506 16665 16933 14343 17751 145175<br />
35-39 8145 7712 10761 5902 13895 10836 11494 14896 16178 13988 16583 130388<br />
40-44 7011 6911 10017 5405 11100 11544 9273 12991 15328 12499 15093 117171<br />
45-49 6229 5440 8951 4516 8271 10374 7647 9276 12106 9496 12631 94938<br />
50-54 5497 4186 8080 3385 4384 7732 5184 6285 10451 7396 10878 73457<br />
55-59 4519 3359 7035 2882 2591 4904 3376 4488 8998 5824 8385 56361<br />
60-64 3862 2519 5188 2379 1976 3241 2548 3216 6920 4245 6918 43011<br />
65-69 3653 1910 4598 1875 1005 2180 1844 2186 6183 3320 6383 35136<br />
70-74 2452 1379 3909 1755 519 1155 1314 1479 4916 2386 4406 25670<br />
75-79 1604 1041 3463 1399 236 641 785 968 3420 1880 2927 18364<br />
80-84 852 521 2435 1022 190 363 487 597 2197 1185 1554 11403<br />
85+ 524 428 2331 670 114 242 227 358 1697 972 1136 8698<br />
Total 105785 92033 150684 76268 170942 150894 157513 164333 196421 156531 201294 1622700<br />
72
References<br />
1 Groenewald P, Bradshaw D, Nojilana B, Bourne D, Nixon J, Mahomed H<br />
and Daniels J. <strong>Cape</strong> Town <strong>Mortality</strong>, 2001: Cause of death and<br />
premature mortality. <strong>Cape</strong> Town: City of <strong>Cape</strong> Town, South African<br />
Medical Research Council, University of <strong>Cape</strong> Town, November 2003.<br />
2 National Department of health, 2004. Strategic Priorities for the<br />
National Health System 2004 -2009.<br />
3 <strong>Western</strong> <strong>Cape</strong> Department of Health. Provincial Priorities: Annual<br />
Performance Plan 2006/07 <strong>Western</strong> <strong>Cape</strong> Department of Health. p59.<br />
4 Groenewald P, van Niekerk M, Jefferies D and van Niekerk W. Cause of<br />
death and premature mortality in the Boland Overberg region 2004.<br />
Information Management, Boland Overberg Regional Office,<br />
Department of Health, PGWC: December 2005.<br />
5 Bradshaw D, Groenewald P, Bourne D, Mahomed H, Nojilana B, Daniels<br />
J, Nixon J. Making cause of death statistics useful for public health at<br />
local level in the City of <strong>Cape</strong> Town. Bull World Health Org 2006,<br />
84(3): 211-217.<br />
6 Zinyaktira N. (2006). Preparatory work for MPhil thesis at UCT.<br />
7 Matzopoulos R (editor). A profile of fatal injuries in South Africa: 6 th<br />
annual report of the National Injury <strong>Mortality</strong> <strong>Surveillance</strong> System,<br />
2004. <strong>Cape</strong> Town: Crime, Violence and Injury Lead Programme,<br />
Medical Research Council/University of South Africa, 2005<br />
8 Bradshaw D, Groenewald P, Laubscher R, Nannan N, Nojilana B,<br />
Norman R, Pieterse D and Schneider M. Initial burden of disease<br />
estimates for South Africa, 2000. <strong>Cape</strong> Town: South African Medical<br />
Research Council, 2003.<br />
9 Murray CJ, Lopez AD. The Global Burden of Disease: a comprehensive<br />
assessment of mortality and disability from diseases, injuries and risk<br />
factors in 1990 and projected to 2020. Vol. 1, Global Burden of<br />
Disease and Injury series. Boston: Harvard School of Public Health on<br />
behalf of the World Health Organization and the World Bank, 1996.<br />
73
10 SOPH(2004). Equity in Health: <strong>Cape</strong> Town 2002. <strong>Cape</strong> Town, School of<br />
Public Health, University of the <strong>Western</strong> <strong>Cape</strong><br />
11 Department of Health <strong>Western</strong> <strong>Cape</strong> ( 2004). Metropole District<br />
Health Services Annual report (2003 –2004).<br />
12 Dorrington, R. (2005). Projection of the Population of <strong>Cape</strong> Town,<br />
1985-2021. Unpublished interim report.<br />
13 World Health Organisation. 1992. International Classification of<br />
Diseases and related health conditions. Tenth Edition. Geneva: World<br />
Health Organisation.<br />
14 Shaikh, N. Abdullah, F., Lombard, C.J., Smit, L., Bradshaw, D. &<br />
Makubalo, L. (2006). Masking through averages – intra-provincial<br />
heterogeneity in HIV prevalence within the <strong>Western</strong> <strong>Cape</strong>. South<br />
African Medical Journal, 96, 538-543.<br />
15 Norman R, Matzopoulos R, Groenewald P and Bradshaw D. The High<br />
Burden of Injuries in South Africa. . Bull World Health Org 2007 (in<br />
press).<br />
16 Matzopoulos, R 2005. Violent deaths in South Africa: the 2003<br />
National Injury <strong>Mortality</strong> <strong>Surveillance</strong> System. SA Crime Quarterly,<br />
vol. 13, pp. 29-36.<br />
17 Matzopoulos, R 2005, ‘Editorial. Alcohol and injuries – a clear link’,<br />
Southern African Journal of Epidemiology and Infection, vol. 20, pp.<br />
114-115.<br />
18 Bradshaw D, Nannan N, Laubscher L, Groenewald P, Joubert J,<br />
Nojilana B, Norman R, Pieterse D, Schneider M. South African National<br />
Burden of Disease Study 2000: Estimates of Provincial <strong>Mortality</strong>. <strong>Cape</strong><br />
Town: Medical Research Council 2004.<br />
19 Bradshaw D, Schneider M, Norman R, Bourne D. <strong>Mortality</strong> Patterns of<br />
Chronic Diseases of Lifestyle in South Africa. In Steyn K, Fourie J,<br />
Temple N Eds Chronic Diseases of Lifestyle in South Africa 1995 -<br />
2005. Technical Report. Medical Research Council, <strong>Cape</strong> Town, 2006.<br />
20 Yusuf S, Reddy S, Ounpuu S and Anand S. Global Burden of<br />
Cardiovascular Diseases. Part I: General Considerations, the<br />
Epidemiologic Transition, Risk Factors, and Impact of Urbanization.<br />
Circulation. 2001;104(22) :2746-53.<br />
74
21 Fawcus SR, van Coeverden de groot HA, Isaacs S. A 50-year audit of<br />
maternal mortality in the Peninsula Maternal and Neonatal Service,<br />
<strong>Cape</strong> Town (1953-2002). BJOG. 2005 Sep; 112(9):1257-63.<br />
22 Department of Health, Medical Research Council and Macro<br />
International. South African Demographic and Health Survey 1998.<br />
Full report. Department of Health: Pretoria. 2002.<br />
75
REPORT 2<br />
Report on cause of death<br />
and premature mortality<br />
in the Boland-Overberg Region<br />
2004-2005<br />
Pam Groenewald, Debbie Bradshaw,<br />
Marieta van Niekerk, Denise Jefferies,<br />
Wilna van der Merwe<br />
April 2007
Abstract<br />
This report covers detailed cause of death data for the Boland<br />
Overberg region for the period 2004 and 2005 <strong>Mortality</strong> reports<br />
published by Statistics South Africa are not released below a<br />
national level. The information in this report has been collected<br />
directly from the offices of the Department of Home Affairs and<br />
supplemented by information collected from local mortuaries. The<br />
cause of death coding has been done by project staff.<br />
Deaths are analysed by age, cause and gender. Premature mortality<br />
and age standardized rates are also calculated.. Data for broad<br />
cause groups is presented by sub district. Up to date population<br />
estimates for the area are also calculated<br />
Approximately 40% of all premature mortality in the region is due<br />
to homicide, tuberculosis, HIV/AIDS and road traffic accidents, all of<br />
which are preventable through a comprehensive primary health care<br />
approach which emphasizes promotive and preventative strategies,<br />
uses intersectoral collaboration effectively and seeks to promote<br />
equity<br />
Copies of this report can be obtained from Wilna van der Merwe at<br />
wvdmerwe@pgwc.gov.za
Table of contents<br />
Introduction ......................................................................... 76<br />
Methods and data quality ................................................... 77<br />
Overview of mortality in the Boland Overberg Region ................. 79<br />
Important conditions ......................................................... 87<br />
HIV and TB........................................................................ 87<br />
Injuries............................................................................. 89<br />
Non communicable diseases ................................................ 94<br />
Women’s health ................................................................. 95<br />
Men’s health ...................................................................... 96<br />
Child health....................................................................... 97<br />
Discussion .........................................................................105<br />
Recommendations.............................................................107<br />
Appendices .......................................................................108<br />
Appendix 1: Population estimates for the Boland Overberg<br />
Region*, 2004-2005 ..........................................................108<br />
Appendix 2: Population estimates for males in the Boland<br />
Overberg Region by sub-district, 2005 .................................109<br />
Appendix 3: Population estimates for females in the Boland<br />
Overberg Region by sub-district, 2005 .................................110<br />
Appendix 4: Comparison of the numbers of deaths in the<br />
Boland Overberg Region with different sources.......................111<br />
References ........................................................................112<br />
List of tables<br />
Table 1:<br />
Number of deaths by sub-district, Boland Overberg<br />
Region, 2004 and 2005 ......................................... 79<br />
Table 2: Age-standardised mortality rate (per 100 000)<br />
by broad cause group by sex, Boland Overberg Region,<br />
2004 and 2005..................................................... 81<br />
Table 3:<br />
Top ten causes of premature mortality (YLLs)<br />
for Boland Overberg Region and by sub-districts,<br />
2005................................................................... 84<br />
Table 4: Age distribution of deaths under 19 years ................ 98
List of figures<br />
Figure 1: Age distribution of deaths by cause group and gender:<br />
Females, Boland Overberg Region, 2005........................ 80<br />
Figure 2: Age distribution of deaths by cause group and gender:<br />
Males, Boland Overberg Region, 2005 ........................... 80<br />
Figure 3: Top ten causes of premature mortality (YLLs)<br />
for Boland Overberg Region, 2004 and 2005 .................. 82<br />
Figure 4: Top ten causes of premature mortality (YLLs)<br />
by gender, Boland Overberg Region, 2004 and 2005 ....... 83<br />
Figure 5: YLLs per 100 000 by cause group and HIV/AIDS<br />
for Boland Overberg Region and by sub-districts,<br />
2004 and 2005........................................................... 85<br />
Figure 6: Age-standardised premature mortality (YLL) rates for<br />
TB, HIV+TB and HIV for individuals by district, Boland<br />
Overberg Region, 2004 and 2005................................ 86<br />
Figure 7: Age-standardised premature mortality (YLL) rate<br />
for TB, HIV+TB and HIV for individuals by district,<br />
Boland Overberg Region, 2004 and 2005 ....................... 88<br />
Figure 7A: Age-specific death rates for HIV and TB by gender,<br />
Boland Overberg Region, 2004 and 2005 ....................... 88<br />
Figure 8: Age standardised death rates due to injuries by district,<br />
Boland Overberg Region, 2005 ..................................... 89<br />
Figure 9: Age-standardised death rates due to homicide by<br />
district, Boland Overberg Region, 2005.......................... 90<br />
Figure 10: Age specific homicide death rates by gender, ................. 91<br />
Boland Overberg Region, 2004 – 2005........................... 91<br />
Figure 11: Age-standardised death rates due to road traffic<br />
accidents by sub-district, Boland Overberg Region,<br />
2005......................................................................... 92<br />
Figure 12: Age specific road traffic accident death rates by<br />
gender, Boland Overberg Region, 2004 and 2005............ 93<br />
Figure 13: Age-standardised cause of death rates for noncommunicable<br />
diseases by district, Boland Overberg<br />
Figure14:<br />
Region, 2005 ............................................................. 94<br />
Premature mortality cause profile for women<br />
15+ years, Boland Overberg Region, 2005 ..................... 95<br />
Figure 15: Premature mortality cause profile for men 15+ years, .........<br />
Boland Overberg Region, 2005 ..................................... 96<br />
Figure 16: Infant mortality rate per 100 live births, Boland<br />
Overberg Region, from 1997 to 2005 ............................ 97<br />
Figure 17: IMR and Under 5 mortality rate per 1000 live births ........ 98<br />
by sub-district, Boland Overberg Region, 2005 ............... 98<br />
Figure 18: Leading causes of early neonatal deaths, ....................... 99<br />
Boland Overberg Region, 2004 and 2005 ....................... 99<br />
Figure 19: Leading causes of late neonatal deaths, ....................... 100<br />
Boland Overberg Region, 2004 and 2005 ..................... 100
Figure 20: Leading causes of post neonatal infants,<br />
Boland Overberg Region, 2004 and 2005 ..................... 101<br />
Figure 21: Leading causes of deaths in children 1 – 4 years,<br />
Boland Overberg Region, 2004 and 2005 ..................... 101<br />
Figure 22: Leading causes of deaths in children 5-9 years, ............ 102<br />
Boland Overberg Region, 2004 and 2005 ..................... 102<br />
Figure 23: Leading causes of deaths in children 10-14 years,<br />
Boland Overberg 2004 and 2005................................. 103<br />
Figure 24: Leading causes of deaths in children 15 - 19 years,<br />
Boland Overberg 2004 and 2005................................. 104
Introduction<br />
Timeous and accurate cause of death statistics are essential for planning<br />
and monitoring health services and responding to the health needs of the<br />
population. Such information is requinred for the process of prioritisation<br />
of not only health services, programmes and research, but also for guiding<br />
the priorities in other sectors. In particular, sub-population data are<br />
needed to identify and monitor inequalities in health status. While policy is<br />
directed from a national perspective, provincial and local governments are<br />
required to respond to the specific needs of their communities.<br />
The Boland Overberg Region implemented a system for collecting<br />
mortality information from the Department of Home Affairs and local<br />
mortuaries in January 2004, using a system similar to that used in <strong>Cape</strong><br />
Town. A mortality report for 2004 was produced in 2005 1 and is available<br />
online from www.mrc.ac.za/bod/bod.htm. This data, for the first time,<br />
provided a profile of the causes of death experienced in the health<br />
districts of the Boland Overberg Region. Similar to national experience, 2 a<br />
substantial impact of HIV/AIDS was observed, as well as a combination of<br />
infectious diseases, child mortality, and degenerative chronic diseases. A<br />
marked injury burden was also observed in these districts.<br />
National vital statistics data have been reported up to the year 2004. 3<br />
However, these are not available at geographical areas lower than<br />
provincial level, making it difficult for local health authorities to plan<br />
health services and identify major health problems. The Boland Overberg<br />
Region therefore implemented the mortality surveillance system that runs<br />
in <strong>Cape</strong> Town. After a review of the quality of the cause-of-death coding in<br />
<strong>Cape</strong> Town in the year 2000, a shortlist which met the public-health needs<br />
was implemented to improve the standardisation of coding between the<br />
municipalities. 4 The key findings from the analysis of the cause of death<br />
statistics for <strong>Cape</strong> Town in 2001 were presented in a previous report, 5<br />
which can be downloaded from www.mrc.ac.za/bod/bod.htm.<br />
Data collected for 2004 and 2005 are presented in this report. As part of<br />
the <strong>Western</strong> <strong>Cape</strong> provincial project to reduce the burden of disease,<br />
efforts continue in making the information more useful for monitoring<br />
programmes in the area, as well as identifying new priorities. The report<br />
can be downloaded from www.mrc.ac.za/bod/bod.htm.<br />
76
Methods and data quality<br />
The Boland Overberg Region implemented a system for routinely<br />
compiling death statistics in January 2004. Local health authorities collect<br />
copies of death certificates from the Department of Home Affairs. The<br />
underlying cause of death is coded using a shortlist based on ICD-10 4 ,<br />
captured and processed by the local municipalities. The shortlist is<br />
adapted from the <strong>Cape</strong> Town list, which is based upon the most prevalent<br />
diseases in the area, as well as those of public-health importance. The list<br />
includes selected combinations of diseases such as HIV and TB, which are<br />
difficult to attribute to a single cause. The aim of the shortlist is to simplify<br />
the task of coding as well as to enable more detailed analysis of such<br />
data.<br />
The mortality data for 2004-2005 were obtained electronically from the<br />
Information Management Section of the Boland Overberg Regional Health<br />
office in Worcester. The data were cleaned and analysed using Microsoft<br />
Excel and Stata. Stillbirths were excluded prior to any analysis. There<br />
were four deaths that were recorded, owing to exposure to fire (burning<br />
shacks), where the gender of the victims was unknown. These four<br />
deaths were then divided arbitrarily and equally among males and<br />
females. There were no duplicates and no invalid COD for age. The data<br />
are presented for the Boland Overberg Region, which includes the eastern<br />
half of the <strong>Cape</strong> Winelands District (called “Boland” in this report) and the<br />
Overberg District municipalities, and for each of the seven sub-districts<br />
within the Boland Overberg Region. Drakenstein and Stellenbosch are<br />
excluded, since the management of these municipalities has yet to be<br />
incorporated within the functions of the Boland Overberg Region.<br />
After cleaning the data, the shortlist cause of death codes were<br />
aggregated according to the burden of disease classification. 6 These are<br />
categorized into three broad groups:<br />
Group I consists of the pre-transitional causes: communicable<br />
diseases, maternal causes, peri-natal conditions, and nutritional<br />
deficiencies. (HIV/AIDS is considered part of Group I, but is kept<br />
separate in the South African National Burden of Disease analysis,<br />
owing to the size of the burden that it contributes in South Africa.)<br />
Group II consists of the non-communicable causes, such as stroke<br />
and chronic obstructive pulmonary disease.<br />
Group III consists of the injuries, including both intentional and<br />
unintentional.<br />
Since the ill-defined categories of death do not provide information with<br />
regard to the underlying causes of death, they have been reallocated to<br />
the specified causes, in line with the burden-of-disease methodology for<br />
estimation. The deaths with unknown ages were redistributed<br />
77
proportionally by age and sex for each cause of death. The ill-defined<br />
cardiovascular deaths (heart failure) were redistributed proportionately by<br />
age and sex across rheumatic heart disease, ischaemic heart diseases,<br />
hypertensive heart diseases, pulmonary heart diseases and other<br />
cardiovascular diseases. The ill-defined respiratory deaths (respiratory<br />
failure) were redistributed proportionally by age and sex across chronic<br />
obstructive pulmonary disease, asthma and other respiratory diseases.<br />
The deaths coded to ill-defined natural causes were redistributed<br />
proportionally by age and sex across all pre-transitional and noncommunicable<br />
causes. The undetermined injury deaths were redistributed<br />
proportionally by age and sex across all intentional and unintentional<br />
causes.<br />
All cause and cause-specific, age-standardised mortality and premature<br />
mortality rates were calculated for the region as a whole and by subdistrict.<br />
Population estimates for the Boland Overberg Region and subdistricts<br />
were obtained from the Provincial Health Information Directorate<br />
(Eugene Reynolds, pers. comm.). These estimates are based upon Census<br />
2001 with population projections based upon Stats SA official growth rate<br />
until 2005 (see Appendices 1-3). The WHO world-standard population was<br />
used for direct-age standardisation. 7 Confidence intervals for age<br />
standardised mortality rates were calculated using a Poisson<br />
approximation method, described by Boyle and Parkin. 8<br />
No adjustments have been made for under-registration of deaths. While<br />
most of the deaths are considered to be registered, there are some<br />
concerns about the completeness of the data, particularly for Overstrand<br />
in 2004 and Theewaterskloof in 2005. When compared with data from the<br />
population register, it was noted that - in Overstrand - many of the death<br />
certificates for unnatural deaths were missed by the routine surveillance<br />
system operating through Home Affairs. We subsequently compared the<br />
mortuary register with the surveillance database and collected any<br />
missing deaths from the register. We have no further information on the<br />
completeness of natural deaths. In 2005 there was a problem getting<br />
death certificates photocopied at the Caledon Home Affairs office and a<br />
number of death certificates were lost before another system was<br />
implemented. This appears to have affected Theewaterskloof particularly,<br />
see Table 1 below.<br />
78
Table 1: Number of deaths by sub-district,<br />
Boland Overberg Region, 2004 and 2005<br />
Sub-district 2004 2005 %<br />
increase<br />
Breede River winelands 675 744 10.2<br />
Breede Valley 1253 1292 3.1<br />
Witzenberg 713 803 12.6<br />
<strong>Cape</strong> Agulhas 215 238 10.7<br />
Overstrand 370 426 15.1<br />
Swellendam 225 243 8.0<br />
Theewaterskloof 780 557 -28.6<br />
Total 4231 4303 1.7<br />
When compared with the registered Home Affairs deaths at the Worcester<br />
and Caledon offices, the completeness is in excess of 100% as shown in<br />
Appendix 2. However, it is important to bear in mind that Home Affairs<br />
only registered deaths for people with identity numbers, whereas the<br />
mortality surveillance system records all deaths.<br />
Overview of mortality in Boland Overberg<br />
There were 4303 deaths in 2005 that were analysed. The majority of<br />
deaths (47.2%) are due to non-communicable diseases, with pretransitional<br />
diseases accounting for 25.6% and injuries for 15.4%. deaths<br />
due to ill-defined causes account for 11.8%.<br />
Boland has a larger proportion of deaths due to pre-transitional causes<br />
(28%) than Overberg (21%) and a lower proportion of non-communicable<br />
diseases (43.8 vs 53.8%). This is explained by the difference in age<br />
structure of the populations between the districts. Boland has a young<br />
population typical of a developing country while Overberg has an ageing<br />
population more likely to be affected by non-communicable diseases.<br />
The age pattern of deaths for the Boland Overberg is shown in Figures 1<br />
and 2 on page 6 of this report. There are large differences between males<br />
and females with young adult males experiencing much larger numbers of<br />
deaths than females, mainly due to injuries. HIV/AIDS accounts for a<br />
large proportion of deaths in young women. Deaths at older ages are<br />
mainly due to non-communicable diseases.<br />
79
250<br />
FEMALES<br />
N = 1773<br />
200<br />
150<br />
Deaths<br />
100<br />
50<br />
0<br />
0 1 to 4 5 to 9 10 to 14 15 to 19 20 to 24 25 to 29 30 to 34 35 to 39 40 to 44 45 to 49 50 to 54 55 to 59 60 to 64 65 to 69 70 to 74 75 to 79 80 to 84 85+<br />
Other comm, mat, peri, nut HIV/AIDS Non-communicable Injuries Ill defined<br />
Figure 1: Age distribution of deaths by cause group and gender:<br />
Females, Boland Overberg Region, 2005<br />
250<br />
MALES<br />
N = 2530<br />
200<br />
150<br />
Deaths<br />
100<br />
50<br />
0<br />
0 1 to 4 5 to 9 10 to 14 15 to 19 20 to 24 25 to 29 30 to 34 35 to 39 40 to 44 45 to 49 50 to 54 55 to 59 60 to 64 65 to 69 70 to 74 75 to 79 80 to 84 85+<br />
Comm excl HIV, mat,peri, nut HIV/AIDS Non Communicable Injuries Ill defined<br />
Figure 2: Age distribution of deaths by cause group and gender:<br />
Males, Boland Overberg Region, 2005<br />
80
The age-standardised rates by broad cause group for males and females<br />
for 2004 and 2005 are set out in Table 2 below. Age standardisation is a<br />
technique which eliminates differences in observed mortality rates caused<br />
by differences in the age structure of the population in different areas,<br />
rather than by differences in the force of the underlying mortality. Overall<br />
the rates have increased slightly for males, mainly due to an increase in<br />
death rates due to Group I and Group II conditions. There has been a<br />
marked decrease in death rates due to injuries between 2004 and 2005.<br />
Overall, the rates for women have remained fairly consistent.<br />
Table 2: Age-standardised mortality rate (per 100 000)<br />
by broad cause group by gender, for Boland Overberg Region,<br />
2004 and 2005<br />
Broad cause groups<br />
Communicable diseases<br />
excl HIV, maternal,<br />
perinatal, nutritional<br />
HIV<br />
Non communicable<br />
Injuries<br />
All causes<br />
Males Females Persons<br />
2004 2005 2004 2005 2004 2005<br />
235 253 143 150 187 199<br />
52 55 50 47 51 51<br />
682 712 490 496 578 593<br />
211 178 66 56 137 117<br />
1179 1198 749 749 953 960<br />
The leading causes of premature mortality for 2004 and 2005 are shown<br />
in Figure 3. The top four causes of death have remained the same<br />
between 2004 and 2005, but the ranking has changed. Tuberculosis has<br />
become the leading cause of premature mortality in 2005 after ranking<br />
second to homicide in 2004. Homicide now ranks third after HIV/AIDS,<br />
with road traffic accidents ranking fourth. These top four conditions<br />
account for 40% of the premature mortality in the region. Premature<br />
mortality has been estimated using the standard Global Burden of Disease<br />
(GBD) approach to calculate years of life lost (YLLs). Age weighting, time<br />
discounting of 3% per annum and standard life expectancies based on the<br />
West model levels 25 and 26 (considered to a maximum life expectancy)<br />
have been used. The younger the age of death, the greater the years of<br />
life lost 6 .<br />
Males and females have different cause of death profiles, according to<br />
Figure 4 on page 9. Tuberculosis, homicide, HIV/AIDS and road traffic<br />
accidents are the leading causes of premature mortality among men.<br />
HIV/AIDS is the leading cause among women, followed by tuberculosis,<br />
lower respiratory infection, and homicide.<br />
81
2005<br />
Tuberculosis<br />
12.7<br />
HIV/AIDS<br />
10.8<br />
Homicide<br />
9.9<br />
Road traffic<br />
6.2<br />
Lower Respiratory infections<br />
5.0<br />
Ischaemic heart disease<br />
4.1<br />
COPD<br />
3.7<br />
Stroke<br />
3.5<br />
Low birth weight and RDS<br />
3.3<br />
Diarrhoeal Diseases<br />
2.7<br />
0 5 10 15 20<br />
Percentage<br />
2004<br />
Homicide<br />
12.0<br />
Tuberculosis<br />
11.7<br />
HIV/AIDS<br />
11.0<br />
Road traffic<br />
6.5<br />
Stroke<br />
4.7<br />
Lower Respiratory infections<br />
4.6<br />
Ischaemic heart disease<br />
4.1<br />
Low birth weight and RDS<br />
3.5<br />
Diarrhoeal Diseases<br />
3.2<br />
Diabetes Mellitus<br />
2.4<br />
0 5 10 15 20<br />
Percentage<br />
Figure 3: Top ten causes of premature mortality (YLLs)<br />
for Boland Overberg Region, 2004 and 2005<br />
82
Males 2004<br />
Males 2005<br />
Homicide<br />
15.4<br />
Tuberculosis<br />
13.2<br />
Tuberculosis<br />
13.4<br />
Homicide<br />
12.5<br />
HIV/AIDS<br />
8.6<br />
HIV/AIDS<br />
8.7<br />
Road traffic<br />
7.9<br />
Road traffic<br />
8.2<br />
Ischaemic heart disease<br />
4.3<br />
Lower Respiratory infections<br />
4.4<br />
Lower Respiratory infections<br />
3.9<br />
Ischaemic heart disease<br />
4.0<br />
Stroke<br />
3.4<br />
COPD<br />
4.0<br />
COPD<br />
2.9<br />
Low birth weight and RDS<br />
3.3<br />
Low birth weight and RDS<br />
2.4<br />
Drowning<br />
3.2<br />
Other unintentional injuries specified<br />
2.4<br />
Stroke<br />
2.9<br />
0 5 10 15 20<br />
Percentage<br />
0 5 10 15 20<br />
Percentage<br />
Females 2004<br />
Females 2005<br />
HIV/AIDS<br />
14.5<br />
HIV/AIDS<br />
14.2<br />
Tuberculosis<br />
9.1<br />
Tuberculosis<br />
11.9<br />
Homicide<br />
6.8<br />
Lower Respiratory infections<br />
5.9<br />
Stroke<br />
6.7<br />
Homicide<br />
5.8<br />
Lower Respiratory infections<br />
5.6<br />
Stroke<br />
4.5<br />
Low birth weight and RDS<br />
5.1<br />
Ischaemic heart disease<br />
4.4<br />
Diarrhoeal Diseases<br />
4.7<br />
Diabetes Mellitus<br />
3.9<br />
Road traffic<br />
4.3<br />
Diarrhoeal Diseases<br />
3.6<br />
Ischaemic heart disease<br />
3.9<br />
Low birth weight and RDS<br />
3.4<br />
Diabetes Mellitus<br />
3.5<br />
COPD<br />
3.3<br />
0 5 10 15 20<br />
Percentage<br />
0 5 10 15 20<br />
Percentage<br />
Figure 4: Top ten causes of premature mortality (YLLs)<br />
by gender, Boland Overberg Region, 2004 and 2005<br />
The top ten causes of premature mortality for each sub-district are shown<br />
in Table 3. Tuberculosis is the leading cause of premature mortality in the<br />
Breede Valley and Witzenberg, followed by HIV/AIDS, while homicide is<br />
the leading cause in the Breede River Winelands, followed by tuberculosis.<br />
Tuberculosis is the leading cause of premature mortality in <strong>Cape</strong> Agulhas<br />
and Overstrand, while HIV/AIDs is the leading cause of premature<br />
mortality, followed by homicide, in Swellendam and Theewaterskloof.<br />
The age-standardised premature mortality rate by cause group and<br />
HIV/AIDS are shown in Figure 4 by sub-district, for the years 2004 and<br />
2005. Premature mortality is highest in Witzenberg, Breede Valley and<br />
Breede River. Of concern is the rapid increase in premature mortality<br />
rates in Witzenberg between 2004 and 2005, mainly due to increased<br />
mortality due to HIV/AIDS and TB. The increase in premature mortality in<br />
Overstrand and the drop in Theewaterskloof in 2005 is probably due to<br />
incomplete data rather than a real change in mortality.<br />
83
Table 3: Top ten causes of premature mortality (YLLs) for Boland Overberg and by sub-districts, 2005<br />
Rank<br />
1<br />
CAPE<br />
WINELANDS<br />
EAST<br />
Tuberculosis<br />
(14.1%)<br />
Breede River Breede Valley Witzenberg OVERBERG <strong>Cape</strong> Agulhas Overstrand Swellendam Theewaterskloof BOLAND<br />
OVERBERG<br />
Homicide<br />
(10.2%)<br />
Tuberculosis<br />
(14.9%)<br />
Tuberculosis<br />
(16.3%)<br />
Tuberculosis<br />
(10.2%)<br />
Tuberculosis<br />
(14.7%)<br />
Tuberculosis<br />
(11.34%)<br />
HIV/AIDS<br />
(9.5%)<br />
HIV/AIDS<br />
(11.1%)<br />
Tuberculosis<br />
(12.7%)<br />
2<br />
HIV/AIDS<br />
(11.8%)<br />
Tuberculosis<br />
(8.9%)<br />
HIV/AIDS<br />
(11.5%)<br />
HIV/AIDS<br />
(15.4%)<br />
Homicide<br />
(9.3%)<br />
Homicide<br />
(9.3%)<br />
HIV/AIDS<br />
(8.09%)<br />
Homicide<br />
(8.3%)<br />
Homicide<br />
(10.9%)<br />
HIV/AIDS<br />
(10.8%)<br />
3<br />
Homicide<br />
(10.2%)<br />
HIV/AIDS<br />
(6.9%)<br />
Homicide<br />
(9.8%)<br />
Homicide<br />
(10.8%)<br />
HIV/AIDS<br />
(8.8%)<br />
Road Traffic<br />
(6.4%)<br />
Homicide<br />
(7.5%)<br />
Tuberculosis<br />
(7.7%)<br />
Tuberculosis<br />
(9.5%)<br />
Homicide<br />
(9.9%)<br />
4<br />
Road traffic<br />
(5.9%)<br />
Pneumonia<br />
(6.2%)<br />
Road traffic<br />
(6.9%)<br />
Road traffic<br />
(5.0%)<br />
Road traffic<br />
(6.9%)<br />
Ischaemic<br />
heart disease<br />
(4.9%)<br />
Pneumonia<br />
(6.8%)<br />
Ischaemic<br />
heart disease<br />
(7.3%)<br />
Road traffic<br />
(7.6%)<br />
Road traffic<br />
(6.2%)<br />
5<br />
Pneumonia<br />
(5.03%)<br />
Road traffic<br />
(4.9%)<br />
Pneumonia<br />
(4.7%)<br />
Pneumonia<br />
(4.6%)<br />
Ischaemic<br />
heart disease<br />
(4.9%)<br />
Stroke<br />
(4.8%)<br />
Road traffic<br />
(6.3%)<br />
Stroke<br />
(6.6%)<br />
Pneumonia<br />
(4.4%)<br />
Pneumonia<br />
(4.9%)<br />
6<br />
COPD<br />
(3.8%)<br />
Ischaemic heart<br />
disease<br />
(4.8%)<br />
COPD<br />
(4.2%)<br />
Ischaemic heart<br />
disease<br />
(3.9%)<br />
Pneumonia<br />
(4.8%)<br />
Suicide<br />
(4.2%)<br />
Fires<br />
(4.9%)<br />
Drowning<br />
(5.9%)<br />
Ischaemic heart<br />
disease<br />
(4.2%)<br />
Ischaemic heart<br />
disease<br />
(4.1%)<br />
7<br />
Ischaemic heart<br />
disease<br />
(3.7%)<br />
Low birth<br />
weight & RDS<br />
(4.4%)<br />
Stroke<br />
(3.9%)<br />
Low birth weight<br />
(3.9%)<br />
Stroke<br />
(4.1%)<br />
Pneumonia<br />
(3.5%)<br />
Ischaemic<br />
heart disease<br />
(4.9%)<br />
Road Traffic<br />
(5.8%)<br />
COPD<br />
(3.8%)<br />
COPD<br />
(3.7%)<br />
8<br />
Low birth<br />
weight & RDS<br />
(3.7%)<br />
Diarrhoea<br />
(3.7%)<br />
Ischaemic heart<br />
disease<br />
(3.4%)<br />
Diarrhoea<br />
(3.6%)<br />
COPD<br />
(3.0%)<br />
HIV/AIDS<br />
(3.1%)<br />
Low birth<br />
weight & RDS<br />
(3.6%)<br />
Diabetes<br />
mellitus<br />
(3.6%)<br />
Stroke<br />
(3.6%)<br />
Stroke<br />
(3.5%)<br />
9<br />
Stroke<br />
(3.3%)<br />
COPD<br />
(3.5%)<br />
Low birth<br />
weight & RDS<br />
(3.2%)<br />
COPD<br />
(3.2%)<br />
Drowning<br />
(2.9%)<br />
Low birth<br />
weight & RDS<br />
(2.8%)<br />
Suicide<br />
(3.2%)<br />
Pneumonia<br />
(3.2%)<br />
Drowning<br />
(3.0%)<br />
Low birth<br />
weight & RDS<br />
(3.2%)<br />
10<br />
Diarrhoea<br />
(3.2%)<br />
Lung cancer<br />
(3.5%)<br />
Diabetes<br />
mellitus<br />
(2..8%)<br />
Stroke<br />
(2.5%)<br />
Suicide<br />
(2.9%)<br />
Cot death<br />
(2.8%)<br />
Stroke<br />
(3.2%)<br />
Hypertensive<br />
disease<br />
(3.2%)<br />
Low birth weight<br />
& RDS<br />
(2.7%)<br />
Diarrhoea<br />
(2.7%)<br />
84
18000<br />
16000<br />
14000<br />
YLLs per 100 000<br />
12000<br />
10000<br />
8000<br />
6000<br />
4000<br />
2000<br />
0<br />
2004 2005 2004 2005 2004 2005 2004 2005 2004 2005 2004 2005 2004 2005<br />
Breede River Breede valley Witzenberg <strong>Cape</strong> Agulhas Swellendam Overstrand Theewaterskloof<br />
III. Injuries 3327.4 3536.1 3760.7 3273.0 3209.3 3134.4 2084.3 3304.2 3149.2 3097.9 3721.0 2867.4 3212.9 2447.4<br />
II. Non-communicable diseases 5548.5 6949.8 6432.3 6260.1 5754.2 6045.1 6445.8 5973.9 4730.8 6420.6 3425.5 3943.7 7137.3 5099.4<br />
HIV/AIDS 1171.7 920.5 1725.4 1542.6 1033.1 2122.1 669.7 420.6 873.9 1082.6 1076.6 865.4 1699.2 998.0<br />
I. Other comm, mat, peri and nutri conditions 4001.0 3736.0 4064.6 4235.7 4875.7 5125.3 2459.4 3258.9 2904.2 1863.9 1116.0 3067.4 3210.6 2152.0<br />
Figure 5: YLLs per 100 000 by cause group and HIV/AIDS<br />
for Boland Overberg Region and by sub-districts, 2004 and 2005<br />
Age-standardised death rates by sub-district for the three broad cause<br />
groups and HIV, for 2004 and 2005, are shown in Figure 6. In contrast to<br />
all other sub-districts, there is a significant rise in mortality due to HIV<br />
between 2004 and 2005 in Witzenberg which is likely to be a real<br />
increase. The significant drop in death rates noted for all causes, except<br />
injuries, in Theewaterskloof, however, are likely to be due to missing<br />
data. Data collection at mortuaries was close to complete for both years<br />
so, unless unnatural deaths from Theewaterskloof were sent to mortuaries<br />
other than Worcester and Hermanus, this is likely to be a real decrease.<br />
85
Communicable excl HIV, mat, peri, nut<br />
HIV<br />
400<br />
120<br />
350<br />
100<br />
300<br />
250<br />
80<br />
200<br />
60<br />
150<br />
40<br />
100<br />
50<br />
20<br />
0<br />
Breede River<br />
Winelands<br />
Breede Valley Witzenberg <strong>Cape</strong> Agulhas Overstrand Swellendam Theewaterskloof<br />
2004 211 223 254 115 59 159 188<br />
2005 212 249 302 158 144 144 109<br />
0<br />
Breede River<br />
Winelands<br />
Breede Valley Witzenberg <strong>Cape</strong> Agulhas Overstrand Swellendam Theewaterskloof<br />
2004 45 67 40 24 37 34 64<br />
2005 32 64 80 16 30 48 38<br />
Non-communicable Diseases<br />
Injuries<br />
900<br />
200<br />
800<br />
180<br />
700<br />
600<br />
500<br />
400<br />
300<br />
200<br />
160<br />
140<br />
120<br />
100<br />
80<br />
60<br />
40<br />
100<br />
20<br />
0<br />
Breede River<br />
Winelands<br />
Breede Valley Witzenberg <strong>Cape</strong> Agulhas Overstrand Swellendam Theewaterskloof<br />
2004 577 639 624 577 345 572 737<br />
2005 678 696 672 576 372 645 557<br />
0<br />
Breede River<br />
Winelands<br />
Breede Valley Witzenberg <strong>Cape</strong> Agulhas Overstrand Swellendam Theewaterskloof<br />
2004 134 157 140 81 134 134 131<br />
2005 133 127 114 120 111 127 91<br />
Figure 6: Age-standardised premature mortality (YLL) rates for TB, HIV+TB and HIV for individuals by district,<br />
Boland Overberg Region, 2004 and 2005<br />
86
Important conditions<br />
HIV and TB<br />
Tuberculosis is the leading cause of death in the Boland Overberg Region.<br />
Because of the increased susceptibility of HIV-positive people to<br />
tuberculosis disease and mortality, it is even more important that the<br />
HIV/AIDS epidemic is controlled in this area, which has very high<br />
tuberculosis incidence rates. Tuberculosis cure rates are particularly poor<br />
in Witzenberg (63%), where HIV/AIDS prevalence has reached levels<br />
similar to those in the Eastern <strong>Cape</strong> in some populations. This is probably<br />
an important reason for the high levels of tuberculosis and HIV/AIDS<br />
premature mortality experienced in this sub-district (see Figure 6). There<br />
has been a significant increase in age-standardised mortality rates due to<br />
HIV/AIDS in Witzenberg between 2004 and 2005: from 40 per 100 000<br />
(95% CI: 27; 53) to 80 per 100 000 (95% CI: 62; 98). (See Figure 5.)<br />
The mortality rate due to tuberculosis increased over this period from 101<br />
per 100 000 to 147 per 100 000, but this difference was not significant. It<br />
is possible that the TB and HIV premature mortality rates for<br />
Theewaterskloof in 2005 are falsely low, in view of the missing data<br />
mentioned above. In accordance with ICD 10 guidelines 9 , HIV/AIDS was<br />
selected as the underlying causes when both tuberculosis and HIV/AIDS<br />
appeared on the death certificate.<br />
The age-specific HIV and TB deaths rates for males and females are<br />
shown in Figure 7 below. While the HIV peak for women decreased<br />
between 2004 and 2005, it has increased slightly for men in the same<br />
period.<br />
87
5000<br />
4500<br />
4000<br />
3500<br />
3000<br />
2500<br />
2000<br />
1500<br />
1000<br />
500<br />
0<br />
2004.0 2005.0 2004.0 2005.0 2004.0 2005.0 2004.0 2005.0 2004.0 2005.0 2004.0 2005.0 2004.0 2005.0<br />
Breede River Breede Valley Witzenberg <strong>Cape</strong> Agulhas Swellendam Overstrand Theewaterskloof<br />
HIV/AIDS excl TB 905.5 560.3 1002.6 657.2 749.1 1221.8 527.1 527.1 784.6 784.6 853.1 853.1 1361.4 1361.4<br />
HIV/AIDS + TB 266.3 360.2 722.8 885.4 283.9 900.3 142.6 142.6 89.4 89.4 223.5 223.5 337.8 337.8<br />
Tuberculosis 1767.1 1389.6 2104.4 2197.2 2137.6 2648.9 694.0 694.0 1140.0 1140.0 298.8 298.8 1534.0 1534.0<br />
Figure 7: Age-standardised premature mortality (YLL) rate<br />
for TB, HIV+TB and HIV for individuals by district,<br />
Boland Overberg Region, 2004 and 2005<br />
HIV males<br />
TB males<br />
140<br />
120<br />
100<br />
80<br />
60<br />
40<br />
20<br />
0<br />
0-4 5 to 14 15 to 24 25 to 34 35 to 44 45 to 54 55 to 64 65 to 74 75+<br />
400<br />
350<br />
300<br />
250<br />
200<br />
150<br />
100<br />
50<br />
0<br />
0-4 5 to 14 15 to 24 25 to 34 35 to 44 45 to 54 55 to 64 65 to 74 75+<br />
2004 2005<br />
2004 2005<br />
HIV females<br />
TB females<br />
140<br />
120<br />
100<br />
80<br />
60<br />
40<br />
20<br />
0<br />
0-4 5 to 14 15 to 24 25 to 34 35 to 44 45 to 54 55 to 64 65 to 74 75+<br />
400<br />
350<br />
300<br />
250<br />
200<br />
150<br />
100<br />
50<br />
0<br />
0-4 5 to 14 15 to 24 25 to 34 35 to 44 45 to 54 55 to 64 65 to 74 75+<br />
2004 2005<br />
2004 2005<br />
Figure 7A: Age-specific death rates for HIV and TB by gender,<br />
Boland Overberg Region, 2004 and 2005<br />
88
Injuries<br />
Injuries account for about 15 % of deaths in the Boland Overberg with<br />
homicide and road traffic injuries ranking among the top four leading<br />
causes of death. Overall, injury age-standardised mortality rates<br />
decreased from 137.1 per 100 000 (95% CI: 127 – 147) to 117.0 per 100<br />
000 (95% CI: 112 – 126) in the Boland Overberg Region between 2004<br />
and 2005. This decrease just reached statistical significance. There are<br />
slight variations in the age-standardized death rates for injuries among<br />
sub-districts, with Breede River having the highest rates and<br />
Theewaterskloof the lowest (see Figure 8). Although these differences are<br />
not significant, they are based on small numbers and should therefore be<br />
interpreted with caution, particularly for <strong>Cape</strong> Agulhas and Swellendam.<br />
140<br />
120<br />
100<br />
Deaths per 100 000<br />
80<br />
60<br />
40<br />
20<br />
0<br />
Breede River Breede valley Witzenberg <strong>Cape</strong> Agulhas Swellendam Overstrand Theewaterskloof<br />
Homicide 55.57 46.26 54.42 43.59 32.91 30.63 32.52<br />
Suicide and self-inflicted 6.30 7.10 6.19 18.43 11.34 15.40 11.66<br />
Other unintent 23.50 24.28 15.09 10.10 21.92 9.82 8.59<br />
Fires 6.30 6.10 3.27 3.75 8.29 16.81 5.00<br />
Drowning 10.11 7.06 8.17 7.67 20.99 6.19 7.83<br />
Road traffic 31.45 35.83 26.41 36.76 31.99 31.73 24.96<br />
Figure 8: Age standardised death rates due to injuries by district,<br />
Boland Overberg Region, 2005<br />
The age-standardised rates for homicide dropped from 56 per 100 000 to<br />
44 per 100 000 between 2004 and 2005, mainly due to a large drop in<br />
homicide rates among males (89 to 69 per 100 000). The rates for<br />
females fell slightly from 24 per 100 000 to 19 per 100 000. The homicide<br />
rates for males are similar to those in <strong>Cape</strong> Town (91 per 100 000), but<br />
the rates for females are double those in <strong>Cape</strong> Town (12.2 per 100 000) 10 .<br />
Age-standardised homicide rates are highest in Breede River and<br />
Witzenberg, and lowest in Theewaterskloof (see Figure 9). A low<br />
proportion of homicides in the Boland Overberg involve the use of a<br />
firearm, which is in sharp contrast with <strong>Cape</strong> Town, where about 40% of<br />
homicides involve the use of a firearm.<br />
89
60<br />
50<br />
40<br />
30<br />
20<br />
10<br />
0<br />
Breede River Breede valley Witzenberg <strong>Cape</strong> Agulhas Swellendam Overstrand Theewaters<br />
Homicide and violence without firearm 52.16 40.95 54.42 43.59 32.91 30.63 30.84<br />
Homicide and violence with firearm 3.42 5.31 0.00 0.00 0.00 0.00 1.68<br />
Figure 9: Age-standardised death rates due to homicide by district,<br />
Boland Overberg Region, 2005<br />
Homicide dropped in the ranking from the first to the third leading cause<br />
of death in the Boland Overberg Region during this period. The agespecific<br />
death rates for homicide by gender, between 2004 and 2005 are<br />
shown in Figure 10 below. There is a marked gender differential, with<br />
males having rates three times as high as females. Nevertheless, there<br />
has been a marked decrease in the homicide rates among males between<br />
15 and 24 years, and between those between 45 and 64 years. In<br />
females, the decrease is noted in the 35 to 44-year age group.<br />
90
Homicide males<br />
160<br />
140<br />
120<br />
100<br />
80<br />
60<br />
40<br />
20<br />
0<br />
0-4 5 to 14 15 to 24 25 to 34 35 to 44 45 to 54 55 to 64 65 to 74 75+<br />
2004 2005<br />
Homicide females<br />
160<br />
140<br />
120<br />
100<br />
80<br />
60<br />
40<br />
20<br />
0<br />
0-4 5 to 14 15 to 24 25 to 34 35 to 44 45 to 54 55 to 64 65 to 74 75+<br />
2004 2005<br />
Figure 10: Age specific homicide death rates by gender,<br />
Boland Overberg Region, 2004 – 2005<br />
91
The age-standardised death rates due to road traffic accidents decreased<br />
slightly from 33.4 to 31.4 per 100 000, in the Boland Overberg between<br />
2004 and 2005. There are slight variations in age standardised death<br />
rates due to road traffic accidents between sub-districts (see Figure 11<br />
below). These rates, however, are based upon small numbers and should<br />
be treated with caution. Road traffic accidents rank fourth in the leading<br />
causes of death.<br />
Road traffic<br />
40<br />
35<br />
30<br />
25<br />
20<br />
15<br />
10<br />
5<br />
0<br />
Breede River Breede valley Witzenberg <strong>Cape</strong> Agulhas Swellendam Overstrand Theewaters<br />
Road traffic 31.5 35.8 26.4 36.8 32.0 31.7 25.0<br />
Figure 11: Age-standardised death rates due to road traffic<br />
accidents by sub-district, Boland Overberg Region, 2005<br />
92
The age-specific road-traffic death rates by gender are set out in Figure<br />
12 below. Again the rates for males are more than double those for<br />
females.<br />
100<br />
80<br />
60<br />
40<br />
20<br />
Road traffic males<br />
0<br />
0-4 5 to 14 15 to 24 25 to 34 35 to 44 45 to 54 55 to 64 65 to 74 75+<br />
2004 2005<br />
Road traffic females<br />
100<br />
80<br />
60<br />
40<br />
20<br />
0<br />
0-4 5 to 14 15 to 24 25 to 34 35 to 44 45 to 54 55 to 64 65 to 74 75+<br />
2004 2005<br />
Figure 12: Age specific road traffic accident death rates by gender,<br />
Boland Overberg Region, 2004 and 2005<br />
93
Non-communicable diseases<br />
Non-communicable diseases account for a large proportion (55%) of<br />
deaths in the Boland Overberg Region, with cardiovascular conditions<br />
accounting for the majority of these. The age-standardised death rates for<br />
non-communicable diseases by sub-district for 2005 are shown in Figure<br />
13. These are based upon small numbers, however, and should therefore<br />
be interpreted with caution. It is not clear why the rates for Overstrand<br />
are so much lower than the other sub-districts. We suspect that data is<br />
missing for Theewaterskloof, so these rates should also be interpreted<br />
with caution. Overall, the rates for non-communicable diseases are similar<br />
to those found in <strong>Cape</strong> Town. Yet, while cardiovascular and cancer<br />
mortality rates are similar, diabetes mortality rates are lower than in <strong>Cape</strong><br />
Town, and mortality due to respiratory conditions is higher.<br />
800<br />
700<br />
600<br />
Deaths per 100 000<br />
500<br />
400<br />
300<br />
200<br />
100<br />
0<br />
Breede River Breede valley Witzenberg <strong>Cape</strong> Agulhas Swellendam Overstrand Theewaters<br />
Other 59.4 80.1 77.1 84.7 97.2 24.3 41.8<br />
Congenital 1.3 1.2 3.8 3.7 0.0 3.5 1.9<br />
Respiratory 91.7 95.0 106.2 97.4 48.7 63.8 81.2<br />
Diabetes 64.7 71.8 40.3 34.3 39.9 19.5 48.0<br />
Neoplasms 196.1 171.7 158.9 169.0 135.4 89.5 127.1<br />
Cardiovascular 264.5 276.5 285.7 186.9 323.4 171.1 256.9<br />
Figure 13: Age-standardised cause of death rates for noncommunicable<br />
diseases by district, Boland Overberg Region, 2005<br />
94
Women’s health<br />
Non-communicable diseases account for about half of the premature<br />
mortality in adult women (15+ years) with stroke, IHD and diabetes<br />
accounting for about 6% each, as shown in Figure 14 below. HIV/AIDS is<br />
the largest single cause of premature mortality among adult women,<br />
accounting for 15% of deaths in this group; followed by tuberculosis,<br />
which accounts for 14%. Injuries account for 14% of premature mortality<br />
in this group.<br />
Unintentional<br />
6%<br />
Intentional<br />
8%<br />
Resp infections<br />
Inf and para<br />
5%<br />
2%<br />
Maternal<br />
0%<br />
TB<br />
14%<br />
Other non communicable<br />
13%<br />
Other CVD<br />
3%<br />
HIV<br />
15%<br />
Hypertension<br />
3%<br />
Stroke<br />
6%<br />
IHD<br />
6%<br />
Diabetes<br />
5%<br />
Other CA<br />
7%<br />
Breast Ca<br />
3%<br />
Lung Ca<br />
2%<br />
Cervix Ca<br />
2%<br />
Figure14: Premature mortality cause profile<br />
for women 15+ years, Boland Overberg Region, 2005<br />
95
Men’s health<br />
Premature mortality in men is almost double that of women and is<br />
dominated by injuries, as shown in Figure 15 below. Homicide is the<br />
second largest cause of premature mortality in this group, accounting for<br />
15% of YLLs, while road traffic accounts for nine percent. Tuberculosis is<br />
the single largest cause of premature mortality in this group, accounting<br />
for 16% of YLLs. COPD and IHD each account for 5% of premature<br />
mortality in this group.<br />
Homicide<br />
15%<br />
Inf and para<br />
1%<br />
Suicide<br />
3%<br />
Resp infections<br />
4%<br />
TB<br />
16%<br />
Other unint<br />
6%<br />
HIV<br />
9%<br />
Road traffic<br />
9%<br />
Other non communicable<br />
9%<br />
COPD<br />
5%<br />
Other CVD Stroke<br />
4% 3%<br />
Hypertension<br />
1%<br />
IHD<br />
5%<br />
Diabetes<br />
2%<br />
Lung Ca<br />
3%<br />
Oesophagus Ca<br />
1%<br />
Stomach Ca<br />
1%<br />
Prostate Ca<br />
Other Ca 1%<br />
5%<br />
Figure 15: Premature mortality cause profile for men 15+ years,<br />
Boland Overberg Region, 2005<br />
96
Child health<br />
Infant mortality in the Boland Overberg Region has remained fairly<br />
constant at around 30 infant deaths per 1000 live births since 1997, with<br />
the possibility of a slight downward trend, as shown in Figure 16 below.<br />
45<br />
40<br />
Deaths per 1000 Live births<br />
35<br />
30<br />
25<br />
20<br />
15<br />
35<br />
30<br />
36<br />
32<br />
35<br />
31<br />
28<br />
33<br />
29<br />
10<br />
5<br />
0<br />
1997 1998 1999 2000 2001 2002 2003 2004 2005<br />
Figure 16: Infant mortality rate per 100 live births,<br />
Boland Overberg Region, from 1997 to 2005<br />
97
The infant and child mortality rates, however, do vary by subdistrict,<br />
with the highest rates found in Witzenberg in 2005, and the<br />
lowest in Breede Valley and Swellendam (although caution must be<br />
exercised, given the very low numbers). This is shown in Figure 17<br />
below.<br />
IMR and Under 5 mortality rate per 1000 live births<br />
60<br />
50<br />
deaths per 1000 live births<br />
40<br />
30<br />
20<br />
10<br />
0<br />
CAPE<br />
Breede River<br />
WINELANDS<br />
Winelands<br />
EAST<br />
Breede<br />
Valley*<br />
Witzenberg<br />
OVERBERG<br />
<strong>Cape</strong><br />
Agulhas<br />
Overstrand Swellendam Theewaters BOR<br />
U5MR 46 48 26 51 40 40 36 11 38 36<br />
IMR 37 37 21 42 35 35 31 11 31 29<br />
Figure 17: IMR and Under 5 mortality rate per 1000 live births<br />
by sub-district, Boland Overberg Region, 2005<br />
The leading causes of death among the various age groups are set out in<br />
Table 4 below. The majority of these deaths occurred among post<br />
neonatal infants (1 – 11 months).<br />
Table 4: Age distribution of deaths under 19 years<br />
Age group Number of deaths % of child deaths<br />
Early neonatal (0 – 7 days) 167 17.2<br />
Late neonatal (8 – 30 days) 69 7.1<br />
Post neonatal infant (1 – 11 months) 368 37.8<br />
1 – 4 years 159 16.3<br />
5 – 9 years 55 5.7<br />
10 – 14 years 49 5.0<br />
15 – 19 years 106 10.9<br />
98
The leading cause of early neonatal deaths is prematurity, accounting for<br />
43.1% of deaths in babies aged 0 to 7 days, as shown in Figure 18 below.<br />
Other perinatal conditions account for 18.6% of deaths in this group,<br />
followed by congenital abnormalities, which account for 8.4% of deaths.<br />
Ill-defined deaths account for 6.6% of deaths in this group. This profile is<br />
similar to that found in <strong>Cape</strong> Town.<br />
Early neonatal deaths<br />
N = 167<br />
Short gestation and Low birth weight<br />
Other perinatal<br />
Congenital abnormalities<br />
Ill defined natural<br />
RDS<br />
Homicide<br />
Neonatal infections<br />
Cot death/Sudden infant death syndrome<br />
Septicaemia<br />
Other Infectious and parasitic diseases<br />
Lower Respiratory infections<br />
Other unintentional injuries specified<br />
Tuberculosis<br />
HIV/AIDS<br />
Diarrhoeal Diseases<br />
3.6<br />
2.4<br />
2.4<br />
1.2<br />
1.2<br />
1.2<br />
1.2<br />
0.6<br />
0.6<br />
0.6<br />
8.4<br />
6.6<br />
6.0<br />
18.6<br />
43.1<br />
0 5 10 15 20 25 30 35 40 45 50<br />
Percent<br />
Figure 18: Leading causes of early neonatal deaths,<br />
Boland Overberg Region, 2004 and 2005<br />
99
Prematurity and low birthweight are the leading causes of death in the<br />
late neonatal age group (8-30 days), accounting for 33.3% of deaths, as<br />
shown in Figure 19 below. This is followed by ill-defined natural deaths<br />
(10.1%), cot death (7.2%), other unintentional injuries specified (7.2%),<br />
and HIV (5.8%). In <strong>Cape</strong> Town, the leading cause of death in this age<br />
group was found to be those which were ill defined and naturally<br />
occurring.<br />
Late Neonatal deaths<br />
N = 69<br />
Short gestation and Low birth weight<br />
33.3<br />
Ill defined natural<br />
10.1<br />
Cot death/Sudden infant death syndrome<br />
8.7<br />
Congenital abnormalities<br />
Other unintentional injuries specified<br />
7.2<br />
7.2<br />
HIV/AIDS excl TB<br />
Lower Respiratory infections<br />
5.8<br />
5.8<br />
Diarrhoeal Diseases<br />
Neonatal infections<br />
4.3<br />
4.3<br />
Other perinatal<br />
Injuries undetermined whether intent or unintent<br />
2.9<br />
2.9<br />
Septicaemia<br />
Remainder of diseases of digestive system<br />
Renal failure<br />
1.4<br />
1.4<br />
1.4<br />
0 5 10 15 20 25 30 35<br />
Percent<br />
Figure 19: Leading causes of late neonatal deaths,<br />
Boland Overberg Region, 2004 and 2005<br />
In the post neonatal infant cohort (1–11 months) diarrhoea was<br />
seen as the leading cause of death, accounting for 19.6% of deaths,<br />
as shown in Figure 20 on page 27. This was followed by ill-defined<br />
natural causes (16.0%), lower respiratory infections (14.7), and<br />
HIV/AIDS (11.1%). In <strong>Cape</strong> Town, ill-defined deaths were the<br />
leading cause in this age group and diarrhoea ranks third.<br />
100
1 - 11 months<br />
N = 368<br />
Diarrhoeal Diseases<br />
Ill defined natural<br />
Lower Respiratory infections<br />
HIV/AIDS<br />
Other unintentional injuries specified<br />
Cot death/Sudden infant death syndrome<br />
Short gestation and Low birth weight<br />
Protein-energy malnutrition<br />
Congenital abnormalities<br />
Septicaemia<br />
Bacterial Meningitis and meningococcaemia<br />
RDS<br />
Other respiratory<br />
Road traffic<br />
Other Infectious and parasitic diseases<br />
Neonatal infections<br />
3.0<br />
3.0<br />
2.4<br />
1.9<br />
1.1<br />
1.1<br />
0.8<br />
0.5<br />
0.5<br />
5.4<br />
4.9<br />
9.0<br />
11.1<br />
16.0<br />
14.7<br />
19.6<br />
0 5 10 15 20 25<br />
Percent<br />
Figure 20: Leading causes of post neonatal infants,<br />
Boland Overberg Region, 2004 and 2005<br />
HIV/AIDS was the leading cause of death among 1-4 year olds (15.1%),<br />
followed by drowning (14.5%), diarrhoea (11.9%), protein energy<br />
malnutrition (10.7%), ill-defined natural causes (8.2%), and lower<br />
respiratory infections (7.5%), as shown in Figure 21 below. Drowning is<br />
more prominent among boys than girls, while road-traffic injuries rank 7 th<br />
in this age group. In <strong>Cape</strong> Town, HIV/AIDS was also the leading cause,<br />
but road-traffic injuries featured more prominently in ranking second.<br />
1 - 4 years (N = 159 )<br />
Male<br />
Female<br />
HIV/AIDS<br />
Drowning<br />
Diarrhoeal Diseases<br />
Protein-energy malnutrition<br />
Ill defined natural<br />
Lower Respiratory infections<br />
Road traffic<br />
Tuberculosis<br />
Congenital abnormalities<br />
Homicide<br />
Septicaemia<br />
Fires<br />
Poisoning<br />
Other unintentional injuries specified<br />
Remainder of diseases of nervous system<br />
15 10 5 0 5 10<br />
Figure 21: Leading causes of deaths in children 1 – 4 years,<br />
Boland Overberg Region, 2004 and 2005<br />
olds, accounting for 30.9% of deaths, followed by drowning (23.6%),<br />
other Road-traffic injuries were the leading cause of death among 5- to 9-<br />
year-unintentional injuries specified (7.3%), and HIV/AIDS (5.5%), as<br />
101
shown in Figure 22 below. Ill-defined deaths accounted for 5.5%, while<br />
homicide accounted for 1.8% of deaths in this age group. Deaths among<br />
males predominated. The leading cause was the same in <strong>Cape</strong> Town, but<br />
HIV/AIDS and lower respiratory infections ranked second and third,<br />
respectively, as opposed to accidental injuries in the Boland Overberg<br />
Region.<br />
5 - 9 years (N = 55)<br />
Male<br />
Female<br />
Road traffic<br />
Drowning<br />
Other unintentional injuries specified<br />
HIV/AIDS<br />
Brain, meninges and CNS cancer<br />
Ill defined natural<br />
Tuberculosis<br />
Fires<br />
Diarrhoeal Diseases<br />
Bacterial Meningitis and meningococcaemia<br />
30 25 20 15 10 5 0 5 10<br />
Figure 22: Leading causes of deaths in children 5-9 years,<br />
Boland Overberg Region, 2004 and 2005<br />
A similar pattern was seen in the 10- to 14-year age group, with road<br />
traffic accidents (24.5%) appearing as the leading cause of death,<br />
followed by drowning (16.3), and homicide (8.2%), and shown in Figure<br />
23 below. Ill-defined natural deaths account for only 2% of deaths in this<br />
group. The profile in <strong>Cape</strong> Town is similar, except that homicide ranks<br />
second and drowning is lower in the ranking than in the Boland Overberg<br />
Region.<br />
102
10 - 14 years (N = 49)<br />
Road traffic<br />
Drowning<br />
Homicide<br />
Epilepsy<br />
Lower Respiratory infections<br />
Other transport accidents<br />
Other unintentional injuries specified<br />
Anaemias and other diseases of blood and blood forming organs<br />
Tuberculosis<br />
Bacterial Meningitis and meningococcaemia<br />
Septicaemia<br />
Protein-energy malnutrition<br />
Other malignant neoplasms<br />
Remainder of diseases of nervous system<br />
Rheumatic heart disease<br />
Males<br />
Females<br />
20 15 10 5 0 5 10<br />
Figure 23: Leading causes of deaths in children 10-14 years,<br />
Boland Overberg 2004 and 2005<br />
103
As in <strong>Cape</strong> Town, mortality among 15- to 19-year-olds in the Boland<br />
Overberg Region is dominated by homicide (34%) and road traffic<br />
injuries (18.9%), as shown in Figure 24. There is a marked gender<br />
differential with males accounting for almost 70% of the deaths in<br />
this age group.<br />
15 - 19 years (N = 106)<br />
Males<br />
Females<br />
Homicide<br />
Road traffic<br />
Tuberculosis<br />
Suicide and self-inflicted<br />
HIV/AIDS<br />
Drowning<br />
Other unintentional injuries specified<br />
Ill defined natural<br />
Lower Respiratory infections<br />
Remainder of diseases of circulatory system<br />
Other cardiovascular<br />
Other respiratory<br />
Bacterial Meningitis and meningococcaemia<br />
Epilepsy<br />
Remainder of diseases of nervous system<br />
35 30 25 20 15 10 5 0 5 10<br />
Percent<br />
Figure 24: Leading causes of deaths in children 15 - 19 years,<br />
Boland Overberg 2004 and 2005<br />
104
Discussion<br />
The mortality surveillance system in the Boland Overberg Region has been<br />
maintained and continues to provide statistics that can be used to guide<br />
public-health programmes in the region. The year-on-year variations in<br />
mortality in the region need to be interpreted cautiously, especially at<br />
sub-district level, where the numbers of deaths are often small. However,<br />
the Boland Overberg Region’s death data from 2005 strongly confirm the<br />
patterns seen in 2004.<br />
o<br />
Tuberculosis is the leading cause of mortality in the region with<br />
mortality rates much higher than those experienced in <strong>Cape</strong> Town<br />
(86 per 100 000 vs 50 per 100 000 in 2004).<br />
o<br />
HIV/AIDS mortality rates have continued to increase, but are lower<br />
than those in <strong>Cape</strong> Town (50 per 100 000 vs 80 per 100 000). The<br />
increase in mortality in Witzenberg, due to a significant increase in<br />
HIV/AIDS mortality and a marked increase in mortality due to<br />
tuberculosis, is cause for concern.<br />
o Homicide mortality rates decreased between 2004 and 2005,<br />
particularly among males. The profile of homicide is quite different<br />
from that found in <strong>Cape</strong> Town: the use of firearms is very limited in<br />
the Boland Overberg Region and homicide rates among females are<br />
almost double those experienced in <strong>Cape</strong> Town.<br />
o<br />
o<br />
Overall, mortality rates due to non-communicable diseases in<br />
Boland Overberg Region are slightly lower than those in <strong>Cape</strong> Town<br />
(577 vs 626 per 100 000). There are differences in the profile,<br />
however, with mortality rates due to cardiovascular conditions and<br />
cancers being similar, while mortality due to respiratory conditions<br />
is higher in the Boland Overberg Region than in <strong>Cape</strong> Town, and<br />
diabetes mortality rates are lower.<br />
Infant mortality has remained fairly constant in the Boland<br />
Overberg Region since 1997, with the suggestion of a downward<br />
trend. However, there is a marked variation among sub-districts,<br />
with Witzenberg having the highest rates. Infant mortality rates in<br />
the Boland Overberg Region (about 31 per 1000 LB) are higher<br />
than those in <strong>Cape</strong> Town (24 per 1000 LB). Prematurity and low<br />
birth-weight are the leading causes of neonatal deaths. Ill-defined<br />
deaths rank second and account for a high proportion of deaths in<br />
late neonatal and post-neonatal infants.<br />
105
o<br />
Diarrhoea deaths are more prominent among young children in the<br />
Boland Overberg Region than in <strong>Cape</strong> Town, while injuries are<br />
prominent in older children. Of great concern is the large proportion<br />
of preventable deaths due to homicide and road-traffic injuries<br />
among 15 – 19 year olds, particularly among males.<br />
As with any routine surveillance system, it is important to assess the<br />
completeness and quality of the data before drawing any conclusions. We<br />
have identified certain limitations of this data, incomplete data collection<br />
in the Overberg, for example, and have drawn attention to these where<br />
appropriate in the report. The proportion of causes of death that are illdefined<br />
has remained at about 12 percent. No attempt has been made to<br />
validate the accuracy of the certified cause of death. When comparing this<br />
data with national data it is important to know that coding practices differ<br />
and this may give rise to slightly different results.<br />
106
Recommendations<br />
The local mortality surveillance system is the source of mortality<br />
information for the region. Nevertheless, in order to ensure sustainability,<br />
an improvement in the quality of the data collected, and the optimal use<br />
of the results, integration with other systems - such as those of Home<br />
Affairs, the mortuaries, the South African Police Services, and the<br />
Departments of Transport and Education - must be improved.<br />
Interventions must be planned, implemented, monitored and evaluated<br />
across all sectors. Demographic estimates for the region need to be<br />
revised and updated if needed.<br />
Approximately 40% of all premature mortality is due to homicide,<br />
tuberculosis, HIV/AIDS and road traffic accidents, all of which are<br />
preventable through a comprehensive primary health-care approach,<br />
which emphasises health promotion and preventative strategies; uses<br />
intersectoral collaboration effectively; and seeks to promote equity.<br />
• Tuberculosis control must be prioritised within the regional Health<br />
Department, particularly in Witzenberg. Since effective tuberculosis<br />
control requires intersectoral interventions aimed at reducing<br />
poverty and improving living conditions, the national Departments<br />
of Housing, Agriculture, and Social Security and Poverty Alleviation<br />
all have an important role to play.<br />
• At the same time, the HIV/AIDS Programme needs to be<br />
strengthened, particularly in Witzenberg.<br />
• Intersectoral strategies are urgently required to prevent violence,<br />
homicide, and road-traffic accidents. As one of the leading causes<br />
of premature mortality in the Boland Overberg region, homicide<br />
should be prioritised as a health need. The pattern of the<br />
distribution of homicides should inform the allocation of resources<br />
to crime-prevention programmes. The underlying socio-economic<br />
instability of the high-incidence areas can only be addressed by a<br />
committed intersectoral approach. The problem of homicide<br />
highlights the need for a commitment to close working partnerships<br />
among a range of provincial and local authority departments,<br />
including Safety and Security, Sports and Recreation, Education,<br />
and Housing.<br />
• Primary care for the management of non-communicable diseases<br />
should be strengthened and healthy lifestyles promoted in order to<br />
reduce the substantial burden of non-communicable diseases.<br />
• Antenatal and perinatal care need to be strengthened.<br />
107
Appendices<br />
Appendix 1: Population estimates for individuals<br />
in the Boland Overberg Region*, 2004 – 2005<br />
Age<br />
group<br />
Breede<br />
Valley<br />
Breede<br />
River<br />
Winelands<br />
Witzenberg<br />
<strong>Cape</strong><br />
Agulhas<br />
Overstrand Swellendam Theewaterskloof<br />
0<br />
3148 1921 2009 487 1119 551 2016<br />
1-4<br />
12401 7133 7634 1873 3849 2326 7440<br />
5-9<br />
15422 9037 9303 2662 4409 3014 9191<br />
10-14<br />
15538 8878 9385 2775 4213 2917 8846<br />
15-19<br />
16226 7890 8996 2509 4598 2631 9062<br />
20-24<br />
13310 6668 8593 1778 5261 2183 8933<br />
25-29<br />
13528 7232 9467 1958 5514 2529 10021<br />
30-34<br />
13130 7420 8951 2241 4829 2479 9461<br />
35-39<br />
12108 6640 7694 2207 4153 2429 8551<br />
40-44<br />
10546 5672 6306 2055 3497 2040 6995<br />
45-49<br />
8287 4380 4929 1595 2912 1570 5201<br />
50-54<br />
6383 3520 3837 1300 2819 1315 4174<br />
55-59<br />
4564 2733 2717 1165 2860 1021 2906<br />
60-64<br />
3642 2398 2112 1117 2941 892 2337<br />
65-69<br />
2749 1802 1472 897 2405 740 1644<br />
70-74<br />
1984 1385 1086 643 1778 558 1069<br />
75-79<br />
1120 914 644 385 1072 320 676<br />
80-84<br />
762 513 373 250 651 197 383<br />
85+<br />
445 294 260 149 384 120 272<br />
Total<br />
155293 86429 95767 28046 59265 29832 99178<br />
* Excluding Stellenbosch and Drakenstein<br />
108
Appendix 2: Population estimates for males<br />
in the Boland Overberg Region by sub-district, 2005<br />
Age<br />
group<br />
Breede<br />
Valley<br />
Breede<br />
River<br />
Winelands<br />
Witzenberg<br />
<strong>Cape</strong><br />
Agulhas<br />
Overstrand Swellendam Theewaterskloof<br />
0 954 1537 1024 256 577 288 1046<br />
1-4 3586 6150 3888 950 1922 1165 3736<br />
5-9 4491 7748 4716 1352 2169 1561 4633<br />
10-14 4463 7744 4706 1370 2124 1457 4456<br />
15-19 3778 8226 4388 1220 2238 1302 4399<br />
20-24 3156 6646 4360 856 2613 1115 4705<br />
25-29 3426 6681 4765 955 2869 1263 5439<br />
30-34 3524 6439 4382 1076 2395 1218 5182<br />
35-39 3207 5874 3844 1035 2092 1231 4645<br />
40-44 2640 5025 3086 974 1774 999 3733<br />
45-49 2126 3935 2420 802 1420 782 2649<br />
50-54 1731 3057 1973 622 1368 645 2171<br />
55-59 1307 2211 1355 561 1225 495 1523<br />
60-64 1140 1651 1045 521 1406 427 1203<br />
65-69 809 1176 721 401 1160 357 811<br />
70-74 628 867 463 318 827 274 478<br />
75-79 396 400 260 154 495 142 282<br />
80-84 190 262 125 83 262 75 166<br />
85+ 105 137 85 42 135 42 76<br />
Total 41655 75763 47606 13548 29071 14841 51334<br />
109
Appendix 3: Population estimates for females in the Boland Overberg region by sub-district, 2005<br />
Age Breede Valley Breede River Winelands Witzenberg <strong>Cape</strong> Agulhas Overstrand Swellendam Theeswaterskloof<br />
group<br />
0 967 1612 985 231 542 263 970<br />
1-4 3546 6251 3746 923 1926 1161 3704<br />
5-9 4545 7675 4587 1310 2240 1453 4558<br />
10-14 4415 7794 4679 1405 2090 1460 4390<br />
15-19 4112 8000 4607 1289 2360 1329 4663<br />
20-24 3512 6664 4233 922 2648 1068 4227<br />
25-29 3806 6847 4702 1003 2646 1266 4583<br />
30-34 3897 6691 4569 1165 2434 1261 4279<br />
35-39 3433 6234 3851 1172 2061 1197 3906<br />
40-44 3032 5521 3220 1081 1723 1041 3262<br />
45-49 2254 4352 2508 793 1492 788 2552<br />
50-54 1790 3326 1863 678 1450 669 2002<br />
55-59 1426 2353 1362 604 1635 526 1383<br />
60-64 1257 1990 1067 596 1535 465 1134<br />
65-69 994 1573 751 496 1244 383 834<br />
70-74 757 1117 623 326 951 284 591<br />
75-79 518 720 384 232 577 178 394<br />
80-84 323 501 248 168 390 122 217<br />
85+ 189 308 175 107 250 78 195<br />
Total 44773 79530 48161 14499 30194 14992 47844<br />
110
Appendix 4: Comparison of the numbers of deaths<br />
in the Boland Overberg region with different sources<br />
Year<br />
Registered<br />
by Home<br />
Affairs<br />
BO death<br />
surveillance<br />
% of Home<br />
Affairs<br />
2004 4241 4162 101.9%<br />
2005 4303 4176 103.0%<br />
111
References<br />
1 Groenewald P, van Niekerk M, Jefferies D and van Niekerk W. Cause of death<br />
and premature mortality in the Boland Overberg region 2004. Information<br />
Management, Boland Overberg Regional Office, Department of Health, PGWC:<br />
December 2005.<br />
2 Bradshaw D, Groenewald P, Laubscher R, Nannan N, Nojilana B, Norman R,<br />
Pieterse D, Schneider M, Bourne D, Timæus I, Dorrington R, Johnson L. Initial<br />
burden of disease estimates for South Africa 2000. S Afr Med J 2003; 93(9): 682-<br />
688.<br />
3 Statistics South Africa. 2006. <strong>Mortality</strong> and causes of death in South Africa,<br />
2003 – 2004: findings from death notification. Statistical release P0309.3.<br />
Pretoria: Statistics South Africa.<br />
4 Bradshaw D, Groenewald P, Bourne D, Mahomed H, Nojilana B, Daniels J,<br />
Nixon J. Making cause of death statistics useful for public health at local level in<br />
the City of <strong>Cape</strong> Town. Bull World Health Org 2006, 84(3) 211-217.<br />
5 Groenewald P, Bradshaw D, Nojilana B, Bourne D, Nixon J, Mahomed H and<br />
Daniels J. <strong>Cape</strong> Town <strong>Mortality</strong>, 2001: cause of death and premature mortality.<br />
<strong>Cape</strong> Town: City of <strong>Cape</strong> Town, South African Medical research Council, University<br />
of <strong>Cape</strong> Town, November 2003.<br />
6 Murray CJ, Lopez AD 1996. The Global Burden of Disease: a comprehensive<br />
assessment of mortality and disability from diseases, injuries and risk factors in<br />
1990 and projected to 2020. Vol. 1, Global Burden of Disease and Injury series.<br />
Boston: Harvard School of Public Health.<br />
7 Ahmad OB, Boschi-Pinto C, Lopez AD, Murray CJL, Lozano R, Inoue M s.a. Age<br />
Standardization of Rates: A new WHO standard. (GPE Discussion Paper Series No<br />
31). Geneva: EIP/GPE/EBD WHO. Available:<br />
http://www3.who.int/whosis/discussion_papers/pdf/paper31.pdf [2004, 10<br />
September].<br />
8 Boyle P and Parkin DM. Chapter 11. Statistical methods for registries. In: Eds<br />
Jensen OM, Parkin DM, MacLennana R, Muir CS, Skeet RG. Cancer registration:<br />
principles and methods. IARC Scientific Publications No 95. 1991. Lyon:<br />
International Agency for Research on Cancer. ISBN 92 832 1195 2.<br />
9 World Health Organisation. 1992. International Classification of Diseases and<br />
related health conditions. Tenth Edition. Geneva: World health Organisation.<br />
10 Groenewald P, Bradshaw D, Daniels J, Matzopoulos R, Bourne D, Shaikh N,<br />
Blease D, Zinyakatira N and Naledi NT. Cause of death and premature mortality in<br />
<strong>Cape</strong> Town 2001 – 2004. MRC Technical Report. 2007.<br />
112
REPORT 3<br />
<strong>Western</strong> <strong>Cape</strong> Province <strong>Mortality</strong><br />
1997 – 2002<br />
Analysis of empirical cause of death data<br />
collected by Statistics South Africa<br />
from death notifications<br />
Linnea Brody, Debbie Bradshaw,<br />
David Bourne, Ria Laubscher<br />
April 2007
Acknowledgements<br />
We wish to thank Statistics South Africa for the data on which this report is based.<br />
The analyses presented herein are that of the authors and may differ from official<br />
statistics published by Statistics South Africa.<br />
We would like to acknowledge Jovial Wessie for his technical contribution in creating<br />
statistical tables.<br />
This study was partially funded by the Health Department of the <strong>Western</strong> <strong>Cape</strong> as part<br />
of its Burden of Disease study.
Contents<br />
Introduction ...................................................................................................... 113<br />
Methods ........................................................................................................... 114<br />
1.1 Data source...................................................................................... 114<br />
1.2 Burden of disease list......................................................................... 114<br />
1.3 Comparison with numbers of deaths on population register .................. 114<br />
1.4 Comparison with numbers of deaths from ASSA2003........................... 115<br />
1.5 Premature mortality (YLLs) .............................................................. 115<br />
Results ........................................................................................................... 116<br />
2.1 Number of deaths ............................................................................. 116<br />
2.2 Trends in numbers of deaths by age and sex......................................... 120<br />
2.3 Trends in cause of death .................................................................... 124<br />
2.4 Trends by age group........................................................................... 133<br />
2.4.1 Infants (less than 1 year) .......................................................... 133<br />
2.4.2 Children 1-4 years .................................................................... 136<br />
2.4.3 Children 5-14 years ................................................................... 138<br />
2.4.4 Adults 15-29 years ................................................................... 140<br />
2.4.5 Adults 30-44 years ................................................................... 142<br />
2.4.6 Adults 45-59 years ................................................................... 144<br />
2.4.7 Adults 60+ years ..................................................................... 146<br />
2.5 Years of life lost (YLLs) ....................................................................... 148<br />
Discussion......................................................................................................... 154<br />
Conclusion ........................................................................................................ 156<br />
References ........................................................................................................ 157
List of Tables<br />
Table 1:<br />
Table 2:<br />
Table 3:<br />
Total deaths recorded by Stats SA, Population Register and<br />
estimated by ASSA2003 by sex ............................................................ 117<br />
Under-5 deaths recorded by Stats SA, Population Register and<br />
estimated by ASSA2003 ...................................................................... 118<br />
Leading 10 causes of deaths and years of life lost with and without<br />
age weighting for men and women, 1997................................................ 151<br />
List of Figures<br />
Figure 1: Number of <strong>Western</strong> <strong>Cape</strong> deaths from Stats SA, Population Register,<br />
and ASSA2003 .................................................................................... 117<br />
Figure 2: Number of child deaths in <strong>Western</strong> <strong>Cape</strong> from Stats SA,<br />
Population Register and ASSA2003 ........................................................ 119<br />
Figure 3: Number of <strong>Western</strong> <strong>Cape</strong> deaths by age and sex,<br />
Stats SA 1997-2002 ............................................................................ 121<br />
Figure 4: Annual growth rate in recorded deaths by Stats SA between 1997 and 2002<br />
by age and sex, <strong>Western</strong> <strong>Cape</strong> .............................................................. 122<br />
Figure 5: Number of <strong>Western</strong> <strong>Cape</strong> natural and non-natural deaths by age<br />
and sex, Stats SA 1997-2002................................................................ 123<br />
Figure 6: <strong>Western</strong> <strong>Cape</strong> deaths by category, age and sex, Stats SA 1997 and<br />
2002 ................................................................................................. 125<br />
Figure 7: Proportion of total <strong>Western</strong> <strong>Cape</strong> deaths by category,<br />
Stats SA 1997-2002 ............................................................................ 127<br />
Figure 8: Proportion of total <strong>Western</strong> <strong>Cape</strong> male and female deaths<br />
due to ill-defined causes, Stats SA 1997-2002 ......................................... 128<br />
Figure 9: Proportion of total <strong>Western</strong> <strong>Cape</strong> male and female deaths<br />
due to injuries, Stats SA 1997-2002....................................................... 129<br />
Figure 10: Cause of male deaths (all ages) <strong>Western</strong> <strong>Cape</strong>, Stats SA 1997 and<br />
2002 ................................................................................................. 131<br />
Figure 11: Cause of female deaths (all ages) <strong>Western</strong> <strong>Cape</strong>, Stats SA 1997<br />
and 2002 ........................................................................................... 132<br />
Figure 12: Cause of death of infant males and females, aged under-1,<br />
<strong>Western</strong> <strong>Cape</strong>, Stats SA 1997 and 2002.................................................. 135<br />
Figure 13: Cause of death of male and female children aged 1-4 years,<br />
<strong>Western</strong> <strong>Cape</strong>, Stats SA 1997 and 2002.................................................. 137<br />
Figure 14: Cause of death of male and female children aged 5-14 years,<br />
<strong>Western</strong> <strong>Cape</strong>, Stats SA 1997 and 2002.................................................. 139<br />
Figure 15: Cause of death of males and females aged 15-29 years,<br />
<strong>Western</strong> <strong>Cape</strong>, Stats SA 1997 and 2002.................................................. 141<br />
Figure 16: Cause of death of males and females aged 30-44 years,<br />
<strong>Western</strong> <strong>Cape</strong>, Stats SA 1997 and 2002.................................................. 143<br />
Figure 17: Cause of death of males and females aged 45-59 years,<br />
<strong>Western</strong> <strong>Cape</strong>, Stats SA 1997 and 2002.................................................. 145<br />
Figure 18: Cause of death of males and females aged 60+ years,<br />
<strong>Western</strong> <strong>Cape</strong>, Stats SA 1997 and 2002.................................................. 147<br />
Figure 19: Years of life lost comparing the use of age weighting and discounting,<br />
<strong>Western</strong> <strong>Cape</strong>, Stats SA, 2002............................................................... 149<br />
Figure 20: Leading causes of years of life lost for males and females all ages calculated<br />
without age weighting or discounting, <strong>Western</strong> <strong>Cape</strong>,<br />
Stats SA, 1997 and 2002...................................................................... 153
Acronyms and Abbreviations<br />
AIDS Acquired Immune Deficiency Syndrome<br />
ASSA2003 Actuarial Society of South Africa 2003 model<br />
BOD Burden of Disease<br />
DALY Disability adjusted life year<br />
GBD List Global Burden of Disease list<br />
GBD Global Burden of Disease<br />
Group I Communicable diseases, maternal causes, perinatal conditions and<br />
nutritional deficiencies, including HIV/AIDS unless otherwise specified<br />
Group II Non-communicable diseases<br />
Group III Injuries<br />
HIV Human immuno-deficiency virus<br />
ICD-10 International Classification of Diseases (Tenth edition)<br />
MRC Medical Research Council<br />
NIMSS National Injury <strong>Mortality</strong> <strong>Surveillance</strong> Study<br />
SA BOD list South African Burden of Disease list<br />
SA NBD South African National Burden of Disease Study<br />
Stats SA Statistics South Africa<br />
WHO World Health Organization<br />
YLLs Years of life lost due to premature mortality
Executive Summary<br />
The <strong>Western</strong> <strong>Cape</strong> Department of Health has initiated a project that aims to reduce<br />
the burden of disease in the province. An important part of this project is to improve<br />
population health surveillance and monitor the trends in the burden of disease in the<br />
province. This report, for the first time investigates the trends in the <strong>Western</strong> <strong>Cape</strong><br />
empirical cause of death data from 1997 to 2002 utilising <strong>Western</strong> <strong>Cape</strong> cause of<br />
death data provided by Statistics South Africa as a special tabulation of the data<br />
collected from death notifications.<br />
The number deaths for the <strong>Western</strong> <strong>Cape</strong> reported by Stats SA increased during the<br />
period from 1997 to 2002. Comparison with the ASSA2003 model estimates suggest<br />
that the registration of deaths in this province is reasonably high and has remained so<br />
throughout the period. Reported deaths of children under-five also increased during<br />
the period, but as mortality data for children relative to adults is poor, and the levels<br />
of registration of child and infant deaths remains uncertain, interpretation of these<br />
data are difficult.<br />
The data revealed a pronounced gender difference in the registered deaths. Though<br />
there are consistently more male deaths than females, the province contains more<br />
females than males. Distinctive age patterns emerged during the period from 1997 to<br />
2002, showing a rapid increase in mortality in young adults as a result of an increase<br />
in HIV/AIDS deaths. While the burden of HIV/AIDS and related deaths is high in the<br />
province, it is much lower than national levels. Deaths due to infectious and parasitic<br />
diseases increased during the period in all age groups examined, with the steepest<br />
increases occurring among young adult females between 15 and 49 and males<br />
between 20 and 59. The smallest increase was among children under 14 and older<br />
adults over 60.<br />
Throughout the period, non-communicable diseases dominate the mortality profile of<br />
the province. These affect older people and impact on mortality among the 45-59 year<br />
age group, and vastly dominate mortality in older adults. At 60 years and above,<br />
mortality patterns are very similar for males and females, but female deaths occurred<br />
at much older ages. The patterns showed very little change from 1997 to 2002.<br />
Injury deaths are very high among males, especially among the 15 to 29 year age<br />
group. Among children under the age of 14, though death due to injuries is high,<br />
there is very little differentiation by sex.<br />
Premature mortality was assessed for 1997 and 2002 using years of life lost (YLLs).<br />
Undetermined injuries remained the leading cause of premature mortality for males<br />
across the period. However, the gap between this cause and TB narrowed<br />
considerably. In the case of females, TB was the leading cause of premature mortality<br />
in 2002, replacing undetermined injuries. Detailed analysis of this data shows that<br />
age weighting and discounting make little difference at a broad level when ranking the<br />
causes of YLLs. However, when it comes to the exact position in the top league,<br />
discounting strongly favours conditions that have a higher impact on adults, and<br />
reduces the ranking of conditions affecting children. The impact of age weighting is<br />
less marked. Decision makers must give serious consideration to the use of age<br />
weighting and discounting in the calculation of YLLs and DALYs.
Certain data quality issues were revealed by this analysis. It was found that the<br />
incorrect use of perinatal ICD-10 codes for deaths of children under the age of 1 year<br />
created an under representation of many true causes of death for children aged from<br />
one week to twelve months. In addition, the proportion of ill-defined natural causes in<br />
the <strong>Western</strong> <strong>Cape</strong> was 6% compared to a national average of 12%. This suggests<br />
data in the province to be of a better quality than data for South Africa as a whole.<br />
However, there was a relatively high proportion of ill-defined cardiovascular causes,<br />
particularly for females. It was not possible to analyse trends in the causes of injury<br />
deaths as they were largely unspecified.<br />
This analysis has revealed important information about changes in the mortality<br />
profile in the <strong>Western</strong> <strong>Cape</strong>. In addition, although there have been substantial<br />
improvements in vital registration in South Africa since 1994, there is a clear need for<br />
further improvement including:<br />
training in the certification of cause of death<br />
improvements in the registration of the deaths of children<br />
resolving some coding issues that exist<br />
making data available at a sub-province level.<br />
Although this study provides valuable public health information, a burden of disease<br />
assessment that makes use of multiple sources of data and adjusts for the underregistration<br />
of deaths and the mis-classification of causes is needed.
Introduction<br />
<strong>Mortality</strong> estimates for <strong>Western</strong> <strong>Cape</strong> Province were produced as part of the National<br />
Burden of Disease Study (Bradshaw et al, 2003a). These synthetic estimates made<br />
adjustments for the known under-registration of deaths and the ill-defined causes of<br />
death, developing consistent and coherent information that could be used for<br />
planning. The estimates of mortality rates provide a profile of the causes of death in<br />
the province giving some reflection of the demands on the health service, and years of<br />
life lost (YLLs) indicating the public health needs to reduce premature mortality.<br />
The <strong>Western</strong> <strong>Cape</strong> mortality profile highlighted the substantial impact of noncommunicable<br />
diseases in this province and the fact that a major health transition is<br />
under way. As countries become more developed the disease profile changes from one<br />
of infectious diseases, high child mortality and malnutrition to a predominance of<br />
degenerative, chronic diseases. However, developing countries often experience a<br />
double burden, resulting from the simultaneous occurrence of these disease<br />
spectrums. In the case of <strong>Western</strong> <strong>Cape</strong>, the double burden is accompanied by a<br />
substantial burden of injuries and an emerging burden from HIV/AIDS.<br />
These estimates, amongst other information, have resulted in the initiation of a<br />
provincial burden of disease project that aims to estimate the burden of disease in the<br />
<strong>Western</strong> <strong>Cape</strong>, its associated risk factors, and intersectoral interventions. Efforts to<br />
improve the provincial capacity to monitor the burden of disease, including mortality<br />
and morbidity, are an integral part of the project to reduce the burden of disease. The<br />
intention of these efforts is to ensure an ongoing mechanism to monitor trends in the<br />
burden and evaluate the impact of the efforts to reduce the burden.<br />
Since 1994 there have been substantial improvements in the completeness of death<br />
registration. Since 1997, the coding of the causes of death from the death<br />
notifications has been standardized and Statistics South Africa has reported on the<br />
national cause of death statistics that have been processed in a standard manner.<br />
However, these statistics require careful analysis as they still suffer from some<br />
deficiencies. Although the national data has been made available for further analysis,<br />
it has only been possible to obtain the data for 1997 – 2002 for the province. It has<br />
not been possible to obtain sub-provincial level data.<br />
This report, for the first time investigates the trends in the <strong>Western</strong> <strong>Cape</strong> empirical<br />
cause of death data. It is important to do this in order to glean as much information<br />
on trends, but also to identify data quality issues in preparation for further burden of<br />
disease analysis and the estimation of death rates. This report investigates the trends<br />
in the profiles as recorded by Stats SA.<br />
113
Methods<br />
1.1 Data source<br />
The data from which this report is prepared were received from Statistics South Africa<br />
as a special tabulation for the <strong>Western</strong> <strong>Cape</strong> stratified by age, sex and underlying<br />
cause of death. These data were also used to prepare Statistics South Africa’s P0309<br />
series of reports on mortality and causes of death (Stats SA, 2005). The information<br />
about each deceased is based exclusively on information recorded on the death<br />
notification forms, as received from the Department of Home Affairs. In 1998, a new<br />
form (BI-1663) was introduced, replacing the BI-7 and BI-12 forms that were<br />
previously used. In addition, a form (BI-1680) to be completed by a traditional<br />
headman was introduced for use in rural areas when a medical practitioner is not<br />
available. It is not clear that many such forms are used in the <strong>Western</strong> <strong>Cape</strong>, but it is<br />
impossible to distinguish from which form type the data has been obtained. A 3 digit<br />
ICD-10 (WHO, 1992) code was manually assigned by Stats SA coders for each cause<br />
of death recorded on the death notification form. These were converted to 4 digit<br />
codes by specifying the generalized code for the 4 th digit, so that the underlying cause<br />
of death could be derived automatically with a software programme called Automated<br />
Classification of Medical Entities (ACME 2004.02) developed by the United States<br />
National Center for Health Statistics (NCHS). In most cases, the fourth digit was ‘9’ or<br />
‘8’, indicating that the detail of the recorded disease was not specified. While the<br />
ACME programme did not resolve all coded cases, it did so for the vast majority with<br />
typically only 1% of the underlying causes requiring manual derivation.<br />
1.2 Burden of disease list<br />
The ICD-10 code list is extensive and allows for clinically distinct diagnoses. However,<br />
such details provide more information than is required when analyzing the data from a<br />
public health point of view. The underlying cause has therefore been aggregated to<br />
the South African Burden of Disease (SA BOD) list (Bradshaw et al., 2003). This list<br />
was developed from the Global Burden of Disease 1990 list of causes of death (Murray<br />
and Lopez, 1996) and adapted on the basis of the disease profile for South Africa,<br />
with some adaptations from the Australian BOD study (Mathers et al., 1999). The list<br />
comprises 140 conditions and is presented in Appendix I. The list also allows for the<br />
ill-defined classifications within categories eg., ill-defined perinatal conditions.<br />
For the analysis, causes are divided into three broad groups: Group I, the pretransitional<br />
causes, include communicable diseases, maternal causes, perinatal<br />
conditions, and nutritional deficiencies; Group II, the non-communicable causes,<br />
include chronic and degenerative diseases; and Group III, the injuries. Each group is<br />
divided into several major disease categories.<br />
1.3 Comparison with numbers of deaths on population register<br />
The total number deaths for the province reported by Stats SA are compared with the<br />
number registered on the population register and the numbers estimated by the<br />
ASSA2003 model in order to assess the consistency. Details of deaths logged on the<br />
population register by the Department of Home Affairs are sent to the MRC on a<br />
114
monthly basis and included in a database used for rapid mortality surveillance. The<br />
database consists of registered deaths where a South African ID was also available.<br />
Therefore the population register data is essentially a subset of the Stats SA death<br />
data. Non-natural deaths can be separated in this database via an algorithm based on<br />
key descriptive words developed to distinguish between the natural and non-natural<br />
causes of death.<br />
1.4 Comparison with numbers of deaths from ASSA2003<br />
The ASSA2003 model, developed by the Actuarial Society of South Africa, is available<br />
on the web (http://www.assa.org.za/default.asp?id=1000000050). It is a<br />
demographic component projection model that incorporates behavioural factors and is<br />
calibrated to population estimates from the 1996 and 2001 censuses, the HIV seroprevalence<br />
from annual antenatal clinic surveys up to the year 2002, empirical levels<br />
of child mortality from the 1996 census and the 1998 South African Demographic and<br />
Health Survey and adult mortality levels (deaths recorded by the Department of Home<br />
Affairs on the population register and deaths recorded by Statistics South Africa after<br />
adjusting for under-reporting). ASSA2002 models the heterosexual epidemic<br />
(Actuarial Society of South Africa, 2004).<br />
1.5 Premature mortality (YLLs)<br />
Describing mortality based on the number of deaths does not take into consideration<br />
premature mortality. This is an important public health indicator of the health status<br />
of a population. Since many deaths occur at older ages, mortality data is typically<br />
dominated by conditions affecting the elderly. Years of life lost (YLL) is a method that<br />
takes into account the age at death by giving greater weight to deaths at younger<br />
ages and lower weight to deaths at older ages. Deaths at younger ages accrue more<br />
years of life lost than deaths occurring at older ages.<br />
YLLs have been calculated using the standard GBD approach of Murray and Lopez<br />
(1996 a) with standard life expectancies based on the West model levels 25 and 26<br />
for males and females respectively (Coale and Demeny, 1966). A sensitivity analysis<br />
is undertaken comparing YLLs using age weighting and a 3% standard discounting.<br />
115
Results<br />
2.1 Number of deaths<br />
The number of recorded deaths reported by Stats SA increased from 33,166 in 1997<br />
to 43,570 in 2002.Although there are more females in the province, there are<br />
consistently more male deaths than female with a male to female ratio of 1.3. The<br />
number of deaths reported by Stats SA is compared with the numbers of deaths<br />
recorded on the population register and the numbers estimated by the ASSA2003<br />
model in Table 1 for males and females and the totals are shown in Figure 1. The<br />
populations register data starts in the year 1999, when the MRC began to<br />
systematically collect these data. There were a total of 32,402 deaths in 1999,<br />
accounting for 86% of the Stats SA number of that year. In 2002 there were 41,357<br />
deaths recorded on the population register, which had increased to 95% of the<br />
number recorded by Stats SA indicating an improvement in the registration of<br />
individuals onto the population register. When comparing the deaths recorded by<br />
Stats SA to the numbers estimated by the ASSA2003 model, the Stats SA deaths<br />
increased from 92% of the ASSA2003 estimates in 1997 to 95% in 1998 and then<br />
dropped back to 92% in 2002. This indicates that there is good coverage of death<br />
registration in this province. However, there are marked differences between males<br />
and females. Compared to the ASSA2003 estimates, Stats SA recorded approximately<br />
95% of the male deaths over the period and 88% of the female deaths. It is possible<br />
that registration of deaths for females is lower than that for males. From 2000<br />
onwards there is a growing discrepancy between the number of registered deaths and<br />
the model estimates for females.<br />
116
Table 1: Total deaths recorded by Stats SA, Population Register, and<br />
estimated by ASSA2003, by sex<br />
Stats SA Population Register ASSA2003 estimation<br />
Year Male Female Total Male Female Total Male Female Total<br />
1997 19070 14096 33166 20172 15797 35970<br />
1998 20764 15395 36159 21231 16870 38101<br />
1999 21641 16266 37907 18684 13718 32402 22237 17989 40226<br />
2000 21617 16789 38406 19912 15131 35043 23351 19235 42585<br />
2001 23229 17821 41050 21525 16648 38173 24586 20633 45219<br />
2002 24686 18884 43570 23289 18068 41357 25669 21920 47589<br />
2003 23622 19118 42740 26464 22914 49377<br />
2004 23700 19459 43159 27122 23761 50883<br />
2005 24010 20020 44030 27884 24756 52640<br />
2006 20172 15797 35970<br />
Total mortality (all ages)<br />
number of deaths<br />
100000<br />
90000<br />
80000<br />
70000<br />
60000<br />
50000<br />
40000<br />
30000<br />
20000<br />
10000<br />
0<br />
ASSA2003 estimates<br />
STATS SA data<br />
Population Register data<br />
1997 1998 1999 2000 2001 2002 2003 2004 2005<br />
Figure 1: Number of <strong>Western</strong> <strong>Cape</strong> deaths from Stats SA, Population Register,<br />
and ASSA2003<br />
117
o<br />
o<br />
The number of recorded deaths reported by Stats SA increased from 33166 in<br />
1997 to 43570 in 2002.<br />
Based on ASSA2003 model estimates, there is very good coverage of death<br />
registration in the <strong>Western</strong> <strong>Cape</strong>.<br />
The number of deaths of children under the age of five years recorded by Stats SA are<br />
compared to the number recorded on the population register and the estimates<br />
derived from the ASSA2003 in Table 2; totals are shown in Figure 2. As with the all<br />
age deaths, the number of under-five deaths recorded by Stats SA increased during<br />
the same period. Under-five deaths recorded by Stats SA increased from 2,354 deaths<br />
in 1997 to 3,151 in 2002. On the population register there are 736 recorded deaths of<br />
children under five in 1999, just 26% of the number recorded by Stats SA for the<br />
same year. Efforts to improve birth registration have resulted in an increase in this<br />
proportion. By 2002 the number of under-five deaths recorded on the population<br />
register had increased to 44% of the number recorded by Stats SA.<br />
The number of under-five deaths recorded by Stats SA was compared to estimates<br />
from ASSA2003. Stats SA recorded 62% of the deaths estimated by ASSA2003 for<br />
both male and female children under-five in 1997. By 2002 the deaths recorded by<br />
Stats SA accounted for 70% of the deaths estimated by ASSA2003. However, this<br />
differed by sex with 73% the estimate of deaths of male children and 66% of female<br />
children. It is evident that the model is not fitting well with empirical trends at these<br />
younger ages. From Figure 2, it can be seen that whereas the model projected that<br />
the number of child deaths would peak in 2001 and start to decline thereafter, the<br />
empirical data shows that they have continued to increase. It is not clear whether this<br />
is a result of improved registration of deaths or whether the model does not fit well.<br />
Accuracy of the estimates generated by the model is dependent upon the empirical<br />
data used to calibrate the model. Because mortality data for children is poor relative<br />
to that of adults, estimates generated by the model are possibly not as robust for<br />
children.<br />
Table 2: Under-5 deaths recorded by Stats SA, Population Register, and<br />
estimated by ASSA2003<br />
Year Stats SA<br />
Population ASSA2003<br />
Register<br />
estimation<br />
1997 2354 3798<br />
1998 2757 4030<br />
1999 2884 736 4286<br />
2000 2852 807 4528<br />
2001 2780 977 4634<br />
2002 3151 1387 4522<br />
2003 1429 4280<br />
2004 1656 4079<br />
2005 1510 3983<br />
2006 3924<br />
118
Total mortality < 5 year<br />
number of deaths<br />
7000<br />
6000<br />
5000<br />
4000<br />
3000<br />
2000<br />
1000<br />
0<br />
ASSA2003 estimates<br />
STATS SA data<br />
Population Register data<br />
1997 1998 1999 2000 2001 2002 2003 2004 2005<br />
Figure 2: Number of child deaths in <strong>Western</strong> <strong>Cape</strong> from Stats SA,<br />
Population Register and ASSA2003<br />
o The number of under-five deaths recorded by Stats SA increased from 2354<br />
in 1997, to 3151 in 2002.<br />
o<br />
However, mortality data for children is poor relative to that of adults, and<br />
interpretation should be made with caution.<br />
119
2.2 Trends in numbers of deaths by age and sex<br />
The age specific distribution of deaths in the <strong>Western</strong> <strong>Cape</strong> Province reported by Stats<br />
SA for the year 1997 through 2002 are shown in Figure 3. These show very distinctive<br />
age patterns in the increase. After age 14, mortality increases sharply and the<br />
distribution of deaths begins to differentiate by sex. During the period from 1997 to<br />
2002, two rapidly emerging peaks in mortality become evident in females; one in<br />
young adult females aged 20 to 44, and the other in senior adult females aged 60 to<br />
79. After age 84 mortality increases sharply in females. The mortality peak of young<br />
adult females increased steadily each year after 1997 up to 2002. In senior females<br />
aged 60 to 79 mortality generally increased over the time period, but less dramatically<br />
than young adult females. In males, a double mortality peak is also evident but with a<br />
much higher number of deaths in young adult males than young adult females. An<br />
increasing peak in mortality emerges at approximately age 25 to 44 and at age 55 to<br />
85+ in males. The high mortality observed among females aged 85 and over is not<br />
present in males. This is likely due to population demographics in the province where<br />
there is a larger population of females at older ages. The number of deaths among<br />
males aged 25 to 44 increased steadily from 1997 to 2002. At younger ages of both<br />
sexes, the number of deaths of infants under the age of 1 year was four times higher<br />
than the number of child deaths among the 1 to 4 year age group, in 1997. By 2002<br />
infant deaths were 4.5 times higher than child deaths. Throughout the period<br />
mortality remained very low in children aged 1 year up to age 14 years.<br />
Overall the number of deaths reported in the <strong>Western</strong> <strong>Cape</strong> increased at a rate of<br />
5.6% per annum. Figure 4 shows the rate of increase by age group and sex. This<br />
highlights the rapid growth in female deaths aged 15-44 years. The increase in the<br />
number of male infant deaths is somewhat higher than that for females. The mortality<br />
trends in the <strong>Western</strong> <strong>Cape</strong> are in sharp contrast to the mortality patterns observed at<br />
a national level (see Appendix B). The difference at the baseline can be explained in<br />
part as a result of the demographic difference of the province, ie. having an older<br />
population than the national average, and in part as result of the province being more<br />
affluent and having better access to basic services and health care. The baseline<br />
pattern of male deaths in the <strong>Western</strong> <strong>Cape</strong> also had a distinctively high number of<br />
young adult deaths. The trend however, shows that the <strong>Western</strong> <strong>Cape</strong> has a lower<br />
prevalence of HIV than the rest of the country.<br />
120
Total male deaths, <strong>Western</strong> <strong>Cape</strong><br />
Stats SA data<br />
2500<br />
2000<br />
number of deaths<br />
1500<br />
1000<br />
1997<br />
1998<br />
1999<br />
2000<br />
2001<br />
2002<br />
500<br />
0<br />
Total female deaths, <strong>Western</strong> <strong>Cape</strong><br />
Stats SA data<br />
2500<br />
2000<br />
1500<br />
1000<br />
500<br />
0<br />
0<br />
1-4<br />
5-9<br />
10-14<br />
15-19<br />
20-24<br />
25-29<br />
30-34<br />
35-39<br />
40-44<br />
45-49<br />
50-54<br />
55-59<br />
60-64<br />
65-69<br />
70-74<br />
75-79<br />
80-84<br />
85+<br />
0<br />
1-4<br />
5-9<br />
10-14<br />
15-19<br />
20-24<br />
25-29<br />
30-34<br />
35-39<br />
40-44<br />
45-49<br />
50-54<br />
55-59<br />
60-64<br />
65-69<br />
70-74<br />
75-79<br />
80-84<br />
85+<br />
age group<br />
number of deaths<br />
1997<br />
1998<br />
1999<br />
2000<br />
2001<br />
2002<br />
age group<br />
Figure 3: Number of <strong>Western</strong> <strong>Cape</strong> deaths by age and sex,<br />
Stats SA 1997-2002<br />
121
15%<br />
12%<br />
12.4%<br />
11.9%<br />
9%<br />
7.3%<br />
8.3%<br />
6%<br />
3%<br />
4.7%<br />
3.6%<br />
5.9%<br />
3.5%<br />
2.8%<br />
5.6% 5.5%<br />
5.1%<br />
4.0%<br />
3.3%<br />
0%<br />
Natural deaths male, <strong>Western</strong> <strong>Cape</strong><br />
Stats SA data<br />
Natural deaths female, <strong>Western</strong> <strong>Cape</strong><br />
Stats SA data<br />
2500<br />
2500<br />
2000<br />
2000<br />
number of deaths<br />
1500<br />
1000<br />
1997<br />
1998<br />
1999<br />
2000<br />
2001<br />
2002<br />
number of deaths<br />
1500<br />
1000<br />
1997<br />
1998<br />
1999<br />
2000<br />
2001<br />
2002<br />
500<br />
500<br />
0<br />
0<br />
1-4<br />
5-9<br />
10-14<br />
15-19<br />
20-24<br />
25-29<br />
30-34<br />
35-39<br />
40-44<br />
45-49<br />
50-54<br />
age group<br />
55-59<br />
60-64<br />
65-69<br />
70-74<br />
75-79<br />
80-84<br />
85+<br />
0<br />
0<br />
1-4<br />
5-9<br />
10-14<br />
15-19<br />
20-24<br />
25-29<br />
30-34<br />
35-39<br />
40-44<br />
45-49<br />
50-54<br />
age group<br />
55-59<br />
60-64<br />
65-69<br />
70-74<br />
75-79<br />
80-84<br />
85+<br />
Non-natural deaths male, <strong>Western</strong> <strong>Cape</strong><br />
Stats SA data<br />
Non-natural deaths female ,<strong>Western</strong> <strong>Cape</strong><br />
Stats SA data<br />
1000<br />
1000<br />
800<br />
800<br />
number of deaths<br />
600<br />
400<br />
1997<br />
1998<br />
1999<br />
2000<br />
2001<br />
2002<br />
number of deaths<br />
600<br />
400<br />
1997<br />
1998<br />
1999<br />
2000<br />
2001<br />
2002<br />
200<br />
200<br />
0<br />
0<br />
1-4<br />
5-9<br />
10-14<br />
15-19<br />
20-24<br />
25-29<br />
30-34<br />
35-39<br />
40-44<br />
45-49<br />
50-54<br />
age group<br />
55-59<br />
60-64<br />
65-69<br />
70-74<br />
75-79<br />
80-84<br />
85+<br />
0<br />
0<br />
1-4<br />
5-9<br />
10-14<br />
15-19<br />
20-24<br />
25-29<br />
30-34<br />
35-39<br />
40-44<br />
45-49<br />
50-54<br />
age group<br />
55-59<br />
60-64<br />
65-69<br />
70-74<br />
75-79<br />
80-84<br />
85+<br />
Figure 5: Number of <strong>Western</strong> <strong>Cape</strong> natural and non-natural deaths by age<br />
and sex, Stats SA 1997-2002<br />
123
2.3 Trends in cause of death<br />
Figure 6 shows the 1997 and 2002 age trend of disease categories for males and<br />
females. The distinct age pattern of the deaths can be observed with a higher number<br />
of infant deaths dropping during childhood and increasing rapidly into adulthood and<br />
older ages. The pattern reflects both the age specific mortality rates and the age<br />
structure of the population of the province. The male age pattern displays a marked<br />
young adult peak which results from a high number of injury deaths.<br />
There is an increase in numbers of deaths over this period that occurs across all ages.<br />
However, between 1997 and 2002 the changing cause of death pattern reveals the<br />
emergence of an increase in deaths from infectious and parasitic diseases in both<br />
sexes due to the HIV/AIDS pandemic. This is most notably among young adults with<br />
the majority of deaths from infectious and parasitic diseases occurring at a slightly<br />
younger age in females than in males. In 2002 the highest number of deaths from<br />
infectious and parasitic diseases occurred at the age of 20 to 24 years of age among<br />
females, and age 25 to 29 among males. Injuries particularly dominated the cause of<br />
death of males from adolescence through to mid-life in 1997 and in 2002. The major<br />
cause of death in infants under age one year was due to those causes categorised as<br />
perinatal conditions, maternal conditions and nutritional deficiencies. Infectious and<br />
parasitic diseases, and injuries are the major contributors to mortality during<br />
childhood, early adulthood and mid-life. Deaths from non-communicable diseases,<br />
specifically cardiovascular diseases, malignant neoplasms, respiratory disease and<br />
Diabetes mellitus increase throughout older ages, while deaths from infectious and<br />
parasitic diseases and injuries are not as prominent at older ages.<br />
o<br />
o<br />
o<br />
o<br />
o<br />
Very distinct age patterns, consisting of rapidly increasing peaks in<br />
mortality in young adult males and young adult females, emerge during<br />
the period of 1997 to 2002.<br />
This is due to an increase in deaths from infectious and parasitic diseases,<br />
particularly among young adults; a direct result of the HIV/AIDS<br />
pandemic.<br />
The age patterns of mortality in the <strong>Western</strong> <strong>Cape</strong> are very different from<br />
the national data, with the <strong>Western</strong> <strong>Cape</strong> having a higher proportion of<br />
older deaths and a lesser HIV/AIDS pattern.<br />
Deaths due to non-natural causes are very high in males.<br />
The overall the number of deaths reported in the <strong>Western</strong> <strong>Cape</strong> increased<br />
5.6% per annum.<br />
124
3000<br />
2500<br />
2000<br />
1500<br />
1000<br />
500<br />
0<br />
3000<br />
2500<br />
< 1<br />
3000<br />
2500<br />
2000<br />
1500<br />
1000<br />
500<br />
5-9<br />
Total deaths <strong>Western</strong> <strong>Cape</strong> 1997<br />
Males<br />
Total deaths N = 19 <strong>Western</strong> 070<br />
<strong>Cape</strong> 1997<br />
Males<br />
N = 19 070<br />
0<br />
< 1<br />
15-19<br />
5-9<br />
25-20<br />
15-19<br />
35-39<br />
25-20<br />
45-49<br />
35-39<br />
55-59<br />
age in years<br />
45-49<br />
55-59<br />
age in years<br />
Total deaths <strong>Western</strong> <strong>Cape</strong> 2002<br />
Males<br />
N = 24 686<br />
\<br />
65-69<br />
75-79<br />
65-69<br />
85+<br />
Perinatal/maternal/nutritional<br />
Ill-defined natural<br />
Perinatal/maternal/nutritional<br />
Residual conditions<br />
Ill-defined<br />
3000<br />
Respiratory Residual disease<br />
conditions<br />
2500<br />
Malignant neoplasms<br />
Respiratory disease<br />
2000<br />
Diabetes mellitus<br />
Malignant neoplasms<br />
Cardiovascular Diabetes disease<br />
mellitus<br />
Stroke<br />
75-79<br />
85+<br />
Cardiovascular disease<br />
1000<br />
Respiratory Stroke infections<br />
Infectious and Respiratory parasitic<br />
infections<br />
Injuries<br />
Infectious and parasitic<br />
Injuries<br />
Perinatal/maternal/nutritional<br />
Ill-defined<br />
Residual conditions<br />
Respiratory disease<br />
Malignant neoplasms<br />
1500<br />
3000<br />
2500<br />
500<br />
0<br />
< 1<br />
Total deaths <strong>Western</strong> <strong>Cape</strong> 1997<br />
Females<br />
Total deaths <strong>Western</strong> <strong>Cape</strong> 1997<br />
N = 14 096<br />
Females<br />
N = 14 096<br />
3000<br />
2500<br />
2000<br />
1500<br />
1000<br />
500<br />
5-9<br />
0<br />
< 1<br />
15-19<br />
5-9<br />
25-20<br />
15-19<br />
35-39<br />
25-20<br />
45-49<br />
55-59<br />
age in years<br />
35-39<br />
65-69<br />
45-49<br />
75-79<br />
55-59<br />
85+<br />
65-69<br />
age in years<br />
Total deaths <strong>Western</strong> <strong>Cape</strong> 2002<br />
Females<br />
N = 18 884<br />
75-79<br />
85+<br />
2000<br />
Diabetes mellitus<br />
2000<br />
1500<br />
1000<br />
500<br />
0<br />
< 1<br />
5-9<br />
15-19<br />
25-20<br />
35-39<br />
45-49<br />
55-59<br />
age in years<br />
65-69<br />
75-79<br />
85+<br />
Cardiovascular disease<br />
Stroke<br />
Respiratory infections<br />
Infectious and parasitic<br />
Injuries<br />
1500<br />
1000<br />
500<br />
0<br />
< 1<br />
5-9<br />
15-19<br />
25-20<br />
35-39<br />
45-49<br />
55-59<br />
age in years<br />
65-69<br />
75-79<br />
85+<br />
Figure 6: <strong>Western</strong> <strong>Cape</strong> deaths by category, age and sex, Stats SA 1997 and 2002<br />
125
Figure 7 shows the trend in the proportion of deaths by category of diseases. Among<br />
both males and females, the proportion of deaths due to infectious and parasitic<br />
diseases increased steeply from 1997 to 2002. In females, this category surpassed<br />
cardiovascular disease and malignant neoplasms, contributing the highest proportion<br />
of deaths by 2002. This pattern is very similar in males except injuries (non-natural<br />
conditions) contribute, by far, the highest proportion of deaths throughout the entire<br />
time period. Furthermore, the proportion of injury deaths among males deceased<br />
during the period. This illustrates how interpretation of proportions of death should be<br />
made with caution, as the decrease in injury deaths here is rather the result of an<br />
increase in other causes, most notably infectious and parasitic diseases. The fact that<br />
there is not a large decrease in the total number of injury deaths in males during this<br />
time period was shown in the graph of non-natural deaths in males, Figure 5.<br />
o<br />
o<br />
The proportion of infectious and parasitic deaths shows a steep increase for<br />
both males and females between 1997 and 2002.<br />
The proportion of male deaths resulting from injuries (non-natural<br />
conditions) declined during the period. While part of this results from the<br />
increase in other causes, the numbers of injury deaths among males<br />
increased from 5146 in 1997 to 5520 in 2002, clearly slower than the pace<br />
of population growth and suggesting a decline in the injury mortality rates.<br />
126
Male deaths 1997 - 2002<br />
30%<br />
25%<br />
20%<br />
15%<br />
10%<br />
5%<br />
0%<br />
1997 1998 1999 2000 2001 2002<br />
Injuries<br />
Infectious and parasitic<br />
Respiratory infections<br />
Stroke<br />
Cardiovascular disease<br />
Diabetes mellitus<br />
Malignant neoplasms<br />
Respiratory disease<br />
Residual conditions<br />
Perinatal/maternal/nutritional<br />
Ill-defined natural<br />
30%<br />
25%<br />
20%<br />
15%<br />
10%<br />
5%<br />
0%<br />
Female deaths 1997 - 2002<br />
1997 1998 1999 2000 2001 2002<br />
Injuries<br />
Infectious and parasitic<br />
Respiratory infections<br />
Stroke<br />
Cardiovascular disease<br />
Diabetes mellitus<br />
Malignant neoplasms<br />
Respiratory disease<br />
Residual conditions<br />
Perinatal/maternal/nutritional<br />
Ill-defined natural<br />
Figure 7: Proportion of total <strong>Western</strong> <strong>Cape</strong> deaths by category,<br />
Stats SA 1997-2002<br />
127
Figure 8 and 9 show the trends in the proportion of deaths due to selected ill-defined<br />
causes of death. The year that the new death certificate was introduced (1998) is<br />
highlighted. The proportion of total deaths in the <strong>Western</strong> <strong>Cape</strong> due to ill-defined<br />
natural causes increased from 6% to 7% for both males and females in 1998, and<br />
then declined thereafter (Figure 8). This is a relatively high proportion of deaths,<br />
although much lower than the national average of 12%, and may be indicative of<br />
better quality data based on better certification of the causes of death, compared to<br />
national data. A similarly high proportion of deaths in the province was due to illdefined<br />
cardiovascular causes among females. This was almost twice as high as the<br />
proportion in males. Among males and females, the proportions of ill-defined<br />
cardiovascular causes decreased from 1997 to 2002 but without a sharp change at<br />
1998. With the relatively high proportion of deaths due to ill-defined cardiovascular<br />
causes, the patterns of deaths due to specified cardiovascular causes must be<br />
interpreted with caution.<br />
10%<br />
percentage of total deaths<br />
8%<br />
6%<br />
4%<br />
2%<br />
death certificate changed<br />
Ill-defined natural, males<br />
Ill-defined natural, females<br />
Ill-defined cardiovascular, males<br />
Ill-defined cardiovascular, females<br />
0%<br />
1997 1998 1999 2000 2001 2002<br />
Figure 8: Proportion of total <strong>Western</strong> <strong>Cape</strong> male and female deaths<br />
due to ill-defined causes, Stats SA 1997-2002<br />
128
Figure 9 shows the large contrast of injury deaths of undetermined cause between<br />
males and females. Among males, the proportion of deaths due to undetermined<br />
injuries declined from 1997 to 2002 while the proportion of specified injuries<br />
increased, particularly since 1998. This pattern is similar in females except at much<br />
lower proportions. The trends around the introduction of the new death certificate<br />
suggest improvements in the identification of causes of deaths as a result of the<br />
changes on the certificate, but such interpretations should be made with caution.<br />
30%<br />
25%<br />
percentage of total deaths<br />
20%<br />
15%<br />
10%<br />
5%<br />
death certificate changed<br />
Undetermined injuries, males<br />
Undetermined Injuries, females<br />
Specified injuries, males<br />
Specified injuries, females<br />
0%<br />
1997 1998 1999 2000 2001 2002<br />
Figure 9: Proportion of total <strong>Western</strong> <strong>Cape</strong> male and female deaths<br />
due to injuries, Stats SA 1997-2002<br />
o The proportion of deaths due to undetermined injuries declined from 1997<br />
to 2002, but the proportion of specified injuries increased, particularly<br />
since 1998, the year the new death certificate was introduced.<br />
o<br />
o<br />
The proportion of deaths due to ill-defined causes increased from 6% to<br />
7% in 1998 and declined thereafter.<br />
A sizable proportion of deaths are due to ill-defined cardiovascular causes,<br />
particularly for females. The patterns of specified cardiovascular causes<br />
should therefore be interpreted carefully.<br />
129
The overall cause of death profiles for males and females in 1997 and 2002 are shown<br />
using pie charts in Figures 10 and 11. In addition, the ten leading specific causes of<br />
death for 1997 and 2002 were ranked and are shown using bar graphs. The large<br />
proportion of deaths from injuries, contributing to the overall cause of death profile in<br />
males, is particularly evident. Injuries accounted for 27% of the total male deaths in<br />
1997 and 22% of the total male deaths in 2002, while 12% of female deaths in 1997<br />
were due to injury, and 8.5% in 2002. In the case of females, death from noncommunicable<br />
diseases was more prominent. Non-communicable diseases accounted<br />
for 65% of the total female deaths in 1997, and 61% in 2002. Stroke, ischaemic heart<br />
disease, and Diabetes mellitus ranked among the ten leading specific causes of death<br />
from 1997 to 2002 for both sexes. Hypertensive heart disease and ill-defined<br />
cardiovascular disease ranked among the ten leading specific causes in females, while<br />
chronic obstructive pulmonary disease and trachea/bronchial/lung cancer ranked in<br />
males. Ill-defined natural causes accounted for approximately 6% of the total deaths<br />
for both sexes in 1997 and 2002.<br />
A marked increase in deaths from 1997 to 2002 among both males and females was<br />
due to deaths from Group I conditions (communicable diseases, maternal conditions,<br />
perinatal conditions, and nutritional deficiencies). In 1997, Group I conditions<br />
accounted for 16% of male deaths and 17% of female deaths. By 2002, the numbers<br />
had increased to 23% of male deaths and 25% of female deaths. The increase was<br />
largely due to an increase in deaths from tuberculosis, HIV/AIDS and lower<br />
respiratory infections with tuberculosis becoming the second leading specific cause of<br />
death for both males and females by 2002.<br />
o<br />
o<br />
o<br />
A marked increase in deaths from 1997 to 2002 among both males and<br />
females was due to deaths from the TB and HIV/AIDS complex with an<br />
increase in TB, HIV/AIDS and lower respiratory infections resulting in the<br />
increase in Group I conditions<br />
Non-communicable diseases still dominate the cause of death profile in<br />
the <strong>Western</strong> <strong>Cape</strong>, particularly among women.<br />
Injury deaths accounted for a large proportion of the total male deaths.<br />
130
1997 Male deaths, all ages<br />
N = 19 070<br />
2002 Male deaths, all ages<br />
N = 24 686<br />
Injuries<br />
27.0%<br />
Infectious and<br />
parasitic<br />
8.8%<br />
Other Group I<br />
conditions<br />
6.0%<br />
Injuries<br />
22.4%<br />
Infectious and<br />
parasitic<br />
16.0%<br />
Other Group I<br />
conditions<br />
7.1%<br />
Ill-defined<br />
natural<br />
5.8%<br />
Other Group II<br />
conditions<br />
13.1%<br />
Respiratory<br />
diseases<br />
6.4%<br />
Malignant<br />
neoplasms<br />
13.7%<br />
Cardiovascular<br />
19.3%<br />
Ill-defined<br />
natural<br />
5.2%<br />
Other Group II<br />
conditions<br />
13.1%<br />
Respiratory<br />
diseases<br />
6.3%<br />
Malignant<br />
neoplasms<br />
12.2%<br />
Cardiovascular<br />
17.9%<br />
Group I : Communicable,<br />
Maternal, Perinatal, and<br />
Nutritional deficiencies<br />
Group II: Non-communicable<br />
conditions<br />
Ill-defined natural (Group I and II)<br />
Group III: Injuries<br />
Undetermined injuries<br />
Ischaemic heart disease<br />
Chronic obstructive pulmonary disease<br />
Trachea/bronchi/lung cancer<br />
Lower respiratory infections<br />
Ten leading specific causes of death<br />
Males all ages<br />
Tuberculosis<br />
Stroke<br />
Ill-defined natural<br />
Diabetes mellitus<br />
HIV/AIDS<br />
0 5 10 15 20 25 30<br />
percent of all causes<br />
1997<br />
2002<br />
Figure 10: Cause of male deaths (all ages) <strong>Western</strong> <strong>Cape</strong>, Stats SA 1997 and 2002<br />
131
1997 Female deaths, all ages<br />
N = 14 096<br />
2002 Female deaths, all ages<br />
N = 18 884<br />
Ill-defined<br />
natural<br />
6.3%<br />
Other Group II<br />
conditions<br />
18.3%<br />
Respiratory<br />
diseases<br />
5.0%<br />
Injuries<br />
11.7%<br />
Malignant<br />
neoplasms<br />
14.5%<br />
Infectious and<br />
parasitic<br />
8.4%<br />
Other Group I<br />
conditions<br />
8.1%<br />
Cardiovascular<br />
27.5%<br />
Ill-defined<br />
natural<br />
5.4%<br />
Other Group II<br />
conditions<br />
19.1%<br />
Respiratory<br />
diseases<br />
4.8%<br />
Malignant<br />
neoplasms<br />
13.5%<br />
Injuries<br />
8.5%<br />
Infectious and<br />
parasitic<br />
16.6%<br />
Cardiovascular<br />
23.9%<br />
Other Group I<br />
conditions<br />
8.2%<br />
Group I : Communicable,<br />
Maternal, Perinatal, and<br />
Nutritional deficiencies<br />
Group II: Non-communicable<br />
conditions<br />
Ill-defined natural (Group I and II)<br />
Group III: Injuries<br />
Ten leading specific causes of death<br />
Females all ages<br />
Stroke<br />
Tuberculosis<br />
Diabetes mellitus<br />
Undetermined injuries<br />
Ischaemic heart disease<br />
Ill-defined natural<br />
Ill-defined cardiovascular<br />
HIV/AIDS<br />
Lower respiratory infections<br />
Hypertensive heart disease<br />
0 2 4 6 8 10 12<br />
percent of all causes<br />
1997<br />
2002<br />
Figure 11: Cause of female deaths (all ages) <strong>Western</strong> <strong>Cape</strong>, Stats SA 1997 and 2002<br />
132
2.4 Trends by age group<br />
The cause of death profile differs markedly across age groups. Figures 12 through 18<br />
show mortality profiles by age for 1997 and 2002 using the following age groups:
o<br />
o<br />
o<br />
Interpretation of the cause of death profile in infants is difficult as there has<br />
been incorrect coding of causes to perinatal conditions, even when the<br />
deceased was older than 1 week. For example, diarrhoea does not appear<br />
as an explicit condition in the leading causes as they have been mis-coded<br />
to perinatal causes.<br />
The numbers of registered infant deaths (aged under 1 year) has increased<br />
substantially between 1997 and 2002.<br />
Deaths from Group I conditions predominate the under 1 age group,<br />
primarily perinatal and neonatal causes.<br />
134
1997 Male deaths < 1 year<br />
N = 998<br />
2002 Male deaths < 1 year<br />
N = 1438<br />
1997 Female deaths < 1 year<br />
N = 886<br />
2002 Female deaths < 1 year<br />
N = 1 118<br />
Ill-defined natural<br />
3.8%<br />
Group II<br />
conditions<br />
12.8%<br />
Injuries<br />
8.1%<br />
Other perinatal<br />
conditions<br />
40.4%<br />
Ill-defined natural<br />
7.4%<br />
Group II<br />
conditions<br />
11.8%<br />
Injuries<br />
3.3%<br />
Other perinatal<br />
conditions<br />
34.1%<br />
Ill-defined natural<br />
3.7%<br />
Group II conditions<br />
12.8%<br />
Injuries<br />
6.5%<br />
Other perinatal<br />
conditions<br />
42.3%<br />
Ill-defined natural<br />
7.8%<br />
Group II<br />
conditions<br />
13.1%<br />
Injuries<br />
3.0%<br />
Other perinatal<br />
conditions<br />
34.3%<br />
Other Group I<br />
conditions<br />
12.2%<br />
Low birth rate<br />
11.7%<br />
Other perinatal<br />
respiratory<br />
conditions<br />
10.9%<br />
Other Group I<br />
conditions<br />
16.0%<br />
Low birth rate<br />
12.5%<br />
Other perinatal<br />
respiratory<br />
conditions<br />
15.0%<br />
Other Group I<br />
conditions<br />
11.4%<br />
Group I : Communicable,<br />
Maternal, Perinatal, and<br />
Nutritional deficiencies<br />
Low birth rate<br />
11.4%<br />
Other perinatal<br />
respiratory<br />
conditions<br />
11.9%<br />
Other Group I<br />
conditions<br />
15.5%<br />
Low birth rate<br />
11.0%<br />
Other perinatal<br />
respiratory<br />
conditions<br />
15.4%<br />
Group II: Non-communicable<br />
conditions<br />
Ill-defined natural (Group I and II)<br />
Group III: Injuries<br />
Ten leading specific causes of death<br />
Males < 1 year<br />
Ten leading specific causes of death<br />
Females < 1 year<br />
Other perinatal conditions<br />
Other perinatal conditions<br />
Other perinatal respiratory conditions<br />
Other perinatal respiratory conditions<br />
Low birth weight<br />
Low birth weight<br />
Ill-defined natural<br />
Neonatal infections<br />
Birth asphyxia and trauma<br />
1997<br />
2002<br />
Ill-defined natural<br />
Neonatal infections<br />
Birth asphyxia and trauma<br />
1997<br />
2002<br />
Undetermined injuries<br />
Other infectious and parasitic<br />
Cot death<br />
Undetermined injuries<br />
Other endocrine and metabolic<br />
Other endocrine and metabolic<br />
Congenital heart disease<br />
Cot death<br />
0 5 10 15 20 25 30 35 40 45<br />
0 5 10 15 20 25 30 35 40 45<br />
percent of all causes<br />
percent of all causes<br />
Figure 12: Cause of death of infant males and females, aged under-1, <strong>Western</strong> <strong>Cape</strong>, Stats SA 1997 and 2002<br />
135
2.4.2 Children 1-4 years<br />
The number of deaths in children aged 1-4 years is much lower than the infant deaths,<br />
but these too have increased over the period 1997-2002 (Figure 13). Injuries play a<br />
major role in the mortality of male and female children of this age group: in 1997, 41%<br />
of male children aged 1-4 years died from injuries and 32% of female children died of<br />
injuries. Unfortunately most injuries are recorded as “undetermined whether intentional<br />
or unintentional” and this cause ranked as the leading specific cause of death in male and<br />
female children in 1997 and in 2002. Communicable diseases and nutritional deficiencies<br />
(Group 1) are the most common broad cause, accounting for 33% of the total deaths of<br />
male children in 1997 and in 2002, and 44% of the total deaths of female children in<br />
1997 and 46% in 2002. Diarrhoeal diseases, tuberculosis, HIV/AIDS and lower<br />
respiratory infections ranked among the ten leading specific causes of death in both male<br />
and female children aged 1 to 4 in 1997 and 2002. Diarrhoeal diseases ranked second in<br />
males and females in 1997. It is interesting to observe that deaths from this cause<br />
decreased among males from 12% in 1997 to 10% in 2002 but increased among females<br />
from 9% in 1997 to 14% in 2002. This was accompanied by larger increases in the<br />
proportions of deaths from HIV and TB in the males compared with females. There is a<br />
noticeable increase in the proportion of deaths from other endocrine and metabolic<br />
disorders. Deaths certified with “immune-deficiency” as a cause have been coded by<br />
Stats SA to the unspecified immune suppression which falls into this category. Noncommunicable<br />
(Group II) conditions accounted for approximately 17% of male child<br />
deaths and female child deaths in 1997 and in 2002. Protein-energy malnutrition ranked<br />
as one of the ten leading specific causes of death in both sexes in 1997 and also in 2002<br />
accounting for about 3% of male child deaths and about 6% of female child deaths.<br />
Unlike the trend in the all age data, the proportion of deaths due to ill-defined natural<br />
causes in this age group increased between 1997 and 2002. Ill-defined causes accounted<br />
for a higher proportion of male deaths than female deaths among children 1-4 years.<br />
o<br />
o<br />
The number of registered child deaths, aged 1-4 years, increased between<br />
1997 and 2002.<br />
The proportion of injury deaths is high in both male and female children aged<br />
1-4 years. Details on the causes of the injuries are not available as most are<br />
unspecified on the death certificate.<br />
o The proportion of deaths due to infections increased between 1997 and 2002,<br />
as did ill-defined natural causes, and endocrine and metabolic causes.<br />
136
1997 Male deaths 1- 4 years<br />
N = 267<br />
Injuries<br />
40.8%<br />
Ill-defined natural<br />
9.0%<br />
Diarrhoeal<br />
diseases 12.4%<br />
Other group II<br />
16.9%<br />
Tuberculosis<br />
4.1%<br />
Lower respiratory<br />
infections<br />
4.1%<br />
HIV/AIDS 6.4%<br />
Other group I<br />
6.4%<br />
2002 Male deaths 1- 4 years<br />
N = 320<br />
Injuries<br />
28.1%<br />
Ill-defined natural<br />
10.6%<br />
Other group II<br />
9.4%<br />
Diarrhoeal<br />
diseases 10.0%<br />
Endocrine and<br />
metabolic<br />
5.9%<br />
Tuberculosis<br />
7.8%<br />
Lower respiratory<br />
infections<br />
7.5%<br />
HIV/AIDS 9.4%<br />
Other group I<br />
11.3%<br />
1997 Female deaths 1- 4 years<br />
N = 203<br />
Injuries<br />
32.0%<br />
Ill-defined natural<br />
6.9%<br />
Other group II<br />
16.7%<br />
Group I : Communicable,<br />
Maternal, Perinatal, and<br />
Nutritional deficiencies<br />
Group II: Non-communicable<br />
conditions<br />
Diarrhoeal<br />
diseases 8.9%<br />
Tuberculosis<br />
5.9%<br />
Lower respiratory<br />
infections<br />
6.4%<br />
HIV/AIDS 5.9%<br />
Nutritional<br />
deficiencies 5.9%<br />
Other group I<br />
9.9%<br />
Endocrine and<br />
metabolic<br />
1.5%<br />
2002 Female deaths 1- 4 years<br />
N = 272<br />
Injuries<br />
27.9%<br />
Ill-defined natural<br />
7.7%<br />
Diarrhoeal<br />
diseases 13.6%<br />
Other group II<br />
Endocrine and<br />
12.1%<br />
metabolic<br />
5.9%<br />
Tuberculosis<br />
5.1%<br />
Lower respiratory<br />
infections<br />
7.4%<br />
HIV/AIDS 7.4%<br />
Nutritional<br />
deficiencies 6.6%<br />
Other group I<br />
6.3%<br />
Ten leading specific causes of death<br />
Males 1- 4 years<br />
Ill-defined natural (Group I and II)<br />
Group III: Injuries<br />
Ten leading specific causes of death<br />
Females 1- 4 years<br />
Undetermined injuries<br />
Ill-defined natural<br />
Diarrhoeal diseases<br />
HIV/AIDS<br />
Tuberculosis<br />
Lower respiratory infections<br />
Other endocrine and metabolic<br />
Protein-energy malnutrition<br />
Other infectious and parasitic<br />
Bacterial meningitis<br />
0 5 10 15 20 25 30 35 40 45<br />
percent of all causes<br />
1997<br />
2002<br />
Undetermined injuries<br />
Diarrhoeal diseases<br />
Ill-defined natural<br />
Lower respiratory infections<br />
Protein-energy malnutrition<br />
Other endocrine and metabolic<br />
Tuberculosis<br />
Other infectious and parasitic<br />
Bacterial meningitis<br />
0 5 10 15 20 25 30 35 40 45<br />
Figure 13: Cause of death of male and female children aged 1-4 years, <strong>Western</strong> <strong>Cape</strong>, Stats SA 1997 and<br />
2002<br />
HIV/AIDS<br />
percent of all causes<br />
1997<br />
2002<br />
137
2.4.3 Children 5-14 years<br />
For each female death in the age group 5-14 years there are 1.5 male deaths. In 1997<br />
the sex ratio was 1.51 and in 2002 the ratio was 1.48, showing little change.<br />
Deaths as a result of injuries contribute a very large proportion to the total number of<br />
deaths of children aged 5 to 14 years. Among males, 69% of the total deaths in 1997<br />
were due to injuries, and 52% among females (Figure 14). The vast majority of deaths in<br />
this age group were undetermined injuries, which ranked as the leading specific cause of<br />
death in both males and females in 1997 and in 2002.<br />
Deaths due to infections and nutritional conditions (Group I) increased considerably in<br />
this age group from 1997 to 2002. In 1997, Group I conditions accounted for 6% of the<br />
total deaths among male children aged 5-14, and 10% among females. By 2002 this had<br />
increased to 29% of male deaths and 18% of female. Tuberculosis, HIV/AIDS and lower<br />
respiratory infections were among the Group I conditions that increased from 1997 to<br />
2002 ranking among the ten leading specific causes of death in this age group. Injury<br />
deaths (Group II) accounted for 22% of deaths in males in 1997 and 28% in 2002. In<br />
females injuries accounted for 32% of deaths in 1997 and 33% in 2002. Ill-defined<br />
natural causes contributed from 3% to 6% of the total deaths in male and female<br />
children aged 5 to 14 in 1997 and 2002.<br />
o<br />
o<br />
The proportion of deaths due to injuries is high in both male and female<br />
children aged 5-14 years.<br />
Deaths from infections increased rapidly between 1997 and 2002; specifically<br />
TB, HIV/AIDS and lower respiratory infections.<br />
138
1997 Male deaths 5-14 years<br />
N = 296<br />
2002 Male deaths 5-14 years<br />
N = 340<br />
1997 Female deaths 5-14 years<br />
N = 196<br />
2002 Female deaths 5-14 years<br />
N = 234<br />
Tuberculosis<br />
1.0% Other group I<br />
4.7%<br />
Group II<br />
21.6%<br />
Tuberculosis<br />
6.2%<br />
Other group I<br />
11.2%<br />
Tuberculosis<br />
1.5% Other group I<br />
8.2%<br />
Tuberculosis<br />
3.8%<br />
Other group I<br />
12.4%<br />
Injuries<br />
69.3%<br />
Ill-defined<br />
natural<br />
3.4%<br />
Injuries<br />
52.4%<br />
Group II<br />
27.6%<br />
Injuries<br />
52.6%<br />
Group II<br />
31.6%<br />
Injuries<br />
48.3%<br />
Group II<br />
32.5%<br />
Ill-defined<br />
natural<br />
2.6%<br />
Group I : Communicable,<br />
Maternal, Perinatal, and<br />
Nutritional deficiencies<br />
Ill-defined<br />
natural<br />
6.1%<br />
Ill-defined<br />
natural<br />
3.0%<br />
Group II: Non-communicable<br />
conditions<br />
Ill-defined natural (Group I and II)<br />
Ten leading specific causes of death<br />
Males 5-14 years<br />
Group III: Injuries<br />
Ten leading specific causes of death<br />
Females 5-14 years<br />
Undetermined injuries<br />
Tuberculosis<br />
Other endocrine and metabolic<br />
Undetermined injuries<br />
Road traffic accidents<br />
Ill-defined cardiovascular<br />
Diarrhoeal diseases<br />
Other nervous system disorders<br />
Ill-defined natural<br />
1997<br />
2002<br />
Lower respiratory infections<br />
Tuberculosis<br />
HIV/AIDS<br />
1997<br />
2002<br />
Asthma<br />
Ill-defined natural<br />
Benign neoplasms<br />
Other nervous system disorders<br />
Epilepsy<br />
Leukaemia<br />
Bacterial meningitis<br />
Benign neoplasms<br />
0 10 20 30 40 50 60 70<br />
percent of all causes<br />
0 10 20 30 40 50 60 70<br />
percent of all causes<br />
Figure 14: Cause of death of male and female children aged 5-14 years, <strong>Western</strong> <strong>Cape</strong>,<br />
Stats SA 1997 and 2002<br />
139
2.4.4 Adults 15-29 years<br />
Death due to injury is a major cause of mortality in young males aged 15-29 years<br />
(Figure 15). In 1997, 82% of the total males deaths in this age group were due to<br />
injuries, while the figure for females was 49%. Homicide, road traffic accidents and illdefined<br />
accidents ranked among the ten leading specific causes of death. Undetermined<br />
injuries ranked as the leading cause of death in males of this age group.<br />
Deaths due to Group I conditions (communicable diseases, maternal and nutritional<br />
conditions) increased among both sexes from 1997 to 2002. The numbers were much<br />
higher and increased to a larger extent among females. Group I deaths in females<br />
increased from 29% in 1997 to 52% in 2002, mostly due to an increase in deaths from<br />
tuberculosis and HIV/AIDS. Tuberculosis deaths among females increased from 12% to<br />
22% during this time period and 4.7% to 9.2% among males. Deaths recorded as<br />
HIV/AIDS deaths accounted for 13% of the total deaths in females aged 15-29 in 2002;<br />
this was up from 8% in 1997. HIV/AIDS is under-recorded on death certificates with a<br />
tendency to certify the indicator conditions only. Males of this age group died from<br />
HIV/AIDS at 3.3% in 2002; up from 1.1% in 1997. Six of the ten leading causes of<br />
death in females were from the Group I category; five of the leading ten in males.<br />
Among these were tuberculosis, HIV/AIDS and lower respiratory infections.<br />
Non-communicable (Group II) contributed 8% to the total mortality of males aged 15 to<br />
29 years in 1997 and 10% in 2002. Among females these figures were 18% and 19%<br />
respectively. Ill-defined natural causes contributed from 2.6% to 4.6% to the total<br />
deaths of each sex in 1997 and 2002.<br />
o<br />
o<br />
Deaths from Group I conditions increased in the 15-29 age group, especially<br />
among females, due to increases in deaths from HIV/AIDS, TB and lower<br />
respiratory infections.<br />
Injuries deaths are very high in males in the 15-29 year age group.<br />
140
1997 Male deaths 15-29 years<br />
N = 2 447<br />
Tuberculosis<br />
HIV/AIDS<br />
4.7%<br />
1.1%<br />
Other Group I<br />
1.5%<br />
Group II<br />
8.2%<br />
2002 Male deaths 15-29 years<br />
N = 3 233<br />
Tuberculosis<br />
9.2%<br />
HIV/AIDS<br />
3.3%<br />
Other Group I<br />
4.5%<br />
1997 Female deaths 15-29 years<br />
N = 963<br />
Tuberculosis<br />
12.3%<br />
HIV/AIDS<br />
8.0%<br />
2002 Female deaths 15-29 years<br />
N = 1 790<br />
Injuries<br />
25.8%<br />
Tuberculosis<br />
22.1%<br />
Injuries<br />
81.6%<br />
Ill-defined<br />
natural<br />
2.9%<br />
Injuries<br />
70.8%<br />
Group II<br />
9.6%<br />
Ill-defined<br />
natural<br />
2.6%<br />
Injuries<br />
48.5%<br />
Group I : Communicable,<br />
Maternal, Perinatal, and<br />
Nutritional deficiencies<br />
Ill-defined<br />
natural<br />
4.6%<br />
Other Group I<br />
8.6%<br />
Group II<br />
18.1%<br />
Ill-defined<br />
natural<br />
3.2%<br />
Group II<br />
19.4%<br />
HIV/AIDS<br />
12.8%<br />
Other Group I<br />
16.7%<br />
Group II: Non-communicable<br />
conditions<br />
Ten leading specific causes of death<br />
Males 15-29 years<br />
Ill-defined natural (Group I and II)<br />
Group III: Injuries<br />
Ten leading specific causes of death<br />
Females 15-29 years<br />
Undetermined injuries<br />
Tuberculosis<br />
Homicide<br />
HIV/AIDS<br />
Ill-defined natural<br />
Road traffic accidents<br />
1997<br />
2002<br />
Tuberculosis<br />
Undetermined injuries<br />
HIV/AIDS<br />
Other infectious and parasitic<br />
Other endocrine and metabolic<br />
Lower respiratory infections<br />
1997<br />
2002<br />
Ill-defined accidents<br />
Ill-defined natural<br />
Lower respiratory infections<br />
Diarrhoeal diseases<br />
Other infectious and parasitic<br />
Ill-defined cardiovascular<br />
Other endocrine and metabolic<br />
Epilepsy<br />
0 10 20 30 40 50 60 70 80 90<br />
percent of all causes<br />
0 10 20 30 40 50 60 70 80 90<br />
percent of all causes<br />
Figure 15: Cause of death of males and females aged 15-29 years, <strong>Western</strong> <strong>Cape</strong>, Stats SA 1997 and 2002<br />
141
2.4.5 Adults 30-44 years<br />
Deaths due to the communicable diseases and maternal and nutritional conditions (Group<br />
I) increased among adults aged 30 to 44 years from 1997 to 2002, more so among<br />
females. In males, deaths from Group I conditions increased from 18% in 1997 to 35 %<br />
in 2002, in females the increase was from 24 % to 45%. Tuberculosis and HIV/AIDS<br />
ranked high among the ten leading specific causes of death in both males and females,<br />
five of the ten causes were from Group I conditions in both sexes.<br />
Non-communicable diseases begin to make a considerable contribution to mortality by<br />
the ages of 30 to 44 years, particularly among females. In 1997 deaths from Group II<br />
conditions contributed 28% to the total deaths among males and 25 % in 2002. Among<br />
females, the figures were 42% and 36%. Stroke and ischaemic heart disease ranked<br />
among the ten leading specific causes of death in males; and stroke, breast cancer and<br />
Diabetes mellitus, in females.<br />
Injury deaths continue to make a substantial contribution to mortality in males of this<br />
age group with 49% of the total deaths in 1997 and 35% in 2002. Deaths from illdefined<br />
natural causes contributed from 5.3% to 7.1% to the total deaths of each sex in<br />
1997 and 2002.<br />
o<br />
Deaths due to Group I conditions increased from 1997 to 2002 among both<br />
sexes, but more so among females. The increase occurred in HIV/AIDS, TB,<br />
other infections and lower respiratory infections. There was a parallel<br />
increase in other endocrine and metabolic disorders.<br />
o Death from injuries continues to be high in males aged 30 to 44.<br />
142
1997 Male deaths 30-44 years<br />
N = 3 367<br />
2002 Male deaths 30-44 years<br />
N = 5 110<br />
1997 Female deaths 30-44 years<br />
N = 1 667<br />
2002 Female deaths 30-44 years<br />
N = 3 082<br />
Injuries<br />
48.7%<br />
Tuberculosis<br />
11.4%<br />
Ill-defined<br />
natural<br />
5.6%<br />
HIV/AIDS<br />
3.0%<br />
Other Group I<br />
3.3%<br />
Group II<br />
28.0%<br />
Injuries<br />
34.6%<br />
Ill-defined<br />
natural<br />
5.3%<br />
Group II<br />
25.1%<br />
Tuberculosis<br />
20.4%<br />
HIV/AIDS<br />
6.8%<br />
Other Group I<br />
7.7%<br />
Injuries<br />
26.9%<br />
Ill-defined<br />
natural<br />
7.1%<br />
Group I : Communicable,<br />
Maternal, Perinatal, and<br />
Nutritional deficiencies<br />
Other group II<br />
16.0%<br />
Malignant<br />
neoplasms<br />
14.1%<br />
Tuberculosis<br />
12.7%<br />
HIV/AIDS<br />
6.1%<br />
Other Group I<br />
5.6%<br />
Cardiovascular<br />
11.4%<br />
Ill-defined<br />
natural<br />
4.5%<br />
Other group II<br />
17.8%<br />
Malignant<br />
neoplasms<br />
9.6%<br />
Injuries<br />
14.0%<br />
\<br />
Cardiovascular<br />
9.0%<br />
Tuberculosis<br />
20.2%<br />
HIV/AIDS<br />
11.6%<br />
Other Group I<br />
13.3%<br />
Group II: Non-communicable<br />
conditions<br />
Ill-defined natural (Group I and II)<br />
Group III: Injuries<br />
Ten leading specific causes of death<br />
Males 30- 44 years<br />
Ten leading specific causes of death<br />
Females 30- 44 years<br />
Undetermined injuries<br />
Tuberculosis<br />
Tuberculosis<br />
Undetermined injuries<br />
HIV/AIDS<br />
HIV/AIDS<br />
Ill-defined natural<br />
Homicide<br />
Other endocrine and metabolic<br />
1997<br />
2002<br />
Other endocrine and metabolic<br />
Other infectious and parasitic<br />
Ill-defined natural<br />
1997<br />
2002<br />
Other infectious and parasitic<br />
Lower respiratory infections<br />
Lower respiratory infections<br />
Stroke<br />
Stroke<br />
Breast cancer<br />
Ischaemic heart disease<br />
Diabetes mellitus<br />
0 10 20 30 40 50 60 70<br />
0 10 20 30 40 50 60 70<br />
percent of all causes<br />
percent of all causes<br />
Figure 16: Cause of death of males and females aged 30-44 years, <strong>Western</strong> <strong>Cape</strong>, Stats SA 1997 and 2002<br />
143
2.4.6 Adults 45-59 years<br />
Non-communicable diseases (Group II) contribute the majority of deaths by the ages of<br />
45 to 59 years (Figure 17). <strong>Mortality</strong> profiles in 1997 were quite similar to those in 2002,<br />
but profiles of males differ from profiles of females. Non-communicable diseases<br />
accounted for approximately 61% of the total deaths of males of this age group and 72%<br />
of females. Deaths from cardiovascular diseases accounted for approximately 15% of the<br />
total number of deaths in both sexes in 1997 and in 2002; malignant neoplasms<br />
accounted for 14% to 23%; respiratory diseases accounted for approximately 7% and<br />
other non-communicable diseases accounted for 9% to 12% of the total. Of the leading<br />
specific causes of death in this age group, eight of ten were non-communicable<br />
conditions. Death due to ischaemic heart disease, trachea/bronchial/lung cancer, stroke<br />
and Diabetes mellitus were common to both sexes. Chronic obstructive pulmonary<br />
disease (COPD) and chirrhosis of the liver ranked among the leading specific causes of<br />
death for males. Breast cancer and ill-defined cardiovascular ranked among females.<br />
Deaths due to communicable diseases and maternal and nutritional conditions (Group I)<br />
increased from 1997 to 2002 in both sexes. Tuberculosis deaths in males increased from<br />
9.5% of the total in 1997 to 14.4% in 2002. In females, tuberculosis deaths accounted<br />
for 5.7% of the total deaths in 1997, increasing to 8.9% in 2002. Tuberculosis ranked<br />
second to Diabetes mellitus as a leading specific cause of death in this age category in<br />
2002.<br />
Injury deaths contributed just under 20% of the total deaths among males aged 45 to 59<br />
in 1997 and in 2002, approximately twice that of females. Injuries of undetermined<br />
cause ranked as the leading specific cause of death in males in 1997 and the second<br />
leading cause, after tuberculosis, in 2002.<br />
o Non-communicable diseases contribute the majority of deaths at ages 45-59<br />
years, accounting for 61% of male deaths and 72% of male deaths.<br />
o<br />
o<br />
Group I conditions increased from 1997 to 2002, with TB ranking very high.<br />
Twice as many males aged 45-59 died from injuries than females.<br />
144
1997 Male deaths 45-59 years<br />
N = 3 903<br />
Ill-defined<br />
natural<br />
7.1%<br />
Injuries<br />
17.6%<br />
Other group II<br />
15.6%<br />
Malignant<br />
neoplasms<br />
18.3%<br />
Tuberculosis<br />
9.5%<br />
Other Group I<br />
4.0%<br />
Respiratory<br />
diseases<br />
7.2%<br />
Ischaemic heart<br />
disease<br />
8.6%<br />
Other<br />
cardiovascular<br />
12.3%<br />
2002 Male deaths 45-59 years<br />
N = 5 139<br />
Other group II<br />
15.1%<br />
Injuries<br />
14.3%<br />
Ill-defined<br />
natural<br />
5.4%<br />
Malignant<br />
neoplasms<br />
16.2%<br />
Tuberculosis<br />
14.4%<br />
Other Group I<br />
7.4%<br />
Ischaemic heart<br />
disease<br />
8.6%<br />
1997 Female deaths 45-59 years<br />
N = 2 386<br />
Ill-defined<br />
natural<br />
5.9%<br />
Other group II<br />
18.2%<br />
Other<br />
cardiovascular<br />
Respiratory 10.9%<br />
diseases<br />
7.7%<br />
Group I : Communicable,<br />
Maternal, Perinatal, and<br />
Nutritional deficiencies<br />
Tuberculosis<br />
Injuries<br />
5.9%<br />
9.3% Other Group I<br />
5.6%<br />
Malignant<br />
neoplasms<br />
23.3%<br />
Stroke<br />
7.8%<br />
Other<br />
cardiovascular<br />
17.1%<br />
Respiratory<br />
diseases<br />
7.0%<br />
2002 Female deaths 45-59 years<br />
N = 3 083<br />
Other group II<br />
19.8%<br />
Ill-defined<br />
natural<br />
5.0%<br />
Malignant<br />
neoplasms<br />
21.5%<br />
Injuries<br />
7.0%<br />
Tuberculosis<br />
8.9%<br />
Other Group I<br />
9.0%<br />
Stroke<br />
8.4%<br />
Other<br />
cardiovascular<br />
13.6%<br />
Respiratory<br />
diseases<br />
6.7%<br />
Group II: Non-communicable<br />
conditions<br />
Ill-defined natural (Group I and II)<br />
Group III: Injuries<br />
Ten leading specific causes of death<br />
Males 45-59 years<br />
Ten leading specific causes of death<br />
Females 45-59 years<br />
Tuberculosis<br />
Diabetes mellitus<br />
Undetermined injuries<br />
Tuberculosis<br />
Ischaemic heart disease<br />
Stroke<br />
Ill-defined natural<br />
Trachea/bronchi/lung cancer<br />
Stroke<br />
1997<br />
2002<br />
Ischaemic heart disease<br />
Undetermined injuries<br />
Ill-defined natural<br />
1997<br />
2002<br />
Chronic obstructive pulmonary disease<br />
Breast cancer<br />
Diabetes mellitus<br />
Chronic obstructive pulmonary disease<br />
Ill-defined cardiovascular<br />
Trachea/bronchi/lung cancer<br />
Chirrhosis of liver<br />
Ill-defined cardiovascular<br />
0 2 4 6 8 10 12 14 16 18<br />
percent of all causes<br />
0 2 4 6 8 10 12 14 16 18<br />
percent of all causes<br />
Figure 17: Cause of death of males and females aged 45-59 years, <strong>Western</strong> <strong>Cape</strong>, Stats SA 1997 and 2002<br />
145
2.4.7 Adults 60+ years<br />
<strong>Mortality</strong> profiles changed very little from 1997 to 2002 in the over 60 age group. Profiles<br />
for males and females were similar. Non-communicable diseases (Group II) contribute<br />
the vast majority of deaths in persons aged 60 years and older (Figure 18). In 1997,<br />
80% of the total deaths among males of this age group, and 81% of females, was due to<br />
Group II conditions. The percentages were very similar in 2002 at 83% for males and<br />
82% for females. Deaths due to communicable diseases and maternal and nutritional<br />
conditions (Group I) contributed approximately 9% to the total number of deaths in<br />
males and in females in 1997 and 2002; ill-defined natural causes contributed between<br />
3% to 6%; injuries contributed less than 6%. Of Group II conditions, cardiovascular<br />
disease contributed approximately 33% of the total deaths in males in 1997 and 2002<br />
and approximately 38% of females in both years. Malignant neoplasms accounted for<br />
22% of the total male deaths in 1997 and 2002 and 16% of female deaths in 1997 and<br />
2002.<br />
Stroke ranked as the leading specific cause of death in females over 60 in 1997 and in<br />
2002. Ischaemic heart disease, and ill defined cardiovascular disease ranked among the<br />
ten leading specific causes, along with Diabetes mellitus, chronic obstructive pulmonary<br />
disease (COPD), trachea/bronchial/lung cancer, and ill-defined natural causes. The ten<br />
leading causes were similar for males but with a slightly different order of ranking.<br />
Ischaemic heart disease was ranked as the leading cause of death in males, and while<br />
tuberculosis, undetermined injuries and prostate cancer ranked among the leading ten<br />
specific leading causes in males, hypertensive heart disease, lower respiratory tract<br />
infections and ill-defined cancers ranked among females.<br />
o Very little change in mortality profiles from 1997 to 2002 for persons aged 60<br />
and over, with similar profiles for males and females.<br />
o<br />
o<br />
More than 80% of deaths were due to non-communicable diseases.<br />
Cardiovascular diseases accounted for over 1/3 of the total deaths in males<br />
and females over 60.<br />
146
1997 Male deaths 60+ years<br />
N = 7 617<br />
Ill-defined<br />
natural<br />
6.3%<br />
Other group II<br />
9.9%<br />
Diabetes<br />
mellitus<br />
6.2%<br />
Malignant<br />
neoplasms<br />
21.6%<br />
Injuries<br />
4.8%<br />
Respiratory<br />
diseases<br />
10.7%<br />
Group I<br />
conditions<br />
8.0%<br />
Ischaemic heart<br />
disease<br />
12.0%<br />
Stroke<br />
8.7%<br />
Other<br />
cardiovascular<br />
11.9%<br />
2002 Male deaths 60+ years<br />
N = 9 004<br />
Other group II<br />
10.1%<br />
Diabetes<br />
mellitus<br />
7.1%<br />
Ill-defined<br />
natural<br />
5.3%<br />
Malignant<br />
neoplasms<br />
20.7%<br />
Injuries<br />
4.2%<br />
Group I<br />
conditions<br />
9.7%<br />
Ischaemic heart<br />
disease<br />
12.0%<br />
Respiratory<br />
diseases<br />
10.4%<br />
Stroke<br />
10.4%<br />
Other<br />
cardiovascular<br />
10.2%<br />
1997 Female deaths 60+ years<br />
N = 7 652<br />
Other group II<br />
10.3%<br />
Diabetes<br />
mellitus<br />
11.8%<br />
Group I : Communicable,<br />
Maternal, Perinatal, and<br />
Nutritional deficiencies<br />
Group II: Non-communicable<br />
conditions<br />
Ill-defined<br />
natural<br />
Injuries<br />
3.3%<br />
Group I<br />
conditions<br />
7.2%<br />
6.7% Ischaemic heart<br />
disease<br />
10.1%<br />
Malignant<br />
neoplasms<br />
15.6%<br />
Stroke<br />
12.2%<br />
Other<br />
cardiovascular<br />
Respiratory 16.9%<br />
diseases<br />
6.0%<br />
2002 Female deaths 60+ years<br />
N = 9 327<br />
Other group II<br />
10.9%<br />
Diabetes<br />
mellitus<br />
11.9%<br />
Ill-defined<br />
natural<br />
5.8%<br />
Malignant<br />
neoplasms<br />
16.4%<br />
Injuries<br />
3.0%<br />
Respiratory<br />
diseases<br />
6.1%<br />
Group I<br />
conditions<br />
8.6%<br />
Ischaemic heart<br />
disease<br />
10.0%<br />
Stroke<br />
12.9%<br />
Other<br />
cardiovascular<br />
14.3%<br />
Ill-defined natural (Group I and II)<br />
Ten leading specific causes of death<br />
Males 60+ years<br />
Group III: Injuries<br />
Ten leading specific causes of death<br />
Females 60+ years<br />
Ischaemic heart disease<br />
Stroke<br />
Stroke<br />
Diabetes mellitus<br />
Chronic obstructive pulmonary disease<br />
Ischaemic heart disease<br />
Diabetes mellitus<br />
Ill-defined natural<br />
Trachea/bronchi/lung cancer<br />
Ill-defined cardiovascular<br />
1997<br />
2002<br />
Ill-defined cardiovascular<br />
Ill-defined natural<br />
Hypertensive heart disease<br />
Chronic obstructive pulmonary disease<br />
1997<br />
2002<br />
Tuberculosis<br />
Lower respiratory infections<br />
Undetermined injuries<br />
Trachea/bronchi/lung cancer<br />
Prostate cancer<br />
Ill-defined (cancers)<br />
0 2 4 6 8 10 12 14<br />
percent of all causes<br />
0 2 4 6 8 10 12 14<br />
percent of all causes<br />
Figure 18: Cause of death of males and females aged 60+ years, <strong>Western</strong> <strong>Cape</strong>, Stats SA 1997 and 2002<br />
147
2.5 Years of life lost (YLLs)<br />
Years of life lost (YLLs) are an important measure of premature mortality as the age<br />
of death is taken into account. The original GBD studies and the SA NBD studies<br />
made use of age weighting in the calculation of the YLLs by valuing a year of life in<br />
the middle age range higher than those at very young age and old age. However,<br />
increasing questions on the justification for age weighting has seen the WHO decide<br />
not to use age weighting in the calculations of YLLs and DALYs (WHO 2005 Statistics<br />
Report). The <strong>Western</strong> <strong>Cape</strong> death data can be investigated to assess what impact age<br />
weighting and discounting have on the estimates of YLLs in the South African context.<br />
YLLs calculated with each combination of age weighting and discounting are compared<br />
with YLLs calculated with no age weighting and no discounting are shown in Figure 19.<br />
This shows the strong correlation between the YLLs calculated with age weighting and<br />
without and clearly indicates that the broad ranking of causes will not change with the<br />
use of age weighting or without. However, as seen in Table 3, the detailed ranking of<br />
the leading 10 causes can be affected by the use of discounting in particular.<br />
o<br />
o<br />
o<br />
Age weighting makes little difference at a broad level when ranking the<br />
causes of years of life lost (YLLs).<br />
However, depending on the underlying age distribution of deaths,<br />
discounting can make a substantial difference to the ranking of leading<br />
causes of death by reducing childhood conditions and emphasizing<br />
conditions of middle and older ages.<br />
Serious consideration should be given to the question of age weighting<br />
and discounting in the calculation of YLLs and DALYs if these measures are<br />
to be used for decision making.<br />
YLLs no discounting / age weighting<br />
1000000<br />
100000<br />
10000<br />
1000<br />
100<br />
10<br />
1<br />
1 10 100 1000 10000 100000 1000000<br />
148<br />
Age weighting only<br />
Males R 2 = 0.9952<br />
Females R 2 = 0.9828<br />
Males<br />
Females<br />
YLLs no discounting / no age weighting
Discounting only<br />
1000000<br />
YLLs discounting / no age weighting<br />
100000<br />
10000<br />
1000<br />
100<br />
10<br />
1<br />
Males R 2 = 0.9893<br />
Females R 2 = 0.968<br />
Males<br />
Females<br />
1 10 100 1000 10000 100000 1000000<br />
YLLs no discounting / no age weighting<br />
1000000<br />
Age weighting and discounting<br />
YLLs discounting / age weighting<br />
100000<br />
10000<br />
1000<br />
100<br />
10<br />
1<br />
Males R 2 = 0.9971<br />
Females R 2 = 0.993<br />
Males<br />
Females<br />
1 10 100 1000 10000 100000 1000000<br />
YLLs no discounting / no age weighting<br />
Figure 19: Years of life lost comparing the use of age weighting and<br />
discounting, <strong>Western</strong> <strong>Cape</strong>, Stats SA, 2002<br />
149
Table 3 shows the ranking of the causes of death in 2002 based on YLLs calculated<br />
with age weights and without. It can be seen that TB ranks the top by a long margin,<br />
regardless of weighting. However, for other conditions that each account for much<br />
more similar proportions of the years of life lost, there are substantial changes in the<br />
actual position in the ranking. Discounting tends to increase the burden of conditions<br />
affecting middle to older ages, and decreases the burden of conditions affecting<br />
younger ages. The category, other perinatal conditions drops substantially in rank for<br />
both males and females, while Diabetes mellitus, stroke and ischaemic heart disease<br />
have a substantially higher ranking for females. Age weighting on the other hand does<br />
not have a major impact on the ranking. It is interesting to note the different impact<br />
for males and females, which arises from the underlying age distribution of deaths.<br />
This suggests that the impact of discounting is particularly sensitive to the age<br />
distribution of deaths.<br />
The ten leading specific causes of YLLs are shown in Figure 20 for 1997 and 2002.<br />
YLLs were calculated without age weighting and without discounting. As with ranking<br />
by percentage of total deaths in Figures 10 and 11, the leading condition for males in<br />
both years was undetermined injuries. Furthermore, years of life lost due to Group I<br />
conditions increased in both males and females from 1997 to 2002. But ranking by<br />
YLLs places more emphasis on Group I conditions by ranking many of them higher as<br />
compared to percentage of total deaths. Among females, HIV/AIDS ranked as the 3 rd<br />
leading contributor to YLLs in 2002 but the 8 th leading cause of death in that year.<br />
Tuberculosis was the second leading cause of death in both males and females in<br />
2002 and the leading cause of years of life lost in females. The cause called other<br />
perinatal conditions did not rank among the leading 10 causes of death in 1997 or<br />
2002 but ranked 2 nd in YLLs in females, 3 rd in males in 1997, and 4 th in both sexes in<br />
2002.<br />
Most group II conditions moved down in importance in YLLs as compared to<br />
percentage of total deaths. Most dramatically, stroke was ranked as the leading cause<br />
of death in females in 2002 but 7 th in YLLs in that year. Stroke, ischaemic heart<br />
disease, Diabetes mellitus and ill-defined cardiovascular moved down in ranking in<br />
YLLs as compared to percentage of total deaths in males also, as did COPD.<br />
150
Table 3: Leading 10 causes of deaths and years of life lost calculated with and without age weighting for males and<br />
females, <strong>Western</strong> <strong>Cape</strong>, Stats SA, 2002<br />
Males 2002<br />
Deaths % no discounting, no age weighting % 3% discounting only %<br />
1 Undetermined injuries 18.2 Undetermined injuries 25.9 Undetermined injuries 23.7<br />
2 Tuberculosis 10.2 Tuberculosis 11.2 Tuberculosis 11.6<br />
3 Ischaemic heart disease 6.7 Ill-defined natural 5.0 Ill-defined natural 5.0<br />
4 Stroke 5.5 Other perinatal 4.7 Ischaemic heart disease 4.7<br />
5 Ill-defined natural 5.2 Ischaemic heart disease 3.7 Stroke 3.8<br />
6 Chronic obstructive pulmonary disease 4.1 HIV/AIDS 3.4 HIV/AIDS 3.3<br />
7 Diabetes mellitus 3.7 Stroke 3.0 Other perinatal 3.2<br />
8 Trachea/bronchi/lung cancer 3.2 Chronic obstructive pulmonary disease 2.4 Chronic obstructive pulmonary disease 3.0<br />
9 HIV/AIDS 2.5 Other endocrine and metabolic 2.1 Diabetes mellitus 2.6<br />
10 Lower respiratory infections 2.5 Other perinatal respiratory conditions 2.1 Trachea/bronchi/lung cancer 2.4<br />
age weighting only % 3% discounting plus age weighting %<br />
1 Undetermined injuries 28.4 Undetermined injuries 27.6<br />
2 Tuberculosis 11.0 Tuberculosis 11.8<br />
3 Other perinatal 5.5 Ill-defined natural 4.9<br />
4 Ill- defined natural 5.0 Other perinatal 3.7<br />
5 HIV/AIDS 3.6 Ischaemic heart disease 3.6<br />
6 Ischaemic heart disease 2.9 HIV/AIDS 3.6<br />
7 Stroke 2.4 Stroke 3.0<br />
8 Other perinatal respiratory conditions 2.4 Chronic obstructive pulmonary disease 2.3<br />
9 Other endocrine and metabolic 2.2 Other endocrine and metabolic 2.1<br />
10 Homicide 2.1 Homicide 2.1<br />
151
Females 2002<br />
Deaths % no discounting, no age weighting % 3% discounting only %<br />
1 Stroke 8.3 Tuberculosis 11.1 Tuberculosis 10.7<br />
2 Tuberculosis 8.0 Undetermined injuries 10.3 Undetermined injuries 9.1<br />
3 Diabetes mellitus 7.9 HIV/AIDS 6.1 Diabetes mellitus 6.2<br />
4 Undetermined injuries 6.5 Other perinatal 5.4 Stroke 5.9<br />
5 Ischaemic heart disease 6.1 Ill-defined natural 5.0 HIV/AIDS 5.5<br />
6 Ill-defined natural 5.4 Diabetes mellitus 4.9 Ill-defined natural 4.9<br />
7 Ill-defined cardiovascular 4.5 Stroke 4.7 Ischaemic heart disease 4.0<br />
8 HIV/AIDS 3.7 Other endocrine and metabolic 3.9 Other endocrine and metabolic 3.7<br />
9 Lower respiratory infections 3.3 Other infectious and parasitic 3.3 Other perinatal 3.6<br />
10 Other endocrine and metabolic 3.0 Ischaemic heart disease 3.0 Lower respiratory infections 3.0<br />
age weighting only % 3% discounting plus age weighting %<br />
1 Tuberculosis 11.8 Tuberculosis 12.1<br />
2 Undetermined injuries 11.6 Undetermined injuries 11.0<br />
3 HIV/AIDS 6.8 HIV/AIDS 6.7<br />
4 Other perinatal 6.5 Ill-defined natural 4.8<br />
5 Ill-defined natural 5.0 Diabetes mellitus 4.8<br />
6 Other endocrine and metabolic 4.2 Stroke 4.6<br />
7 Diabetes mellitus 3.8 Other perinatal 4.3<br />
8 Other infectious and parasitic 3.7 Other endocrine and metabolic 4.1<br />
9 Stroke 3.7 Other infectious and parasitic 3.5<br />
10 Lower respiratory infections 3.0 Lower respiratory infections 3.0<br />
152
Males, 1997<br />
Males, 2002<br />
Undetermined injuries<br />
Tuberculosis<br />
Other perinatal<br />
Ill-defined natural<br />
Ischaemic heart disease<br />
Stroke<br />
Trachea/bronchi/lung cancer<br />
Chronic obstructive pulmonary disease<br />
Ill-defined cardiovascular<br />
Diabetes mellitus<br />
Undetermined injuries<br />
Tuberculosis<br />
Ill-defined natural<br />
Other perinatal<br />
Ischaemic heart disease<br />
HIV/AIDS<br />
Stroke<br />
Chronic obstructive pulmonary disease<br />
Other endocrine and metabolic<br />
Other perinatal respiratory conditions<br />
0 5 10 15 20 25 30 35 40 45<br />
Percent of total YLLS<br />
0 5 10 15 20 25 30 35 40 45<br />
Percent of total YLLS<br />
Females, 1997<br />
Females, 2002<br />
Undetermined injuries<br />
Other perinatal<br />
Tuberculosis<br />
Ill-defined natural<br />
Diabetes mellitus<br />
Stroke<br />
Ischaemic heart disease<br />
Ill-defined cardiovascular<br />
HIV/AIDS<br />
Other perinatal respiratory conditions<br />
Tuberculosis<br />
Undetermined injuries<br />
HIV/AIDS<br />
Other perinatal<br />
Ill-defined natural<br />
Diabetes mellitus<br />
Stroke<br />
Other endocrine and metabolic<br />
Other infectious and parasitic<br />
Ischaemic heart disease<br />
0 5 10 15 20 25<br />
Percent of total YLLS<br />
0 5 10 15 20 25<br />
Percent of total YLLS<br />
Figure 20: Leading causes of years of life lost for males and females all ages calculated without age weighting or<br />
discounting, <strong>Western</strong> <strong>Cape</strong>, Stats SA, 1997 and 2002<br />
153
Discussion<br />
Examination of the cause of death data for the <strong>Western</strong> <strong>Cape</strong> from 1997 to 2002 has<br />
revealed several data quality issues. Comparison with the ASSA2003 model suggests<br />
that the registration of deaths in this province is reasonably high and that it has<br />
remained so over the period. While the ASSA model is well-calibrated to empirical<br />
adult mortality data, there has been less scope for this to be done in the case of<br />
children. The differences seen in the trends of the various sources of data used in this<br />
report suggest that the model is currently not as robust for children. There still<br />
remains uncertainty about the levels of registration of child and infant deaths and this<br />
needs further investigation.<br />
Compared with the national situation, there is a lower proportion of deaths from illdefined<br />
conditions in general but a higher proportion of deaths from ill-defined<br />
cardiovascular causes. The low proportion of HIV/AIDS deaths when compared to the<br />
ASSA model is partly due to a strict coding practice by Statistics South Africa whereby<br />
HIV or AIDS is only coded if explicitly stated as such on the death certificate. It is also<br />
lower because the HIV status of the deceased may be unknown or the full details of<br />
the cause of death are not provided by the certifier. The Stats SA data does not<br />
provide insight into the causes of injuries as only some of the death notifications<br />
provide details on the manner of death as a result of the requirements of the Inquest<br />
Act. These deficiencies in the cause of death data therefore need to be taken into<br />
account when estimating death rates for the province and highlight the importance of<br />
the National Injury <strong>Mortality</strong> <strong>Surveillance</strong> that has been established at sentinel<br />
mortuaries to collect statistics on the manner of injury deaths.<br />
Nonetheless, this analysis has revealed much about the mortality in the province. It is<br />
clear that the mortality profile is somewhat difference from the national profile. The<br />
<strong>Western</strong> <strong>Cape</strong> also experiences the quadruple burden that has been described as the<br />
combination of pre-transitional conditions related to under-development, noncommunicable<br />
diseases, injuries and HIV/AIDS. However, this data shows that the<br />
HIV/AIDS epidemic is at a lower scale than in other provinces and that injuries and<br />
non-communicable diseases are more pronounced.<br />
There are pronounced gender differences in the registered deaths. There are<br />
consistently more male deaths than females, although the province has more females<br />
than males. Child mortality is generally higher for males than for females and can be<br />
seen in the <strong>Western</strong> <strong>Cape</strong> data also. In the age groups over 5 years, the high injury<br />
burden contributes substantially to the higher numbers of male deaths. However, in<br />
1997, there was also a consistently higher number of male deaths from natural causes<br />
across all ages. This appears to be a result of the higher number of TB deaths among<br />
males as well as cardiovascular and respiratory causes which would be related to the<br />
higher tobacco and alcohol use among males. Over the period of 1997 to 2002, there<br />
was a rapid increase in the number of young adult deaths between 20 and 59 in males<br />
and 15 and 49 in females, resulting from increases in HIV/AIDS and related<br />
conditions. By 2002, the number of natural deaths among women aged 20- 29 years<br />
exceeded the number of deaths among males. In the 60+ age group the numbers of<br />
male and female deaths are similar, but the female deaths occur at much older ages<br />
than males. The nature of non-communicable diseases differs between males and<br />
females. Stroke is a major cause of death in the province. However, males appear to<br />
154
have the occurrence of ischaemic heart at younger ages while females have diabetes<br />
at younger ages. It will be important to calculate age specific rates in the older ages<br />
to assess the trends.<br />
It is difficult to rank the causes of death in a meaningful way. Firstly, the granularity<br />
of the classification needs careful consideration. For example, all cancers would rank<br />
quite differently from the separate cancer sites. This analysis used the SA NBD list<br />
which was developed from the GBD list with a few modifications for the South African<br />
setting. The list has combined conditions that have a similar aeitiology or health<br />
intervention. Mis-classification in the cause of death data makes ranking difficult to<br />
interpret. Developing meaningful rankings of the cause of death data will require a<br />
burden of disease approach to adjust for the mis-classification. This will require<br />
adjustment for the under-registration (small), the ill-defined causes, the misclassification<br />
of HIV/AIDS and the missing details on the manner of death in the case<br />
of injuries. In addition, the use of premature mortality to rank the causes needs<br />
consideration about the use of age weighting or discounting in the calculation of YLLS.<br />
155
Conclusion<br />
This analysis of the cause of death data from death notifications provided by Stats SA<br />
reveals important information about the mortality profile in the province. However,<br />
there is clearly a need for improvement in the quality of the cause of death data.<br />
Training in the certification of cause of death is needed to improve the quality of the<br />
data and some coding issues need to be addressed. There is a strong need for subprovince<br />
level data. However, this data can be used with adjustments for underregistration<br />
of deaths and mis-classification of causes to be able to provide clear<br />
public health information. <strong>Mortality</strong> rates and estimates of premature mortality should<br />
be estimated as well as rankings of the causes.<br />
Nonetheless, it is clear that the mortality profile in this province is somewhat different<br />
from the national. The injury burden is high, particularly among males. It is not clear<br />
from this data whether it has decreased during this period. On the other hand,<br />
HIV/AIDS has had a major impact on mortality during this period, with rapid increases<br />
in the number of young adult deaths. Non-communicable diseases play a major role in<br />
the mortality of this province with cardiovascular and respiratory causes featuring for<br />
males and stroke and Diabetes mellitus featuring for women.<br />
.<br />
156
References<br />
Actuarial Society of South Africa. 2004. ASSA2003 AIDS and demographic model.<br />
http://www.assa.org.za/default.asp?id=1000000050. (Accessed 7 March 2007).<br />
Bradshaw D, Groenewald P, Laubscher R, Nannan N, Nojilana B, Norman R, Pieterse<br />
D, Schneider M. 2003a. Initial Burden of Disease Estimates for South Africa, 2000.<br />
<strong>Cape</strong> Town: South African Medical Research Council.<br />
Bradshaw D, Groenewald P, Laubscher R, Nannan N, Nojilana B, Norman R, Pieterse<br />
D, Schneider M, Bourne D, Timæus I, Dorrington R, Johnson L. 2003b. Initial Burden<br />
of Disease Estimates for South Africa, 2000. South African Medical Journal; 93: 682–<br />
688.<br />
Bradshaw D, Nannan N, Laubscher R, Groenewald P, Joubert J, Nojilana B, Norman R,<br />
Pieterse D, Schneider M. 2004. South African National Burden of Disease Study 2000:<br />
Estimates of Provincial <strong>Mortality</strong>. <strong>Cape</strong> Town: South African Medical Research Council.<br />
Coale AJ, Demeny P. 1966. Regional Model Life Tables and Stable Population. USA:<br />
Princeton University Press.<br />
Groenewald P, Nannan N, Bourne D, Laubscher R and Bradshaw D. 2005. Identifying<br />
deaths due to AIDS in South Africa. AIDS; 19; 193-201.<br />
Mathers C, Vos T, Stevenson C. 1999. The burden of disease and injury in Australia.<br />
Canberra: Australian Institute of Health and Welfare.<br />
http://www.aihw.gov.au/publications/health/bdia/bdia.pdf. (Accessed 7 March 2007).<br />
Mathers CD, Vos T, Lopez AD, Salomon J, Ezzati M (Eds). 2001. National Burden of<br />
Disease Studies: A Practical Guide. Edition 2.0. Global Programme on Evidence for<br />
Health Policy. Geneva: World Health Organization.<br />
Murray CJ, Lopez AD. 1996a. The Global Burden of Disease: a comprehensive<br />
assessment of mortality and disability from diseases, injuries and risk factors in 1990<br />
and projected to 2020. Vol.1, Global Burden of Disease and Injury series. Boston:<br />
Harvard School of Public Health.<br />
Murray CJ, Lopez AD. 1996b. Global Health Statistics. Vol.2, Global Burden of Disease<br />
and Injury Series. Boston: Harvard School of Public Health.<br />
Statistics South Africa. 2002. Causes of death in South Africa, 1997-2001: Advanced<br />
release of recorded causes of death (P0309.2). Pretoria: Statistics South Africa.<br />
Statistics South Africa. 2005. <strong>Mortality</strong> and causes of death in South Africa, 1997 –<br />
2003: findings from death notification. Statistical release P0309.3. Pretoria: Statistics<br />
South Africa.<br />
World Health Organization. 2002. World health report 2002: Reducing Risk,<br />
Promoting Healthy Life. Geneva: World Health Organization.<br />
157
Appendix A: South Africa Burden of Disease List<br />
SA NBD code Title of SA NBD cause ICD-10 Code<br />
I<br />
Communicable, maternal, perinatal and nutritional<br />
Diseases<br />
A00-A99, B00-B99, C46, D50-D53, D64, E00-E02, E40-E46,<br />
E50-E64, G00,G03, H65-H66, J00-J22, J90, N70-N73, O00-<br />
O99, P00-P96<br />
I A Infectious and parasitic A00-A99, B00-B99, C46, G00,G03, J90, N70-N73<br />
I A ZA1 Tuberculosis A15-A19, B90, J90<br />
I A ZA2 STDs excluding HIV A50-A64, N70-N73<br />
I A ZA2a Syphilis A50-A53<br />
I A ZA2b Other STDs A54-A64, N70-N73<br />
I A ZA4 Diarrhoeal diseases A00-A04, A06-A09<br />
I A ZA5 Childhood (Vaccine preventable) cluster A33-A37, A80, B03, B05-B06, B91<br />
I A ZA5a Pertussis A37<br />
I A ZA5b Polio A80, B91<br />
I A ZA5c Diptheria A36<br />
I A ZA5d Measles B05<br />
I A ZA5e Tetanus A33 - A35<br />
I A ZA5f Rubella B06<br />
I A ZA6 Bacterial meningitis A39, G00, G03<br />
I A ZA7 Hepatitis B15-B19<br />
I A ZA8 Malaria B50-B54<br />
I A ZA9 Schistosomiasis and other tropical diseases B55-B56, B65, B74<br />
I A ZA10 Leprosy A30, B92<br />
I A ZA11 Intestinal parasites B76-B81<br />
I A ZA12 Septicaemia A40-A41<br />
I A ZA13 Other infectious and parasitic A05, A20-A28, A31, A32, A38, A42-A49, A65-A69, A70-A74,<br />
A75-A79, A81-A89, A90-A99, B00-B02, B04, B07-B09, B25-<br />
B34, B35-B49, B57-B64, B66-B73, B75, B82-B89, B94-B99<br />
I B Respiratory infections J00-J06, J10-22, H65-H66<br />
I B ZA14 Lower respiratory infections J10-J18, J20-J22<br />
I B ZA15 Upper respiratory infections J00-J06<br />
I B ZA16 Otitis media H65-H66<br />
I C Maternal conditions O00-O99<br />
I C ZA17 Maternal haemorrhage O20, O44-O46, O67,O72<br />
I C ZA18 Maternal sepsis O85-086<br />
I C ZA19 Hypertension in pregnancy O10-O16<br />
I C ZA20 Obstructed labour O64-O66<br />
I C ZA21 Abortion O00-O08<br />
I C ZA22 Other maternal O21-O29, O30-O43, O47-O48, O60-O63, O68-O71, O73-O75,<br />
O80-O84, O87-O92, O95-O99<br />
I D Perinatal conditions P00-P96<br />
I D ZA23 Low birth weight P05-P07, P22<br />
I D ZA24 Birth asphyxia and trauma P03, P10-P15, P20-P21<br />
I D ZA25 Other perinatal respiratory conditions P23-P28<br />
I D ZA26 Neonatal infections P35-P39<br />
I D ZA27 Other perinatal P00-P02, P04, P08, P29, P50-P61, P70-P94, P96<br />
I D Ill-defined perinatal P95<br />
I E Nutritional deficiencies D50-D53, D64, E00-E02, E40-E46, E50-E64<br />
I E ZA28 Protein-energy malnutrition E40-E46<br />
I E ZA29 Deficiency anaemias D50-D53, D64<br />
I E ZA30 Other nutritional deficiencies including pellagra and<br />
vitamin A deficiency<br />
E00-E02, E50-E64<br />
I X HIV/AIDS B20-B24,C46<br />
I X ZA3 Acquired immunity deficiency syndrome B20-B24,C46<br />
II Non-communicable diseases C00-C45, C47-C97, D00-D48, D55-D63, D65-D89, E03-E07,<br />
E10-E14, E15-E34, E65-E90, F00-F99, G04-G99, H00-H63,<br />
H68-H95, I00-I99, J30--J89, J92-98, K00-K93, L00-L98, M00-<br />
M99, N00-N64, N75-N99, Q00-Q99, R00-R95<br />
II F Malignant neoplasms C00-C45, C47-C97<br />
II F ZA31 Mouth and oropharynx C00-C14<br />
II F ZA32 Oesophagus C15<br />
II F ZA33 Stomach C16<br />
II F ZA34 Colo-rectal C18-C21<br />
II F ZA35 Liver C22<br />
158
SA NBD code Title of SA NBD cause ICD-10 Code<br />
II F ZA36 Pancreas C25<br />
II F ZA37 Larynx C32<br />
II F ZA38 Trachea/bronchi/lung C33-C34<br />
II F ZA39 Bone and connective tissue C40-C41, C47, C49<br />
II F ZA40 Melanoma C43<br />
II F ZA41 Other skin cancer C44<br />
II F ZA42 Breast C50<br />
II F ZA43 Cervix C53<br />
II F ZA44 Corpus uteri C54, C55<br />
II F ZA45 Ovary C56<br />
II F ZA46 Prostate C61<br />
II F ZA47 Bladder C67<br />
II F ZA48 Kidney C64-C66, C68<br />
II F ZA49 Brain C71<br />
II F ZA50 Lymphoma, multiple myeloma C81-C90, C96<br />
II F ZA51 Leukaemia C91-C95<br />
II F ZA52 Other malignant neoplasms C17, C23-C24, C26, C30-C31, C37-C39, C45, C48, C51-C52,<br />
C57-C58, C60, C62-C63,C69-C70, C72-C75<br />
Ill-defined cancers<br />
C76-C80, C97<br />
II G ZA53 Benign neoplasms D00-D48<br />
II H ZA54 Diabetes mellitus E10-E14<br />
II I Endocrine and metabolic disorders D55-D63, D65-D89, E03-E07, E15-E34, E65-89<br />
II I ZA55 Albinism E70.3<br />
II I ZA56 Other endocrine and metabolic D55-D63, D65-D89, E03-E07, E15-E16, E20-E34, E65-E68, E71-<br />
E89<br />
II J Mental disorders F10-F99<br />
II J ZA57 Alcohol dependence F10<br />
II J ZA58 Drug use F11-F16, F18-F19<br />
II J ZA59 Schizophrenia F20-F29<br />
II J ZA60 Unipolar F32-F33<br />
II J ZA61 Bipolar F30-F31<br />
II J ZA62 Anorexia nervosa F50<br />
II J ZA63 Neurotic disorders F40-F42<br />
II J ZA64 Hyperkinetic Syndrome of childhood F90<br />
II J ZA65 Adjustment reaction (PTSS) F43<br />
II J ZA66 Mental Disability F70-F79<br />
II J ZA67 Other mental disorders F17, F34-39, F44-F48, F51-F59, F60-F69, F80-F89, F91-F98, F99<br />
Nervous system disorders<br />
F01-F09, G03-G99<br />
II K ZA68 Alzheimer and other dementias F01-F09, G30-G31<br />
II K ZA69 Parkinsons disease G20-G21<br />
II K ZA70 Multiple sclerosis G35<br />
K ZA71 Epilepsy G40-G41<br />
II K ZA72 Encephalitis and brain abscess G04, G06, G09<br />
II K ZA73 Other nervous system disorders G08, G10-G12, G23-25, G36-37, G43-G47, G50-G58,G60-<br />
G64,G70-G72, G80-G83,G90-G98<br />
II L Sense organs H00-H13, H15-H59, H60-H62, H68-H95<br />
II L ZA74 Glaucoma H40<br />
II L ZA75 Cataracts H25-H26<br />
II L ZA76 Other visual disorders H00-H21, H27-H35, H42-H59<br />
II L ZA77 Hearing loss and other ear disorders H60-H62, H68-H95<br />
II M Cardiovascular I00-I26, I28-I84, I86-I99, J81<br />
II M ZA78 Rheumatic heart disease I01-I09<br />
II M ZA79 Ischaemic heart disease I20-I25<br />
II M ZA80 Stroke I60-I69<br />
II M ZA81 Inflammatory heart disease I30, I33, I38, I40, I42<br />
II M ZA81a Peri-, endo, myocarditis I30, I33, I38, I40<br />
II M ZA81b Cardiomyopathy I42<br />
II M ZA82 Hypertensive heart disease I10-I13<br />
II M ZA83 Non-rheumatic valvular disease I34-I37<br />
II M ZA84 Pulmonary embolism I26<br />
II M ZA85 Aortic aneurism I71<br />
II M ZA86 Peripheral vascular disorders I72- I78, I80-I84, I86-I89<br />
II M ZA87 Other cardiovascular I00, I28, I31, I44-I45, I95-I99<br />
Ill-defined cardiovascular<br />
I46-I49, I50-I51, I70, J81<br />
II N Respiratory I27, J30-J80; J82-J86, J92-J99<br />
II N ZA88 COPD J40-J44, I27<br />
II N ZA89 Asthma J45-46<br />
II N ZA90 Aspiration pneumonia/ lung abscess/empyema J69, J85-J86<br />
II N ZA91 Other respiratory J30-J39, J47, J60-J68, J70, J80, J82-J84, J92-J98<br />
159
SA NBD code Title of SA NBD cause ICD-10 Code<br />
II O Digestive K20-K38, K40-K63, K65-K93, I85<br />
II O ZA92 Peptic ulcer K25-K28<br />
II O ZA93 Appendicitis K35-K37<br />
II O ZA94 Noninfective gastroenteritis and colitis K50-K52<br />
II O ZA95 Cirrhosis of liver K70, K74, K76, I85<br />
II O ZA96 Hepatic failure K72<br />
II O ZA97 Gall bladder disease K80-K83<br />
II O ZA98 Diseases of the pancreas K85, K86<br />
II O ZA99 Other digestive K20-K22, K29-K31, K38, K40-K46, K55-K66, K71, K73, K75,<br />
K90-K91<br />
Ill-defined digestive<br />
K92<br />
II P Genito-urinary N00-N50, N60-N64, N75-N98<br />
II P ZA100 Nephritis/nephrosis N00-N19<br />
II P ZA101 Benign prostatic hypertrophy N40<br />
II P ZA102 Other genito-urinary N20-N23, N25-N39, N41-N50, N60-N64, N75-N98<br />
II Q ZA103 Skin disease L00-L98<br />
II R Musculo-skeletal M00-M99<br />
II R ZA104 Rheumatoid arthritis M05-M06<br />
II R ZA105 Osteoarthritis M15-M19<br />
II R ZA106 Other musculo-skeletal M00-M02, M08, M10-M13, M20-M99<br />
II S Congenital abnormalities Q00-Q99<br />
II S ZA107 Neural tube defects Q00-Q07<br />
II S ZA108 Cleft lip/palate Q35-Q37<br />
II S ZA109 Congenital heart disease Q20-Q28<br />
II S ZA110 Congenital disorders of GIT Q38-Q45<br />
II S ZA111 Down’s syndrome and other chromosomal anomalies Q90-Q99<br />
II S ZA112 Fetal alcohol syndrome Q86.0<br />
II S ZA113 Other congenital abnormalities Q10-Q18, Q30-Q34, Q50-Q56, Q60-Q64, Q65-Q79, Q80-Q85,<br />
Q87<br />
Ill-defined congenital<br />
Q89<br />
II T Oral conditions K00-K14<br />
II T ZA114 Dental caries K02<br />
II T ZA115 Periodontal disease K05<br />
II T ZA116 Other oral health K00-K01, K03-K04, K06-K14<br />
II U Cot death R95, R96-R98 < 12 MTHS<br />
II U ZA117 Cot death R95, R96-R98 < 12 MTHS<br />
Ill-defined signs and symptoms<br />
R00-R09, R10-R19, R20-R23, R25-R29, R30-R39, R40-R46,<br />
R47-R49, R50-R69, R70-R79, R80-R82, R83-R94, R96-R98 ><br />
12 months, R99<br />
III Injuries V01-V99, WOO-W99, X00-X99, Y00-Y98<br />
III V Unintentional V00-V99, W00-W99, X00-X59, Y40-Y86, Y88<br />
III V ZA118 Road traffic accidents V01-V04, V06, V09-V80, V87, V89, V99<br />
III V ZA119 Other transport accidents V05, V81-V86, V88, V90-V94, V95-V98<br />
III V ZA120 Mining accidents Y37<br />
III V ZA121 Poisoning X40-X49<br />
III V ZA122 Surgical / medical misadventure Y60-Y69, Y70-Y82, Y83-Y84, Y88<br />
III V ZA123 Falls W00-W19<br />
III V ZA124 Fires X00-X09<br />
III V ZA125 Natural and environmental factors W53-W64, X20-X29, X30-X39, X50-X57<br />
III V ZA126 Drowning W65-W74<br />
III V ZA127 Suffocation and foreign bodies W75-W84<br />
III V ZA128 Other unintentional injuries specified W20-W49, W50-W52, W85-W99,Y40-Y59, X10-X19, X58, Y38,<br />
Y39<br />
Ill-defined unintentional<br />
III W Intentional injuries X60-X99, Y00-Y09, Y35-Y36<br />
III W ZA129 Suicide and self-inflicted X60-X84<br />
III W ZA130 Homicide and violence X85-Y09<br />
III W ZA130a with firearm X93-X95<br />
III W ZA130b without firearm X85-X92, X96-X99, Y00-Y08<br />
Homicide unspecified<br />
Y09<br />
III W ZA131 Legal intervention and war Y36, Y35<br />
Undetermined whether intentional or unintentional<br />
Y10-Y34, Y87, Y89<br />
160
Appendix B: Deaths for South Africa, 1992-2002<br />
25000<br />
Number of male deaths by age, 1997 - 2002<br />
Stats SA National data<br />
20000<br />
Deaths<br />
15000<br />
10000<br />
1997<br />
1998<br />
1999<br />
2000<br />
2001<br />
2002<br />
5000<br />
0<br />
0<br />
1-4<br />
5-9<br />
10-14<br />
15-19<br />
20-24<br />
25-29<br />
30-34<br />
35-39<br />
40-44<br />
45-49<br />
50-54<br />
55-59<br />
60-64<br />
65-69<br />
70-74<br />
75-79<br />
80-84<br />
85+<br />
Age group<br />
Number of female deaths by age, 1997 - 2002<br />
Stats SA National data<br />
25000<br />
20000<br />
Deaths<br />
15000<br />
10000<br />
1997<br />
1998<br />
1999<br />
2000<br />
2001<br />
2002<br />
5000<br />
0<br />
0<br />
1-4<br />
5-9<br />
10-14<br />
15-19<br />
20-24<br />
25-29<br />
30-34<br />
35-39<br />
40-44<br />
45-49<br />
50-54<br />
55-59<br />
60-64<br />
65-69<br />
70-74<br />
75-79<br />
80-84<br />
85+<br />
Age group<br />
161
Appendix C: Deaths under one year of age, South Africa<br />
Figure C1 shows the number of child deaths under 2 years of age due to respiratory<br />
diseases (J00-J99) and conditions originating in the perinatal period (P00-P96) for the<br />
period 1997 to 2002 by age in months. The numbers of deaths increase each year<br />
with very distinct patterns: the numbers of respiratory disease deaths have a<br />
disjuncture at 12 months with much higher numbers over-1 year of age than under.<br />
The perinatal deaths are very high for deaths in the first month of life, and tail off at<br />
12 months with an emerging peak at 3 months. These patterns indicate that Statistics<br />
South Africa has adopted an incorrect coding algorithm whereby deaths of infants<br />
under-1 year of age, have generally been coded to the P codes, rather than the<br />
specific cause. The algorithm leads to a discontinuity at 12 months of age with all<br />
explicit causes of death being under-reported, and Chapter XVI being overrepresented<br />
under-1 year of age. In spite of the algorithm, some causes of death<br />
have been coded to their correct classification leading to non-zero (but underreported)<br />
numbers in the other chapters.<br />
The data used for the analyses in this appendix is a special tabulation of national data<br />
by month of age and ICD-10 code supplied by Statistics South Africa. This data is not<br />
available at a provincial level. However, the high number of infant deaths in the<br />
<strong>Western</strong> <strong>Cape</strong> that are due to perinatal conditions would suggest that this problem<br />
applies to the provincial data as well.<br />
162
00<br />
02<br />
04<br />
06<br />
08<br />
10<br />
12<br />
14<br />
16<br />
18<br />
20<br />
22<br />
24<br />
10<br />
12<br />
14<br />
16<br />
18<br />
20<br />
22<br />
24<br />
160<br />
Deaths due to Diseases of the Respiratory system (J00-J99)<br />
Stats SA national data<br />
number of deaths<br />
140<br />
120<br />
100<br />
80<br />
60<br />
40<br />
20<br />
0<br />
1997<br />
1998<br />
1999<br />
2000<br />
2001<br />
2002<br />
0<br />
2<br />
4<br />
6<br />
8<br />
age in months<br />
number of deaths<br />
Deaths due to Certain conditions originating in the perinatal period (P00-P96)<br />
Stats SA national data<br />
10,000<br />
9,000<br />
8,000<br />
7,000<br />
6,000<br />
5,000<br />
4,000<br />
3,000<br />
2,000<br />
1,000<br />
0<br />
1997<br />
1998<br />
1999<br />
2000<br />
2001<br />
2002<br />
age in months<br />
Figure C1. Number of deaths in South Africa recorded by Stats SA between<br />
1997 and 2002 by age in months, Chapter X: Diseases of the respiratory<br />
system and ICD-10 Chapter XVI: Certain conditions originating in the<br />
perinatal period, National data, Stats SA<br />
163
Appendix to Volume 2<br />
A comparative risk assessment for South Africa, 2000<br />
Towards promoting health and preventing disease<br />
Rosana Norman*, Michelle Schneider, Debbie Bradshaw, Pam Groenewald, Jané Joubert, Ria Laubscher,<br />
Nadine Nannan, Beatrice Nojilana, Desiréé Pieterse, Theo Vos and the SA CRA expert working groups<br />
*Author for correspondence:<br />
Rosana Norman<br />
Burden of Disease Research Unit,<br />
Medical Research Council, PO Box 19070,<br />
Tygerberg, 7505, Tel: +27 21 938 0427, Fax: +27 21 938 0310,<br />
email: rosana.norman@mrc.ac.za<br />
www.mrc.ac.za/bod/bod.htm<br />
Introduction<br />
The first South African National Burden of Disease (SA NBD) study identified the<br />
underlying causes of premature mortality and morbidity experienced in South Africa in the<br />
year 2000. The next step was to undertake the Comparative Risk Assessment component of<br />
the SA NBD study. Reliable and comparable analysis of risks to health is key for a health<br />
sector response to preventing disease and injury. The aim of this study was to estimate the<br />
contributions of 17 selected risk factors, in various levels of causality, to burden of disease in<br />
South Africa in 2000. The list of risk factors was identified by consulting a range of<br />
stakeholders.<br />
Methods<br />
The study followed comparative risk assessment methodology developed by the World Heath<br />
Organization. Expert working groups carried out a comprehensive review of published work<br />
for the selected risk factors to obtain local prevalence of risk factor exposure and hazard size<br />
in some instances. Population attributable fractions were calculated and applied to revised<br />
burden of disease estimates (deaths and disability adjusted life years, (DALYs)) from the<br />
South African NBD study to obtain the attributable burden for each selected risk factor.<br />
Results<br />
Provisional results are shown in Tables 1 and 2. The first table shows the burden attributable<br />
to the risk factors in terms of deaths, and the second in terms of DALYS. In each case the<br />
ranking of the risk factors is shown alongside the ranking of the leading underlying diseases<br />
and conditions. The study indicates that unsafe sex is the leading risk factor accounting for<br />
31.5% of DALYs. Interpersonal violence ranks second accounting for 8.4% of DALYs.<br />
Alcohol harm accounts for 7% and tobacco for 4% of total DALYs. It was also estimated that<br />
the diet related risk factors such as high body mass, high blood pressure and cholesterol, as<br />
well as undernutrition both cause significant harm. The leading causes of mortality included<br />
unsafe sex, high blood pressure and tobacco.<br />
164
Table 1. Deaths attributable to selected risk factors compared with the underlying causes of death<br />
Rank<br />
Risk factor<br />
% total<br />
deaths<br />
Rank<br />
Disease or injury<br />
% total<br />
deaths<br />
1 Unsafe sex/STIs 26.3 1 HIV/AIDS 25.5<br />
2 High blood pressure 9.0 2 Ischaemic heart disease 6.6<br />
3 Tobacco 8.5 3 Stroke 6.5<br />
4 Alcohol harm 7.1 4 Tuberculosis 5.5<br />
5 High BMI 7.0 5 Interpersonal violence 5.3<br />
6 Interpersonal violence 6.7 6 Lower respiratory infections 4.4<br />
7 High cholesterol 4.6 7 Hypertensive disease 3.2<br />
8 Diabetes 4.3 8 Diarrhoeal diseases 3.1<br />
9 Physical inactivity 3.3 9 Road traffic accidents 3.1<br />
10 Low fruit and vegetable intake 3.2 10 Diabetes mellitus 2.6<br />
11 Unsafe water, sanitation and hygiene 2.6 11 Chronic obstructive pulmonary disease 2.5<br />
12 Childhood and maternal underweight 2.3 12 Low birth weight 2.2<br />
13 Urban air pollution 0.9 13 Asthma 1.3<br />
14 Vitamin A deficiency 0.6 14 Trachea/bronchi/lung cancer 1.3<br />
15 Indoor smoke 0.5 15 Nephritis/nephrosis 1.3<br />
16 Iron deficiency anaemia 0.4 16 Septicaemia 1.2<br />
17 Lead exposure 0.3 17 Oesophageal cancer 1.1<br />
Table 2. DALYs attributed to selected risk factors compared with the underlying causes of DALYS<br />
Rank Risk factor % total Rank Disease or injury % total<br />
DALYs<br />
DALYs<br />
1 Unsafe sex/STIs 31.5 1 HIV/AIDS 30.9<br />
2 Interpersonal violence 8.4 2 Interpersonal violence 6.5<br />
3 Alcohol harm 7.0 3 Tuberculosis 3.7<br />
4 Tobacco 4.0 4 Road traffic accidents 3.0<br />
5 High BMI 2.9 5 Diarrhoeal diseases 2.9<br />
6 Childhood and Maternal underweight 2.7 6 Lower respiratory infections 2.8<br />
7 Unsafe water sanitation and hygiene 2.6 7 Low birth weight 2.6<br />
8 High blood pressure 2.4 8 Asthma 2.2<br />
9 Diabetes 1.6 9 Stroke 2.2<br />
10 High cholesterol 1.4 10 Unipolar depressive disorders 2.0<br />
11 Low fruit and vegetable intake 1.1 11 Ischaemic heart disease 1.8<br />
12 Physical inactivity 1.1 12 Protein-energy malnutrition 1.3<br />
13 Iron deficiency anaemia 1.1 13 Birth asphyxia and birth trauma 1.2<br />
14 Vitamin A deficiency 0.7 14 Diabetes mellitus 1.1<br />
15 Indoor smoke 0.4 15 Alcohol dependence 1.0<br />
16 Lead exposure 0.4 16 Hearing loss, adult onset 1.0<br />
17 Urban air pollution 0.3 17 Cataracts 0.9<br />
Conclusions<br />
Provisional results show that the loss of health in South Africa is dominated by sexually<br />
transmitted diseases resulting from unsafe sex in combination with risk factors related to<br />
165
poverty and under-development on the one hand, such as under-nutrition, unsafe water,<br />
sanitation and hygiene and indoor smoke from solid fuels, and on the other hand by risk<br />
factors associated with a <strong>Western</strong> lifestyle, such as alcohol, tobacco, high blood pressure and<br />
high cholesterol. An assessment of the relative burden attributable to selected risk factors<br />
provides an important evidence base to help identify which risk factors need to be targeted<br />
for study and interventions and provides South African evidence to compare the relative<br />
impact of the risk factors assessed.<br />
Source: Abstract of presentation to the Burden of Disease Conference, Sandton 15-16<br />
March 2007 and paper submitted to the South African Medical Journal.<br />
166