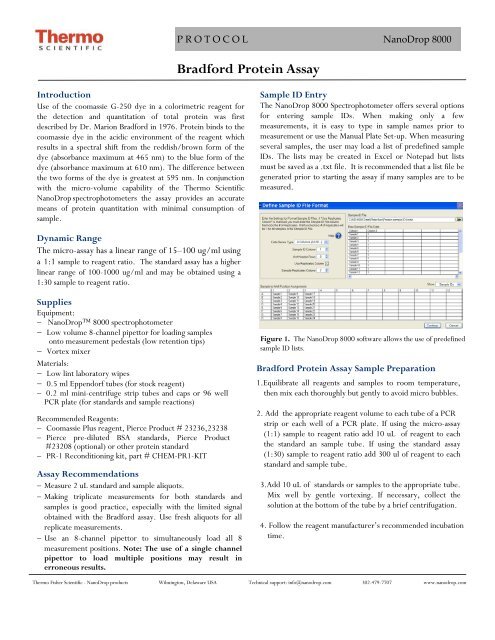
Bradford Protein Assay Protocol for the NanoDrop 8000
Bradford Protein Assay Protocol for the NanoDrop 8000
Bradford Protein Assay Protocol for the NanoDrop 8000

You also want an ePaper? Increase the reach of your titles
YUMPU automatically turns print PDFs into web optimized ePapers that Google loves.
PROTOCOL <strong>NanoDrop</strong> <strong>8000</strong><br />
<strong>Brad<strong>for</strong>d</strong> <strong>Protein</strong> <strong>Assay</strong><br />
Introduction<br />
Use of <strong>the</strong> coomassie G-250 dye in a colorimetric reagent <strong>for</strong><br />
<strong>the</strong> detection and quantitation of total protein was first<br />
described by Dr. Marion <strong>Brad<strong>for</strong>d</strong> in 1976. <strong>Protein</strong> binds to <strong>the</strong><br />
coomassie dye in <strong>the</strong> acidic environment of <strong>the</strong> reagent which<br />
results in a spectral shift from <strong>the</strong> reddish/brown <strong>for</strong>m of <strong>the</strong><br />
dye (absorbance maximum at 465 nm) to <strong>the</strong> blue <strong>for</strong>m of <strong>the</strong><br />
dye (absorbance maximum at 610 nm). The difference between<br />
<strong>the</strong> two <strong>for</strong>ms of <strong>the</strong> dye is greatest at 595 nm. In conjunction<br />
with <strong>the</strong> micro-volume capability of <strong>the</strong> Thermo Scientific<br />
<strong>NanoDrop</strong> spectrophotometers <strong>the</strong> assay provides an accurate<br />
means of protein quantitation with minimal consumption of<br />
sample.<br />
Sample ID Entry<br />
The <strong>NanoDrop</strong> <strong>8000</strong> Spectrophotometer offers several options<br />
<strong>for</strong> entering sample IDs. When making only a few<br />
measurements, it is easy to type in sample names prior to<br />
measurement or use <strong>the</strong> Manual Plate Set-up. When measuring<br />
several samples, <strong>the</strong> user may load a list of predefined sample<br />
IDs. The lists may be created in Excel or Notepad but lists<br />
must be saved as a .txt file. It is recommended that a list file be<br />
generated prior to starting <strong>the</strong> assay if many samples are to be<br />
measured.<br />
Dynamic Range<br />
The micro-assay has a linear range of 15–100 ug/ml using<br />
a 1:1 sample to reagent ratio. The standard assay has a higher<br />
linear range of 100-1000 ug/ml and may be obtained using a<br />
1:30 sample to reagent ratio.<br />
Supplies<br />
Equipment:<br />
− <strong>NanoDrop</strong> <strong>8000</strong> spectrophotometer<br />
− Low volume 8-channel pipettor <strong>for</strong> loading samples<br />
onto measurement pedestals (low retention tips)<br />
− Vortex mixer<br />
Materials:<br />
− Low lint laboratory wipes<br />
− 0.5 ml Eppendorf tubes (<strong>for</strong> stock reagent)<br />
− 0.2 ml mini-centrifuge strip tubes and caps or 96 well<br />
PCR plate (<strong>for</strong> standards and sample reactions)<br />
Recommended Reagents:<br />
− Coomassie Plus reagent, Pierce Product # 23236,23238<br />
− Pierce pre-diluted BSA standards, Pierce Product<br />
#23208 (optional) or o<strong>the</strong>r protein standard<br />
− PR-1 Reconditioning kit, part # CHEM-PR1-KIT<br />
<strong>Assay</strong> Recommendations<br />
− Measure 2 uL standard and sample aliquots.<br />
− Making triplicate measurements <strong>for</strong> both standards and<br />
samples is good practice, especially with <strong>the</strong> limited signal<br />
obtained with <strong>the</strong> <strong>Brad<strong>for</strong>d</strong> assay. Use fresh aliquots <strong>for</strong> all<br />
replicate measurements.<br />
− Use an 8-channel pipettor to simultaneously load all 8<br />
measurement positions. Note: The use of a single channel<br />
pipettor to load multiple positions may result in<br />
erroneous results.<br />
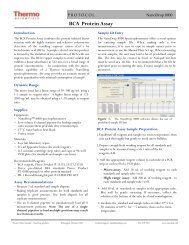
Figure 1. The <strong>NanoDrop</strong> <strong>8000</strong> software allows <strong>the</strong> use of predefined<br />
sample ID lists.<br />
<strong>Brad<strong>for</strong>d</strong> <strong>Protein</strong> <strong>Assay</strong> Sample Preparation<br />
1.Equilibrate all reagents and samples to room temperature,<br />
<strong>the</strong>n mix each thoroughly but gently to avoid micro bubbles.<br />
2. Add <strong>the</strong> appropriate reagent volume to each tube of a PCR<br />
strip or each well of a PCR plate. If using <strong>the</strong> micro-assay<br />
(1:1) sample to reagent ratio add 10 uL of reagent to each<br />
<strong>the</strong> standard an sample tube. If using <strong>the</strong> standard assay<br />
(1:30) sample to reagent ratio add 300 ul of reagent to each<br />
standard and sample tube.<br />
3.Add 10 uL of standards or samples to <strong>the</strong> appropriate tube.<br />
Mix well by gentle vortexing. If necessary, collect <strong>the</strong><br />
solution at <strong>the</strong> bottom of <strong>the</strong> tube by a brief centrifugation.<br />
4. Follow <strong>the</strong> reagent manufacturer’s recommended incubation<br />
time.<br />
Thermo Fisher Scientific - <strong>NanoDrop</strong> products Wilmington, Delaware USA Technical support: info@nanodrop.com 302-479-7707 www.nanodrop.com
2<br />
PROTOCOL <strong>NanoDrop</strong> <strong>8000</strong><br />
<strong>Protocol</strong><br />
1. Clean pedestals by pipetting 2 uL of dH 2 O onto each all 8<br />
lower pedestals, and <strong>the</strong>n lowering <strong>the</strong> arm so that <strong>the</strong> water<br />
makes contact with both <strong>the</strong> upper and lower measurement<br />
surfaces. Raise <strong>the</strong> arm and wipe all pedestals with a<br />
dry laboratory wipe.<br />
2. Launch <strong>the</strong> <strong>NanoDrop</strong> <strong>8000</strong> software and open <strong>the</strong> <strong>Protein</strong><br />
<strong>Brad<strong>for</strong>d</strong> module.<br />
3. Initialize <strong>the</strong> instrument by loading 2 uL of dH 2 O to all 8<br />
lower pedestals, lower <strong>the</strong> arm and click OK. When initialization<br />
is complete, use a dry laboratory wipe to wipe<br />
<strong>the</strong> water from all measurement surfaces.<br />
4. From <strong>the</strong> Standards Choose Source window select <strong>the</strong><br />
standard curve source. It is recommended that new standard<br />
absorbance values be measured each time <strong>the</strong> assay is<br />
run. Manually enter standard concentration values or enter<br />
a concentration series using a previously stored standard<br />
curve. If using a preloaded standard curve, continue to<br />
step 7.<br />
8.Gently mix <strong>the</strong> samples and use an 8-channel pipettor to<br />
simultaneously load multiple pedestal positions. Use fresh<br />
2 uL aliquots <strong>for</strong> each replicate.<br />
9. After completing all <strong>the</strong> measurements, re-condition <strong>the</strong><br />
pedestals with PR-1.<br />
Per<strong>for</strong>mance Data<br />
BSA (ug/ml) A595 (n=5) St dev %CV<br />
0 .037 0.001 NA<br />
125 .049 0.001 3.09<br />
250 .061 0.003 4.97<br />
500 .068 0.002 2.29<br />
750 .084 0.002 2.29<br />
1000 .095 0.003 3.21<br />
1500 .114 0.006 5.31<br />
2000 0.13 .005 3.97<br />
Table 1. Typical per<strong>for</strong>mance data <strong>for</strong> <strong>the</strong> micro <strong>Brad<strong>for</strong>d</strong><br />
protein assay using a BSA Standard Curve<br />
Typical <strong>Brad<strong>for</strong>d</strong> Sample Spectrum<br />
Figure 2. The <strong>NanoDrop</strong> <strong>8000</strong> software allows <strong>the</strong> use of a<br />
predefined standard curve or <strong>the</strong> user may build a new curve.<br />
5. Use an 8-channel pipettor to transfer 2 uL of dH20 onto<br />
each of <strong>the</strong> 8 lower pedestals. Lower <strong>the</strong> arm and click<br />
Blank. When <strong>the</strong> measurement is complete wipe <strong>the</strong><br />
pedestals with a lab wipe. .<br />
6. Gently mix <strong>the</strong> standards, <strong>the</strong>n use a 8-channel pipettor to<br />
simultaneously load <strong>the</strong> reference (reagent and buffer, no<br />
protein) and standards to generate a new standard curve.<br />
Use fresh 2 uL aliquots to measure additional replicates.<br />
7. Select <strong>the</strong> sample ID loading mode when prompted. Refer<br />
to page 1 <strong>for</strong> additional details.<br />
Figure 3. Example spectrum of <strong>Brad<strong>for</strong>d</strong> reagent-protein sample.<br />
For additional in<strong>for</strong>mation regarding <strong>the</strong> <strong>Brad<strong>for</strong>d</strong> assay and reagents,<br />
refer to http://www.piercenet.com<br />
T069/ Rev 10/2/09<br />
Thermo Fisher Scientific - <strong>NanoDrop</strong> products Wilmington, Delaware USA Technical support: info@nanodrop.com 302-479-7707 www.nanodrop.com