Experimental Evidence for Quantized Flux in ... - W2agz.com
Experimental Evidence for Quantized Flux in ... - W2agz.com
Experimental Evidence for Quantized Flux in ... - W2agz.com

You also want an ePaper? Increase the reach of your titles
YUMPU automatically turns print PDFs into web optimized ePapers that Google loves.
'<br />
VOLUME 7, NUMBER 2<br />
PHYSICAL REVIEW LETTERS Jvr.v 15, 1961<br />
4.0—<br />
5-0— 0 o o o<br />
0' 0<br />
0 60@ 0<br />
2.0—<br />
5 0<br />
l.o—<br />
-l.p<br />
—2.0<br />
-4.0<br />
-5.0<br />
o0<br />
0( MAO<br />
o<br />
8 g<br />
Q ~ + O $0~0<br />
000 tb<br />
8 o<br />
0.05 O.IO O.I5<br />
e&PPB $0<br />
0 aoocP ocP<br />
0 0<br />
0<br />
0.20<br />
tI;<br />
oo<br />
no<br />
0.25<br />
O<br />
OOO<br />
0<br />
0 0<br />
0 0<br />
o<br />
0 0<br />
0.50 0.55 0.40 0.45<br />
H- gauss<br />
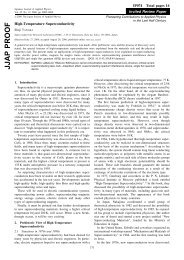
FIG. 1. (Upper) Trapped flux<br />
<strong>in</strong> cyl<strong>in</strong>der No. 1 as a function<br />
of magnetic field <strong>in</strong> which the<br />
cyl<strong>in</strong>der was cooled below the<br />
superconduct<strong>in</strong>g transition. temperature.<br />
The open circles are<br />
<strong>in</strong>dividual data po<strong>in</strong>ts. The solid<br />
circles represent th, e average<br />
value of all data po<strong>in</strong>ts at a particular<br />
value of applied field <strong>in</strong>clud<strong>in</strong>g<br />
all the po<strong>in</strong>ts plotted<br />
and additional data which could<br />
not be plotted due to severe overlapp<strong>in</strong>g<br />
of po<strong>in</strong>ts. Approximately<br />
two hundred data po<strong>in</strong>ts are represented.<br />
The l<strong>in</strong>es are drawn<br />
at multiples of hc/2e. (Lower)<br />
Net flux <strong>in</strong> cyl<strong>in</strong>der No. 1 be<strong>for</strong>e<br />
turn<strong>in</strong>g off the applied field<br />
<strong>in</strong> which it was cooled as a function<br />
of the applied field. Open<br />
and solid circles have the same<br />
significance as above. The lower<br />
l<strong>in</strong>e is the diamagnetic calibration<br />
to which all runs have<br />
been normalized. The other l<strong>in</strong>es<br />
are translated vertically by successive<br />
steps of hc/2e.<br />
provides a way of obta<strong>in</strong><strong>in</strong>g a truly zero-magneticfield<br />
region. ) (2) When the applied field exceeds<br />
a certa<strong>in</strong> value, flux is trapped both with the field<br />
on, and after the applied field is turned off. The<br />
amount of this trapped flux with<strong>in</strong> the experimental<br />
accuracy of the data is hc/2e.<br />
The amount of trapped flux rema<strong>in</strong>s constant<br />
as the applied field is <strong>in</strong>creased until a value<br />
approximately three times that <strong>for</strong> the <strong>in</strong>itial<br />
trapp<strong>in</strong>g is reached, at which po<strong>in</strong>t the trapped<br />
flux <strong>in</strong>creases to about twice the orig<strong>in</strong>al amount.<br />
There appears to be evidence <strong>for</strong> additional<br />
changes at five and seven times the field <strong>for</strong> the<br />
first trapp<strong>in</strong>g.<br />
Fluctuations <strong>in</strong> the data are caused by variations<br />
<strong>in</strong> the zero of the magnetic field, changes<br />
<strong>in</strong> the ga<strong>in</strong>, vibration amplitude, drift, and random<br />
noise <strong>in</strong> the detection system. The approximately<br />
two hundred data po<strong>in</strong>ts <strong>for</strong> sample No. 1<br />
were taken over a three-week period dur<strong>in</strong>g<br />
which the drift and noise were gradually improved.<br />
The fluctuations of the data around the<br />
values 0 and hc/2e represent, we believe, expected<br />
scatter from drift and noise. This scatter<br />
has been greatly improved <strong>for</strong> sample No. 2.<br />
For both samples the data are consistent with<br />
values 0 and hc/2e <strong>for</strong> the trapped flux as described<br />
above.<br />
Near the transition to the second and third<br />
steps the fluctuations <strong>in</strong> the data are greater,<br />
and <strong>in</strong> addition po<strong>in</strong>ts lie between the steps.<br />
Some <strong>in</strong>creased scatter is expected s<strong>in</strong>ce the<br />
absolute fluctuations due to changes <strong>in</strong> ga<strong>in</strong> and<br />
vibration amplitude are proportional to the size<br />
of the signal. The po<strong>in</strong>ts between the steps do<br />
not necessarily <strong>in</strong>dicate trapp<strong>in</strong>g of non<strong>in</strong>tegral<br />
values of flux. S<strong>in</strong>ce the observed signal is the<br />
sum of the emf's from coils at the two ends of<br />
the sample, a flux l<strong>in</strong>e pass<strong>in</strong>g out of the cyl<strong>in</strong>der<br />
at some po<strong>in</strong>t other than the end may produce<br />
different signals <strong>in</strong> the two coils. The two<br />
ends of the cyl<strong>in</strong>der are not quite identical; so<br />
near the transition region it is probable that the<br />
two ends might trap a different number of units