Discussion of WECC Paths Alberta-British Columbia Path 1
Discussion of WECC Paths Alberta-British Columbia Path 1
Discussion of WECC Paths Alberta-British Columbia Path 1

Create successful ePaper yourself
Turn your PDF publications into a flip-book with our unique Google optimized e-Paper software.
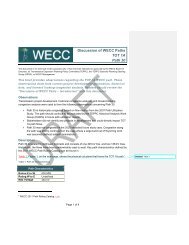
<strong>Discussion</strong> <strong>of</strong> <strong>WECC</strong> <strong><strong>Path</strong>s</strong><br />
<strong>Alberta</strong>-<strong>British</strong> <strong>Columbia</strong><br />
<strong>Path</strong> 1<br />
This document is for technical review purposes only. It has not been endorsed or approved by the <strong>WECC</strong> Board <strong>of</strong><br />
Directors, its Transmission Expansion Planning Policy Committee (TEPPC), the TEPPC Scenario Planning Steering<br />
Group (SPSG), or <strong>WECC</strong> Management.<br />
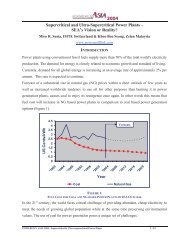
This brief provides observations regarding the <strong>Alberta</strong> – <strong>British</strong> <strong>Columbia</strong><br />
<strong>WECC</strong> path. These observations draw from current project development<br />
information, historical data, and forward looking congestion analysis.<br />
Readers should review the “<strong>Discussion</strong> <strong>of</strong> <strong>WECC</strong> <strong><strong>Path</strong>s</strong> – Introduction” with<br />
this document.<br />
Observations<br />
Transmission project development, historical congestion analysis, and forward looking<br />
congestion analysis were used to form the following observations concerning <strong>Path</strong> 1.<br />
• <strong>Path</strong> 1 is historically congested based on the 2009 <strong>Path</strong> Utilization Study block hour net<br />
schedule and block hour maximum directional schedule metrics. The path should<br />
continue to be evaluated by the TEPPC Historical Analysis Work Group (HAWG) in their<br />
future path utilization reports.<br />
• There are a number <strong>of</strong> projects under development that could directly impact <strong>Alberta</strong> –<br />
<strong>British</strong> <strong>Columbia</strong> path flows.<br />
• <strong>Path</strong> 1 is not congested or highly utilized in the expected future study case. However, it<br />
was congested in the 2019 studies. In part, this is caused by the economic dispatch<br />
using abundant and inexpensive hydro resources located in <strong>British</strong> <strong>Columbia</strong> to displace<br />
the mostly coal and natural gas resource portfolio modeled in <strong>Alberta</strong>.<br />
• The inclusion <strong>of</strong> the Montana <strong>Alberta</strong> Tie Line (MATL) project, a SCG Foundational<br />
Project in the 2020 dataset, appears to have a noticeable impact on the level <strong>of</strong><br />
congestion observed along <strong>Path</strong> 1 in the TEPPC congestion studies.<br />
Description<br />
The <strong>Alberta</strong> – <strong>British</strong> <strong>Columbia</strong> path serves as the sole link between <strong>Alberta</strong> and the remainder<br />
<strong>of</strong> the Western Interconnection. The path consists <strong>of</strong> the constituent <strong>of</strong> lines spanning southern<br />
<strong>Alberta</strong> to southern <strong>British</strong> <strong>Columbia</strong>. East to West flows are typically 0 to 400 MW and usually<br />
occur during light load hours. West to East flows are usually 0 to 400 MW, can be as high as<br />
800 MW, and generally occur during peak load hours. Key characteristics <strong>of</strong> the path as defined<br />
by the 2011 <strong>WECC</strong> <strong>Path</strong> Rating Catalog can be found in Table 1, on the next page. Figure 1,<br />
shows the physical cut plane that forms the <strong>Alberta</strong> – <strong>British</strong> <strong>Columbia</strong> path. 1<br />
1 Information from <strong>WECC</strong> 2011 <strong>Path</strong> Rating Catalog: Link<br />
Page 1 <strong>of</strong> 1
<strong>Discussion</strong> <strong>of</strong> <strong>WECC</strong> <strong><strong>Path</strong>s</strong><br />
<strong>Alberta</strong> – <strong>British</strong> <strong>Columbia</strong> - <strong>Path</strong> 1<br />
Table 1: <strong>Path</strong> 1 Characteristics<br />
<strong>Path</strong> Characteristics<br />
Rating E to W<br />
Rating W to E<br />
Max Voltage<br />
1000 MW<br />
1200 MW<br />
500 kV<br />
Figure 1: <strong>Path</strong> 1 Definition<br />
Historical Congestion<br />
<strong>Path</strong> 1 is historically congested as demonstrated by the block hour net schedule and block hour<br />
maximum schedule analysis conducted in part <strong>of</strong> the 2009 TEPPC Transmission <strong>Path</strong> Utilization<br />
Study. <strong>Alberta</strong> – <strong>British</strong> <strong>Columbia</strong> was identified as the 10 th most heavily used path in the<br />
Western Interconnection in the 2009 study. Actual flow and schedule data can be found in the<br />
duration plot in Figure 2. Although informative, the plot does not necessarily reflect the metrics<br />
that support the path as historically congested. <strong>Path</strong> 1 was not analyzed in the 2008 and 2007<br />
TEPPC Transmission <strong>Path</strong> Utilization Studies.<br />
Page 2 <strong>of</strong> 2
Figure 2: <strong>Path</strong> 1 Actual Flow Duration Plot<br />
<strong>Discussion</strong> <strong>of</strong> <strong>WECC</strong> <strong><strong>Path</strong>s</strong><br />
<strong>Alberta</strong> – <strong>British</strong> <strong>Columbia</strong> - <strong>Path</strong> 1<br />
Project Development<br />
The following four projects were determined by stakeholders to be the most likely to have an<br />
impact on <strong>Path</strong> 1.<br />
• MATL (SCG Foundational Project)<br />
• NorthernLights (Studied in 2010 Study Program)<br />
• Triton HVDC Sea Cable Project<br />
• West Coast Cable<br />
Because the MATL project was included in the 2020 dataset, but not the 2019 dataset, some <strong>of</strong><br />
the reduced congestion along <strong>Path</strong> 1 observed in the 2020 cases can be attributed to the<br />
utilization <strong>of</strong> the MATL project. This is further explained in the following sections. Additionally,<br />
the NorthernLights project was implemented with the 2019 <strong>Alberta</strong> Resource Relocation case as<br />
part <strong>of</strong> the 2010 Study Program. Congestion impacts on <strong>Path</strong> 1 from this study case are<br />
presented in the “Future Congestion Analysis” under “Project Development Impact”.<br />
Future Congestion Analysis<br />
The forward looking congestion analysis draws upon study case results from production cost<br />
model runs using TEPPCs 2019 and 2020 datasets. This work was done as a part <strong>of</strong> the 2010<br />
Study Program.<br />
Page 3 <strong>of</strong> 3
<strong>Discussion</strong> <strong>of</strong> <strong>WECC</strong> <strong><strong>Path</strong>s</strong><br />
<strong>Alberta</strong> – <strong>British</strong> <strong>Columbia</strong> - <strong>Path</strong> 1<br />
Expected Future<br />
In the 2020 expected future study case, <strong>Path</strong> 1 operated at U99 and U90 for only 2.57% percent<br />
and 3.61% percent <strong>of</strong> the year, respectively. <strong>Path</strong> 1 was not highly utilized in this study case<br />
and there was no congestion on <strong>Path</strong> 1 contingent on the assumptions used to develop the<br />
2020 Reference Case.<br />
Alternative Futures<br />
Of all 15 study cases used to inform the 10-Year Plan, the <strong>Alberta</strong> – <strong>British</strong> <strong>Columbia</strong> path<br />
passed the utilization screening eight times. All eight <strong>of</strong> these cases were based on the 2019<br />
dataset. The path was not highly utilized in any <strong>of</strong> the 2020 study cases, including the reference<br />
case, as previously mentioned. The MATL project was included in the 2020 dataset and not the<br />
2019 dataset. The implementation <strong>of</strong> the MATL project reduced congestion along <strong>Path</strong> 1. In<br />
addition, <strong>Alberta</strong> generation was increased to ensure load-gen balance. The need for <strong>Alberta</strong> to<br />
import fewer resources may have contributed to the decrease in utilization <strong>of</strong> <strong>Path</strong> 1 from the<br />
2019 to the 2020 studies.<br />
Conditional Congestion<br />
Conditional congestion along <strong>Path</strong> 1 is dependent strictly on 2019 study cases. Conditional<br />
congestion scores were calculated for those study cases in which <strong>Path</strong> 1 was highly utilized (i.e.<br />
passed the utilization screening). The conditional congestion scores for <strong>Path</strong> 1 and the<br />
associated study cases in which the scores were calculated are listed in Table 2.<br />
Table 2: <strong>Path</strong> 1 Conditional Congestion<br />
Conditional<br />
Study Case<br />
Congestion<br />
Score 2<br />
2019 Base Case 0.52<br />
2019 Arizona/S. Nevada 0.49<br />
2019 Wyoming 0.48<br />
2019 <strong>British</strong> <strong>Columbia</strong> 0.92<br />
2019 N. Nevada 0.47<br />
2019 Montana 0.52<br />
2019 New Mexico 0.48<br />
2019 Northwest Coastal 0.67<br />
High levels <strong>of</strong> congestion along <strong>Path</strong> 1 appear to be most contingent on a future featuring a<br />
large build out <strong>of</strong> renewable resources in <strong>British</strong> <strong>Columbia</strong>, as indicated by the high conditional<br />
congestion score for <strong>Path</strong> 1 in the 2019 <strong>British</strong> <strong>Columbia</strong> resource relocation case.<br />
2 Score is comprised <strong>of</strong> Risk, Value, and Utilization congestion components. The maximum conditional<br />
congestion score across all scenarios and all paths was 2.11 (<strong>Path</strong> 8 in 2020 Aggressive WY Wind<br />
Scenario). The minimum was 0 (multiple occurrences).<br />
Page 4 <strong>of</strong> 4
<strong>Discussion</strong> <strong>of</strong> <strong>WECC</strong> <strong><strong>Path</strong>s</strong><br />
<strong>Alberta</strong> – <strong>British</strong> <strong>Columbia</strong> - <strong>Path</strong> 1<br />
Project Development Impact<br />
The NorthernLights project was added to the relocation <strong>of</strong> 12,000 GWh <strong>of</strong> renewable resources<br />
from California to <strong>Alberta</strong> in a 2019 transmission expansion study. The intention was to compare<br />
congestion results from the transmission expansion case with that <strong>of</strong> the base case, and the<br />
resource relocation case without transmission to better understand how <strong>Path</strong> 1 behaves under<br />
varying assumptions. However, because <strong>of</strong> DC line modeling issues, <strong>Alberta</strong>’s modeled<br />
resource portfolio, and results from the economic dispatch <strong>of</strong> the system, the impact <strong>of</strong> the<br />
NorthernLights project on <strong>Path</strong> 1 was inconclusive and should not be compared to the<br />
congestion results observed in the base case or resource relocation cases. Model results aside,<br />
we do know that with the implementation <strong>of</strong> NorthernLights would result in almost no impact to<br />
<strong>Path</strong> 1 flow. If operated properly, the NorthernLights DC line could transfer all relocated<br />
resource out <strong>of</strong> <strong>Alberta</strong>, leaving no residual impact on <strong>Path</strong> 1.<br />
Other Observations<br />
The analysis identified the <strong>Alberta</strong> – <strong>British</strong> <strong>Columbia</strong> path as being particularly sensitive to<br />
changes in dataset input assumptions. Specifically, the inclusion <strong>of</strong> the MATL project in the<br />
2020 dataset appears to have mitigated congestion identified along <strong>Path</strong> 1 in the 2019 cases.<br />
Some <strong>of</strong> this mitigation may also be due to the modified resource portfolio modeled in <strong>Alberta</strong>,<br />
as previously mentioned. <strong>Path</strong> 1 is a radial path, which makes it particularly sensitive in<br />
production cost model studies to adjustments in transmission and resource assumptions;<br />
therefore, it is reasonable to predict that the utilization <strong>of</strong> the path may be sensitive to load<br />
adjustments as well.<br />
Page 5 <strong>of</strong> 5