NYMTC Regional Pedestrian Safety Study - New York Metropolitan ...
NYMTC Regional Pedestrian Safety Study - New York Metropolitan ...
NYMTC Regional Pedestrian Safety Study - New York Metropolitan ...

You also want an ePaper? Increase the reach of your titles
YUMPU automatically turns print PDFs into web optimized ePapers that Google loves.
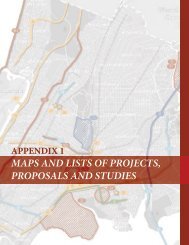
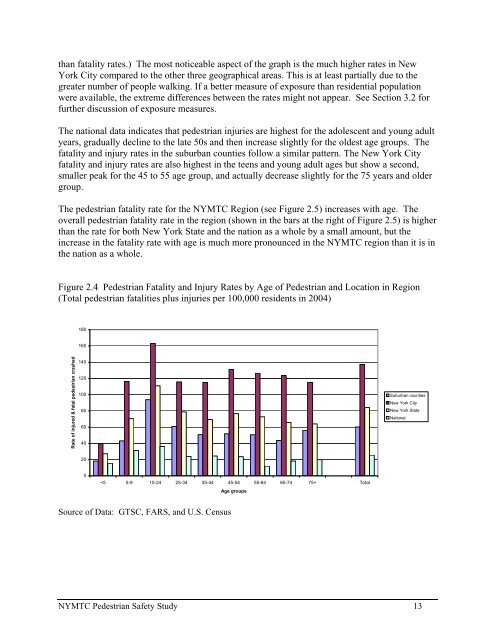
than fatality rates.) The most noticeable aspect of the graph is the much higher rates in <strong>New</strong><br />
<strong>York</strong> City compared to the other three geographical areas. This is at least partially due to the<br />
greater number of people walking. If a better measure of exposure than residential population<br />
were available, the extreme differences between the rates might not appear. See Section 3.2 for<br />
further discussion of exposure measures.<br />
The national data indicates that pedestrian injuries are highest for the adolescent and young adult<br />
years, gradually decline to the late 50s and then increase slightly for the oldest age groups. The<br />
fatality and injury rates in the suburban counties follow a similar pattern. The <strong>New</strong> <strong>York</strong> City<br />
fatality and injury rates are also highest in the teens and young adult ages but show a second,<br />
smaller peak for the 45 to 55 age group, and actually decrease slightly for the 75 years and older<br />
group.<br />
The pedestrian fatality rate for the <strong>NYMTC</strong> Region (see Figure 2.5) increases with age. The<br />
overall pedestrian fatality rate in the region (shown in the bars at the right of Figure 2.5) is higher<br />
than the rate for both <strong>New</strong> <strong>York</strong> State and the nation as a whole by a small amount, but the<br />
increase in the fatality rate with age is much more pronounced in the <strong>NYMTC</strong> region than it is in<br />
the nation as a whole.<br />
Figure 2.4 <strong>Pedestrian</strong> Fatality and Injury Rates by Age of <strong>Pedestrian</strong> and Location in Region<br />
(Total pedestrian fatalities plus injuries per 100,000 residents in 2004)<br />
180<br />
160<br />
Rate of injured & fatal pedestrian crashed<br />
140<br />
120<br />
100<br />
80<br />
60<br />
40<br />
Suburban counties<br />
<strong>New</strong> <strong>York</strong> City<br />
<strong>New</strong> <strong>York</strong> State<br />
National<br />
20<br />
0<br />