A numerical study on the thermal expansion coefficients of fiber
A numerical study on the thermal expansion coefficients of fiber A numerical study on the thermal expansion coefficients of fiber
63 Shapery’s method for transversely isotropic fibers was not based on any mathematical derivation, and was included for comparison purposes only. Agreement between experimental values and Rosen-Hashin and finite element predicted values were usually within about 15%. Predictions from the other methods differed with the experimental data by as much as 50%. The largest deviation between any of the predicted and experimental values for transverse CTE was 27.09 10 -6 /°C, in most cases the deviation was on the order of about 10 10 -6 /°C, and the average deviation is 6.45 10 -6 /°C. Unlike the results for longitudinal CTE, the response of transverse CTE as a function of volume fraction was affected by the fiber/matrix property ratios. E-Glass/ Epoxy, T300/934 and P75/934, P75/CE339 and C6000/PMR15 had similar fiber/matrix property ratios, and exhibited a similar response (Figures 6.2, 6.4, 6.6, 6.8, and 6.10). Decreasing fiber/matrix moduli ratio approximates the finite element results to other analytical methods, except for the Shapery results. The P100/2024Al system (Figure 6.14) had CTE ratios similar to T300/934 and P75/934, but had much smaller moduli ratios. This difference in moduli ratios resulted in a different response of transverse CTE as a function of volume fraction as predicted from the finite element analyses; increasing transverse CTE with increasing volume fraction upto 30% of fiber volume fraction. The HMS/Borosilicate glass (BG) system (Figure 6.12) had much larger CTE property ratios from other material systems. The ratio of longitudinal to transverse CTEs was 2.1 for the HMS/Borosilicate system compared to values ranging from 0.1 to 0.3 for the other material systems evaluated. This difference caused a significantly different response in transverse CTE as a function of volume fraction, increasing transverse CTE with increasing volume fraction for all values of volume fraction.
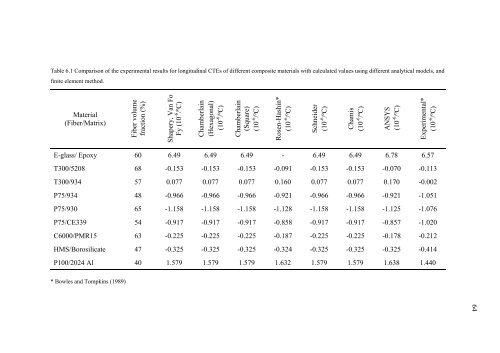
64 Table 6.1 Comparison of the experimental results for longitudinal CTEs of different composite materials with calculated values using different analytical models, and finite element method. Material (Fiber/Matrix) Fiber volume fraction (%) hapery, Van Fo -6 Fy (10 /ºC) Chamberlain (Hexagonal) (10 -6 /ºC) Chamberlain (Square) (10 -6 /ºC) S Rosen-Hashin* (10 -6 /ºC) Schneider (10 -6 /ºC) Chamis (10 -6 /ºC) ANSYS (10 -6 /ºC) Experimental* (10 -6 /ºC) E-glass/ Epoxy 60 6.49 6.49 6.49 - 6.49 6.49 6.78 6.57 T300/5208 68 -0.153 -0.153 -0.153 -0.091 -0.153 -0.153 -0.070 -0.113 T300/934 57 0.077 0.077 0.077 0.160 0.077 0.077 0.170 -0.002 P75/934 48 -0.966 -0.966 -0.966 -0.921 -0.966 -0.966 -0.921 -1.051 P75/930 65 -1.158 -1.158 -1.158 -1.128 -1.158 -1.158 -1.125 -1.076 P75/CE339 54 -0.917 -0.917 -0.917 -0.858 -0.917 -0.917 -0.857 -1.020 C6000/PMR15 63 -0.225 -0.225 -0.225 -0.187 -0.225 -0.225 -0.178 -0.212 HMS/Borosilicate 47 -0.325 -0.325 -0.325 -0.324 -0.325 -0.325 -0.325 -0.414 P100/2024 Al 40 1.579 1.579 1.579 1.632 1.579 1.579 1.638 1.440 * Bowles and Tompkins (1989) 64
- Page 21 and 22: 12 Metals are strong and tough. The
- Page 23 and 24: 14 Table 2.1 Properties of reinforc
- Page 25 and 26: 16 2.2.2.2 Carbon Fibers Carbon is
- Page 27 and 28: 18 use is in aircraft industry foll
- Page 29 and 30: 20 strength and a reasonable Young
- Page 31 and 32: 22 1. Processing the conventional f
- Page 33 and 34: 24 (orthorhombic) of polyethylene h
- Page 35 and 36: 26 Whiskers are monocrystalline sho
- Page 37 and 38: 28 3.2 Factors Affecting the Coeffi
- Page 39 and 40: 30 3.2.4 Thermal Cycling The primar
- Page 41 and 42: 32 3.3.1 Mechanical Dilatometry Thi
- Page 43 and 44: 34 absolute accuracy of about ± 0.
- Page 45 and 46: 36 3.3.3 Strain Gauges This relativ
- Page 47 and 48: 38 • The composite is macroscopic
- Page 49 and 50: 40 3.4.1.3 Equation of Van Fo Fy In
- Page 51 and 52: 42 and the thermal expansion coeffi
- Page 53 and 54: 44 P P 11 33 2 A 22 − A = Det A A
- Page 55 and 56: 46 • A perfect bonding exists at
- Page 57 and 58: CHAPTER FOUR FINITE ELEMENT METHOD
- Page 59 and 60: 50 No matter how the geometry is cr
- Page 61 and 62: 52 displacements and/or rotations a
- Page 63 and 64: CHAPTER FIVE MICROMECHANICAL ANALYS
- Page 65 and 66: 56 5.2 Mesh Creation 10-node tetrah
- Page 67 and 68: 58 carbon fibers were assumed to ha
- Page 69 and 70: 60 Figure 5.6 The displacement fiel
- Page 71: 62 small differences between these
- Page 75 and 76: 66 Longitudinal CTE (1/°C) 2.25E-0
- Page 77 and 78: 68 Longitudinal CTE (1/°C) 2.00E-0
- Page 79 and 80: 70 Longitudinal CTE (1/°C) 4.00E-0
- Page 81 and 82: 72 Longitudinal CTE (1/°C) 1.00E-0
- Page 83 and 84: 74 Ishikava, T., Koyama, K., & Koba
64<br />
Table 6.1 Comparis<strong>on</strong> <strong>of</strong> <strong>the</strong> experimental results for l<strong>on</strong>gitudinal CTEs <strong>of</strong> different composite materials with calculated values using different analytical models, and<br />
finite element method.<br />
Material<br />
(Fiber/Matrix)<br />
Fiber volume<br />
fracti<strong>on</strong> (%)<br />
hapery, Van Fo<br />
-6<br />
Fy (10 /ºC)<br />
Chamberlain<br />
(Hexag<strong>on</strong>al)<br />
(10 -6 /ºC)<br />
Chamberlain<br />
(Square)<br />
(10 -6 /ºC)<br />
S<br />
Rosen-Hashin*<br />
(10 -6 /ºC)<br />
Schneider<br />
(10 -6 /ºC)<br />
Chamis<br />
(10 -6 /ºC)<br />
ANSYS<br />
(10 -6 /ºC)<br />
Experimental*<br />
(10 -6 /ºC)<br />
E-glass/ Epoxy 60 6.49 6.49 6.49 - 6.49 6.49 6.78 6.57<br />
T300/5208<br />
68 -0.153 -0.153 -0.153 -0.091 -0.153 -0.153 -0.070 -0.113<br />
T300/934 57 0.077 0.077 0.077 0.160 0.077 0.077 0.170 -0.002<br />
P75/934 48 -0.966 -0.966 -0.966 -0.921 -0.966 -0.966 -0.921 -1.051<br />
P75/930 65 -1.158 -1.158 -1.158 -1.128 -1.158 -1.158 -1.125 -1.076<br />
P75/CE339 54 -0.917 -0.917 -0.917 -0.858 -0.917 -0.917 -0.857 -1.020<br />
C6000/PMR15 63 -0.225 -0.225 -0.225 -0.187 -0.225 -0.225 -0.178 -0.212<br />
HMS/Borosilicate 47 -0.325 -0.325 -0.325 -0.324 -0.325 -0.325 -0.325 -0.414<br />
P100/2024 Al 40 1.579 1.579 1.579 1.632 1.579 1.579 1.638 1.440<br />
* Bowles and Tompkins (1989)<br />
64


