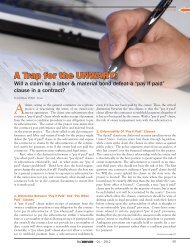
Lateral Load Testing for Pile Design
Lateral Load Testing for Pile Design
Lateral Load Testing for Pile Design

Create successful ePaper yourself
Turn your PDF publications into a flip-book with our unique Google optimized e-Paper software.
<strong>Lateral</strong> <strong>Load</strong> <strong>Testing</strong> <strong>for</strong><br />
<strong>Pile</strong> <strong>Design</strong><br />
Kyle Rollins<br />
Brigham Young University
Wind and Waves in<br />
Hurricanes<br />
Seismic Forces<br />
Ship Impact<br />
Landslides and lateral<br />
spreading in Earthquakes
<strong>Lateral</strong> <strong>Testing</strong><br />
Useful where lateral loads may control design<br />
Main Objective: measure soil resistance of<br />
critical strata<br />
Zone of most influence<br />
Approx top 5 D
Objectives<br />
• Evaluate Soil Resistance<br />
• Confirm <strong>Design</strong> Assumptions<br />
• Improve Reliability<br />
• Reduce Foundation Cost
Stratigraphy & “the big picture”<br />
• Must have good geotech investigation at the<br />
test site and elsewhere<br />
• Consider site variability when interpreting<br />
results & applying to design; site specific<br />
correlations w/ in-situ testing?<br />
• Scourable materials?
Field Test Setup & <strong>Load</strong>ing<br />
• Calibrated Jack, <strong>Load</strong> Cell w/ rot’l bearing<br />
• Long travel jack, displacement transducers<br />
• Strain gages and inclinometers in piles<br />
• Test appropriate stratigraphy!
Single <strong>Pile</strong> <strong>Load</strong> Tests<br />
324 mm OD Steel Pipe <strong>Pile</strong> 600 mm OD Steel Pipe <strong>Pile</strong>
Measurements - Purpose<br />
• Back-fit model to observations<br />
• Evaluate model <strong>for</strong> general soil conditions<br />
across site<br />
• Develop model <strong>for</strong> design (using judgment)<br />
Note: boundary conditions will differ between<br />
test setup & design
Instrumentation & Measurements<br />
• At pile top:<br />
<strong>Load</strong> cell & jack<br />
Displacement<br />
Rotation (use pair of LVDT’s)
I-15 <strong>Lateral</strong> <strong>Load</strong> Test Schematic<br />
Reaction Beam<br />
12.75” Reaction <strong>Pile</strong>s<br />
Swivel-Head End-Platens<br />
LVDT attached to<br />
reference frame<br />
Inclinometer Pipe<br />
12.75” Test <strong>Pile</strong><br />
300 kip <strong>Load</strong> Cell<br />
300 kip Hydraulic Jack<br />
Spacer box
<strong>Load</strong> (kN)<br />
<strong>Load</strong> (kN)<br />
<strong>Load</strong>-Deflection Curve (12.75” Pipe <strong>Pile</strong>)<br />
250<br />
200<br />
150<br />
100<br />
50<br />
Continuous<br />
15th Cycle<br />
Curves<br />
1st Cycle<br />
15th Cycle<br />
0<br />
0 20 40 60 80 100<br />
Deflection (mm)
Instrumentation & Measurements<br />
• Below Grade:<br />
Slope & Displacement<br />
Inclinometer probe<br />
EL-Sensor (downhole inclinometer array)<br />
Shape Array Sensors<br />
Strains
Depth Below Top of <strong>Pile</strong> (ft)<br />
Depth Below Top of <strong>Pile</strong> (ft)<br />
Deflection vs. Depth<br />
Moment vs. Depth<br />
0<br />
Displacement (in)<br />
-1.0 0.0 1.0 2.0 3.0 4.0<br />
0<br />
Moment (kips-ft)<br />
-400 -200 0 200<br />
5<br />
5<br />
10<br />
10<br />
15<br />
10 kips<br />
15<br />
10 kips<br />
20 kips<br />
20 kips<br />
20<br />
40 kips<br />
50 kips<br />
20<br />
40 kips<br />
50 kips<br />
75 kips<br />
75 kips<br />
25<br />
88 kips<br />
95 kips<br />
25<br />
88 kips<br />
95 kips<br />
30<br />
30
Shape Accelerometer Array
Shape Accelerometer Array<br />
Shape Array<br />
Inclinometer Pipe
Depth From Top of Cap (in)<br />
Depth From Top of Cap (in)<br />
Shape Sensor Array<br />
0<br />
Displacement (in)<br />
-0.5 0.0 0.5 1.0 1.5 2.0 2.5 3.0 3.5 4.0<br />
0<br />
Displacement (in)<br />
-0.5 0.0 0.5 1.0 1.5 2.0 2.5 3.0 3.5 4.0<br />
50<br />
50<br />
100<br />
100<br />
150<br />
150<br />
200<br />
200<br />
250<br />
250<br />
300<br />
300<br />
South Array<br />
350<br />
South Inclinometer<br />
350<br />
North Array<br />
400<br />
400<br />
North Inclinometer<br />
450<br />
450<br />
500<br />
500
Strain Gauges<br />
Photos courtesy Applied<br />
Foundation <strong>Testing</strong>
Interpretation of Instrumentation<br />
• M = ε(EI/c)<br />
What is effective I (cracked section)?<br />
What is concrete modulus?<br />
What is precision of strain measurement?
Depth Below Ground Surface (m)<br />
Bending Moment vs Depth<br />
0<br />
Bending Moment (kN-m)<br />
-50 0 50 100 150 200 250<br />
1<br />
2<br />
3<br />
4<br />
5<br />
6<br />
7<br />
8<br />
9<br />
10<br />
11<br />
Deflection<br />
4mm<br />
6mm<br />
13mm<br />
19mm<br />
25mm<br />
38mm<br />
51mm<br />
64mm<br />
76mm<br />
89mm<br />
12
Analysis of <strong>Lateral</strong> <strong>Load</strong> Test Data
<strong>Lateral</strong> <strong>Load</strong> Analysis<br />
H<br />
p<br />
p<br />
p<br />
y<br />
y<br />
Interval<br />
y<br />
2<br />
y<br />
1<br />
Nonlinear<br />
springs<br />
p<br />
p<br />
y<br />
y<br />
y<br />
4<br />
3<br />
y<br />
y<br />
5<br />
After Coduto
Develop <strong>Design</strong> Soil Model<br />
• P-y criteria should reasonably match geotechnical<br />
profile<br />
• Backfit to test results using LPILE or FLPIER<br />
Match load vs displacement response<br />
Match general displacement vs depth and moment vs<br />
depth response<br />
• Nonlinear bending response of the pile can be<br />
important<br />
• Evaluate possible soil variations across site<br />
• Recommend soil parameters <strong>for</strong> design model
Depth below excavated surface (m)<br />
Undrained Strength, s u (kPa)<br />
0 100 200 300<br />
1.34 m<br />
1.07 m<br />
STIFF CLAY<br />
Water Table<br />
s u = 70 kPa 50 = 0.005<br />
k= 136 N/cm3<br />
0.0<br />
1.0<br />
1.65 m<br />
SAND = 36 O k =61 N/cm 3<br />
STIFF CLAY<br />
s u = 105 kPa 50 = 0.005<br />
k= 271 N/cm 3<br />
2.0<br />
3.02 m<br />
3.48 m SAND = 36 O k=61 N/cm 3<br />
4.09 m<br />
STIFF CLAY<br />
s u = 105 kPa 50 = 0.005<br />
k=271.43 N/cm 3<br />
SILTY SAND = 38 O k=61.07 N/cm 3<br />
3.0<br />
4.0<br />
5.15 m<br />
5.0<br />
6.0<br />
Vane Shear Tests<br />
Unconfined Comp. Tests<br />
Avg CPT strength<br />
SOFT CLAY<br />
s u = 35 kPa 50 = 0.01<br />
k= 27 N/cm 3<br />
7.0<br />
8.0<br />
Strength Used in Analysis<br />
9.0<br />
10.0<br />
11.0<br />
12.0
<strong>Load</strong> (kN)<br />
450<br />
Measured & Computed <strong>Load</strong> vs Deflection<br />
400<br />
350<br />
Measured<br />
Computed - LPILE<br />
300<br />
250<br />
200<br />
150<br />
100<br />
50<br />
0<br />
0 5 10 15 20 25 30 35 40 45 50 55<br />
Deflection (mm)
Moment (kN-m)<br />
Computed & Measured Moment vs. <strong>Load</strong><br />
900<br />
800<br />
700<br />
Computed with LPILE<br />
Measured<br />
600<br />
500<br />
400<br />
300<br />
200<br />
100<br />
0<br />
0 100 200 300 400 500<br />
<strong>Load</strong> (kN)
Depth Below Excavated Ground (m)<br />
Computed & Measured<br />
Moment vs Depth<br />
Bending Moment (kN-m)<br />
-100 0 100 200 300 400 500 600 700 800 900<br />
0<br />
1<br />
2<br />
3<br />
4<br />
5<br />
6<br />
7<br />
8<br />
9<br />
133 kN<br />
240 kN<br />
300 kN<br />
414 kN<br />
10<br />
11<br />
12
Use of Model <strong>for</strong> <strong>Design</strong><br />
• Adjust <strong>for</strong> differing pile top boundary<br />
conditions<br />
• Allow <strong>for</strong> scour or other changes<br />
• Allow <strong>for</strong> site variability<br />
• Adjust <strong>for</strong> cyclic loading, group effects, any<br />
other parameters which may not be<br />
reflected in the load test data (liquefaction?)
<strong>Lateral</strong> Statnamic <strong>Load</strong> <strong>Testing</strong><br />
0 to 400 kips in 0.2 seconds<br />
Large Displacement, High Velocity
<strong>Lateral</strong> Statnamic <strong>Testing</strong><br />
• Have Safely Generated <strong>Load</strong>s >1000 tons<br />
• 2000 ton Potential<br />
• <strong>Load</strong> Pulse Can Last Up To 200 ms<br />
• Rate of <strong>Load</strong>ing Similar To Initial Pulse of<br />
Earthquakes, Transient Wind <strong>Load</strong>s, Impact
Schematic of Statnamic Test<br />
Test<br />
Foundation<br />
<strong>Load</strong> Piston<br />
Combustion<br />
Chamber<br />
Statnamic<br />
Sled
Statnamic Test Firing Videos
Downhole Motion Sensors &<br />
Strain Gauges
Equation of Motion<br />
F = F a + F v + F u<br />
= ma + cv + ku<br />
where, F = applied <strong>for</strong>ce (statnamic load cell)<br />
m = mass of the foundation<br />
a = acceleration in g’s<br />
c = damping coefficient<br />
v = velocity<br />
k = static stiffness<br />
u = displacement
<strong>Load</strong> (kN)<br />
Comparison of Dynamic Forces<br />
3000<br />
2500<br />
2000<br />
1500<br />
Fstn<br />
Fa<br />
Fv<br />
Fu<br />
1000<br />
500<br />
0<br />
0.4 0.5 0.6 0.7 0.8 0.9 1<br />
-500<br />
-1000<br />
-1500<br />
-2000<br />
Time (sec)
Damping <strong>for</strong>ce (kN)<br />
<strong>Load</strong> (kN)<br />
Damping<br />
is<br />
the<br />
Difference<br />
3500<br />
3000<br />
2500<br />
2000<br />
1500<br />
1000<br />
500<br />
0<br />
Calculated static load<br />
Measured static load<br />
Statnamic load<br />
0 10 20 30 40<br />
Deflection (mm)<br />
Damping ratios<br />
between 0.3<br />
and 0.5<br />
1400<br />
1200<br />
1000<br />
800<br />
600<br />
400<br />
200<br />
0<br />
0 10 20 30 40<br />
Deflection (mm)
Computation of Equivalent Static Force<br />
Lumped Mass Model<br />
of Drilled Shaft<br />
F s = F stn - ΣM i a i - ΣC i v i
Elevation View of Test Site<br />
3x3 <strong>Pile</strong> Group<br />
High-Speed<br />
Hydraulic Ram<br />
1 m Drilled Shaft<br />
Liquefied Sand<br />
5 m<br />
8 m<br />
Non-Liquefied<br />
Sand
Treasure Island Naval Station<br />
Test Site
Blast Charge Pattern<br />
<strong>Pile</strong> Group<br />
Drilled Shaft<br />
Blast Holes
Ru<br />
Pore Pressure Dissipation Data<br />
1 .2 0<br />
1 .0 0<br />
0 .8 0<br />
0 .6 0<br />
7 .3 m E a st o f A<br />
5 .5 m E a st o f A<br />
4 .3 m E a st o f A<br />
P o int A<br />
3 .2 m W e st o f A<br />
6 .4 m W e st o f A<br />
0 .4 0<br />
0 .2 0<br />
0 .0 0<br />
0 600 1200 1800 2400 3000 3600<br />
T im e [s e c ]
Single <strong>Pile</strong> Test
<strong>Load</strong> (kN)<br />
<strong>Load</strong> vs Deflection Curves <strong>for</strong> Single Pipe <strong>Pile</strong><br />
250<br />
200<br />
150<br />
Non-Liquefied<br />
Liquefied<br />
100<br />
50<br />
0<br />
-50<br />
-100<br />
-50 0 50 100 150 200 250<br />
Displacement (mm)
<strong>Load</strong> (kN)<br />
Ru (%)<br />
100<br />
80<br />
60<br />
40<br />
20<br />
0<br />
-20<br />
-40<br />
200<br />
150<br />
100<br />
0 120 240 360 480 600<br />
Time (sec)<br />
50<br />
0<br />
-50<br />
0 120 240 360 480 600<br />
Time (sec)
Blast Liquefaction Video<br />
(4 <strong>Pile</strong> Group and Shaft)
Depth Below Excavated Ground (m)<br />
Moment Be<strong>for</strong>e & After Liquefaction<br />
-2<br />
Moment (kN-m)<br />
-100 0 100 200 300 400 500<br />
0<br />
2<br />
4<br />
6<br />
8<br />
Be<strong>for</strong>e Liquefaction<br />
10<br />
After Liquefaction<br />
12
Development of p-y Curves<br />
Strain<br />
Curvature<br />
Integrate<br />
Slope<br />
Integrate<br />
Deflection, Y<br />
EI<br />
P-Y curve<br />
Moment<br />
Differentiate<br />
Shear<br />
Differentiate<br />
Distributed<br />
load or<br />
“pressure”, P
Gerber p-y Analysis Routine
Generalized p-y Curves
Computed<br />
vs Measured<br />
Response
Cooper River Bridge<br />
Charleston, South Carolina<br />
Longest Cable-stayed bridge in<br />
North and South America<br />
New Bridge-Completed July 2005
Charleston Statnamic <strong>Testing</strong>
Good Group Behavior
Poor Group Behavior<br />
Angry Mob<br />
Congress<br />
Group IQ = Lowest IQ of anyone in the group
<strong>Pile</strong> Group Interaction<br />
Leading Row <strong>Pile</strong>s<br />
Row 1<br />
Row 2<br />
Trailing Row <strong>Pile</strong>s<br />
Row 3<br />
Direction of<br />
<strong>Load</strong>ing
Horizontal Force/Length, P<br />
P-Multiplier Concept (Brown et al, 1988)<br />
Single <strong>Pile</strong> Curve<br />
P SP<br />
Group <strong>Pile</strong> Curve<br />
P GP = P MULT P SP<br />
Horizontal Displacement, y
P-multipliers from Full-Scale Tests<br />
(Situation in 1998)<br />
Soil Type<br />
(Reference)<br />
Clean Sand<br />
(Brown et al. 1988)<br />
Stiff Clay<br />
(Brown et al. 1987)<br />
Soft Silty Clay<br />
(Meimon et al. 1986)<br />
Front<br />
Row<br />
2 nd<br />
Row<br />
3 rd<br />
Row<br />
0.8 0.4 0.3<br />
0.7 0.5 0.4<br />
0.9 0.5 -<br />
BYU has conducted 11 Full-scale tests over the past 10 years
P-Multiplier<br />
P-multiplier vs. Spacing Curves<br />
1.2<br />
1.0<br />
0.8<br />
0.6<br />
0.4<br />
0.2<br />
0.0<br />
Reese et al (1996)<br />
Reese & Van Impe (2001)<br />
WSDOT (2000)<br />
AASHTO (2000)<br />
US Army (1993)<br />
2 3 4 5 6 7 8<br />
<strong>Pile</strong> Spacing (c-c)/<strong>Pile</strong> Diam.
I-15 <strong>Pile</strong> Group <strong>Testing</strong><br />
• 9 <strong>Pile</strong> Group (324 mm) at 5.6 D Spacing<br />
• 12 <strong>Pile</strong> Group (324 mm) at 4.5 D Spacing<br />
• 15 <strong>Pile</strong> Group (324 mm) at 3.3 D Spacing<br />
• 9 <strong>Pile</strong> Group (600 mm) at 3 D Spacing
15 <strong>Pile</strong> Group at 3.3 D Spacing
9 <strong>Pile</strong> Group at 5.6 D Spacing<br />
Pinned<br />
Connection<br />
LVDT<br />
Tie-Rod<br />
<strong>Load</strong> Cell
Avg. <strong>Pile</strong> <strong>Load</strong> (kN)<br />
9 <strong>Pile</strong> Group at 5.6 D Spacing<br />
250<br />
200<br />
150<br />
100<br />
50<br />
0<br />
Single<br />
Row 1<br />
Row 2<br />
Row 3<br />
0 20 40 60 80<br />
Avg. Group Deflection (mm)
Avg. <strong>Pile</strong> <strong>Load</strong> (kN)<br />
12 <strong>Pile</strong> Group at 4.5 D Spacing<br />
200<br />
150<br />
100<br />
50<br />
0<br />
0 20 40 60 80<br />
Avg. Group Deflection (mm)<br />
Single<br />
Row 1<br />
Row 2<br />
Row 3<br />
Row 4
Avg. <strong>Pile</strong> <strong>Load</strong> (kN)<br />
15 <strong>Pile</strong> Group at 3.3 D Spacing<br />
250<br />
200<br />
150<br />
100<br />
Single<br />
Row 1<br />
Row 2<br />
Row 3<br />
Row 4<br />
Row 5<br />
50<br />
0<br />
0 20 40 60 80 100<br />
Avg. Group Deflection (mm)
Avg. <strong>Pile</strong> <strong>Load</strong> (kN)<br />
9 <strong>Pile</strong> Group at 3 D Spacing<br />
500<br />
400<br />
300<br />
200<br />
100<br />
0<br />
Single<br />
Row 1<br />
Row 2<br />
Row 3<br />
0 20 40 60<br />
Avg. Group Deflection (mm)
P-Multiplier<br />
P-Multiplier<br />
P-multiplier vs Spacing <strong>for</strong> Stiff Clay<br />
(a) Leading Row P-Multipliers<br />
(b) Trailing Row P-Multipliers<br />
1.2<br />
1.0<br />
Reese et al (1996)<br />
1.2<br />
1.0<br />
Reese et al (1996)<br />
0.8<br />
2 ft <strong>Pile</strong><br />
0.8<br />
0.6<br />
0.4<br />
0.2<br />
Brown et al<br />
(1997)<br />
AASHTO (1998)<br />
Stiff Clay-Rollins et al (2003)<br />
0.6<br />
0.4<br />
0.2<br />
2 ft <strong>Pile</strong><br />
2 ft <strong>Pile</strong><br />
Brown et al<br />
(1997)<br />
AASHTO (1998)<br />
Row 2-Stiff Clay Rollins et al (2003)<br />
Rows 3-5-Stiff Clay-Rollins et al (2003)<br />
0.0<br />
2 3 4 5 6 7 8<br />
<strong>Pile</strong> Spacing (c-c)/<strong>Pile</strong> Diam.<br />
0.0<br />
2 3 4 5 6 7 8<br />
<strong>Pile</strong> Spacing (c-c)/<strong>Pile</strong> Diam.<br />
Rollins et al. Oct 2006, ASCE JGGE
P-multiplier Curves vs. Spacing<br />
Rollins et al. Oct 2006, ASCE JGGE<br />
1.2<br />
P-Multiplier, P m<br />
1.0<br />
0.8<br />
0.6<br />
0.4<br />
0.2<br />
0.0<br />
1st Row <strong>Pile</strong>s<br />
2nd Row <strong>Pile</strong>s<br />
3rd or Higher Row <strong>Pile</strong>s<br />
AASHTO<br />
2 3 4 5 6 7 8<br />
<strong>Pile</strong> Spacing (c-c)/<strong>Pile</strong> Diam.
Test<br />
Site<br />
Layout<br />
15 <strong>Pile</strong> Group at<br />
3.9 D Spacing<br />
9 <strong>Pile</strong> Group at<br />
5.6 D Spacing<br />
1.2 m Drilled<br />
Shafts<br />
9 <strong>Pile</strong> Group at<br />
2.8 D Spacing<br />
SLC<br />
Airport<br />
<strong>Pile</strong><br />
Group<br />
Tests
P-Multiplier<br />
P-Multiplier<br />
Group Interaction Reduction Factors<br />
(P-multipliers)<br />
(a) Leading Row P-Multipliers<br />
(b) Trailing Row P-Multipliers<br />
1.2<br />
1.0<br />
Reese et al (1996)<br />
1.2<br />
1.0<br />
Reese et al (1996)<br />
0.8<br />
0.8<br />
0.6<br />
AASHTO (1998)<br />
0.6<br />
AASHTO (1998)<br />
0.4<br />
0.2<br />
0.0<br />
Stiff Clay-Rollins et al (2003)<br />
Soft Clay-This Study<br />
2 3 4 5 6 7 8<br />
<strong>Pile</strong> Spacing (c-c)/<strong>Pile</strong> Diam.<br />
0.4<br />
0.2<br />
0.0<br />
Row 2-Stiff Clay Rollins et al (2003)<br />
Rows 3-5-Stiff Clay-Rollins et al (2003)<br />
Row 2-Soft Clay-This Study<br />
Rows 3-5-Soft Clay-This Study<br />
2 3 4 5 6 7 8<br />
<strong>Pile</strong> Spacing (c-c)/<strong>Pile</strong> Diam.
<strong>Pile</strong> Group <strong>Load</strong> Tests in Sand<br />
3x5 Group at 3.9D Spacing<br />
3x3 Group at 5.65D Spacing<br />
3x3 Group at 3.3D Spacing<br />
2x2 Group at 3.3D Spacing
P-Multiplier<br />
P-Multiplier<br />
P-Multiplier<br />
P-Multipliers vs Spacing (Sand)<br />
(a) 1st Row P-Multipliers<br />
, fm<br />
1.2<br />
1.0<br />
(b) 2nd and 3rd Row P-Multipliers<br />
0.8<br />
1.2<br />
0.6<br />
0.4<br />
0.2<br />
0.0<br />
, fm<br />
1.0<br />
0.8<br />
0.6<br />
0.4<br />
Reese et al (1996)<br />
Full-Scale Tests<br />
Centrifuge Tests<br />
<strong>Design</strong> Line<br />
, fm<br />
AASHTO<br />
Reese et al (1996)<br />
0.8<br />
Full-Scale Tests<br />
2 3 0.2 4 5 6 7 8 Centrifuge Tests<br />
0.6<br />
<strong>Design</strong> Line<br />
<strong>Pile</strong> Spacing 0.0 (c-c)/<strong>Pile</strong> Diam.<br />
AASHTO<br />
2 3 40.4<br />
5 6 7 8<br />
1.2<br />
1.0<br />
<strong>Pile</strong> Spacing 0.2 (c-c)/<strong>Pile</strong> Diam.<br />
0.0<br />
(c) 4th or higher Row P-Multipliers<br />
Reese et al (1996)<br />
Full-Scale Tests<br />
Centrifuge Tests<br />
AASHTO (2000)<br />
2 3 4 5 6 7 8<br />
<strong>Pile</strong> Spacing (c-c)/<strong>Pile</strong> Diam.
Explanation of Variability in Sand<br />
• Natural variability of sand relative to clay<br />
• Sand more influenced by installation<br />
procedure than clays<br />
• Different installation procedures<br />
Jetting<br />
Driven, Open-ended<br />
Sand compacted around previously driven piles<br />
Drilled shafts
Influence of Friction Angle on Group Interaction<br />
Elevation View<br />
45-/2<br />
• Passive failure wedge<br />
inclined at 45-/2.<br />
• As increases the<br />
angle gets smaller and<br />
wedge gets longer.<br />
• Longer wedge causes<br />
more group<br />
interaction.
Influence of Friction Angle on Group Interaction<br />
Plan View<br />
<br />
<br />
• Passive failure wedge<br />
fans out at .<br />
• As increases the<br />
angle gets larger and<br />
wedge gets wider.<br />
• Wider wedge causes<br />
more group<br />
interaction.
P-Multiplier<br />
Influence of Friction Angle on P-multiplier<br />
1.0<br />
Less Group<br />
Interaction<br />
More Group<br />
Interaction<br />
Soft<br />
Clay<br />
Stiff<br />
Clay<br />
Looser<br />
Sand<br />
Denser<br />
Sand<br />
Drained Friction angle, ’
Average <strong>Pile</strong> <strong>Load</strong> (kN)<br />
Post-Liquefaction <strong>Pile</strong> Response<br />
100<br />
80<br />
60<br />
40<br />
20<br />
Single <strong>Pile</strong><br />
Resistance due to<br />
<strong>Pile</strong> alone<br />
Resistance due to<br />
Soil Dilation<br />
0<br />
-20<br />
-40<br />
-60<br />
0 25 50 75 100 125 150 175 200 225 250<br />
Displacement (mm)<br />
P-y curves <strong>for</strong> Liquefied Sand<br />
(ASCE JGGE, Jan 2005)<br />
Built into LPILE/GROUP
Average <strong>Pile</strong> <strong>Load</strong> (kN)<br />
Average <strong>Pile</strong> <strong>Load</strong> (kN)<br />
Post-Liquefaction Group Effects<br />
(10th 200 mm Cycle)<br />
80<br />
100<br />
60<br />
80<br />
40 60<br />
20 40<br />
Lead Row-Group<br />
Single <strong>Pile</strong><br />
Middle<br />
Lead Row-Group<br />
Row-Group<br />
Trail Middle Row-Group<br />
Trail Row-Group<br />
20<br />
0<br />
0<br />
-20<br />
-20<br />
-40<br />
-40<br />
-60<br />
-60<br />
0 25 50 75 100 125 150 175 200 225 250<br />
0 25 50 75 100 125 150 175 200 225 250<br />
Displacement (mm)<br />
Displacement (mm)
Rollins <strong>Pile</strong> Group References<br />
• Rollins, K.M., Olsen, R.J., Egbert, J.J., Jensen, D.H., Olsen, K.G.,<br />
and Garrett, B.H. (2006). “<strong>Pile</strong> Spacing Effects on <strong>Lateral</strong> <strong>Pile</strong><br />
Group Behavior: <strong>Load</strong> Tests.” J. Geotechnical and<br />
Geoenvironmental Engrg., ASCE, Vol. 132, No. 10, October, p.<br />
1262-1271.<br />
• Rollins, K.M., Olsen, K.G., Jensen, D.H, Garrett, B.H., Olsen, R.J.,<br />
and Egbert, J.J. (2006). “<strong>Pile</strong> Spacing Effects on <strong>Lateral</strong> <strong>Pile</strong> Group<br />
Behavior: Analysis.” J. Geotechnical and Geoenvironmental Engrg.,<br />
ASCE, Vol. 132, No. 10, October, p. 1272-1283.<br />
• Rollins, K.M., Lane, J.D., and Gerber, T.M. (2005). “Measured and<br />
Computed <strong>Lateral</strong> Response of a <strong>Pile</strong> Group in Sand.” J.<br />
Geotechnical and Geoenvironmental Engrg, ASCE, Vol. 131, No. 1<br />
Jan., p. 103-114.<br />
• Rollins, K.M., Gerber, T.M., Lane, J.D. and Ash<strong>for</strong>d. S.A. (2005).<br />
“<strong>Lateral</strong> Resistance of a Full-Scale <strong>Pile</strong> Group in Liquefied Sand.”<br />
J. Geotechnical and Geoenvironmental Engrg., ASCE, Vol. 131,<br />
No. 1, p. 115-125.<br />
• Rollins, K.M., Snyder, J.L. and Broderick, R.D. (2005). “Static and<br />
Dynamic <strong>Lateral</strong> Response of a 15 <strong>Pile</strong> Group.” Procs. 16th Intl.<br />
Conf. on Soil Mechanics and Geotech. Engineering, Millpress,<br />
Rotterdam, The Netherlands, Vol. 4, p. 2035-2040.
Brigham Young University Campus<br />
Sponsored by Church of Jesus Christ of Latter Day Saints