Exploratory Spatial Data Analysis - Techniques and Examples
Exploratory Spatial Data Analysis - Techniques and Examples
Exploratory Spatial Data Analysis - Techniques and Examples

Create successful ePaper yourself
Turn your PDF publications into a flip-book with our unique Google optimized e-Paper software.
<strong>Exploratory</strong> <strong>Spatial</strong> <strong>Data</strong> <strong>Analysis</strong> -<br />
<strong>Techniques</strong> <strong>and</strong> <strong>Examples</strong><br />
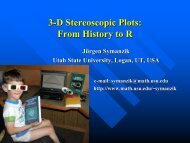
Jürgen Symanzik*,<br />
Utah State University, Logan, UT<br />
*e-mail: symanzik@sunfs<br />
sunfs.math. .math.usu.edu<br />
WWW: http://www.math.usu<br />
usu.edu/~<br />
/~symanzik<br />
with Louise Griffith, Rob Gillies, Di Cook, Jim Majure, Nicholas Lewin-Koh,<br />
Noel Cressie, Sigbert Klinke, Ed Wegman, Adi Wilhelm
■ ESDA<br />
– Definition<br />
– Software<br />
– <strong>Techniques</strong><br />
Contents<br />
■ <strong>Examples</strong><br />
■ Live Demo
ESDA<br />
■ Working Definition:<br />
– Find structure (cluster, unusual observations) in<br />
large <strong>and</strong> not necessarily homogeneous<br />
spatial data sets based on human perception<br />
using graphical methods <strong>and</strong> user interaction<br />
– Goal or expected outcome of exploration<br />
usually unknown in advance
Software: XGobi/GGobi<br />
GGobi<br />
Swayne, , Cook <strong>and</strong> Buja<br />
• Interactive environment for exploring multivariate data<br />
*Linked views allow “linked“<br />
brushing”<br />
*Univariate, Bivariate <strong>and</strong> Multivariate views of the data<br />
*Gr<strong>and</strong> tour<br />
*Wide variety of methods<br />
*Open source<br />
*Free<br />
• Caveats<br />
*XGobi<br />
only on UNIX <strong>and</strong> Linux platforms<br />
*GGobi<br />
also available for PCs but not yet fully developed
Software: ArcView<br />
ESRI TM<br />
TM • Desktop GIS with wide Range of Viewing<br />
<strong>and</strong> <strong>Data</strong> Manipulation Functions<br />
– Editing Features<br />
– Query Operations<br />
– Map Display<br />
– Interactive Interface<br />
– High Level Internal Scripting Language
Features of ArcView/XGobi<br />
XGobi-Link<br />
■ Multivariate Link<br />
■ CDF Link<br />
■ Variogram-cloud Link<br />
■ <strong>Spatial</strong>ly Lagged Scatterplot Link<br />
■ Multivariate Variogram-Cloud Link
Multivariate Link<br />
XGobi<br />
ArcView
CDF Link<br />
XGobi<br />
ArcView
Variogram-Cloud Link<br />
XGobi<br />
ArcView
XGobi<br />
<strong>Spatial</strong>ly Lagged Scatterplot Link
Multivariate Variogram-Cloud Link<br />
XGobi
Software: ExplorN/CrystalVision<br />
Wegman, Luo, , Carr<br />
• Interactive environment for exploring<br />
multivariate data (similar to XGobi/GGobi<br />
GGobi)<br />
*Advanced Parallel Coordinates Displays<br />
*3D Surfaces<br />
*Stereoscopic Displays<br />
• Caveats<br />
*ExplorN<br />
only on SGI platforms<br />
*CrystalVision<br />
available for PCs but not yet fully developed<br />
*No interface to GIS software
ExplorN<br />
Tools: Parallel Coordinate Plots
Tools: Scatterplot Matrix & Density Plot<br />
ExplorN
Tools: Gr<strong>and</strong> Tour<br />
– Continuous r<strong>and</strong>om sequence of<br />
projections from n dimensions into 2 (or<br />
more) dimensions.
<strong>Examples</strong><br />
– Remote Sensing: Vermont/New Hampshire<br />
» Quarry, Water, Clouds<br />
– Remote Sensing: Atlanta<br />
» City, Forest<br />
– Archaeological <strong>Data</strong><br />
» S<strong>and</strong> Particles
The Vermont/New Hampshire <strong>Data</strong><br />
■<br />
■<br />
■<br />
L<strong>and</strong>sat Thematic Mapper (TM) data<br />
6 Spectral B<strong>and</strong>s<br />
Outst<strong>and</strong>ing Water Body is Connecticut River
VT/NH: Field/Quarry/Water
Field/Quarry/Clouds ??
Water = Water ??
■<br />
■<br />
The Atlanta <strong>Data</strong><br />
NOAA-14 Satellite (National Oceanic <strong>and</strong> Atmospheric Administration)<br />
AVHRR Sensor (Advanced Very High Resolution Radiometer):<br />
– B<strong>and</strong> 1: Red<br />
– B<strong>and</strong> 2: Near Infrared<br />
– B<strong>and</strong> 3: Mid Infrared<br />
– B<strong>and</strong> 4: Long Infrared<br />
– B<strong>and</strong> 5: (Very) Long Infrared<br />
■ <strong>Data</strong> from “NASA’s Project Atlanta”<br />
■ 18 Days from Jan 1997 to Dec 1997<br />
■ Resolution: 1 km x 1 km per Pixel<br />
■ Main Study Area: 70 km x 46 km
Some Definitions<br />
■<br />
Normalized Difference Vegetation Index:<br />
NDVI =<br />
B<strong>and</strong> 2<br />
B<strong>and</strong>2<br />
−<br />
+<br />
B<strong>and</strong>1<br />
B<strong>and</strong>1<br />
■ NDVI ~ 0.8 for Highly Vegetated Surfaces<br />
■ NDVI ~ 0.1 for Bare Soil<br />
■<br />
■<br />
Surface Radiant Temperature T 0 : B<strong>and</strong> 4<br />
Surface Moisture Availability M 0
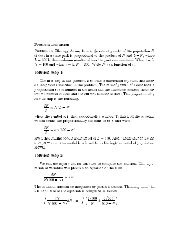
An Example<br />
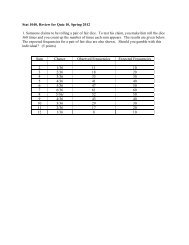
NS001-TMS derived T o -NDVI scatterplot (gray spectral scaling) at a 5 meter spatial resolution for a<br />
7 x 3 km area of the Mahantango Watershed, Pennsylvania. 18 July 1990, 1145 LST. Isopleths<br />
representing moisture availability index, M o are overlaid with the legend, ο = 0.0 (‘warm’ edge), ◊ =<br />
0.2, o = 0.4, ∆ = 0.6, ∇ = 0.8, <strong>and</strong> × = 1.0 (cold edge).
The Main Study Area
NDVI vs Surface Temperature
Two Months<br />
December<br />
August
December<br />
The City<br />
August
August<br />
Clouds in August
Reclassification<br />
December<br />
Linked<br />
December<br />
August
2 Pixels of Interest<br />
December<br />
Linked<br />
December<br />
August
Example: Archaeological <strong>Data</strong><br />
Published as:<br />
Wilhelm, , A. F. X., Wegman, , E. J., Symanzik, J. (1999):<br />
Visual Clustering <strong>and</strong> Classification: The Oronsay Particle<br />
Size <strong>Data</strong> Set Revisited, Computational Statistics: Special<br />
Issue on Interactive Graphical <strong>Data</strong> <strong>Analysis</strong>, Vol. . 14, No.<br />
1, 109-146.
Oronsay S<strong>and</strong> Particles<br />
“The mesolithic shell middens on the isl<strong>and</strong><br />
of Oronsay are one of the most important<br />
archeological sites in Britain. It is of<br />
considerable interest to determine their<br />
position with respect to the mesolithic<br />
coastline. If the s<strong>and</strong> below the midden were<br />
beach s<strong>and</strong> <strong>and</strong> the s<strong>and</strong> from the upper<br />
layers dune s<strong>and</strong>, this would indicate a<br />
seaward shift of the beach-dune interface.”<br />
Flenley <strong>and</strong> Olbricht, 1993
Objective of Study<br />
■ Cluster samples of modern s<strong>and</strong> into<br />
“beach-like” or “dune-like” s<strong>and</strong>.<br />
■ Classify archeological s<strong>and</strong> samples as to<br />
whether they are beach s<strong>and</strong> or dune s<strong>and</strong>.
Oronsay - Geography
Oronsay - <strong>Data</strong> Problems
Oronsay - Parametric <strong>Analysis</strong><br />
■ Historical strategy is to fit parametric<br />
distributions <strong>and</strong> compare modern <strong>and</strong><br />
archeological s<strong>and</strong>s based on parameters.<br />
■ Weibull, , 1933; lognormal (breakage<br />
models), log-hyperbolic, log-skew-Laplace<br />
Laplace,<br />
1937, Barndorff-Nielsen, 1977.<br />
■ Models 2 to 4 parameters, theory developed,<br />
practice problematic.
Oronsay - Visual Approach<br />
■ Multidimensional Parallel Coordinate<br />
Display Combined with Gr<strong>and</strong> Tour.<br />
■ BRUSH-TOUR strategy<br />
– Clusters recognized by gaps in any horizontal axis.<br />
– Brush existing clusters with colors.<br />
– Execute gr<strong>and</strong> tour until new clusters appear, brush<br />
again.<br />
– Continue until clusters are exhausted.
Beach & Dune S<strong>and</strong>
Separation of Clusters
Final Clustering
Oronsay - Conclusions (1)<br />
■ S<strong>and</strong>s from the CC site <strong>and</strong> the CNG site<br />
have considerably different particle size<br />
distributions <strong>and</strong> cannot be effectively<br />
aggregated.<br />
■ <strong>Data</strong> at small <strong>and</strong> at large particle<br />
dimensions is too quantized to be used<br />
effectively.<br />
■ The visual based BRUSH-TOUR strategy is<br />
extremely effective at clustering.
Oronsay Conclusions (2)<br />
■ Midden s<strong>and</strong>s are neither modern beach<br />
s<strong>and</strong>s nor modern dune s<strong>and</strong>s.<br />
■ Midden s<strong>and</strong>s are more similar to modern<br />
dune s<strong>and</strong>s.<br />
■ This result does not support the seaward-<br />
shift-of-the-beach-dune-interface hypothesis,<br />
but suggests the middens were always in the<br />
dunes
GGobi<br />
Live Demo
Overall Conclusion<br />
■ Visual approach effective to see unexpected<br />
structure in data.<br />
■ Combination of different techniques most<br />
effective.<br />
■ Can be used for almost all types of spatial data.
Future Work (1)<br />
■ Enhance new software (e.g., GGobi) ) to<br />
operate in a linked environment with GIS<br />
software.<br />
■ Allow access to data bases.
Future Work (2)<br />
■ Use 3D environment (CAVE, MiniCAVE) ) for<br />
visualization <strong>and</strong> ESDA.
Contact<br />
■ Jürgen Symanzik<br />
– symanzik@sunfs<br />
sunfs.math. .math.usu.edu<br />
■ Website<br />
– www.math.usu<br />
usu.edu/~<br />
/~symanzik