Powerline Plan and Environ. Assessment Jan. 2013 - Flood Control ...
Powerline Plan and Environ. Assessment Jan. 2013 - Flood Control ... Powerline Plan and Environ. Assessment Jan. 2013 - Flood Control ...
Powerline Flood Retarding Structure Pinal County, AZ Draft Supplemental Watershed Plan and Environmental Assessment occurring at the Superstition Mountains Recharge Facility and Scenario 2 was a projection with an operational Superstition Mountains Recharge Facility. Presentation of results included change-in-water-level contours plotted on figures with township boundaries for location reference; results obtained from these figures were considered to be approximate. For this evaluation, the modeled water level changes were estimated for five locations along the CAP Canal and FRS through the study area using the ADWR estimates. These locations are at the southern end of the Rittenhouse FRS, the southern end of the Vineyard Road FRS, SG-6 along the Vineyard Road FRS, the northern end of the Vineyard Road FRS, and the Powerline FRS IDSM alignment Station 20+00. These water level changes are summarized below. Results of the more recent Superstition Mountain Recharge Facility modeling are also summarized below. Modeled Groundwater Levels by Others for Future Subsidence Scenarios Location Powerline FRS IDSM Station 20+00 Change in Groundwater Level, feet Base Case Scenario - No Recharge Facility Scenario 2 - With Recharge Facility 2030 2100 2030 2100 -25 -100 +50 +0 (+30) North Vineyard Road FRS 0 0 +50 +50 Station 350+00 Vineyard Road FRS Station +50 0 +50 +100 (+80) 271+00, Well SG-6 South Vineyard Road FRS +80 0 +50 +150 (+125) Station 90+00, Well SG-10 South Rittenhouse FRS +100 0 +100 +200 Approximately Station 50+00 Note: Groundwater level changes in parentheses are from more current 2009 modeling. 5.1.4. Discussion Known Earth Fissures There are known earth fissures in the Project area near Hawk Rock and one known earth fissure located immediately downstream of the Powerline FRS embankment at about Station 115+45. There also is a high probability that the earth fissure near Station 115+45 extends beneath the existing embankment. It is suspected that subsidence patterns at the Powerline FRS will continue into the future, potentially causing further development of fissures in this area. The earth fissures in the vicinity of Powerline FRS and Hawk Rock appear to follow along or near the crest of buried ridges that radiate from Hawk Rock. The InSAR data show the locations of the implied buried ridges. Previous investigations have included continuous seismic refraction profiling for the purpose of identifying concealed earth fissures. Continuous seismic profiling has occurred along the proposed Powerline IDSM alignment and much of the alignment of Powerline FRS. Other than the earth fissure at about Powerline FRS Station 115+45, there are no known earth fissures in close proximity to the components of the project. It is noted that this earth fissure may be an extension of the known earth fissure located about 700 feet west of the Powerline FRS embankment on the west side of Ironwood Road. USDA- NRCS January 2013 Kimley-Horn and Associates, Inc. Page 35
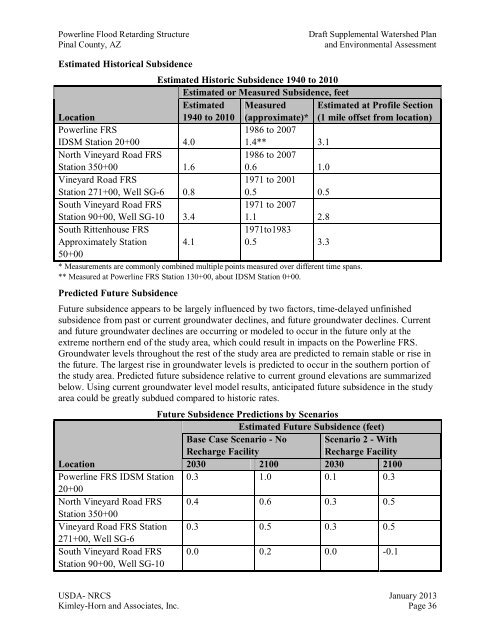
Powerline Flood Retarding Structure Pinal County, AZ Draft Supplemental Watershed Plan and Environmental Assessment Estimated Historical Subsidence Estimated Historic Subsidence 1940 to 2010 Estimated or Measured Subsidence, feet Location Estimated 1940 to 2010 Measured (approximate)* Estimated at Profile Section (1 mile offset from location) Powerline FRS IDSM Station 20+00 4.0 1986 to 2007 1.4** 3.1 North Vineyard Road FRS Station 350+00 1.6 1986 to 2007 0.6 1.0 Vineyard Road FRS Station 271+00, Well SG-6 0.8 1971 to 2001 0.5 0.5 South Vineyard Road FRS Station 90+00, Well SG-10 3.4 1971 to 2007 1.1 2.8 South Rittenhouse FRS Approximately Station 4.1 1971to1983 0.5 3.3 50+00 * Measurements are commonly combined multiple points measured over different time spans. ** Measured at Powerline FRS Station 130+00, about IDSM Station 0+00. Predicted Future Subsidence Future subsidence appears to be largely influenced by two factors, time-delayed unfinished subsidence from past or current groundwater declines, and future groundwater declines. Current and future groundwater declines are occurring or modeled to occur in the future only at the extreme northern end of the study area, which could result in impacts on the Powerline FRS. Groundwater levels throughout the rest of the study area are predicted to remain stable or rise in the future. The largest rise in groundwater levels is predicted to occur in the southern portion of the study area. Predicted future subsidence relative to current ground elevations are summarized below. Using current groundwater level model results, anticipated future subsidence in the study area could be greatly subdued compared to historic rates. Future Subsidence Predictions by Scenarios Estimated Future Subsidence (feet) Base Case Scenario - No Recharge Facility Scenario 2 - With Recharge Facility Location 2030 2100 2030 2100 Powerline FRS IDSM Station 0.3 1.0 0.1 0.3 20+00 North Vineyard Road FRS 0.4 0.6 0.3 0.5 Station 350+00 Vineyard Road FRS Station 0.3 0.5 0.3 0.5 271+00, Well SG-6 South Vineyard Road FRS Station 90+00, Well SG-10 0.0 0.2 0.0 -0.1 USDA- NRCS January 2013 Kimley-Horn and Associates, Inc. Page 36
- Page 95 and 96: Ironwood Rd Gantzel Rd Mountain Vie
- Page 97 and 98: Figure 22 Figure 21 - Conceptual Mu
- Page 99 and 100: K:\PHX_WaterResources\91131019\CADD
- Page 101 and 102: K:\PHX_WaterResources\91131019\CADD
- Page 103 and 104: Exhibit A-2 - Emergency Spillway Di
- Page 105 and 106: Price Price Price Dobson Alma Schoo
- Page 107 and 108: Powerline Flood Retarding Structure
- Page 109 and 110: Powerline Flood Retarding Structure
- Page 111 and 112: Powerline Flood Retarding Structure
- Page 113 and 114: Powerline Flood Retarding Structure
- Page 115 and 116: Powerline Flood Retarding Structure
- Page 117 and 118: Powerline Flood Retarding Structure
- Page 119 and 120: Powerline Flood Retarding Structure
- Page 121 and 122: Powerline Flood Retarding Structure
- Page 123 and 124: Powerline Flood Retarding Structure
- Page 125 and 126: Powerline Flood Retarding Structure
- Page 127 and 128: Powerline Flood Retarding Structure
- Page 129 and 130: Powerline Flood Retarding Structure
- Page 131 and 132: Powerline Flood Retarding Structure
- Page 133 and 134: Powerline Flood Retarding Structure
- Page 135 and 136: Powerline Flood Retarding Structure
- Page 137 and 138: Powerline Flood Retarding Structure
- Page 139 and 140: Powerline Flood Retarding Structure
- Page 141 and 142: Powerline Flood Retarding Structure
- Page 143 and 144: Powerline Flood Retarding Structure
- Page 145: Powerline Flood Retarding Structure
- Page 149 and 150: Powerline Flood Retarding Structure
- Page 151 and 152: Powerline Flood Retarding Structure
- Page 153 and 154: Powerline Flood Retarding Structure
- Page 155 and 156: Powerline Flood Retarding Structure
- Page 157 and 158: Powerline Flood Retarding Structure
- Page 159 and 160: Powerline Flood Retarding Structure
- Page 161 and 162: Powerline Flood Retarding Structure
- Page 163 and 164: Powerline Flood Retarding Structure
- Page 165 and 166: Powerline Flood Retarding Structure
- Page 167 and 168: Powerline Flood Retarding Structure
- Page 169 and 170: Powerline, Vineyard Road and Ritten
- Page 171: Powerline Flood Retarding Structure
<strong>Powerline</strong> <strong>Flood</strong> Retarding Structure<br />
Pinal County, AZ<br />
Draft Supplemental Watershed <strong>Plan</strong><br />
<strong>and</strong> <strong>Environ</strong>mental <strong>Assessment</strong><br />
Estimated Historical Subsidence<br />
Estimated Historic Subsidence 1940 to 2010<br />
Estimated or Measured Subsidence, feet<br />
Location<br />
Estimated<br />
1940 to 2010<br />
Measured<br />
(approximate)*<br />
Estimated at Profile Section<br />
(1 mile offset from location)<br />
<strong>Powerline</strong> FRS<br />
IDSM Station 20+00 4.0<br />
1986 to 2007<br />
1.4** 3.1<br />
North Vineyard Road FRS<br />
Station 350+00 1.6<br />
1986 to 2007<br />
0.6 1.0<br />
Vineyard Road FRS<br />
Station 271+00, Well SG-6 0.8<br />
1971 to 2001<br />
0.5 0.5<br />
South Vineyard Road FRS<br />
Station 90+00, Well SG-10 3.4<br />
1971 to 2007<br />
1.1 2.8<br />
South Rittenhouse FRS<br />
Approximately Station 4.1<br />
1971to1983<br />
0.5 3.3<br />
50+00<br />
* Measurements are commonly combined multiple points measured over different time spans.<br />
** Measured at <strong>Powerline</strong> FRS Station 130+00, about IDSM Station 0+00.<br />
Predicted Future Subsidence<br />
Future subsidence appears to be largely influenced by two factors, time-delayed unfinished<br />
subsidence from past or current groundwater declines, <strong>and</strong> future groundwater declines. Current<br />
<strong>and</strong> future groundwater declines are occurring or modeled to occur in the future only at the<br />
extreme northern end of the study area, which could result in impacts on the <strong>Powerline</strong> FRS.<br />
Groundwater levels throughout the rest of the study area are predicted to remain stable or rise in<br />
the future. The largest rise in groundwater levels is predicted to occur in the southern portion of<br />
the study area. Predicted future subsidence relative to current ground elevations are summarized<br />
below. Using current groundwater level model results, anticipated future subsidence in the study<br />
area could be greatly subdued compared to historic rates.<br />
Future Subsidence Predictions by Scenarios<br />
Estimated Future Subsidence (feet)<br />
Base Case Scenario - No<br />
Recharge Facility<br />
Scenario 2 - With<br />
Recharge Facility<br />
Location<br />
2030 2100 2030 2100<br />
<strong>Powerline</strong> FRS IDSM Station 0.3 1.0 0.1 0.3<br />
20+00<br />
North Vineyard Road FRS 0.4 0.6 0.3 0.5<br />
Station 350+00<br />
Vineyard Road FRS Station 0.3 0.5 0.3 0.5<br />
271+00, Well SG-6<br />
South Vineyard Road FRS<br />
Station 90+00, Well SG-10<br />
0.0 0.2 0.0 -0.1<br />
USDA- NRCS <strong>Jan</strong>uary <strong>2013</strong><br />
Kimley-Horn <strong>and</strong> Associates, Inc. Page 36


