The Atmospheric Information Content of Earth's Far Infrared Spectrum
The Atmospheric Information Content of Earth's Far Infrared Spectrum
The Atmospheric Information Content of Earth's Far Infrared Spectrum

Create successful ePaper yourself
Turn your PDF publications into a flip-book with our unique Google optimized e-Paper software.
THE ATMOSPHERIC INFORMATION CONTENT OF EARTH’S FAR INFRARED<br />
SPECTRUM<br />
by<br />
Aronne Merrelli<br />
A dissertation submitted in partial fulfillment <strong>of</strong><br />
the requirements for the degree <strong>of</strong><br />
Doctor <strong>of</strong> Philosophy<br />
(<strong>Atmospheric</strong> and Oceanic Sciences)<br />
at the<br />
UNIVERSITY OF WISCONSIN–MADISON<br />
2012<br />
Date <strong>of</strong> final oral examination: November 26, 2012<br />
<strong>The</strong> dissertation is approved by the following members <strong>of</strong> the Final Oral Committee:<br />
David D. Turner, Assistant Pr<strong>of</strong>essor, <strong>Atmospheric</strong> and Oceanic Sciences<br />
Steven A. Ackerman, Pr<strong>of</strong>essor, <strong>Atmospheric</strong> and Oceanic Sciences<br />
Ralf Bennartz, Pr<strong>of</strong>essor, <strong>Atmospheric</strong> and Oceanic Sciences<br />
Andrew K. Heidinger, Physical Scientist, Cooperative Inst. for Meteorological Satellite Studies<br />
Grant W. Petty, Pr<strong>of</strong>essor, <strong>Atmospheric</strong> and Oceanic Sciences
i<br />
ABSTRACT<br />
A key component <strong>of</strong> the modern Earth observation system is the Mid-<strong>Infrared</strong> (MIR) hyperspectral<br />
sounder. Operational instruments on polar orbiting satellites are collecting a continuous<br />
record <strong>of</strong> highly accurate infrared spectra with a wide variety <strong>of</strong> applications in geoscience. Although<br />
some research instrumentation early in the development <strong>of</strong> the meteorological satellite used<br />
<strong>Far</strong>-<strong>Infrared</strong> (FIR) sensitive detectors, the primary focus <strong>of</strong> infrared instrumentation has been the<br />
MIR region. Recent developments in FIR instrumentation and a renewed interest in the FIR for<br />
climate applications has brought attention to this underexplored part <strong>of</strong> Earth’s <strong>Infrared</strong> spectrum.<br />
<strong>The</strong> information content <strong>of</strong> Earth’s FIR spectrum is investigated within a modeling framework<br />
that simulates satellite observations <strong>of</strong> FIR and MIR spectra at hyperspectral resolution. <strong>The</strong><br />
framework allows for direct comparison <strong>of</strong> the two spectral ranges, which can quantify the potential<br />
benefits <strong>of</strong> combining FIR spectral observations with the state <strong>of</strong> the art MIR observations.<br />
<strong>The</strong> framework is first applied to investigate the information content for retrieving the vertical temperature<br />
and water vapor pr<strong>of</strong>ile in clear sky conditions. <strong>The</strong> FIR shows additional sensitivity to<br />
upper tropospheric and lower stratospheric water vapor, and a slight but consistent vertical resolution<br />
advantage relative to the MIR. By extending the simulation framework to include layer clouds<br />
composed <strong>of</strong> ice particles, the information content in cloudy sky pr<strong>of</strong>iles and cloud properties<br />
is investigated. In certain conditions, the FIR shows additional pr<strong>of</strong>iling information transmitted<br />
through the cloud layer and additional information above the cloud through the interaction between<br />
water vapor absorption and ice particle scattering and absorption. Finally, the including FIR spectra<br />
increases information content for cloud properties in cases where the MIR has poor sensitivity.<br />
<strong>The</strong>se cases include high optical depth clouds and clouds with particle effective radius. Error propagation<br />
calculations are used to estimate the improvement on the resulting cloud Ice Water Path
ii<br />
(IWP). <strong>The</strong>se results suggest extending the spectral coverage <strong>of</strong> the hyperspectral sounder into the<br />
FIR would improve the retrieval <strong>of</strong> several important geophysical quantities.
iii<br />
ACKNOWLEDGMENTS<br />
Reflecting on my non-traditional path back to grad school, I realize there are quite a few people<br />
who have helped me along the way, and many places where things just had to “line-up” to bring<br />
me to this point in my career. Before applying to grad school in atmospheric science, I was lucky<br />
to work for a great team at Ball Aerospace that gave me my first exposure to research in remote<br />
sensing. Working with Chris Borel and Mark Manzardo helped to show me that remote sensing<br />
would be a rewarding career path. I learned a lot from them about the process <strong>of</strong> applying theory<br />
to practical problems. <strong>The</strong> support <strong>of</strong> my supervisors, Bryan Everding and Lynne Vettel, was<br />
extremely helpful as I was able to pursue engineering graduate studies in the Electro Optics department<br />
at the University <strong>of</strong> Dayton. <strong>The</strong> support and teaching at UD was excellent in all regards<br />
and I learned a great deal. In particular, Brad Duncan, Russ Hardie, and Andrew Sarangan were<br />
excellent teachers mentors during my time at UD. I would later discover that solving Maxwell’s<br />
equations in a cylindrical waveguide is excellent practice for tackling GFD problems!<br />
After finishing a master’s degree at UD, I was making yet another turn in my career path when<br />
I decided to return to grad school full time. <strong>Atmospheric</strong> science was a change to a new field, and<br />
I had a very incomplete picture <strong>of</strong> its research community. In hindsight, I was very lucky to have<br />
chosen to apply to the University <strong>of</strong> Wisconsin, since at the time I did not fully appreciate this<br />
institution’s role as a world leader in satellite meteorology. I would like to thank Steve Ackerman<br />
for taking the time to contact me during the application process and showcasing CIMSS and AOS<br />
as an excellent environment for graduate research.<br />
At UW, I have had the pleasure to work with many excellent pr<strong>of</strong>essors and research scientists.<br />
Each member <strong>of</strong> my committee has provided valuable support and advice at various stages <strong>of</strong> my<br />
research, and I thank them for their willingness to support my dissertation. Dan Vimont contributed
iv<br />
a great deal to my research using the NCAR CESM. Discussions with Dan helped me work through<br />
the practical issues that arise while running a GCM as well as the statistical issues involved with<br />
interpreting GCM data.<br />
Within SSEC and CIMSS, I have benefited from the advice and expertise <strong>of</strong> many, in particular<br />
Bryan Baum, Paolo Antonelli, Eva Borbas, Bob Knuteson, Dave Tobin, Hank Revercomb, and<br />
Bob Holz. Whether it was sharing a dataset, a useful MATLAB function, or explaining the inner<br />
workings <strong>of</strong> an FTS, I greatly appreciate all the assistance. I would also like to thank the SSEC<br />
Technical Computing group, especially for support with the computing cluster which I have used<br />
extensively in this research.<br />
Finally, I would like to thank my research adviser, Dave Turner, for all <strong>of</strong> his time and energy<br />
invested in this dissertation. Since Dave had to relocate to NSSL partway through my time at UW,<br />
we have had to deal with the “long distance” advising problem. Many times people would ask me<br />
how this was working out. In many cases I am sure that a student’s research has suffered due to<br />
the difficulties <strong>of</strong> a remote adviser. Fortunately, this never became a problem. Dave has always<br />
been extremely reliable with our “semi-weekly” teleconferences while balancing his time between<br />
a number <strong>of</strong> other projects and meetings at NSSL.<br />
This work was partially supported by the NASA grant NNX08AP44G as part <strong>of</strong> the CLARREO<br />
program, and DOE grant DE-FG02-06ER64167 as part <strong>of</strong> the ARM program.
v<br />
TABLE OF CONTENTS<br />
ABSTRACT . . . . . . . . . . . . . . . . . . . . . . . . . . . . . . . . . . . . . . . . . . i<br />
Page<br />
LIST OF FIGURES . . . . . . . . . . . . . . . . . . . . . . . . . . . . . . . . . . . . . .<br />
LIST OF TABLES . . . . . . . . . . . . . . . . . . . . . . . . . . . . . . . . . . . . . . .<br />
viii<br />
xi<br />
1 Introduction . . . . . . . . . . . . . . . . . . . . . . . . . . . . . . . . . . . . . . . . 1<br />
2 Background . . . . . . . . . . . . . . . . . . . . . . . . . . . . . . . . . . . . . . . . 7<br />
2.1 A Brief Review <strong>of</strong> <strong>Infrared</strong> Satellite Sensors . . . . . . . . . . . . . . . . . . . . 7<br />
2.2 Applications <strong>of</strong> IR Sounder Data . . . . . . . . . . . . . . . . . . . . . . . . . . . 9<br />
2.2.1 Sounding: measuring the vertical thermodynamic pr<strong>of</strong>ile <strong>of</strong> the atmosphere 10<br />
2.2.2 Cloud Property Retrieval . . . . . . . . . . . . . . . . . . . . . . . . . . . 11<br />
2.2.3 Trace Gas Retrieval . . . . . . . . . . . . . . . . . . . . . . . . . . . . . . 13<br />
2.2.4 Surface Emissivity . . . . . . . . . . . . . . . . . . . . . . . . . . . . . . 13<br />
2.3 Key material properties in the FIR and relationships to remote sensing . . . . . . . 14<br />
2.3.1 Water Vapor absorption . . . . . . . . . . . . . . . . . . . . . . . . . . . . 14<br />
2.3.2 Blackbody Peak Radiance and Spectral Cooling . . . . . . . . . . . . . . . 15<br />
2.3.3 Ice and Water Index <strong>of</strong> Refraction . . . . . . . . . . . . . . . . . . . . . . 16<br />
2.3.4 Trace Gases . . . . . . . . . . . . . . . . . . . . . . . . . . . . . . . . . . 18<br />
2.3.5 Surface Emissivity . . . . . . . . . . . . . . . . . . . . . . . . . . . . . . 19<br />
2.4 Future Directions . . . . . . . . . . . . . . . . . . . . . . . . . . . . . . . . . . . 21<br />
2.5 Summary . . . . . . . . . . . . . . . . . . . . . . . . . . . . . . . . . . . . . . . 23<br />
3 Methods . . . . . . . . . . . . . . . . . . . . . . . . . . . . . . . . . . . . . . . . . . 24<br />
3.1 Algorithms . . . . . . . . . . . . . . . . . . . . . . . . . . . . . . . . . . . . . . 24<br />
3.1.1 Optimal Estimation (OE) . . . . . . . . . . . . . . . . . . . . . . . . . . . 24<br />
3.1.2 OE Based Metrics . . . . . . . . . . . . . . . . . . . . . . . . . . . . . . 27<br />
3.1.3 OE Channel Selection . . . . . . . . . . . . . . . . . . . . . . . . . . . . 29<br />
3.2 Forward Models . . . . . . . . . . . . . . . . . . . . . . . . . . . . . . . . . . . . 32<br />
3.2.1 LBLRTM . . . . . . . . . . . . . . . . . . . . . . . . . . . . . . . . . . . 32
vi<br />
Page<br />
3.2.2 LBLDIS . . . . . . . . . . . . . . . . . . . . . . . . . . . . . . . . . . . 33<br />
3.3 Framework Details . . . . . . . . . . . . . . . . . . . . . . . . . . . . . . . . . . 34<br />
3.3.1 State Vector . . . . . . . . . . . . . . . . . . . . . . . . . . . . . . . . . . 34<br />
3.3.2 Prior State and Covariance . . . . . . . . . . . . . . . . . . . . . . . . . . 35<br />
3.3.3 Forward Model and Jacobian . . . . . . . . . . . . . . . . . . . . . . . . . 38<br />
3.3.4 Sensor Description, Including Measurement Covariance . . . . . . . . . . 40<br />
4 <strong>Information</strong> <strong>Content</strong> in Clear Sky Pr<strong>of</strong>iles . . . . . . . . . . . . . . . . . . . . . . . 44<br />
4.1 Methods . . . . . . . . . . . . . . . . . . . . . . . . . . . . . . . . . . . . . . . . 44<br />
4.1.1 Modeled Sensors . . . . . . . . . . . . . . . . . . . . . . . . . . . . . . . 44<br />
4.1.2 State Vector . . . . . . . . . . . . . . . . . . . . . . . . . . . . . . . . . . 45<br />
4.1.3 Clear Sky Priors . . . . . . . . . . . . . . . . . . . . . . . . . . . . . . . 45<br />
4.1.4 Ad Hoc Channel Selections . . . . . . . . . . . . . . . . . . . . . . . . . 45<br />
4.2 Results . . . . . . . . . . . . . . . . . . . . . . . . . . . . . . . . . . . . . . . . . 47<br />
4.2.1 Simulated Forward Model Errors . . . . . . . . . . . . . . . . . . . . . . 47<br />
4.2.2 Applied OE Channel Selection . . . . . . . . . . . . . . . . . . . . . . . . 51<br />
4.2.3 Constrained OE Channel Selections . . . . . . . . . . . . . . . . . . . . . 53<br />
4.2.4 <strong>Information</strong> <strong>Content</strong> . . . . . . . . . . . . . . . . . . . . . . . . . . . . . 58<br />
4.2.5 Vertical Resolution . . . . . . . . . . . . . . . . . . . . . . . . . . . . . . 65<br />
4.3 Summary . . . . . . . . . . . . . . . . . . . . . . . . . . . . . . . . . . . . . . . 68<br />
5 <strong>Information</strong> <strong>Content</strong> in Cloudy Sky Pr<strong>of</strong>iles . . . . . . . . . . . . . . . . . . . . . . 71<br />
5.1 Methods . . . . . . . . . . . . . . . . . . . . . . . . . . . . . . . . . . . . . . . . 71<br />
5.1.1 Modeling Framework . . . . . . . . . . . . . . . . . . . . . . . . . . . . . 71<br />
5.1.2 Single Scattering Optical Properties . . . . . . . . . . . . . . . . . . . . . 72<br />
5.1.3 Surface Emissivity . . . . . . . . . . . . . . . . . . . . . . . . . . . . . . 76<br />
5.1.4 State Vector . . . . . . . . . . . . . . . . . . . . . . . . . . . . . . . . . . 78<br />
5.1.5 Model Error . . . . . . . . . . . . . . . . . . . . . . . . . . . . . . . . . . 80<br />
5.1.6 IWP and IWP Error Propagation . . . . . . . . . . . . . . . . . . . . . . . 81<br />
5.2 Results . . . . . . . . . . . . . . . . . . . . . . . . . . . . . . . . . . . . . . . . . 83<br />
5.2.1 <strong>The</strong>rmodynamic Pr<strong>of</strong>ile . . . . . . . . . . . . . . . . . . . . . . . . . . . 84<br />
5.2.2 Cloud Microphysics . . . . . . . . . . . . . . . . . . . . . . . . . . . . . 85<br />
5.2.3 IWP . . . . . . . . . . . . . . . . . . . . . . . . . . . . . . . . . . . . . . 90<br />
5.3 Summary . . . . . . . . . . . . . . . . . . . . . . . . . . . . . . . . . . . . . . . 95<br />
6 Discussion . . . . . . . . . . . . . . . . . . . . . . . . . . . . . . . . . . . . . . . . . 96<br />
6.1 Applications <strong>of</strong> FIR Radiative Transfer and Remote Sensing . . . . . . . . . . . . 96
vii<br />
Appendix<br />
Page<br />
6.1.1 FIR Small Particle Signatures in Anvil Clouds . . . . . . . . . . . . . . . 96<br />
6.1.2 FIR Radiative Transfer in GCMs . . . . . . . . . . . . . . . . . . . . . . . 99<br />
6.2 Future Research . . . . . . . . . . . . . . . . . . . . . . . . . . . . . . . . . . . . 100<br />
APPENDICES<br />
Appendix A: List <strong>of</strong> Satellite Instruments . . . . . . . . . . . . . . . . . . . . . . . . 115<br />
Appendix B: IWP derivatives . . . . . . . . . . . . . . . . . . . . . . . . . . . . . . 120
viii<br />
LIST OF FIGURES<br />
Figure<br />
Page<br />
1.1 Solar spectral irradiance and Earth spectral emittance, showing commonly used division<br />
between longwave and shortwave spectral regions . . . . . . . . . . . . . . . . . 2<br />
1.2 Further division <strong>of</strong> longwave spectrum into submillimeter, FIR and MIR . . . . . . . . 5<br />
2.1 Spectral refractive index <strong>of</strong> liquid water and ice . . . . . . . . . . . . . . . . . . . . . 12<br />
2.2 Black body radiance ratios . . . . . . . . . . . . . . . . . . . . . . . . . . . . . . . . 17<br />
2.3 Absorption line strength for trace gases . . . . . . . . . . . . . . . . . . . . . . . . . 20<br />
2.4 Spectral surface emissivity in the FIR and MIR . . . . . . . . . . . . . . . . . . . . . 22<br />
3.1 Example averaging kernels for retrieved temperature and water vapor pr<strong>of</strong>iles . . . . . 30<br />
3.2 Example synthetic covariance and correlation matrices . . . . . . . . . . . . . . . . . 36<br />
3.3 Example covariance and correlation matrices computed from radiosonde pr<strong>of</strong>ile measurements<br />
. . . . . . . . . . . . . . . . . . . . . . . . . . . . . . . . . . . . . . . . . 39<br />
3.4 NEDR curves for simulated spectrometers . . . . . . . . . . . . . . . . . . . . . . . . 42<br />
4.1 Prior mean pr<strong>of</strong>iles <strong>of</strong> temperature and water vapor for clear sky composite priors . . . 46<br />
4.2 Simulated brightness temperature spectrum showing locations <strong>of</strong> ignored channels . . 48<br />
4.3 Summary <strong>of</strong> RMS retrieval error in temperature and water vapor pr<strong>of</strong>iles . . . . . . . 52<br />
4.4 Cumulative DFS fraction in OE selected channel list . . . . . . . . . . . . . . . . . . 54<br />
4.5 Simulated brightness temperature spectrum showing locations <strong>of</strong> OE selected channels 55<br />
4.6 Constrained OE channel selection lists using baseline FIR and MIR spectrometers . . 57
ix<br />
Figure<br />
Page<br />
4.7 Constrained OE channel selection lists using high noise FIR and baseline MIR spectrometers<br />
. . . . . . . . . . . . . . . . . . . . . . . . . . . . . . . . . . . . . . . . . 59<br />
4.8 Summary <strong>of</strong> DFS results for temperature and water vapor pr<strong>of</strong>ile retrievals using various<br />
spectrometer specifications and mean prior pr<strong>of</strong>iles . . . . . . . . . . . . . . . . 61<br />
4.9 DFS pr<strong>of</strong>iles for temperature and water vapor using different a priori covariances and<br />
mean prior pr<strong>of</strong>iles . . . . . . . . . . . . . . . . . . . . . . . . . . . . . . . . . . . . 63<br />
4.10 Change in DFS pr<strong>of</strong>ile due to spectrometer noise level . . . . . . . . . . . . . . . . . 64<br />
4.11 Change in DFS pr<strong>of</strong>ile due to spectrometer spectral resolution . . . . . . . . . . . . . 64<br />
4.12 Averaging kernel FWHM pr<strong>of</strong>iles for temperature and water vapor using different a<br />
priori covariances and mean prior pr<strong>of</strong>iles . . . . . . . . . . . . . . . . . . . . . . . . 66<br />
4.13 Summary <strong>of</strong> averaging kernel FWHM results for temperature and water vapor pr<strong>of</strong>ile<br />
retrievals . . . . . . . . . . . . . . . . . . . . . . . . . . . . . . . . . . . . . . . . . 67<br />
4.14 DFS change between baseline FIR and high noise FIR spectra when combined with<br />
baseline MIR spectra . . . . . . . . . . . . . . . . . . . . . . . . . . . . . . . . . . . 70<br />
5.1 Volume-dimension relationship for particles from Yang et al. (2005) database . . . . . 73<br />
5.2 Example alternate form gamma function PSDs . . . . . . . . . . . . . . . . . . . . . 75<br />
5.3 Bulk single scattering properties for solid column aggregates . . . . . . . . . . . . . . 77<br />
5.4 Spectral surface emissivity model for FIR and MIR . . . . . . . . . . . . . . . . . . . 79<br />
5.5 Model error covariance matrix . . . . . . . . . . . . . . . . . . . . . . . . . . . . . . 82<br />
5.6 Change in cloudy atmosphere DFS pr<strong>of</strong>ile from adding FIR to MIR spectral measurements<br />
. . . . . . . . . . . . . . . . . . . . . . . . . . . . . . . . . . . . . . . . . . . 86<br />
5.7 Comparison <strong>of</strong> selected Jacobian pr<strong>of</strong>iles . . . . . . . . . . . . . . . . . . . . . . . . 87<br />
5.8 Total DFS change for all above cloud and below cloud levels from adding FIR to MIR<br />
measurements . . . . . . . . . . . . . . . . . . . . . . . . . . . . . . . . . . . . . . . 88<br />
5.9 DFS and posterior error in cloud and surface properties for MIR-only measurement . . 91
x<br />
Figure<br />
Page<br />
5.10 DFS and posterior error in cloud and surface properties for a combined (FIR + MIR)<br />
measurement . . . . . . . . . . . . . . . . . . . . . . . . . . . . . . . . . . . . . . . 92<br />
5.11 DFS increase and posterior error reduction in cloud microphysical properties, from<br />
adding FIR to MIR-only measurements . . . . . . . . . . . . . . . . . . . . . . . . . 93<br />
5.12 IWP error in MIR-only measurement, and improvement in IWP error from adding<br />
FIR measurement . . . . . . . . . . . . . . . . . . . . . . . . . . . . . . . . . . . . . 94<br />
6.1 Example retrieval <strong>of</strong> ice particle effective size in anvil clouds associated with strong<br />
convective storms . . . . . . . . . . . . . . . . . . . . . . . . . . . . . . . . . . . . . 97<br />
6.2 Simulated brightness temperature spectra showing differences between different parts<br />
<strong>of</strong> an anvil cloud . . . . . . . . . . . . . . . . . . . . . . . . . . . . . . . . . . . . . 98<br />
6.3 Zonal average heating rate changes in CESM integrations with updates to the water<br />
vapor continuum model . . . . . . . . . . . . . . . . . . . . . . . . . . . . . . . . . 101<br />
Appendix<br />
Figure
xi<br />
LIST OF TABLES<br />
Table<br />
Page<br />
1.1 Spectral Region Definitions . . . . . . . . . . . . . . . . . . . . . . . . . . . . . . . 4<br />
3.1 Key characteristics <strong>of</strong> the simulated instrument. . . . . . . . . . . . . . . . . . . . . . 41<br />
5.1 Assumed prior variances for additional pr<strong>of</strong>iles in cloudy simulations . . . . . . . . . 80<br />
Appendix<br />
Table<br />
A.1 Satellite instrument acronym list . . . . . . . . . . . . . . . . . . . . . . . . . . . . . 116<br />
A.2 <strong>Infrared</strong> Satellite Instrument list . . . . . . . . . . . . . . . . . . . . . . . . . . . . . 117<br />
A.3 Submillimeter Satellite Instrument list . . . . . . . . . . . . . . . . . . . . . . . . . . 118<br />
A.4 <strong>Far</strong> <strong>Infrared</strong> instrument list . . . . . . . . . . . . . . . . . . . . . . . . . . . . . . . . 119
1<br />
Chapter 1<br />
Introduction<br />
Understanding Earth’s weather and climate requires detailed knowledge <strong>of</strong> the energy flows<br />
in and out <strong>of</strong> the system, at a wide variety <strong>of</strong> spatial and temporal scales, across a wide swath <strong>of</strong><br />
the electromagnetic spectrum. From this planetary perspective, it is most convenient to split the<br />
spectrum according to the energy flow into the Earth system from the Sun, called the “shortwave”<br />
radiation, and the energy flow out from the Earth in the form <strong>of</strong> “longwave” radiation. This split<br />
is also useful to classify passive remote sensing techniques. In large part, when studying radiative<br />
processes in the shortwave region, the problem can be considered one <strong>of</strong> scattering, reflection,<br />
and absorption <strong>of</strong> the incident irradiance from the Sun, with no emission at all from any terrestrial<br />
sources. In the longwave region, the problem is now typically dominated by emission from<br />
terrestrial sources, with some scattering and reflection depending on specific wavelength in consideration.<br />
<strong>The</strong> solar term in the longwave can be taken as zero, since it is orders <strong>of</strong> magnitude<br />
smaller than the terrestrial terms (Figure 1.1). <strong>The</strong> separation between these two regimes is not a<br />
sharp boundary, but typically a wavelength <strong>of</strong> roughly 4µm (wavenumber 2500 cm −1 ) is a reasonable<br />
choice. Wavelengths near this value are neither purely “shortwave” nor “longwave” in their<br />
characteristics, and exhibit radiative influence from all <strong>of</strong> the above processes.<br />
<strong>The</strong> longwave spectrum can be further divided into several primary spectral bands. <strong>The</strong> lowest<br />
frequency region, microwave, can be taken as < 300 GHz (or equivalently a wavelength <strong>of</strong> > 1<br />
mm). This <strong>of</strong> course includes radio waves, but for purposes <strong>of</strong> meteorology, radio waves are not<br />
typically relevant so can be ignored in this discussion. <strong>The</strong> highest frequency region is the infrared,
2<br />
10 2<br />
wavelength [µm]<br />
100.00 10.00 1.00<br />
TOA Solar Irradiance<br />
TOA Earth Emittance<br />
BB @ 6000 K<br />
BB @ 280 K<br />
mW / (m 2 cm −1 )<br />
10 1<br />
10 0<br />
10 2 10 3 10 4<br />
wavenumber [1/cm]<br />
Figure 1.1 <strong>The</strong> solar spectral irradiance, for zero degree zenith angle, and the earth spectral<br />
emittance (for a clear sky standard atmosphere) at the top <strong>of</strong> the atmosphere. <strong>The</strong> solid vertical<br />
line marks the longwave-shortwave division at wavenumber <strong>of</strong> 2500 cm −1 (4 µm wavelength).<br />
Earth spectrum computed from LBLRTM, Solar spectrum from (Kurucz, 1992).
3<br />
which is defined here as frequencies <strong>of</strong> > 3 THz (100 cm −1 ) or equivalently wavelengths < 100<br />
µm. Between these two regimes is the submillimeter band, covering wavelengths between 1 and<br />
0.1 mm (0.3–3 THz). <strong>The</strong> infrared can be further split into two regions, the far and mid infrared,<br />
at a wavenumber <strong>of</strong> 667 cm −1 (15 µm wavelength). Typically another division at perhaps 1500<br />
cm −1 (6.7µm wavelength) would be made to separate mid infrared from “shortwave” infrared (not<br />
to be confused with the definition “shortwave” radiation above), but that distinction is not relevant<br />
to the discussion at hand, so the entire band 667–2500 cm −1 (15–4 µm) will be considered as the<br />
MIR band. <strong>The</strong>se spectral range definitions are summarized in Table 1.1. Figure 1.2 shows these<br />
definitions as annotations on over a simulated brightness temperature spectrum.<br />
Although these different regimes throughout the longwave have significantly different scattering<br />
characteristics for atmospheric particles because <strong>of</strong> the wide range in scattering size parameter,<br />
the radiative transfer problem is actually quite similar across the entire range, especially in cloudfree<br />
atmospheres. Thus, to some extent the divisions between these regimes are made to reflect<br />
the specific technology used to make instrumentation for the given frequency range. For example,<br />
microwave instruments <strong>of</strong>ten use coherent detection with heterodyne receivers, while infrared<br />
detectors are typically photoelectric. In fact, one <strong>of</strong> the reasons for the lack <strong>of</strong> observations in<br />
the FIR region is the lack <strong>of</strong> mature instrumentation choices. MIR photodetectors can be created<br />
with sensitivity to longer wavelengths, and thus lower energy photons, by engineering materials<br />
with smaller band gap energies. At such small band gaps, the thermal electron energy must be<br />
greatly reduced to prevent an overwhelming background signal; this implies much lower temperature<br />
cooling systems which add significant cost and complexity. From the other direction,<br />
microwave systems can be designed for higher frequencies. Some recent limb sounding missions<br />
have had used channels at 500 GHz and 600 GHz (Odin, Nordh et al. (2003), SMILES, Takahashi<br />
et al. (2010)), and the highest frequency reached was the 2.25 THz channel on the Aura MLS<br />
(Schoeberl et al., 2006). Higher frequencies are not easily measured with coherent techniques, as<br />
it becomes difficult to construct reliable local oscillators at these high frequencies (Evans et al.,<br />
2002). Direct detection at these frequencies can be done with bolometers, but achieving low noise<br />
requires advanced detector technologies such as high temperature superconducting films. This in
4<br />
an area <strong>of</strong> ongoing research (Kreisler and Gaugue, 2000), but no recent missions in atmospheric<br />
science have used this technology.<br />
Both the microwave and the mid-infrared are very well studied, with a long heritage back to<br />
the some <strong>of</strong> the original scientific missions flown on the first space launch missions. Many <strong>of</strong><br />
the modern techniques were first tested on a series <strong>of</strong> pathfinding instruments in the 1960’s and<br />
1970’s as part <strong>of</strong> the Nimbus program. Two experiments in the Nimbus series did examine parts<br />
<strong>of</strong> the FIR spectrum. <strong>The</strong> IRIS spectrometer had a low frequency cut<strong>of</strong>f at 400 cm −1 ; the ITPR<br />
instrument used a 460–540 cm −1 channel (Atlas, 1969). <strong>The</strong> focus on meteorological missions<br />
since that time however has focused on MIR spectral regions. <strong>The</strong> reasons for this shift are not<br />
well documented, but are likely related to the relative advantage <strong>of</strong> using MIR photodetectors, as<br />
described above. <strong>The</strong> initial FIR-sensitive instruments used pyroelectric and bolometric devices<br />
as detectors; it is likely these were outperformed by MIR photodetectors. Since the primary focus<br />
<strong>of</strong> meteorological missions since that time (e.g., TIROS and NOAA-POES) has been temperature<br />
and water vapor sounding, the FIR spectral features can be viewed as redundant with the MIR<br />
spectral features. Specifically, the sounding can be performed by measuring the long wavelength<br />
side <strong>of</strong> the 15 µm CO 2 band, and the water vapor rotational band (e.g., using the FIR), or using<br />
the short wavelength side <strong>of</strong> the 15µm CO 2 band and the first vibrational-rotational band <strong>of</strong> water<br />
vapor (e.g., using the MIR). With higher information content measurements, there are important<br />
differences in the different spectral regimes, but for low spectral resolution measurements they are<br />
roughly equivalent. Since a low-noise MIR detector is easier to construct, the MIR became the<br />
primary spectral region for high spatial resolution sounding.<br />
Thus, the FIR and submillimeter spectral regions represent a frontier in atmospheric remote<br />
sensing. <strong>The</strong> submillimeter region has been the focus <strong>of</strong> recent research, as a new remote sensing<br />
tool for characterizing ice clouds. Recently developed pathfinding instruments have been deployed<br />
on aircraft in targeted field campaigns (Evans et al., 2005). Other research groups have proposed<br />
new satellite missions based on this concept, in order to improve our global knowledge <strong>of</strong> ice cloud<br />
properties, primarily focusing on the critical ice water path variable. (Buehler et al., 2007, 2012).
5<br />
wavelength [µm]<br />
20.00 10.00 6.67 5.00 4.00<br />
300<br />
Brightness Temperature [K]<br />
280<br />
260<br />
240<br />
220<br />
200<br />
FIR<br />
MIR<br />
0 500 1000 1500 2000 2500<br />
wavenumber [1/cm]<br />
wavelength [mm]<br />
10.00 1.00 0.10 0.01<br />
300<br />
Brightness Temperature [K]<br />
280<br />
260<br />
240<br />
220<br />
200<br />
Microwave Sub-mm FIR<br />
10 0 10 1 10 2 10 3<br />
wavenumber [1/cm]<br />
10.00 30.00 100.00 300.00 1000.00 3000.00 10000.00<br />
Frequency [GHz]<br />
Figure 1.2 A division <strong>of</strong> the longwave spectrum into microwave, submillimeter, FIR, and MIR<br />
spectral ranges, with a linear frequency scale (top) and logarithmic frequency scale (bottom)
6<br />
Table 1.1 Spectral Region Definitions<br />
Spectral region Frequency Range wavenumber range wavelength range<br />
Microwave 3–300 GHz 0.1–10 cm −1 1 mm–10 cm<br />
Submillimeter 0.3–3 THz 10–100 cm −1 0.1–1 mm<br />
FIR 100–667 cm −1 15–50µm<br />
MIR 667–2500 cm −1 4–15µm<br />
In this work, the remote sensing potential <strong>of</strong> the FIR spectrum is studied. <strong>The</strong> FIR has unique<br />
aspects that are <strong>of</strong> interest to atmospheric science, particularly how FIR radiation interacts with<br />
water in all three thermodynamic phases. In particular, this dissertation focuses on the use <strong>of</strong> FIR<br />
measurements for temperature and water vapor sounding, and ice cloud characterization. Using<br />
various radiative transfer models, high spectral resolution measurements <strong>of</strong> the MIR and FIR upwelling<br />
radiance are simulated and analyzed. <strong>The</strong> modeling framework allows the FIR information<br />
content to be compared and contrasted with the MIR.
7<br />
Chapter 2<br />
Background<br />
2.1 A Brief Review <strong>of</strong> <strong>Infrared</strong> Satellite Sensors 1<br />
Very early in the development <strong>of</strong> satellite technology, the possibility <strong>of</strong> using space based<br />
platforms for remote sounding was an active subject <strong>of</strong> research. <strong>The</strong> first thorough documented<br />
research in this area was from the Environmental Science Services Administration (ESSA) in the<br />
United States during the 1960’s (Wark and Fleming, 1966; Hilleary et al., 1966; Wark et al., 1967).<br />
<strong>The</strong> techniques used in these studies were similar to the original proposal by Kaplan (1959), where<br />
the remote sounding would be done with several moderate spectral resolution (approximately 5<br />
cm −1 ) measurements in the 667 cm −1 CO 2 absorption band. <strong>The</strong> technique was demonstrated<br />
with a balloon-borne instrument flight to simulate the satellite view.<br />
<strong>The</strong>se first demonstration studies led to further experiments on a series <strong>of</strong> research satellites in<br />
the Nimbus program in the late 1960’s and early 1970’s. <strong>The</strong> Nimbus program served as a testbed<br />
for many technologies that would form the core <strong>of</strong> the polar orbiting meteorological satellite sensing<br />
program. Many different instrumentation techniques were attempted, the primary infrared<br />
experiments being the Satellite InfraRed Spectrometer (SIRS), the <strong>Infrared</strong> Temperature Pr<strong>of</strong>iling<br />
Radiometer (ITPR), and the InfraRed Interferometer Spectrometer (IRIS). SIRS and IRIS, both<br />
flying on Nimbus-3, demonstrated the utility <strong>of</strong> IR radiances for characterizing the atmosphere.<br />
SIRS was similar to the earlier demonstration instruments built by ESSA. This instrument had a<br />
relatively coarse spatial resolution (100 km FOV) with a fixed nadir view, and 7 channels <strong>of</strong> 5<br />
cm −1 resolution on the high frequency side <strong>of</strong> the CO 2 band at 667 cm −1 , and one window channel<br />
1 See Appendix A for a summary <strong>of</strong> all instruments mentioned in this section. Most references are omitted here<br />
for brevity, and can be found in the Appendix.
8<br />
at 900 cm −1 . IRIS was a Fourier transform spectrometer, covering 400–2000 cm −1 at a spectral<br />
resolution <strong>of</strong> 5 cm −1 . ITPR flew on Nimbus-5, and used a filter radiometer similar to SIRS with 7<br />
spectral channels. Two <strong>of</strong> the CO 2 sounding channels from SIRS were dropped and replaced with a<br />
water vapor FIR channel at 500 cm −1 , and a single channel at the higher frequency CO 2 absorption<br />
band at 2679 cm −1 . <strong>The</strong> ITPR was also the first such instrument to implement crosstrack scanning<br />
to gain better spatial coverage.<br />
<strong>The</strong>se early experimental instruments demonstrated the utility <strong>of</strong> spectral radiance measurements<br />
for temperature and water vapor sounding, and cross track scanning to improve spatial<br />
coverage. <strong>The</strong>se experiments led directly into the development <strong>of</strong> operational instruments. <strong>The</strong><br />
primary operational instruments included the Vertical Temperature Pr<strong>of</strong>ile Radiometer (VTPR),<br />
the first operational sounding system on the Improved TIROS satellites, and the High resolution<br />
InfraRed Sounder (HIRS) instrument, first flown on Nimbus-6 and then continued as part <strong>of</strong> the<br />
operational TIROS Operational Vertical Sounding (TOVS) system on TIROS-N and later. <strong>The</strong><br />
HIRS has been a key instrument for infrared sounding, from 1978 until the present day.<br />
<strong>The</strong> design decisions made for these instruments show several general principles related to<br />
remote sensing <strong>of</strong> the atmosphere. <strong>The</strong> construction <strong>of</strong> a practical instrument must make certain<br />
trade<strong>of</strong>fs, and the result will be a balance between five competing design characteristics: spatial<br />
coverage (i.e., crosstrack scanning versus nadir-only view), spatial resolution, spectral resolution,<br />
spectral coverage, and noise performance. <strong>The</strong> design goals must be balanced within cost and<br />
weight limitations for the satellite platform. Clearly if a certain noise performance is needed for<br />
a particular measurement, this may limit the spatial or spectral resolution, since these both can be<br />
trade<strong>of</strong>fs with measurement noise (e.g., dividing the spectrum into finer spectral elements implies<br />
a lower signal to noise ratio for each sample). As technology advances, improvements can be<br />
made to any one <strong>of</strong> these aspects. Since the development <strong>of</strong> HIRS, there have been key improvements<br />
to spatial and spectral resolution. With spatial resolution, the previous generation imaging<br />
systems (e.g., the Very High Resolution Radiometer (VHRR) and Advanced VHRR (AVHRR)),<br />
always had superior spatial resolution relative to sounding instruments (1 or 4 km, compared to 17
9<br />
km for HIRS). More recent technology applied in the MODerate resolution Imaging Spectrometer<br />
(MODIS) has increased the spatial resolution (from 4 to 1 km), and drastically improved the<br />
spectral coverage. Although MODIS is technically an imager, the spectral coverage is complete<br />
enough to do limited temperature and water vapor sounding.<br />
For instruments dedicated to sounding, the spatial resolution has not increased, but the spectral<br />
resolution and coverage has increased dramatically with the deployment <strong>of</strong> high spectral resolution<br />
cross track scanning spectrometers. <strong>The</strong>se instruments include the <strong>Atmospheric</strong> InfraRed<br />
Sounder (AIRS), a grating spectrometer with 0.4–2.0 cm −1 resolution; the <strong>Infrared</strong> <strong>Atmospheric</strong><br />
Sounding Interferometer (IASI), a Fourier transform spectrometer with 0.5 cm −1 resolution, and<br />
the Cross-track scanning <strong>Infrared</strong> Sounder (CrIS), a Fourier transform spectrometer with 0.625<br />
cm −1 resolution. All three instruments have similar overall spectral coverage (600–2500 cm −1 ),<br />
with AIRS and CrIS having a few large gaps, and IASI covering the entire range. Broadly, these<br />
instruments can be called “hyperspectral” infrared sounders, due to the high spectral resolution (≈<br />
1 cm −1 or better), and high number <strong>of</strong> spectral samples (O(10 3 ) or more). <strong>The</strong> spatial resolution<br />
is similar to HIRS (approximately 15 km), but represents a large improvement over the original<br />
IRIS instruments (150 and 100 km), in addition to being cross track scanning. For the sounding<br />
mission, the spectral coverage has also increased by the fact that the spectrometers cover wide<br />
continuous swaths <strong>of</strong> the earth spectrum, rather than small targeted slices, as with HIRS. This increase<br />
in spectral coverage brings in a wealth <strong>of</strong> additional information for very low marginal cost,<br />
since by measuring the wide spectral swath, information about trace gas concentration, spectral<br />
cloud properties, and spectral surface emissivity will be present in the spectrum at the same time<br />
as the temperature and water vapor pr<strong>of</strong>ile information. <strong>The</strong>se different geophysical signals will<br />
be discussed in more detail in the next sections.<br />
2.2 Applications <strong>of</strong> IR Sounder Data<br />
<strong>The</strong> state <strong>of</strong> the art hyperspectral infrared sounders have shown to have a wealth <strong>of</strong> information<br />
about many geophysical properties. This section briefly reviews some <strong>of</strong> the literature documenting<br />
retrievals in the hyperspectral era, with emphasis on areas where the FIR will be relevant.
10<br />
2.2.1 Sounding: measuring the vertical thermodynamic pr<strong>of</strong>ile <strong>of</strong> the atmosphere<br />
<strong>The</strong> original purpose for these instruments was to produce soundings <strong>of</strong> the temperature and<br />
water vapor pr<strong>of</strong>ile. <strong>The</strong> satellite platform gives coverage in poorly instrumented areas, such as<br />
ocean basins or remote land areas. Soundings in these areas have a substantial impact on numerical<br />
weather prediction (NWP) models. <strong>The</strong> additional information in hyperspectral measurements<br />
has greatly increased the vertical resolution <strong>of</strong> the retrieved pr<strong>of</strong>iles, as well as reduced the retrieval<br />
error. At hyperspectral resolution, individual strong absorption lines can be resolved. This<br />
improves vertical resolution by introducing a wider range in weighting function altitudes, as well<br />
as sharpening individual weighting functions. One <strong>of</strong> the first studies comparing a low spectral<br />
resolution sounding measurement to a hyperspectral measurement compared HIRS to simulated<br />
Fourier transform spectrometer measurements (Purser and Huang, 1993), and showed an effective<br />
increase in data density <strong>of</strong> a factor <strong>of</strong> 2–3 along the full vertical pr<strong>of</strong>ile. Similarly, retrieved pr<strong>of</strong>iles<br />
from HIRS data showed errors <strong>of</strong> approximately 2–2.5 K for clear sky soundings, (Susskind et al.,<br />
1984) and the hyperspectral measurements from AIRS show a reduction to 0.75–1.25 K, when<br />
comparing to independent “truth” measurements such as radiosondes (Susskind et al., 2006). <strong>The</strong><br />
increased information also shows a positive impact on Numerical Weather Prediction (NWP) models<br />
(Hilton et al., 2009). <strong>The</strong> design goal <strong>of</strong> AIRS and other hyperspectral sounders is typically on<br />
the order <strong>of</strong> 1 K error, with a vertical resolution <strong>of</strong> 1 km; this is achievable in good conditions, but<br />
errors tend to increase over land where surface emissivity varies (Divakarla et al., 2006).<br />
<strong>The</strong> total information content for water vapor tends to be somewhat lower. Humidity pr<strong>of</strong>iling<br />
from TOVS has enough information to pr<strong>of</strong>ile on five broad layers, with pressure levels at 100, 300,<br />
500, 700, and 850 hPa, with the last level at the surface (Chaboureau et al., 1998). For the AIRS<br />
retrievals, the number <strong>of</strong> layers in the standard retrieval is increased to 9, and shows an accuracy<br />
<strong>of</strong> up to 15% for clear conditions (Susskind et al., 2003, 2006), and 20%–40% when compared<br />
globally over all conditions where retrievals can be made (Divakarla et al., 2006).
11<br />
2.2.2 Cloud Property Retrieval<br />
Macrophysical cloud properties, such as cloud altitude (directly related to temperature), cloud<br />
fraction, and optical thickness, were not typically viewed as primary retrieved parameters from<br />
IR sounders, but it was known that some method to constrain these values would be required for<br />
successful thermodynamic pr<strong>of</strong>ile retrievals. <strong>The</strong> temperature retrieval algorithms applied to the<br />
first experimental sounders (Smith et al., 1970; Chahine et al., 1977) had corrections for cloud<br />
effects, but typically the “retrieved” cloud properties were not utilized. Since these instruments<br />
typically had large footprints (∼ 10 2 km), the estimated cloud property represented some effective<br />
averaged quantity over the large area. Later instrumentation with much better spatial resolution,<br />
such as HIRS (∼ 10 km), led to useful retrievals <strong>of</strong> these global cloud properties (Wylie et al.,<br />
1994).<br />
<strong>The</strong>rmodynamic phase is also retrievable in the MIR due to the different shape <strong>of</strong> the spectral<br />
index <strong>of</strong> refraction for liquid water and ice. <strong>The</strong> primary feature is the increase in the imaginary<br />
part as the wavenumber decreases from 1000 cm −1 , which implies a drop in the in single scatter<br />
albedo <strong>of</strong> cloud particles. <strong>The</strong> slope is very different in liquid water versus ice. <strong>The</strong> spectral<br />
change in refractive index also implies a spectral change in the extinction efficiency. <strong>The</strong> bulk optical<br />
properties <strong>of</strong> a cloud layer will then have spectral features, dependent on the thermodynamic<br />
phase, that can be exploited by remote sensing techniques. <strong>The</strong> cloud could exhibit relatively more<br />
scattering, or relatively higher optical depth, across a pair <strong>of</strong> selected wavenumbers, which in turn<br />
may show a measurable brightness temperature difference. “Split window” approaches based on<br />
these principles can be used to determine phase in low spectral resolution measurements, since<br />
the variation <strong>of</strong> the index <strong>of</strong> refraction is slow (Figure 2.1), with features spread over∼10 2 cm −1<br />
(Strabala et al., 1994; Baum et al., 2000).<br />
More recent research has involved retrieval <strong>of</strong> the basic microphysical quantity, particle effective<br />
size, both from TOVS and hyperspectral IR measurements (Stubenrauch et al., 1999; Zhou<br />
et al., 2007). Because the spectral variation <strong>of</strong> cloud properties is much smoother than gas absorption<br />
lines, the high spectral resolution does not improve the retrieval nearly as much as for<br />
temperature and gas pr<strong>of</strong>ile retrieval. At the same time, cloud spatial variation can be much more
12<br />
wavelength [µm]<br />
Real Part<br />
Abs. Coeff [1/µm] Imaginary Part<br />
2.0<br />
1.8<br />
1.6<br />
1.4<br />
1.2<br />
1.0<br />
1.0<br />
0.8<br />
0.6<br />
0.4<br />
0.2<br />
0.0<br />
0.5<br />
0.4<br />
0.3<br />
0.2<br />
0.1<br />
0.0<br />
20.00 10.00 6.67 5.00 4.00<br />
liquid water<br />
ice<br />
500 1000 1500 2000 2500<br />
wavenumber [cm −1 ]<br />
Figure 2.1 <strong>The</strong> complex index <strong>of</strong> refraction (real part, top; imaginary part, bottom) for bulk water<br />
and ice, in the FIR and MIR. <strong>The</strong> dashed vertical line shows the FIR-MIR division (667 cm −1 ).<br />
Ice refractive index data from Warren and Brandt (2008), water refractive index data taken from<br />
Downing and Williams (1975).
13<br />
dramatic than the spatial variation <strong>of</strong> absorbing gas species. Thus, retrievals from multiband imagers<br />
that leverage high spatial resolution (Inoue, 1985; Parol et al., 1991; Heidinger and Pavolonis,<br />
2009), may outperform methods based on hyperspectral measurements due to the relatively poor<br />
spatial resolution <strong>of</strong> the hyperspectral sounder. Knowing the cases where each sensing method is<br />
more optimal is an active area <strong>of</strong> research, and retrievals that utilize both measurements should<br />
yield a superior result (Li et al., 2005; Nasiri et al., 2011).<br />
2.2.3 Trace Gas Retrieval<br />
Another significant impact <strong>of</strong> hyperspectral measurements is the ability to retrieve numerous<br />
gas species other than water vapor. <strong>The</strong>se trace gas retrievals are impossible from the lower spectral<br />
resolution measurements, since the detection may rely on only a small number <strong>of</strong> individual<br />
absorption lines that are lost within the wider spectral band pass. For many trace gases, the information<br />
content in a cross track scanner may be fairly low, only allowing an estimate <strong>of</strong> total column<br />
amounts, because the total optical depth in the full atmosphere column may be too small. Pr<strong>of</strong>iling<br />
a particular gas requires a wide range <strong>of</strong> total optical depths, in order to produce weighting functions<br />
at different altitudes, which may not be physically possible for lower concentration species.<br />
Missions with the primary purpose <strong>of</strong> measuring trace gases are <strong>of</strong>ten limb sounders for this reason<br />
(for example, the Michelson Interferometer for Passive <strong>Atmospheric</strong> Sounding (MIPAS) on<br />
EnviSat). AIRS has shown useful information for O 3 , CH 4 , CO, and SO 2 (Chahine et al., 2006).<br />
IASI has continuous spectral coverage (650–2700 cm −1 ) over wavenumbers where the AIRS has<br />
gaps, and superior spectral resolution in some bands (0.625 cm −1 over the whole spectrum, in contrast<br />
to AIRS which has a resolution <strong>of</strong> ∼ 2 cm −1 in the highest wavenumber bands). With these<br />
new capabilities, IASI can detect all trace gases that are detected by AIRS as well as a number<br />
<strong>of</strong> additional gases. <strong>The</strong> list <strong>of</strong> documented detections <strong>of</strong> trace gases in IASI includes N 2 O, NO 2 ,<br />
HNO 3 , HCOOH, CH 3 OH, and NH 3 , as well as the water isotope HDO (Hilton et al., 2011).
14<br />
2.2.4 Surface Emissivity<br />
In low spectral resolution measurements, the surface emissivity can not be decoupled from<br />
the surface temperature. Hyperspectral measurements <strong>of</strong>fer a key advantage by adding enough<br />
spectral information to enable retrieval <strong>of</strong> the surface spectral emissivity. (Knuteson et al., 2004a;<br />
Li and Li, 2008; Capelle et al., 2012). Many <strong>of</strong> the same considerations for clouds apply, namely<br />
that surface emissivity over land can have a large spatial variation that is not well sampled by the<br />
typical resolution <strong>of</strong> an infrared sounder. On the other hand, spectral variation <strong>of</strong> emissivity can<br />
be more complex than cloud properties, so the higher spectral resolution can be more useful for<br />
surface emissivity. Accounting for the surface emissivity spectral variation is also an important<br />
consideration for cloud property retrieval in window regions <strong>of</strong> the infrared spectrum, since errors<br />
in each can introduce bias errors in the other if not properly handled.<br />
2.3 Key material properties in the FIR and relationships to remote sensing<br />
2.3.1 Water Vapor absorption<br />
<strong>The</strong> FIR water vapor absorption consists <strong>of</strong> the rotational mode absorption lines and continuum<br />
absorption. <strong>The</strong> rotational absorption band has the lowest energy, since no vibrational mode<br />
is excited. Thus the transition energies are small, and this band continues well into the microwave<br />
region. <strong>The</strong> peak line intensities are highest in this band, relative to any other vibrational-rotational<br />
absorption band (e.g., the first such band centered at 6.3 µm wavelength, or higher order transitions<br />
at shorter wavelengths) (Harries et al., 2008). <strong>The</strong> highest altitude weighting functions for<br />
upwelling radiance should appear in the FIR due to the increased line strengths.<br />
<strong>The</strong> water vapor continuum absorption is still not fully explained in a firm theoretical framework,<br />
and has been described as caused by dimer interactions between two water vapor molecules,<br />
or due to subtle shape distortions to the Lorentz pr<strong>of</strong>ile wings <strong>of</strong> the numerous absorption lines.<br />
Regardless <strong>of</strong> the physical basis, the semi-empirical method in the CKD and MT CKD continuum<br />
models has been able to model the continuum shape quite well, by decomposing the total<br />
absorption into line contributions, and a smoothly “self” and “foreign” continuum (Clough et al.,
15<br />
1989; Mlawer et al., 2012). <strong>The</strong> line contributions are defined to be Voigt functions within 25<br />
cm −1 <strong>of</strong> either side <strong>of</strong> the line center, where the absorption coefficient is forced to zero at the ±<br />
25 cm −1 points. Any residual absorption in the far wings <strong>of</strong> the line, or within the “basement”<br />
term in the center ± 25 cm −1 is then added into the continuum (Turner and Mlawer, 2010). <strong>The</strong><br />
two continuum absorption components respond differently to pressure and water vapor density,<br />
so by modeling the components separately, they can have independent coefficients and scaling<br />
exponents. <strong>The</strong> so-called “self” continuum is proportional to the square <strong>of</strong> the water vapor density,<br />
while the “foreign” component scales linearly with water vapor density. <strong>The</strong> strength <strong>of</strong> the<br />
continuum absorption is highest in the FIR. All other factors being equal, the higher continuum absorption<br />
will tend to increase the weighting function altitude for the upwelling radiance weighting<br />
functions.<br />
Earlier work involving sensitivity analysis <strong>of</strong> the IR spectra to perturbations in the water vapor<br />
concentration show the impact <strong>of</strong> the increased absorption. <strong>The</strong> magnitude <strong>of</strong> the water vapor<br />
Jacobian is stronger in the FIR water vapor rotational band by as much as a factor <strong>of</strong> 6 (Rizzi et al.,<br />
2002). However, this previous analysis does not consider any realistic impacts <strong>of</strong> sensor noise,<br />
spectral sampling, or correlation in spectral signatures, so the results are difficult to interpret in<br />
terms <strong>of</strong> actual retrievable water vapor pr<strong>of</strong>ile information in a realistic measurement.<br />
Validation <strong>of</strong> water vapor spectroscopy is an ongoing research effort. Both the line and continuum<br />
properties must be known as accurately as possible, since any errors can introduce bias into<br />
the retrieved pr<strong>of</strong>iles. Radiance closure studies have led to significant improvement in the water<br />
vapor absorption line properties as well as the continuum absorption using MIR measurements<br />
(Revercomb et al., 2003; Turner et al., 2004). More recent field campaigns have extended the applicability<br />
<strong>of</strong> these closure experiments, by collecting data in extremely dry conditions in order to<br />
measure farther into the FIR region where the line and continuum absorption strengths are higher<br />
(Turner and Mlawer, 2010). <strong>The</strong>se new FIR measurements will lead to further refinement <strong>of</strong> water<br />
vapor spectroscopy.
16<br />
2.3.2 Blackbody Peak Radiance and Spectral Cooling<br />
An important aspect <strong>of</strong> FIR emission is the fact that the relative intensity <strong>of</strong> the blackbody<br />
curve is more strongly peaked in the FIR for cold atmospheric temperatures. Coupled with the fact<br />
that the water vapor absorption is stronger in the FIR relative to the MIR leading to higher altitude<br />
weighting functions, the majority <strong>of</strong> the upper atmosphere cooling to space occurs in the FIR<br />
region. From a remote sensing perspective, this implies a higher effective Signal to Noise Ratio<br />
(SNR) for retrieving geophysical information from the upper atmosphere water vapor emission,<br />
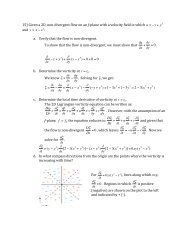
assuming constant measurement noise across the spectrum. Figure 2.2 shows the ratio between<br />
spectral radiance from a blackbody for various temperatures spanning the approximate range observed<br />
in the troposphere. Each curve is divided by the radiance from a T = 300 K blackbody. <strong>The</strong><br />
significant radiance reduction in MIR wavenumbers is readily apparent, especially in the important<br />
wavenumber range for water vapor sounding in the upper troposphere (approximately 100–500<br />
cm −1 for the FIR and 1250–1750 cm −1 for the MIR). For those ranges, the radiance at T = 200 K<br />
drops to approximately 40% (FIR) and 4% (MIR) <strong>of</strong> the the radiance at T = 300 K.<br />
More detailed calculations were documented in Kratz (2002) using high spectral resolution radiative<br />
transfer codes. In clear sky conditions, the fraction <strong>of</strong> total outgoing longwave flux below<br />
650 cm −1 ranges from 42.1% for the standard tropical atmosphere, to 53.7% in the standard subarctic<br />
winter atmosphere 2 . Limiting the calculation to consider only the flux from the atmosphere,<br />
these fractions increase to 51.1% and 75.5% for the two atmospheres, as a consequence <strong>of</strong> the<br />
emission peak favoring FIR wavenumbers for the colder troposphere temperatures where most <strong>of</strong><br />
the atmospheric emission to space occurs. Finally, the spectral cooling rate calculations <strong>of</strong> Clough<br />
and Iacono (1995) show a strong maximum in spectral cooling in the FIR wavelengths through the<br />
mid and upper troposphere from water vapor emission lines. <strong>The</strong> cooling rate pr<strong>of</strong>ile couples the<br />
radiative emission processes to dynamical processes, adding to the importance <strong>of</strong> accurate water<br />
vapor spectroscopy. General circulation models (GCMs) must include accurate parameterizations<br />
<strong>of</strong> these longwave radiation processes in order to produce useful simulations <strong>of</strong> climate. In the<br />
2 Note that this is slightly below the FIR boundary convention in this research (667 cm −1 ) but the affect on these<br />
calculations should be small.
17<br />
Radiance relative to T = 300 K<br />
1.0<br />
0.8<br />
0.6<br />
0.4<br />
0.2<br />
0.0<br />
wavelength [µm]<br />
20.00 10.00 6.67 5.00 4.00<br />
667 cm −1<br />
15 µm<br />
L(T BB =200K) / L(T BB =300K)<br />
L(T BB =225K) / L(T BB =300K)<br />
L(T BB =250K) / L(T BB =300K)<br />
L(T BB =275K) / L(T BB =300K)<br />
500 1000 1500 2000 2500<br />
wavenumber [1/cm]<br />
Figure 2.2 Ratio <strong>of</strong> black body radiance, relative to T = 300 K, for a set <strong>of</strong> temperatures to<br />
roughly span the typical range in the troposphere.
18<br />
subtropics, for example, the clear sky radiative cooling is largely balanced by subsidence, so in<br />
this regime the cooling rate is directly tied to the large scale vertical motions in the atmosphere.<br />
2.3.3 Ice and Water Index <strong>of</strong> Refraction<br />
<strong>The</strong> spectral index <strong>of</strong> refraction for ice changes substantially in the FIR relative to the MIR<br />
(Figure 2.1). <strong>The</strong> imaginary part drops to a minimum around 400 cm −1 , while the water imaginary<br />
part stays elevated. Ice particles will then have much higher single scatter albedo, and cloud<br />
layers with ice will show much more scattering than water clouds. This spectral feature allows for<br />
sensitive phase detection beyond the MIR split window approaches (Rathke et al., 2002; Turner,<br />
2005).<br />
Phase determination is beyond the scope <strong>of</strong> this work, but the properties <strong>of</strong> ice clouds will<br />
be studied in detail in Chapter 5. <strong>The</strong> scattering maximum at 400 cm −1 is a key feature for remote<br />
sensing <strong>of</strong> cloud microphysics, since it introduces measurable changes in the bulk optical<br />
properties <strong>of</strong> ice clouds. Several papers have investigated this feature for ice cloud properties,<br />
using simplistic brightness temperature difference (BTD) measurements. BTD measurements are<br />
the typical starting points for split-window cloud property retrievals using bi- or tri-spectral measurements<br />
from moderate resolution infrared images (Strabala et al., 1994; Baum et al., 2000;<br />
Heidinger and Pavolonis, 2009), so these studies could be viewed as a motivation for adding an<br />
FIR channel to these types <strong>of</strong> instruments. In Yang et al. (2003), BTDs are simulated for a variety<br />
<strong>of</strong> cloud thicknesses in several standard atmosphere pr<strong>of</strong>iles. Large sensitivities are shown for a<br />
variety <strong>of</strong> cloud parameters, including very high optical depth clouds.<br />
Another sensitivity study, based on spectral radiance differences rather than BTD (Baran,<br />
2007), shows that FIR spectra can be sensitive to a number <strong>of</strong> important microphysical properties,<br />
such as particle effective diameter, Particle Size Distribution (PSD) shape, crystal habit, and<br />
vertical inhomogeneity within the cloud layer. <strong>The</strong> study is focused on sensitivity only, not retrievable<br />
information, so no consideration is made for sensor characteristics (other than a wavenumber
19<br />
coverage to match a particular FIR research instrument, the Tropospheric Airborne Fourier Transform<br />
Spectrometer (TAFTS)), or correlation between spectral signatures. <strong>The</strong> analysis is also done<br />
only for a single macrophysical layout, namely a cloud with unit optical depth at z = 9.8 km.<br />
2.3.4 Trace Gases<br />
<strong>The</strong> information content for trace gas retrieval in the FIR is not well known. <strong>The</strong> FIR will<br />
probably not be as important for trace gas retrieval, as many species do not have a strong rotational<br />
band in the FIR (water vapor being the exception), and their strong rotational lines typically occur<br />
at lower frequencies (e.g. submillimeter or microwave). <strong>The</strong> lowest energy vibrational band typically<br />
occurs in the MIR. A simple visualization <strong>of</strong> the HITRAN database is shown in Figure 2.3,<br />
where the line intensities are multiplied by the column density in the US Standard Atmosphere<br />
to give the total line optical depth. In order to thin the data, the HITRAN data is grouped into 5<br />
cm −1 spectral intervals, and only the strongest line for each species is displayed in the plot. <strong>The</strong><br />
primary infrared absorbers water vapor, CO 2 and O 3 are ignored, and only species with at least one<br />
retained line with an optical depth greater than 10 −3 are plotted. <strong>The</strong> most important trace gas in<br />
the FIR is N 2 O, with a fairly strong absorption band (peak τ ≈ 0.1) at 550 cm −1 . <strong>The</strong> only other<br />
species with lines over 10 −3 in optical depth in the FIR are HF, HCl and NH 3 with a few weak<br />
(τ ≈ 3 × 10 −3 ) lines below 300 cm −1 . In fact, the lack <strong>of</strong> trace gas absorption can be a benefit to<br />
water vapor pr<strong>of</strong>ile retrieval, since the water vapor signature is cleaner due to lack <strong>of</strong> interfering<br />
absorption lines. A detailed analysis <strong>of</strong> trace gas retrieval is beyond the scope <strong>of</strong> this work, so<br />
trace gases will not be discussed further, other than in reference to interference with water vapor<br />
absorption features in Chapter 4.<br />
2.3.5 Surface Emissivity<br />
Because <strong>of</strong> the high opacity <strong>of</strong> the water vapor rotational absorption band, the surface is not<br />
usually detectable within the FIR, except in cases <strong>of</strong> low water vapor column amounts. <strong>The</strong> state<br />
<strong>of</strong> knowledge for FIR spectral emissivities for natural surfaces is basically non-existent, except<br />
for measurements <strong>of</strong> mineral properties used in planetary geology. To support remote sensing <strong>of</strong>
20<br />
total optical depth<br />
10 1<br />
10 0<br />
10 -1<br />
10 -2<br />
10 -3<br />
10 -4<br />
wavelength [µm]<br />
20.00 10.00 6.67 5.00 4.00 3.33<br />
N2O<br />
CO<br />
CH4<br />
NH3<br />
HF<br />
HCl<br />
OCS<br />
HCN<br />
C2H2<br />
10 -5<br />
10 -6<br />
0 500 1000 1500 2000 2500<br />
wavenumber [1/cm]<br />
Figure 2.3 Integrated absorption line optical depth for a number <strong>of</strong> molecular species. <strong>The</strong> line<br />
intensities are taken from the HITRAN 2008 database (Rothman et al., 2009), and scaled by the<br />
molecular column density in the US Standard Atmosphere.
21<br />
mineral distributions on the surface <strong>of</strong> Mars, laboratory measurements were made <strong>of</strong> many mineral<br />
and rock surfaces (Christensen et al., 2000). <strong>The</strong>se reference spectra were used in the exploitation<br />
<strong>of</strong> THEMIS data (Christensen et al., 1992), a moderate resolution (5 cm −1 ) interferometer covering<br />
the spectral range 200–1600 cm −1 . <strong>The</strong> laboratory data show that there is likely as much variation<br />
in the surface spectral emissivity in the MIR window due to land surface changes (e.g., rock or<br />
soil types), since there are strong features in the FIR correlated to features that are prevalent in<br />
global surface emissivity databases for MIR spectra (Seemann et al., 2008). Figure 2.4 shows<br />
the leading principal components <strong>of</strong> the global emissivity database, with two emissivity spectra<br />
from laboratory measurements <strong>of</strong> quartz and serpentine, two common minerals. <strong>The</strong> features at<br />
1000–1200 cm −1 in the mineral spectra are seen in the Principal Components (PC) from the global<br />
database, which suggests that these features in the PC spectra are likely due to the same minerals.<br />
This would suggest the strong emissivity features in the FIR seen in the mineral spectra may be<br />
important for any FIR remote sensing in dry atmospheres where the surface is detected.<br />
2.4 Future Directions<br />
<strong>The</strong> infrared sounder has been a critical part <strong>of</strong> the overall earth observing system for many<br />
decades, and over time the number <strong>of</strong> applications for the data continues to grow. Sounders will<br />
continue to be a key component for the foreseeable future, and they will likely be enhanced in<br />
capability in a number <strong>of</strong> ways. For the operational sounder, where the instrument design can have<br />
a lifetime measured in decades (over multiple constructed examples), the current EUMETSAT<br />
and NOAA designs for polar orbiters (IASI and CrIS) are in the middle and beginning <strong>of</strong> their<br />
lifetimes, respectively, so there is no concrete design for the next generation sounder. <strong>The</strong> followon<br />
EUMETSAT system, IASI-NG (Next Generation), is in design phase. <strong>The</strong> current instrument<br />
plan includes higher spectral resolution and lower sensor noise, but uses the same spectral coverage<br />
(Crevoisier, 2012).<br />
<strong>The</strong>re are several promising directions for hyperspectral instrumentation development on geosynchronous<br />
satellites, such as the infrared sounder on the third generation MeteoSat (Stuhlmann et al.,
22<br />
Arbitrary Units<br />
1.1<br />
1.0<br />
0.9<br />
0.8<br />
0.7<br />
0.6<br />
0.5<br />
0.4<br />
20.00 10.00 6.67 5.00 4.00 3.33<br />
Global IR surface<br />
emis. database<br />
Mean<br />
PC 1<br />
PC 2<br />
PC 3<br />
wavelength [µm]<br />
emissivity<br />
1.1<br />
1.0<br />
0.9<br />
0.8<br />
0.7<br />
0.6<br />
0.5<br />
Lab measured<br />
mineral emis.<br />
Quartz<br />
Serpentine<br />
0.4<br />
0 500 1000 1500 2000 2500 3000<br />
wavenumber [cm −1 ]<br />
Figure 2.4 Top figure: <strong>The</strong> mean spectral emissivity, along with the first 3 Principal Components,<br />
from the emissivity library in Seemann et al. (2008) that describes a global emissivity distribution<br />
for remote sensing applications in the MIR. Bottom figure: laboratory emissivity spectra <strong>of</strong> quartz<br />
and serpentine from Christensen et al. (2000), showing strong features in the MIR and FIR.
23<br />
2005), or potential missions based on the Geosynchronous Imaging Fourier Transform Spectrometer<br />
(GIFTS) instrument (Elwell et al., 2006). This would follow the pattern <strong>of</strong> the sounding<br />
technology in operational use on polar platforms for some length <strong>of</strong> time before transitioning to a<br />
geosynchronous platform.<br />
Another possible route would be to expand spectral coverage again, by pushing the spectrometers<br />
to measure lower frequencies, and cross into the FIR region. <strong>The</strong> original IRIS instrument did<br />
observe frequencies as low as 400 cm −1 , but the current hyperspectral instruments all have a cut<strong>of</strong>f<br />
at about 650 cm −1 . <strong>The</strong> focus <strong>of</strong> this dissertation is to explore what advantage could be realized by<br />
extending the IR sounding measurement into the FIR, to a low cut<strong>of</strong>f wavenumber <strong>of</strong> 100 cm −1 .<br />
<strong>The</strong> information content for cloud microphysical property and sounding – both temperature and<br />
water vapor – is studied, using high accuracy forward models and physical retrieval frameworks.<br />
2.5 Summary<br />
This chapter gave a brief history <strong>of</strong> passive IR sounding systems from satellites, showing the<br />
push toward higher spatial resolution and spectral coverage among imaging systems, and the dramatic<br />
increase in spectral resolution among sounding instruments. <strong>The</strong> key applications <strong>of</strong> hyperspectral<br />
IR sounders were reviewed. Unique material properties in the FIR were discussed,<br />
focusing on water vapor absorption characteristics, and ice spectral index <strong>of</strong> refraction. <strong>The</strong>se<br />
unique FIR properties affect thermodynamic pr<strong>of</strong>ile and ice cloud property retrievals. <strong>The</strong> following<br />
chapters form the core <strong>of</strong> this thesis. First, in Chapter 3, the retrieval algorithms, radiative<br />
transfer models, and other modeling framework details are described. In Chapter 4, the thermodynamic<br />
pr<strong>of</strong>ile retrieval problem is investigated, by computing the information content using hyperspectral<br />
measurements <strong>of</strong> the upwelling MIR and FIR spectra. In Chapter 5, the work is extended<br />
to include layer ice clouds, to investigate the impact <strong>of</strong> the FIR ice scattering properties. Finally,<br />
in Chapter 6, some applications <strong>of</strong> FIR radiative transfer and remote sensing are described, along<br />
with a brief summary <strong>of</strong> prospects for future research in this area.
24<br />
Chapter 3<br />
Methods 1<br />
This work uses the well known Optimal Estimation (OE) (Rodgers, 2000) algorithm to solve<br />
the inverse problem <strong>of</strong> retrieving geophysical data from infrared radiance spectra. In this chapter,<br />
the OE mathematical framework is first reviewed. Once the mathematical quantities are defined,<br />
the specific implementation details are described. First, the forward models are discussed, followed<br />
by specific details <strong>of</strong> various components such as assumed priors and sensor characteristics. When<br />
possible, framework is applied in an identical manner to both the clear sky and cloudy conditions.<br />
Differences between the clear sky and cloudy calculations are noted.<br />
3.1 Algorithms<br />
3.1.1 Optimal Estimation (OE)<br />
Optimal Estimation is a Bayesian solution to the inverse problem. OE produces the maximum<br />
likelihood solution under the assumptions that the forward model is linear and the error covariances<br />
have Gaussian probability distribution functions. <strong>The</strong> method has many useful properties for the<br />
inverse problem at hand, such as the ability to quantify the prior knowledge used in the retrieval;<br />
calculation <strong>of</strong> error estimates on the final solution; and robustness to measurement errors. <strong>The</strong><br />
disadvantage is mainly the computational expense. In some cases the requirement <strong>of</strong> prior information<br />
can be a disadvantage if such information is difficult to obtain. Highly nonlinear models or<br />
1 Portions <strong>of</strong> this chapter were published in Merrelli and Turner (2011) and are copyright <strong>of</strong> the American Meteorological<br />
Society.
25<br />
non-Gaussian error covariances may be unsuitable for OE as these can introduce large bias errors<br />
in the solution.<br />
<strong>The</strong> OE method can be defined with the following terms, which follow the notation used in<br />
Rodgers (2000). Given am-dimensional measurement vectory and an-dimensional state vectorx,<br />
the two spaces can be related via a functionF , the “forward model”, with errorǫfrom measurement<br />
uncertainty and forward model errors. Typically this is expressed relative to a specific state vector<br />
value,x 0 , and the forward model evaluated at that state vector value,F(x 0 ):<br />
y−y 0 = F(x)−F(x 0 )+ǫ (3.1)<br />
<strong>The</strong> expression can be linearized by replacing the function with its Taylor expansion and retaining<br />
only the linear term. <strong>The</strong> linear term contains the first derivative <strong>of</strong> the forward model, the Jacobian<br />
matrix (K i,k = ∂F i /∂x k ). <strong>The</strong> linearized forward model equation using the Jacobian matrix can<br />
be written as<br />
y−y 0 = K(x−x 0 )+ǫ + (higherorderterms) (3.2)<br />
If the prior covariance for the state vector (S a ) and the error covariance (S e ) are both known, then<br />
the OE solution for the linear case can be expressed as<br />
ˆx = x 0 + ( )<br />
K T S −1<br />
e K+S −1 −1<br />
a K T S −1<br />
e [y−F(x 0 )] (3.3)<br />
where the solutionˆx is called the “state estimate” for the observationy. In this equation, the error<br />
covariance S e includes the measurement noise for the instrument measuring y and some estimate<br />
<strong>of</strong> the error in the forward model. Since these two covariances would be added together to formS e<br />
in the cases where model error is included, the error covariance could be split into two terms:<br />
S e = S y +S F (3.4)<br />
whereS y represents the covariance <strong>of</strong> the measurement noise, andS F represents the covariance <strong>of</strong><br />
the model error.<br />
<strong>The</strong> measurement noise is usually obtained by an independent method, for example calibration<br />
data collected by the instrument independently from the observation y. <strong>The</strong> model error is
26<br />
typically much more difficult to characterize, since it includes errors due to missing or unknown<br />
physics relevant to the prediction <strong>of</strong> the measurement from the given state vector. Some model errors<br />
may have quantified uncertainties. For example, absorption line widths or center frequencies<br />
may have measured or estimated uncertainties. In most cases with real data these model errors<br />
will be unquantified, since the errors will be due to unaccounted physical properties. Examples include<br />
three dimensional scattering effects in cloud fields represented by a one dimensional forward<br />
model, or unaccounted aerosol layers in a clear sky radiance simulation. In many cases the model<br />
error is assumed to be a constant additive variance (uncorrelated noise) (Zhou et al., 2007).<br />
Since this research uses the independent pixel assumption, and a forward model that describes<br />
clouds as homogeneous layers, the important model errors will likely be three dimension cloud<br />
scattering effects as well as multiple layer and subpixel cloud fraction effects. <strong>The</strong>se effects are<br />
beyond the scope <strong>of</strong> this research, but it should be noted that this is an active area <strong>of</strong> research<br />
within the larger community (Kahn et al., 2011). However, within the framework used in this<br />
research, since the same forward model used in the OE algorithm is the same forward model used<br />
to simulate measurements, the model error component S F is zero. This is sometimes called the<br />
“perfect model” condition. In some specific test cases in Chapter 4 a model error will be simulated<br />
by including a difference between the model that simulates the measurement and the model that<br />
is used inside the OE retrieval to compute F(x) and K. In those specific cases, the perfect model<br />
condition will not be applicable.<br />
To extend the linear solution to nonlinear problems, the linear equation can be applied in an<br />
iterative algorithm. <strong>The</strong> state estimate and Jacobian are recomputed at each iteration:<br />
ˆx i+1 = x 0 + ( ) −1K<br />
K T i S −1<br />
e K i +S −1 T<br />
a i S −1<br />
e [y−F(ˆx i )+K i (ˆx i −x 0 )] (3.5)<br />
In this equation K i represents the Jacobian computed at the state estimate ˆx i . <strong>The</strong> iteration continues<br />
until some exit criterion is reached. In this work, the exit criterion is based on the change in<br />
the state estimate compared to the size <strong>of</strong> the posterior error. Using the definition <strong>of</strong> the posterior<br />
error, Ŝ, the change in state estimate is scaled and compared to 0.1 N. This threshold is similar to
27<br />
a 0.1 σ threshold for a scalar random variable, but generalized to N-dimensional state space:<br />
Ŝ −1 = K T i S−1 e K i +S −1<br />
a<br />
0.1 > 1 N (ˆx i+1 −ˆx i ) T Ŝ −1 (ˆx i+1 −ˆx i ) (3.6)<br />
This nonlinear form <strong>of</strong> OE, Newton’s method, is used for all retrievals. An implicit assumption<br />
must be made that the prior and measurement covariances are Gaussian, and that the forward model<br />
is “mildly nonlinear” (Rodgers, 2000). <strong>The</strong>se assumptions are difficult to verify in practice, and are<br />
beyond the scope <strong>of</strong> this research. Instead, it will be noted that the method has been successfully<br />
applied to numerous data sources in atmospheric science, including infrared sounding instruments<br />
(for example, TOVS (Eyre, 1989), IASI (Carissimo et al., 2005), and AERI (Turner, 2005)).<br />
3.1.2 OE Based Metrics<br />
<strong>The</strong>re are three important intermediate matrices computed in the Bayesian solution which are<br />
used throughout this research to quantify various aspects <strong>of</strong> the retrieved state estimate. <strong>The</strong>se<br />
matrices are Ŝ, the posterior state covariance; G, the gain matrix, or the generalized inverse <strong>of</strong> K;<br />
and A, the averaging kernel matrix.<br />
Ŝ = ( )<br />
K T i S−1 e K i +S −1 −1<br />
a<br />
(3.7)<br />
[ (K ) ]<br />
T −1K<br />
G = i S −1<br />
e K i +S −1 T<br />
a i S −1<br />
e = ŜK T i S −1<br />
e (3.8)<br />
[ (K ) ]<br />
T −1K<br />
A = i S −1<br />
e K i +S −1 T<br />
a i S −1<br />
e K i = GK i (3.9)<br />
<strong>The</strong> posterior state covariance represents the uncertainty <strong>of</strong> the state estimate after exploiting<br />
the information contained within the measurement. Measurements with low uncertainty should<br />
shrink the volume <strong>of</strong> the prior state covariance substantially, so that the posterior state covariance<br />
will cover a much smaller volume in state space. <strong>The</strong> amount <strong>of</strong> reduction can be examined by<br />
simply looking at the square root <strong>of</strong> the diagonal, to get effectively a 1-σ uncertainty level on the<br />
state estimate, and comparing this to the 1-σ uncertainty in the prior covariance. Correlated error<br />
in the state estimate would be ignored by this simple method, but it has the advantage <strong>of</strong> describing<br />
the error in a simple way in terms <strong>of</strong> physical units.
28<br />
<strong>The</strong> Shannon information content, H, is related to the posterior and prior state covariances<br />
through the relation<br />
H = − 1 2 ln ∣ ∣∣ ŜS −1<br />
a<br />
∣ (3.10)<br />
Because the posterior covariance always describes a smaller volume <strong>of</strong> state space, the sign convention<br />
implies H is a positive quantity. In an approximate sense, H represents the reduction in state<br />
space in the posterior relative to the prior. <strong>The</strong> determinant <strong>of</strong> a covariance matrix is sometimes<br />
called the “generalized variance” since it represents the volume <strong>of</strong> the associated error distribution.<br />
If the covariance matrices are <strong>of</strong> full rank, H can be rewritten in a form that suggests an analogy<br />
to the scalar signal to noise ratio:<br />
H = − 1 (∣ ∣∣<br />
2 ln Ŝ∣ ∣ S<br />
−1∣ ) ⎛<br />
a = − 1 ∣<br />
⎞<br />
∣Ŝ<br />
2 ln ∣<br />
⎝ ⎠ (3.11)<br />
|S a |<br />
<strong>The</strong> averaging kernel describes the amount <strong>of</strong> correlation between state vector components.<br />
By approximating y with the linearization <strong>of</strong> F , y = K(x − x 0 ) + F(x 0 ), replacing this term<br />
in equation 3.3 and rearranging, the following expression relating the true state x and the state<br />
estimate ˆx is obtained:<br />
ˆx−x 0 = A(x−x 0 )+Gǫ (3.12)<br />
This equation gives several perspectives on the action <strong>of</strong> A on the true state x. Considering<br />
a δ-function like true state (meaning, the true state differs from x 0 at only one state variable x k ),<br />
then column <strong>of</strong> A at this index k represents the response in the state estimate. <strong>The</strong> response will<br />
be smeared out according to the correlation to other state variables, which arises from correlation<br />
inherent in the assumed prior covariance and in the character <strong>of</strong> the measurement as described by<br />
K. For a general true state, the response in the state estimate for state variablek will be the scalar<br />
product between the corresponding row <strong>of</strong> A and the true state x −x 0 . <strong>The</strong> rows can be thought<br />
<strong>of</strong> as “averaging kernels”, since the k th element in the state estimate represents an average over<br />
multiple elements in the true state, according to the k th row in A. <strong>The</strong> summed elements across<br />
the k th row also gives an indication <strong>of</strong> the relative weight <strong>of</strong> the prior state and measurement<br />
in the calculation <strong>of</strong> the state estimate. A row sum near zero indicates that the corresponding
29<br />
state variable estimate ˆx k will tend to be equal to the prior mean value x 0,k , regardless <strong>of</strong> the<br />
measurement. This indicates that the measurement is not sensitive to that state variable either<br />
directly or through any correlation implied by the prior covariance.<br />
Examining the rows <strong>of</strong> A in cases where the state vector represents a vertical thermodynamic<br />
pr<strong>of</strong>ile shows important information about the effective vertical resolution <strong>of</strong> the state estimate.<br />
One easy way to represent this resolution is to calculate the Full Width, Half Maximum (FWHM) <strong>of</strong><br />
the averaging kernel. Simple linear extrapolation between points in the averaging kernel produces<br />
an estimate <strong>of</strong> FWHM that is not quantized by the level grid in the state vector. Figure 3.1 shows<br />
such a calculation for an averaging kernel for water vapor and temperature pr<strong>of</strong>iles. For cases<br />
where the state vector is not a vertical pr<strong>of</strong>ile, the averaging kernel will represent the amount <strong>of</strong><br />
correlation between different variables in the state estimate.<br />
<strong>The</strong> other key metric related to the A matrix is the Degrees <strong>of</strong> Freedom for Signal (DFS).<br />
<strong>The</strong> DFS is equal to the trace <strong>of</strong> A. It represents the amount <strong>of</strong> independent information in the<br />
state estimate that comes from the measurement vector. For pr<strong>of</strong>ile retrieval, this quantity can be<br />
considered as an estimate <strong>of</strong> the number <strong>of</strong> retrievable vertical levels in the measurement. In this<br />
research, the DFS will be the preferred metric, rather than the Shannon information contentH.<br />
<strong>The</strong> aim <strong>of</strong> OE is to obtain an averaging kernel that is as close to the identity matrix as possible,<br />
while reducing the effect <strong>of</strong> measurement error through the term Gǫ. A trade<strong>of</strong>f is made between<br />
reducing the amplitude <strong>of</strong> the error in the state estimate, and improving the resolution or reducing<br />
correlation in the state estimate. <strong>The</strong> OE framework as described here allows this trade<strong>of</strong>f to be<br />
made by selection <strong>of</strong> different prior covariances. High amplitude, uncorrelated prior covariances<br />
tend to reduce correlation and increase resolution in the state estimate, at the cost <strong>of</strong> increased error<br />
and potential instability in algorithm convergence. Lower variance, higher correlation priors will<br />
reduce noise but produce higher correlation and lower vertical resolution in the state estimate.<br />
3.1.3 OE Channel Selection<br />
<strong>The</strong> same OE mathematical framework can also be used to optimally select a subset <strong>of</strong> the<br />
full hyperspectral channel list. Two approaches based on Rodgers et al. (1996) can be used. For
30<br />
15<br />
Temperature<br />
15<br />
Water Vapor<br />
10<br />
10<br />
Altitude [km]<br />
5<br />
5<br />
0<br />
0 0.2 0.4<br />
Averaging Kernels<br />
0<br />
0 0.2 0.4<br />
Averaging Kernels<br />
Figure 3.1 Example Averaging Kernels for temperature and water vapor retrievals. Only every<br />
fifth kernel is plotted for brevity. <strong>The</strong> solid vertical black line segment illustrates the calculation<br />
<strong>of</strong> the FWHM for that kernel. Figure from Merrelli and Turner (2011).
31<br />
the first method, the DFS <strong>of</strong> each channel is computed directly. <strong>The</strong> first channel is selected by<br />
looping over all m channels, computing the DFS for each individual channel, and selecting the<br />
maximum. <strong>The</strong> posterior covariance is computed with an alternate form that is computationally<br />
simpler for this algorithm. It involves inverting a square matrix <strong>of</strong> size equal to the number <strong>of</strong><br />
selected channels (s), and requires one less matrix inversion than the form in equation 3.5. For the<br />
c th channel,<br />
Ŝ c = S a −S a K T c<br />
(<br />
Se,c +K c S a K T c<br />
) −1Kc<br />
S a (3.13)<br />
A c = ŜcK T cS −1<br />
e,cK c (3.14)<br />
where the term K c refers to the single row vector from K for channel c, and S e,c refers to the<br />
variance <strong>of</strong> channel c (a scalar). <strong>The</strong> subscript c on the posterior covariance signifies that this is<br />
the posterior related to that specific channel. <strong>The</strong> DFS is computed normally (trace(A c )), and the<br />
channel with the maximum DFS is selected. Later channels are selected in the same manner. First<br />
the matrixK s , is created, containing the rows <strong>of</strong>Kfor thesalready selected channels. This matrix<br />
is augmented by adding one additional row corresponding to one channel from the remainingm−s<br />
unselected channels. A similar operation constructs the covariance S e,s , which is then augmented<br />
by one <strong>of</strong> the remainingm−s unselected channels. This produces an array <strong>of</strong>m−s DFS values,<br />
as the calculation is repeated for each <strong>of</strong> them−s channels. Subtracting the DFS value from thes<br />
already selected channels yields the increase in DFS by adding any one <strong>of</strong> the unselected channels,<br />
though this is not needed for the channel selection step as the maximum DFS or maximum DFS<br />
increment would produce the same selection.<br />
This approach works for any form <strong>of</strong> S a or S e , but is quite time consuming due to the nested<br />
loops (looping over m − s channels for each selection <strong>of</strong> the s desired channels) and the matrix<br />
inversion at each iteration. <strong>The</strong> second approach is more computationally simple but requires that<br />
the error covarianceS e is diagonal. By first pre-scalingKbyS e and S a , yieldingK ′ ,<br />
K ′ = S −1/2<br />
e KS a<br />
1/2<br />
(3.15)
32<br />
then the DFS added by channel c, δDFS c , after a selection <strong>of</strong> s channels becomes a simple scalar<br />
vector product (Rodgers et al., 1996):<br />
δDFS c = (Ŝ s k T c )T (Ŝ s k T c )<br />
1+k c Ŝ s k T c<br />
(3.16)<br />
where Ŝ s is the posterior state covariance including the already selected s channels, and k c is the<br />
row from K ′ for channel c, which is under consideration for selection as channel s + 1. After<br />
this product is computed for all possiblem−s channels, the channel with the maximumδDFS is<br />
selected, and the posterior state covariance is updated to include the newly selected channel:<br />
Ŝ s+1 = Ŝ s<br />
I−k c (Ŝ s k c ) T<br />
1+k T cŜsk c<br />
(3.17)<br />
<strong>The</strong> optimized second approach is used where possible, which depends on whether a diagonal<br />
matrix is assumed forS e .<br />
Regardless <strong>of</strong> which calculation is used, the iterative selection algorithm is typically run until<br />
some desired fraction <strong>of</strong> the total DFS is reached. A single DFS calculation over the entire channel<br />
set is performed first, so then the running total DFS over the s selected channels can be converted<br />
to a DFS fraction. Because <strong>of</strong> the optimal selection, the majority <strong>of</strong> the total DFS (> 90%) can<br />
typically be reached after selecting approximately 20% <strong>of</strong> the channels.<br />
3.2 Forward Models<br />
3.2.1 LBLRTM<br />
<strong>The</strong> Line-By-Line Radiative Transfer Model (LBLRTM, Clough et al. (2005)) is a well validated<br />
model developed at <strong>Atmospheric</strong> and Environmental Research (AER). This work uses version<br />
11.6 and 11.7 <strong>of</strong> the model; the differences between the models do not significantly impact this<br />
study. Most changes occurred in the high wavenumber end <strong>of</strong> the spectrum (above 2000 cm −1 ).<br />
Some water vapor absorption lines in the wavenumber range 400–2000 cm −1 were modified, but<br />
these changes were minor and result in maximum changes <strong>of</strong> 0.05 K brightness temperature for<br />
a standard tropical atmosphere. <strong>The</strong> LBLRTM is used to compute the radiance for all clear sky
33<br />
cases. It has the added capability to compute analytic Jacobians for surface temperature, emissivity,<br />
pr<strong>of</strong>ile temperature, and concentrations pr<strong>of</strong>iles <strong>of</strong> any <strong>of</strong> the absorbing gas species used in<br />
the calculation. <strong>The</strong> line absorption data is derived primarily from HITRAN2004 (Rothman et al.,<br />
2005), with various updates to certain line data as determined by AER. In addition, LBLRTM allows<br />
for a Instrumental Line Shape (ILS) to be applied to the monochromatic simulated radiance,<br />
to produce a simulated observation from a specified Fourier transform spectrometer with one <strong>of</strong> a<br />
number <strong>of</strong> possible ILS functions. In all simulations, the top 7 HITRAN molecules are used. In<br />
order, these are: H 2 O, CO 2 , O 3 , N 2 O, CO, CH 4 , and O 2 .<br />
3.2.2 LBLDIS<br />
<strong>The</strong> LBLDIS (LBLrtm DISort) model (Turner, 2005) is used to compute all radiances and Jacobians<br />
for cloudy sky pr<strong>of</strong>iles. LBLDIS uses gaseous optical depth data computed from LBLRTM to<br />
describe the spectral absorption due to gas absorption lines. This optical depth data is computed at<br />
monochromatic resolution by LBLRTM, and averaged within spectral increments by LBLDIS. <strong>The</strong><br />
layer-to-instrument transmittance is computed at the monochromatic resolution, and then averaged<br />
within the defined spectral increments. <strong>The</strong> averaged transmittance is then converted back to an<br />
effective layer optical depth within the coarse spectral grid. LBLDIS uses DIScrete Ordinate Radiative<br />
Transfer (DISORT, Stamnes et al. (1988)) to compute the scattering and absorption through<br />
a cloud layer embedded within the atmosphere pr<strong>of</strong>ile. <strong>The</strong> LBLDIS expects an input scattering<br />
property database which describes the bulk scattering <strong>of</strong> the cloud particles, meaning the various<br />
scattering parameters (single scatter albedo, phase function, extinction efficiency) should represent<br />
the size distribution weighted quantities.<br />
Each layer cloud is defined at one vertical level. <strong>The</strong> cloud particles are assumed to be vertically<br />
homogeneous within the layer that contains the input cloud level, where the layering is defined by<br />
the pre-computed LBLRTM gaseous optical depth. For example, if the LBLRTM optical depth is<br />
computed on a layer grid defined by levels every 1 km from the ground level, placing a cloud at z<br />
= 4.5 km above ground in LBLDIS implies a 1 km thick, homogeneous cloud layer defined by the<br />
levels at z = 4 km and z = 5 km.
34<br />
A spectral grid consisting <strong>of</strong> a constant spectral increment between start and stop wavenumber<br />
is used for all LBLDIS calculations. As long as the spectral grid is not too coarse, the resulting<br />
spectrum should approximately represent an interferometer with a rectangular ILS function.<br />
3.3 Framework Details<br />
In Section 3.1.1, the key input terms in the OE mathematical framework are defined: the state<br />
vector x, the prior state x a and its covariance S a , the forward model F(x) and its Jacobian K(x),<br />
the measurement covariance S y , and the model error S F . In this section, each <strong>of</strong> these terms is<br />
described in detail in their usage and application in the present study.<br />
3.3.1 State Vector<br />
<strong>The</strong> state vector contains all geophysical parameters that will be retrieved in the OE algorithm.<br />
For the clear sky problem, this vector contains the surface temperature, pr<strong>of</strong>ile temperature, and the<br />
logarithm <strong>of</strong> the concentration <strong>of</strong> any gas absorbers that are included in the retrieval. <strong>The</strong> logarithm<br />
<strong>of</strong> the concentration is used because the effect <strong>of</strong> gas absorption on simulated radiance is closer to<br />
a logarithmic rather than linear variation. In addition, the pr<strong>of</strong>ile variation <strong>of</strong> some species (water<br />
vapor in particular) covers many orders <strong>of</strong> magnitude, so for numerical issues it is preferable to<br />
reduce the range in values covered by the state vector by using the logarithm.<br />
Since the thermodynamic and gas concentration pr<strong>of</strong>iles are physically continuous variables,<br />
there is freedom to select the level grid for the state space vector (the “design points”). <strong>The</strong> primary<br />
a priori data sources for the prior pr<strong>of</strong>iles are the radiosonde climatologies described in the<br />
next section and the standard atmosphere pr<strong>of</strong>iles (Anderson et al., 1986). <strong>The</strong> vertical sampling<br />
grid in radiosonde pr<strong>of</strong>iles is irregular due to the random nature <strong>of</strong> the balloon ascent. <strong>The</strong> vertical<br />
resolution is also very high, with spacing between samples <strong>of</strong> order 10–100 m. Each pr<strong>of</strong>ile is<br />
initially interpolated onto a common grid with 20 m vertical spacing to facilitate processing. This<br />
is far too high a vertical resolution for the design point selection, partly because <strong>of</strong> computational<br />
limitations within the forward model (LBLRTM is limited to
35<br />
vertical resolution <strong>of</strong> the retrieval itself is poor relative to the radiosonde data. Applying the information<br />
density analysis <strong>of</strong> Purser and Huang (1993) to these data shows a maximum <strong>of</strong> roughly 0.5<br />
km −1 in the middle troposphere with a rapid decrease above 12 km in altitude. Using this metric<br />
as a guideline, the design points for the vertical pr<strong>of</strong>ile are selected with the level spacing in the<br />
troposphere at 0.5 km (implying a resolution <strong>of</strong> 2.0 km −1 ). Above 11 km, the spacing increases<br />
smoothly, up to a maximum <strong>of</strong> 2.6 km at the last level, at an altitude <strong>of</strong> 31.9 km. In total, there are<br />
40 levels from 0–31.9 km.<br />
For cloudy pr<strong>of</strong>iles, additional parameters describing the layer cloud are added. <strong>The</strong> macrophysical<br />
properties cloud height and visible optical depth are included in all cases. <strong>The</strong> microphysical<br />
properties include parameters describing the particle size distribution. <strong>The</strong>se will be covered<br />
in more detail in Chapter 5.<br />
3.3.2 Prior State and Covariance<br />
For the atmospheric pr<strong>of</strong>iles, the prior states are defined in two ways: selecting a pr<strong>of</strong>ile with<br />
a synthetic covariance matrix, or selecting a pr<strong>of</strong>ile with a covariance matrix derived from a radiosonde<br />
climatology.<br />
In the first method, the prior mean state is selected, typically from one <strong>of</strong> the standard atmosphere<br />
pr<strong>of</strong>iles (Anderson et al., 1986). <strong>The</strong> inter-level correlation is then assumed to follow a<br />
simple exponential decay as a function <strong>of</strong> level separation. In the most general sense, the a priori<br />
covariance as a continuous function <strong>of</strong>z would be expressed as:<br />
−<br />
z i −z j<br />
∣<br />
S a (z i ,z j ) = σ(z i )σ(z j )e L(i,j) ∣<br />
(3.18)<br />
By discretizing the z coordinate, and assuming a fixed scale length L, the discrete covariance<br />
matrixS a;i,j is:<br />
−<br />
z i −z j<br />
∣<br />
S a;i,j = σ i σ j e L<br />
∣<br />
(3.19)<br />
For this simplified covariance matrix, no correlation is assumed between the different pr<strong>of</strong>ile variables,<br />
meaning no correlation between temperature and water vapor (or any other constituent). An
36<br />
0<br />
T<br />
Covariance Matrix<br />
TQ<br />
0<br />
T<br />
Correlation Matrix<br />
TQ<br />
1.0<br />
0.9<br />
T<br />
10<br />
20<br />
TQ<br />
16<br />
T<br />
10<br />
20<br />
TQ<br />
0.8<br />
0.7<br />
30<br />
9<br />
30<br />
0.6<br />
0<br />
0<br />
0.5<br />
TQ<br />
10<br />
20<br />
Q<br />
4<br />
TQ<br />
10<br />
20<br />
Q<br />
0.4<br />
0.3<br />
30<br />
1<br />
30<br />
0.2<br />
0 10 20 30 0 10 20 30<br />
TQ<br />
Q<br />
0<br />
0 10 20 30 0 10 20 30<br />
TQ<br />
Q<br />
0.1<br />
0.0<br />
Figure 3.2 Synthetic prior covariance matrix (left) and correlation matrix (right) for temperature<br />
(T) and water vapor (Q) using equation 3.19. Level numbering starts from the surface at level 0,<br />
to the TOA at level 39.<br />
example 40 level covariance matrix is shown in Figure 3.2. In this case, the temperature variance<br />
is a linear ramp from 25 to 1 K 2 , and the water vapor variance is constant, equal to 1, for the logarithm<br />
<strong>of</strong> the water vapor mass mixing ratio. <strong>The</strong> vertical scale lengthLis 6 km for temperature and<br />
3 km for water vapor. <strong>The</strong> leveling starts at 0 at the surface, so the apparent sharpening at higher<br />
level numbers is due to the more widely spaced levels at high altitudes.<br />
In the second method, a radiosonde climatology is used to directly compute the covariance<br />
from an ensemble <strong>of</strong> measurements. Data from the ARM Climate Research Facilities (ACRF)<br />
is used for this purpose (Ackerman and Stokes, 2003). <strong>The</strong> ARCF sites feature twice daily radiosonde<br />
launches. Three sites are selected to span a wide range in atmosphere conditions: North<br />
Slope Alaska (NSA) at Barrow, Alaska; the Southern Great Plains (SGP) site at Lamont, Oklahoma;<br />
and the Tropical West Pacific (TWP-C3) site at Darwin, Northern Territory, Australia.<br />
Yearly and seasonal climatologies are constructed for each site; the seasonal climatologies include<br />
all pr<strong>of</strong>iles within the typical 3 month seasons [December–February (DJF), March–May (MAM),<br />
June–August (JJA), and September–November (SON)] plus 15 additional days before and after<br />
the 3 month window. Initially, bad radiosonde pr<strong>of</strong>iles are removed from the dataset by various
37<br />
automatic checks: extremely high or low temperatures, large data gaps, or pr<strong>of</strong>ile truncation below<br />
the tropopause. In addition, some manual outlier removal was performed to remove bad humidity<br />
pr<strong>of</strong>iles that showed unphysical variations. <strong>The</strong>se data quality filters removed at most a few percent<br />
<strong>of</strong> the radiosonde pr<strong>of</strong>iles. A humidity correction (Cady-Pereira et al., 2008) is then applied to the<br />
each quality checked pr<strong>of</strong>ile.<br />
Standard atmosphere data is used for all other inputs required by the forward model that are not<br />
measured by the radiosondes. <strong>The</strong>se additional data are primarily concentrations <strong>of</strong> infrared active<br />
trace gases (CH 4 , O 3 , N 2 O, CO). In addition, the stratospheric data from the radiosonde is discarded.<br />
Altitudes above the tropopause are not consistently sampled since the maximum altitude<br />
reached by the radiosonde balloon is <strong>of</strong>ten in the lower stratosphere. <strong>The</strong> humidity measurements<br />
are not reliable in the very cold and dry stratosphere conditions. <strong>The</strong> stratosphere pr<strong>of</strong>ile in the<br />
prior is taken from the corresponding standard atmosphere pr<strong>of</strong>ile. Each pr<strong>of</strong>ile within a particular<br />
composite uses the closest matching standard atmosphere. For example, all seasonal Darwin composite<br />
pr<strong>of</strong>iles are combined with the standard tropical pr<strong>of</strong>ile. <strong>The</strong> SGP winter (summer) pr<strong>of</strong>ile<br />
is combined with the standard midlatitude winter (summer) pr<strong>of</strong>ile, and the spring and autumn<br />
SGP pr<strong>of</strong>iles are combined with an average <strong>of</strong> the two standard midlatitude pr<strong>of</strong>iles. <strong>The</strong> NSA<br />
seasonal pr<strong>of</strong>iles are combined with the standard subarctic pr<strong>of</strong>iles in an analogous manner. <strong>The</strong><br />
transition between troposphere radiosonde data and stratosphere standard atmosphere data occurs<br />
at the tropopause, which occurs at level 19 in the subarctic winter pr<strong>of</strong>ile (9 km altitude) and level<br />
32 in the tropical pr<strong>of</strong>ile (17 km altitude). <strong>The</strong> data on either side <strong>of</strong> the transition level is smoothed<br />
to prevent sharp discontinuities in the pr<strong>of</strong>iles. A small amplitude random fluctuation (1 K RMS<br />
for temperature, 30% RMS for log water vapor mixing ratio) is added to each stratospheric level,<br />
before computing the covariance. <strong>The</strong> covariance within the stratosphere is therefore diagonal with<br />
added sampling noise.<br />
For clear sky priors, the pr<strong>of</strong>iles are also filtered to remove cloudy pr<strong>of</strong>iles. Cloudy pr<strong>of</strong>iles are<br />
indicated by layers with saturated relative humidity levels in the high resolution (20 m) gridded<br />
data before interpolation to the coarse level grid. Pr<strong>of</strong>iles with relative humidity over water or ice<br />
(for T < −10 ◦ C) greater than 100% for two samples were classified as cloudy. Two samples
38<br />
T<br />
0<br />
10<br />
20<br />
30<br />
T<br />
Covariance Matrix<br />
TQ<br />
TQ<br />
2.0<br />
1.5<br />
1.0<br />
0.5<br />
T<br />
0<br />
10<br />
20<br />
30<br />
T<br />
Correlation Matrix<br />
TQ<br />
TQ<br />
1.0<br />
0.8<br />
0.6<br />
0.4<br />
0.2<br />
0<br />
0.0<br />
0<br />
0.0<br />
TQ<br />
10<br />
20<br />
30<br />
0 10 20 30 0 10 20 30<br />
TQ<br />
Q<br />
Q<br />
−0.5<br />
−1.0<br />
−1.5<br />
−2.0<br />
TQ<br />
10<br />
20<br />
30<br />
0 10 20 30 0 10 20 30<br />
TQ<br />
Q<br />
Q<br />
−0.2<br />
−0.4<br />
−0.6<br />
−0.8<br />
−1.0<br />
Figure 3.3 Computed covariance (left) and correlation (right) matrices, for the prior covariance<br />
computed at Darwin for DJF. Level numbering follows the convention in 3.2, so the upper left is<br />
the surface temperature point, and the lower right is the TOA water vapor pr<strong>of</strong>ile point. Figure<br />
from Merrelli and Turner (2011).<br />
implies a roughly 40 m layer for the high vertical resolution gridded data. For the Arctic data,<br />
these thresholds caused a large number <strong>of</strong> pr<strong>of</strong>iles to be classified as cloudy. To get a statistically<br />
significant sample for the seasonal composites, the count threshold was increased to five (from<br />
two), and points in the lowest 200 m altitude were ignored. <strong>The</strong> physical justification for these ad<br />
hoc threshold changes is that a relatively thicker saturated layer is needed to constitute a cloud layer<br />
with enough optical thickness to affect the infrared emission in arctic conditions where the water<br />
vapor content is much lower. <strong>The</strong> low altitude saturated points are likely occurring in blowing<br />
snow or diamond dust conditions which would not be detected as a cloud layer.<br />
Figure 3.3 shows the computed covariance and correlation matrices for the clear sky Darwin<br />
DJF prior. <strong>The</strong> stratospheric levels stand out because the high altitude portion <strong>of</strong> the covariance<br />
matrix becomes approximately diagonal.
39<br />
3.3.3 Forward Model and Jacobian<br />
For Jacobian calculations, the LBLRTM computes analytic derivatives for surface temperature,<br />
surface emissivity, temperature and molecular concentration pr<strong>of</strong>iles. Any clear sky calculation in<br />
this work uses the LBLRTM analytic calculation. For LBLDIS, a simple first order finite difference<br />
is used to compute the Jacobian. Specifically, for the i th state variable, the corresponding column<br />
<strong>of</strong>Kis computed as:<br />
K i (x) = F(x+δx ie i )−F(x)<br />
δx i<br />
(3.20)<br />
where e i is the unit vector for state variable i, meaning a value <strong>of</strong> 1 in the i th element and 0<br />
otherwise. <strong>The</strong> size <strong>of</strong> the increment δx i is made as small as possible while still producing a<br />
large enough change in the simulated radiance so that the difference is larger than any numerical<br />
error in the calculation (e.g., floating point round<strong>of</strong>f). For temperatures and cloud heights, the<br />
increment is an additive 0.1 K and 20 m, respectively. For other variables, including water vapor,<br />
cloud parameters (particle effective radius, optical depth, or particle PSD parameters), these are<br />
multiplicative increments in the range <strong>of</strong> 1%–5%.<br />
3.3.4 Sensor Description, Including Measurement Covariance<br />
<strong>The</strong> simulated sensors in this study resemble the planned infrared component <strong>of</strong> the CLimate<br />
Absolute Radiance and Refractivity Observatory (CLARREO). One <strong>of</strong> the primary objectives <strong>of</strong><br />
CLARREO is to measure the spectral radiance <strong>of</strong> Earth’s outgoing infrared emission with high<br />
absolute measurement accuracy. <strong>The</strong> planned infrared instrument is a Fourier Transform Spectrometer<br />
(FTS) with 0.5 cm −1 spectral resolution. <strong>The</strong> spectral coverage from 200–2000 cm −1<br />
would be covered by one FIR-optimized and one MIR-optimized detector. <strong>The</strong> essential specifications<br />
<strong>of</strong> the simulated sensors roughly match this design. <strong>The</strong> spectral Noise Equivalent Delta<br />
Radiance (NEDR) follows from specifications <strong>of</strong> the potential pyroelectric FIR detector and photoelectric<br />
MIR detector that would be used in the CLARREO instrument. (Mlynczak, 2010; Merrelli<br />
and Turner, 2011). <strong>The</strong> two detector FTS design is also similar to the <strong>Atmospheric</strong> Emitted Radiance<br />
Interferometer (AERI, Knuteson et al. (2004b)) with the shortwave detector in the AERI
40<br />
Table 3.1 Key characteristics <strong>of</strong> the simulated instrument.<br />
Sensor Number <strong>of</strong> wavenumber wavelength minimum NEDT<br />
band channels range range at 250 K<br />
[cm −1 ] [µm]<br />
FIR 1006 200–685 50.0–14.6 0.18 K (at 600 cm −1 )<br />
MIR 2904 650–2050 15.4–4.88 0.17 K (at 760 cm −1 )<br />
replaced with an FIR detector. <strong>The</strong> MIR noise assumed in this study is similar to the longwave<br />
AERI detector noise. <strong>The</strong> FIR noise level may be significantly larger than the MIR noise. In order<br />
to compare the impact, a second noise curve will also be used in some calculations to see the<br />
impact <strong>of</strong> noise on the information content metrics. <strong>The</strong> low and high noise levels are different<br />
by a multiplicative factor <strong>of</strong> 3 in standard deviation (9 in variance). Figure 3.4 shows the assumed<br />
sensor noise as NEDR curves. <strong>The</strong> curves marked as dashed lines are the “high noise” curves. For<br />
the CLARREO instrument, the total NEDR curve will likely be the high noise curve for the FIR<br />
and the low noise curve for the MIR. Later comparisons will be mainly be in this configuration,<br />
but additional comparisons will be made between sensors at identical noise levels.<br />
<strong>The</strong> wavenumber sampling and optical path difference is identical to the AERI (0.482 cm −1 and<br />
OPD = 1.037 cm), although there are some additional complications to consider when comparing<br />
the spectral radiance computed by the different forward models (see Sections 3.3.4.1 and 3.3.4.2).<br />
<strong>The</strong>se spectral characteristics are summarized in Table 3.1. Since no apodization is used, the<br />
measurement noise covariance is assumed to be diagonal. This assumption is generally quite<br />
reasonable for spectral measurements from an FTS (Antonelli et al., 2004; Turner and Löhnert,<br />
2012).
41<br />
NEdR [mW/m 2 /sr/cm −1 ]<br />
2<br />
1.5<br />
1<br />
0.5<br />
0<br />
NEdR for simulated interferometers<br />
FIR Sensor<br />
MIR Sensor<br />
500 1000 1500 2000<br />
Wavenumber [cm −1 ]<br />
Figure 3.4 NEDR curves for the simulated spectrometer. <strong>The</strong> dashed lines denote the “high<br />
noise” simulated detectors, and the solid curves denote the “low noise” simulated detectors.<br />
Figure from Merrelli and Turner (2011).
42<br />
3.3.4.1 Spectral Sampling in LBLRTM<br />
For all LBLRTM radiance simulations, the ILS shape is assumed to be the unapodized sinc<br />
function for the idealized interferometer. <strong>The</strong> optical path and sampling is taken from the AERI,<br />
specifically OPD = 1.037 cm, and sampling∆ν = 0.48215 cm −1 (Knuteson et al., 2004b).<br />
3.3.4.2 Spectral Sampling in LBLDIS<br />
As described in 3.2.2, the LBLDIS averages quantities within the defined spectral increment<br />
width, which results in a rectangular function ILS. For simplicity, the spectral grid is set to 0.5<br />
cm −1 , which is slightly coarser than the LBLRTM grid (0.48215 cm −1 ). Although changing the<br />
spectral sampling in an interferometer should change the noise level, this is a very small discrepancy<br />
(3%), so the same NEDR curve is applied for simulated measurements from either model.<br />
In the overall framework, since the same forward model is generating synthetic measurements<br />
as is used in the retrieval (a “perfect model” assumption), and the spectrometers are modeled as idealized<br />
interferometers, the difference between the LBLDIS spectrum and the LBLRTM spectrum<br />
should only be a difference in convolution kernel: rectangle function for LBLDIS, sinc function<br />
for LBLRTM. Convolution is a linear operation, so it should not affect the information content calculations<br />
within this framework. To verify this assumption, two extra calculations were run with<br />
LBLDIS at a much higher spectral resolution (0.05 cm −1 , a factor <strong>of</strong> 10 higher in resolution), with<br />
a thin (τ = 0.2) and thick (τ = 10.0) cloud at z = 14 km in a standard tropical atmosphere pr<strong>of</strong>ile.<br />
<strong>The</strong> resulting radiances and radiance Jacobians are convolved with the same sinc function ILS as<br />
LBLRTM, and these calculations are compared to the default LBLDIS configuration with 0.5 cm −1<br />
rectangular function ILS. Each set <strong>of</strong> Jacobians is used to compute DFS, following the calculations<br />
in equation 3.7. <strong>The</strong> final computed DFS for both simulated sensors (FIR-only, MIR-only, FIR +<br />
MIR combined) are very close, with a maximum discrepancy between the different DFS metrics<br />
<strong>of</strong> 1%.
43<br />
Chapter 4<br />
<strong>Information</strong> <strong>Content</strong> in Clear Sky Pr<strong>of</strong>iles 1<br />
<strong>The</strong> clear sky vertical pr<strong>of</strong>ile <strong>of</strong> temperature and water vapor is the primary retrieved geophysical<br />
data from the hyperspectral infrared sounder. In this chapter, the information content, vertical<br />
resolution, and robustness to simulated model error are studied for both FIR and MIR hyperspectral<br />
observations. Since both spectra are simulated within the same framework, quantitative comparisons<br />
can be made between the various metrics. <strong>The</strong> results show where retrievals from FIR spectra<br />
can complement or improve upon the same retrieval from MIR spectra.<br />
4.1 Methods<br />
4.1.1 Modeled Sensors<br />
<strong>The</strong> FIR and MIR spectrometers are described in Chapter 3, and the key specifications are listed<br />
in Table 3.1. <strong>The</strong> “base” instruments use the low noise (solid curve) NEDR curves shown in Figure<br />
3.4. In addition to the base instruments, two additional instrument pairs are considered: high noise<br />
and high spectral resolution. <strong>The</strong> high noise pair have the same characteristics except have NEDR<br />
curves that are a factor <strong>of</strong> 3 higher (the dashed curves in Figure 3.4). <strong>The</strong> high spectral resolution<br />
pair has the same characteristics but uses a factor <strong>of</strong> 4 higher OPD (4.148 cm) and a factor <strong>of</strong> 4<br />
reduction in the spectral sample increment (0.12 cm −1 ). <strong>The</strong> same NEDR curve is used at this<br />
higher spectral resolution. This does imply an observation requiring a factor <strong>of</strong> 4 longer in dwell<br />
time, since the interferogram would need to be measured by the FTS detector over the longer OPD<br />
1 Portions <strong>of</strong> this chapter were published in Merrelli and Turner (2011) and are copyright <strong>of</strong> the American Meteorological<br />
Society.
44<br />
with the same scan rate. <strong>The</strong>se three sets <strong>of</strong> instruments will be labeled “base”, “NEDR ×3”, and<br />
“∆ν/4” in later figures.<br />
4.1.2 State Vector<br />
Since the focus <strong>of</strong> this analysis is the thermodynamic pr<strong>of</strong>ile, the assumed surface properties<br />
are quite simple. <strong>The</strong> surface is assumed to be a greybody with constant spectral emissivity <strong>of</strong> ǫ<br />
= 0.95. <strong>The</strong> surface temperature is assumed to be equal to the temperature <strong>of</strong> the level at z = 0.<br />
<strong>The</strong> final state vector for the clear sky analysis consists <strong>of</strong> per-level pr<strong>of</strong>iles <strong>of</strong> temperature and the<br />
logarithm <strong>of</strong> water vapor mass mixing ratio with the level grid as described in Section 3.3.1.<br />
4.1.3 Clear Sky Priors<br />
After constructing all the composite radiosonde prior covariances (section 3.3.2), a subset <strong>of</strong><br />
four was selected in order to simplify the analysis. <strong>The</strong> four composites, ordered by total water<br />
vapor amount, are NSA DJF, SGP DJF, SGP JJA, and Darwin DJF. <strong>The</strong>se priors roughly span the<br />
same climatological range as the standard atmosphere pr<strong>of</strong>iles (subarctic, midlatitude, tropical),<br />
but have the additional information about covariance among levels in the temperature and water<br />
vapor pr<strong>of</strong>iles. Figure 4.1 shows the prior mean temperature and water vapor mass mixing ratio<br />
pr<strong>of</strong>iles.<br />
4.1.4 Ad Hoc Channel Selections<br />
Due to the simplistic surface assumption (constant emissivity), the spectral information from<br />
the surface is entirely redundant over all surface sensitive channels. In order to reduce the computational<br />
complexity <strong>of</strong> the retrievals, most <strong>of</strong> the window region (770–1228 cm −1 ) is removed<br />
from the MIR spectrum. <strong>The</strong> removal <strong>of</strong> the window region also removes the primary O 3 absorption<br />
feature at 1040 cm −1 . Since no detailed a priori data for O 3 is used in this study, there is no<br />
need to consider these channels.<br />
One important consideration for thermodynamic pr<strong>of</strong>ile retrieval is characterization <strong>of</strong> other<br />
radiometric signatures in the radiance spectrum that can interfere with the signatures needed for
45<br />
25<br />
20<br />
Temperature and Water Vapor Prior Pr<strong>of</strong>iles<br />
Darwin DJF<br />
SGP JJA<br />
SGP DJF<br />
NSA DJF<br />
Altitude [km]<br />
15<br />
10<br />
5<br />
0<br />
200 250 300<br />
Temperature [K]<br />
10 −3 10 −2 10 −1 10 0 10 1<br />
W.V. mass mixing ratio [g/kg]<br />
Figure 4.1 Mean temperature and water vapor mass mixing ratio pr<strong>of</strong>iles for the four selected<br />
clear sky composite priors. Figure from Merrelli and Turner (2011).
46<br />
pr<strong>of</strong>ile retrieval. For the clear sky problem, the important signatures are trace gases, surface temperature<br />
and surface emissivity. <strong>The</strong>se signatures can easily introduce bias error in the thermodynamic<br />
pr<strong>of</strong>ile if not handled appropriately. One way to limit their impact is to simply censor them<br />
from the spectrum used in the retrieval. For thermodynamic pr<strong>of</strong>iling, the temperature and water<br />
vapor is spread over a large fraction <strong>of</strong> the IR spectrum and covers a large number <strong>of</strong> the available<br />
channels. <strong>The</strong>re is a large degree <strong>of</strong> redundant information in these channels, so discarding a small<br />
fraction <strong>of</strong> the available channels should cause minimal degradation in the information content.<br />
In order to remove the effect <strong>of</strong> trace gas interference, a simple ad hoc channel selection is<br />
used. <strong>The</strong> three primary infrared active molecules after water vapor and CO 2 are O 3 , CH 4 and<br />
N 2 O. For each <strong>of</strong> these molecules, the pr<strong>of</strong>ile is scaled by 5% relative to the standard atmosphere<br />
concentration, and the radiance is computed using LBLRTM in the standard configuration. Each<br />
difference spectrum (5% perturbation versus unperturbed pr<strong>of</strong>ile) is compared to the NEDR curve,<br />
and any channel that shows a change that is larger than 0.5 times the NEDR at that channel is added<br />
to the “ignore list”. This calculation is repeated for each ACRF climatology, and the total ignore<br />
list consists <strong>of</strong> the union <strong>of</strong> all lists. <strong>The</strong> primary trace gas absorption features identified with these<br />
calculations are N 2 O at 590 cm −1 , O 3 at 700 cm −1 , and CH 4 and N 2 O at 1300 cm −1 . Figure 4.2<br />
shows the identified channels overplotted on a brightness temperature spectrum computed from<br />
the Darwin DJF mean pr<strong>of</strong>ile. Note the large gap from 770–1228 cm −1 where the window and O 3<br />
sensitive channels are ignored.<br />
4.2 Results<br />
4.2.1 Simulated Forward Model Errors<br />
Since the state vector only includes the temperature and water vapor pr<strong>of</strong>iles, the surface temperature,<br />
surface emissivity and trace gas pr<strong>of</strong>iles are not retrieved. <strong>The</strong>se variables are set to the<br />
a priori values (bottom level temperature, ǫ = 0.95, and the standard atmosphere trace gas pr<strong>of</strong>iles).<br />
If the upwelling radiance measurement is simulated with a different surface property or<br />
trace gas pr<strong>of</strong>ile, while the forward model continues to use the a priori value, the difference essentially<br />
creates a forward model error. Random differences were applied to several variables to
47<br />
300<br />
Ignored channels in Darwin DJF composite<br />
Brightness Temperature [K]<br />
290<br />
280<br />
270<br />
260<br />
250<br />
240<br />
230<br />
220<br />
210<br />
200<br />
200 400 600<br />
800 1000 1200 1400 1600 1800 2000<br />
Wavenumber [cm −1 ]<br />
Figure 4.2 Simulated brightness temperature spectrum with ignored channels marked with<br />
circles. See text for description. Figure from Merrelli and Turner (2011).
48<br />
create such forward model errors. For the surface property, a perturbation to the temperature or<br />
gray body emissivity would produce nearly the same effect on the simulated radiance, so only a<br />
surface temperature perturbation is used. <strong>The</strong> temperature perturbation is an additive error drawn<br />
from a Gaussian probability distribution with a standard deviation <strong>of</strong> 0.25 K. For trace gas pr<strong>of</strong>iles,<br />
the total column is perturbed by a multiplicative factor, which is a drawn from a Gaussian with<br />
a standard deviation <strong>of</strong> 2.5%. <strong>The</strong>se perturbations are applied to the CH 4 and N 2 O pr<strong>of</strong>iles, as<br />
these showed the most impact on the final retrieval error. <strong>The</strong> 2.5% variations are roughly consistent<br />
with observed seasonal variations in total column amounts observed with remote sensing<br />
techniques based on differential solar absorption (Dils et al., 2006).<br />
A number <strong>of</strong> retrieval experiments are run to compute sample estimates <strong>of</strong> the retrieval error.<br />
Each experiment involves 30 retrievals over an ensemble <strong>of</strong> independent sensor noise realizations,<br />
using the prior mean state and the measurement vector corresponding to the prior mean state.<br />
<strong>The</strong> baseline experiment has no forward model perturbation, so the resulting retrieval error is<br />
only caused by the random sensor noise. This represents an error “floor” for the retrieved state.<br />
Three additional experiments are run, for each <strong>of</strong> three simulated forward model errors: surface<br />
temperature, CH 4 pr<strong>of</strong>ile, and N 2 O pr<strong>of</strong>ile perturbations. <strong>The</strong> retrieval error for each <strong>of</strong> these cases<br />
will be increased by some amount dependent on the sensitivity <strong>of</strong> the retrieval to that forward<br />
model error. <strong>The</strong> basic error statistic is the Root Mean Square (RMS) <strong>of</strong> the difference between the<br />
mean retrieved pr<strong>of</strong>ile and the truth (prior mean) pr<strong>of</strong>ile. <strong>The</strong> mean retrieved pr<strong>of</strong>ile is the average<br />
over the 30 pr<strong>of</strong>iles with independent sensor noise realizations. Since the RMS is computed for<br />
the mean retrieved pr<strong>of</strong>ile, the uncorrelated random error due to sensor noise is reduced through<br />
averaging by a factor <strong>of</strong> approximately √ 30. <strong>The</strong> error in the retrieved pr<strong>of</strong>ile due to the forward<br />
model error may be correlated, which would imply less reduction in the RMS through averaging.<br />
Any retrieval that did not converge was discarded. This only occurred for surface temperature<br />
perturbations to pr<strong>of</strong>iles with low water vapor amounts. Finally, each set <strong>of</strong> experiments was run<br />
with the full channel set (all FIR channels, and MIR with the window channels removed, 770–1228<br />
cm −1 ), and again with the ad hoc ignore list <strong>of</strong> channels sensitive to trace gas perturbations (section<br />
4.1.4).
49<br />
<strong>The</strong> RMS error results are shown for all experiments in Figure 4.3. <strong>The</strong> baseline temperature<br />
error is in the range 0.05–0.12 K for all cases, while the baseline water vapor error is in the range<br />
0.05 g kg −1 for the tropical pr<strong>of</strong>ile and 0.003 g kg −1 for the arctic pr<strong>of</strong>ile. <strong>The</strong> baseline errors are<br />
approximately equal when comparing the MIR and FIR retrievals.<br />
<strong>The</strong> different sensitivities to the forward model errors qualitatively follow expectations, given<br />
the location <strong>of</strong> the trace gas absorption bands and the highly variable total column water vapor in<br />
the different mean pr<strong>of</strong>iles. First, focusing on the retrievals with full channels (the solid lines), the<br />
surface temperature error is shown to increase sharply as the water vapor amount decreases. For the<br />
FIR measurement in the tropical atmosphere, the transmission to the surface is zero everywhere,<br />
so the retrieval is unaffected by the temperature error. A similar but not as direct pattern is seen<br />
in the MIR results, since there is relatively more transmission to the surface in all climatologies.<br />
<strong>The</strong> MIR results do show a drop in temperature error from the SGP JJA pr<strong>of</strong>ile to SGP DJF, which<br />
acts opposite to the change in water vapor amount between the two pr<strong>of</strong>iles. <strong>The</strong> reason for this<br />
discrepancy is not clear, though it is likely related to the different covariance structures in the two<br />
priors. <strong>The</strong> perturbation to the CH 4 pr<strong>of</strong>ile only affects the MIR, since the associated absorption<br />
band is centered in the MIR at 1300 cm −1 . <strong>The</strong> effect is weakest in the arctic mean pr<strong>of</strong>ile, since<br />
there is relatively less interference due to the low water vapor amounts and thus the overlapping<br />
water vapor absorption lines are much weaker. <strong>The</strong> effect is strongest in the SGP DJF pr<strong>of</strong>ile,<br />
which may indicate that retrieval sensitivity to CH 4 perturbations is maximum for particular water<br />
vapor column amounts. Similar to the CH 4 perturbation, the N 2 O perturbation shows the least<br />
impact in the low water vapor arctic pr<strong>of</strong>ile, and the maximum for the SGP DJF pr<strong>of</strong>ile. It shows<br />
essentially no impact on the water vapor error for the arctic pr<strong>of</strong>ile. N 2 O has strong absorption<br />
features in both the MIR and FIR, so the perturbation does cause errors in both bands, but the error<br />
increase is much smaller in the FIR.<br />
Applying the ad hoc channel selection to remove interfering trace gases shows significant improvement<br />
for the CH 4 and N 2 O results, but no impact on the surface temperature, as expected. For<br />
CH 4 , there is still residual temperature error in the SGP DJF pr<strong>of</strong>ile, and residual water vapor error<br />
in all but the arctic pr<strong>of</strong>ile (which was not effected by CH 4 at all). Even though CH 4 absorption
50<br />
lines only exist in the water vapor absorption bands, they can introduce temperature error due to<br />
the fact that the water vapor and temperature Jacobians tend to correlate these state variables. For<br />
example, consider a real atmosphere pr<strong>of</strong>ile that contains excess optical depth at wavenumbers in<br />
the 1300–1400 cm −1 range due to increased CH 4 concentration above the assumed prior value. If<br />
the temperature decreases with height through the altitude spanned by the relevant weighting functions,<br />
then at these wavenumbers the simulated spectrum would show a higher radiance than the<br />
observed spectrum. <strong>The</strong> residual between the simulated and the measured radiance spectrum could<br />
be compensated in the state estimate update by either an increase in water vapor concentration or a<br />
decrease in temperature. <strong>The</strong> actual state estimate will quite likely contain a combination <strong>of</strong> both<br />
compensating adjustments. It is very unlikely that the adjustment would only be made in the water<br />
vapor pr<strong>of</strong>ile, so the result is an incorrect adjustment to the temperature pr<strong>of</strong>ile, and an increased<br />
temperature error. <strong>The</strong> error that remains while using the ad hoc channel selection is likely caused<br />
by residual weak CH 4 lines that were not included in selection because the radiance change did<br />
not pass the NEDR-based threshold. Similarly to CH 4 , applying the ad hoc selection improved the<br />
error for the N 2 O as well, with some residual error left over in the MIR water vapor retrieval.<br />
4.2.2 Applied OE Channel Selection<br />
By using the ordered channel selection list from the OE selection algorithm, the DFS can be<br />
plotted as a function <strong>of</strong> the number <strong>of</strong> selected channels. Dividing by the total DFS contained<br />
within the entire channel set shows the fractional DFS and allows for easier comparison between<br />
calculations that have different total DFS. Figure 4.4 shows this result for one composite prior and<br />
all modeled sensors. Only one composite is plotted for clarity. Other composite priors produce<br />
very similar curves. <strong>The</strong>se fractional DFS curves have many common features. For the first s<br />
channel selections, the channels are largely independent, so each new channel nearly 1 additional<br />
DFS. This only continues for a few channels, roughlys < 8. As the number <strong>of</strong> channels increases,<br />
the fractional DFS grows much slower as additional channels are correlated to channels that have<br />
already been selected. <strong>The</strong> OE selection does concentrate information within theseschannels, but<br />
there is always some fraction in the remaining m − s channels. For example in Figure 4.4 the
51<br />
RMS Error [K]<br />
0.4<br />
0.2<br />
0<br />
Darwin<br />
DJF<br />
Baseline<br />
SGP<br />
JJA<br />
SGP<br />
DJF<br />
NSA<br />
DJF<br />
RMS Error [g/kg]<br />
10 0 Baseline<br />
10 −1<br />
10 −2<br />
Darwin<br />
DJF<br />
SGP<br />
JJA<br />
SGP<br />
DJF<br />
NSA<br />
DJF<br />
RMS Error [K]<br />
1.5<br />
1<br />
0.5<br />
0<br />
Darwin<br />
DJF<br />
T surface<br />
SGP<br />
JJA<br />
SGP<br />
DJF<br />
NSA<br />
DJF<br />
RMS Error [g/kg]<br />
10 0 T surface<br />
10 −1<br />
10 −2<br />
Darwin<br />
DJF<br />
SGP<br />
JJA<br />
SGP<br />
DJF<br />
NSA<br />
DJF<br />
RMS Error [K]<br />
RMS Error [K]<br />
0.4<br />
0.2<br />
0<br />
0.4<br />
0.2<br />
0<br />
Darwin<br />
DJF<br />
Darwin<br />
DJF<br />
CH 4<br />
SGP SGP<br />
JJA DJF<br />
N O 2<br />
SGP<br />
JJA<br />
SGP<br />
DJF<br />
NSA<br />
DJF<br />
NSA<br />
DJF<br />
RMS Error [g/kg]<br />
RMS Error [g/kg]<br />
10 0 CH 4<br />
10 −1<br />
10 −2<br />
Darwin<br />
DJF<br />
SGP<br />
JJA<br />
10 0 N 2<br />
O<br />
10 −1<br />
10 −2<br />
Darwin<br />
DJF<br />
SGP<br />
JJA<br />
SGP<br />
DJF<br />
SGP<br />
DJF<br />
NSA<br />
DJF<br />
NSA<br />
DJF<br />
Figure 4.3 (left) RMS Error for temperature (right) and water vapor mass mixing ratio for various<br />
simulated forward model errors. <strong>The</strong> results are shown for MIR (square markers, dark gray lines)<br />
and FIR (X markers, light gray lines). Solid lines use maximum channels, and dashed lines ignore<br />
channels with significant interference from trace gases (see text for description), Note they-axis<br />
is identical for all temperature plots except for the larger range for the surface temperature<br />
perturbation. <strong>The</strong>y-axis display range for all water vapor errors is identical and logarithmic.<br />
Figure from Merrelli and Turner (2011).
52<br />
selections are stopped at 250 channels for the base and NEDR×3 spectrometers and 500 channels<br />
for the∆ν/4 spectrometers. <strong>The</strong>se cut<strong>of</strong>fs were chosen so that> 80% <strong>of</strong> the total DFS are retained<br />
in all selected subsets. From the logarithmic scaling in the plot, it is clear that reducing the DFS loss<br />
from 20% to 10% would require a much larger number <strong>of</strong> retained channels (over 1000 for the MIR<br />
∆ν/4 spectrometer). <strong>The</strong> subset <strong>of</strong> OE selected channels is overplotted on a simulated radiance<br />
spectra in Figure 4.5. Note that the ad hoc channel selection described in Section 4.1.4 was applied<br />
before the OE channel selection, which results in no selections <strong>of</strong> the weak water vapor lines in<br />
the range 800–1200 cm −1 . It is also important to note that the ad hoc selection did not remove<br />
channels with wavenumbers higher than 1650 cm −1 ; channels at these higher wavenumbers are<br />
ignored by the OE selection because <strong>of</strong> higher sensor noise for these channels.<br />
4.2.3 Constrained OE Channel Selections<br />
An additional variation <strong>of</strong> OE channel selection is used to investigate and visualize relative<br />
information content <strong>of</strong> each spectral region. <strong>The</strong> channel selection is first run on one spectral<br />
region using the standard approach described in Section 3.1.3 to select a subset <strong>of</strong> 250 channels.<br />
<strong>The</strong> total set <strong>of</strong> channels is then merged into one combined set, and the selection continues, with<br />
the constraint that the initial 250 are already allocated from the initial selection run with only those<br />
channels from one spectral band. This process is similar to the sequential selection in Rabier et al.<br />
(2002).<br />
For example, consider an initial selection with 250 channels from the FIR spectrometer. <strong>The</strong><br />
channel list is now expanded to include the 2904 MIR channels as well as the (1006–250) unselected<br />
FIR channels. <strong>The</strong> channel selection loop is now restarted using this merged set <strong>of</strong> unselected<br />
channels, with the posterior covariance including the initial selection <strong>of</strong> 250 FIR-only<br />
channels. Channel selections 251 and beyond could be drawn from FIR or MIR channels, depending<br />
on their information content as computed by the OE algorithm.<br />
<strong>The</strong> constrained selection is applied in two ways. First, 250 channels are selected from the FIRonly<br />
channel list, followed by 250 channels from the merged (unselected FIR and MIR) channel<br />
list. This yields a total <strong>of</strong> 500 selected channels. <strong>The</strong> second way applies the constraint in the
53<br />
1<br />
Relative DFS for optimal channel selection<br />
Fraction <strong>of</strong> total DFS<br />
0.9<br />
0.8<br />
0.7<br />
0.6<br />
0.5<br />
0.4<br />
0.3<br />
FIR base<br />
FIR NEdR × 3<br />
0.2<br />
FIR ∆ν / 4<br />
MIR base<br />
0.1<br />
MIR NEdR × 3<br />
MIR ∆ν / 4<br />
0<br />
10 0 10 1 10 2 10 3<br />
Channels selected<br />
Figure 4.4 Cumulative DFS fraction as a function <strong>of</strong> number <strong>of</strong> channels selected by the OE<br />
algorithm. <strong>The</strong> selections were stopped at a total <strong>of</strong> 250 channels for the baseline and high noise<br />
sensor specifications, and 500 channels for the high spectral resolution specification. Figure from<br />
Merrelli and Turner (2011).
54<br />
Brightness Temperature [K]<br />
Brightness Temperature [K]<br />
300<br />
280<br />
260<br />
240<br />
220<br />
200<br />
200 400 600<br />
300<br />
280<br />
260<br />
240<br />
220<br />
200<br />
200 400 600<br />
Channel Selection in Darwin DJF composite<br />
800 1000 1200 1400 1600 1800 2000<br />
Channel Selection in NSA DJF composite<br />
800 1000 1200 1400 1600 1800 2000<br />
Wavenumber [cm −1 ]<br />
Figure 4.5 Simulated radiance spectra for the Darwin DJF and NSA DJF prior pr<strong>of</strong>iles, with the<br />
250 selected channels marked with circles. Figure from Merrelli and Turner (2011).
55<br />
reverse order. Specifically, the first 250 channels are selected from the MIR-only channel list,<br />
and the next 250 are selected from the merged (unselected MIR and FIR) channel list. <strong>The</strong>se two<br />
constrained selections are both applied to two sensor configurations. <strong>The</strong> first uses the base FIR<br />
and MIR sensors (both using the low noise NEDR curves), and the second uses the ×3 NEDR<br />
(high noise) FIR combined with the base (low noise) MIR. Figures 4.6 and 4.7 show the results<br />
<strong>of</strong> these constrained selections, presented as a scatter plot <strong>of</strong> selection rank versus wavenumber.<br />
<strong>The</strong> selection rank as the y axis shows the order <strong>of</strong> channel selection. In each figure, the top plot<br />
represents the first constrained selection (FIR-only for the first 250 channel selections), so all points<br />
for ranks < 250 on the y-axis are drawn from the FIR wavenumbers. <strong>The</strong> reverse is seen in the<br />
bottom plot, where all selections in the first 250 selections are drawn from the MIR wavenumbers.<br />
Noting the wavenumbers <strong>of</strong> the selections for channels 251–500 reveals where the OE algorithm<br />
finds independent information in the spectrum.<br />
First, consider the constrained selection using the base MIR and FIR sensors (Figure 4.6). In<br />
the top plot, where the FIR channels are selected first, all <strong>of</strong> the next 100 channels are selected from<br />
the MIR. However, the MIR channels sensitive to water vapor (> 1200 cm −1 ) are almost entire<br />
ignored in the final ∼100 selections, making up only 5 channel selections. <strong>The</strong> FIR water vapor<br />
absorption band is well sampled in the last 100 selections. <strong>The</strong> MIR does show a large amount<br />
<strong>of</strong> added information in temperature, from the high wavenumber side <strong>of</strong> the CO 2 absorption band.<br />
<strong>The</strong> FIR half <strong>of</strong> the CO 2 band has interference from the water vapor absorption band, so it is likely<br />
that adding MIR channels in this region improves the ability <strong>of</strong> the OE algorithm to separate water<br />
vapor and temperature changes in the lower troposphere levels. <strong>The</strong> constrained selection in the<br />
reverse order (MIR-only for the first 250 selections) is shown in the bottom plot, and reveals the<br />
same principles. After the MIR-only selection, almost all the channel selections are drawn from<br />
the FIR.<br />
Repeating the experiment with the high noise FIR and low noise MIR sensors shows a similar<br />
pattern, but with less emphasis on the FIR channels due to the higher noise (Figure 4.7). After<br />
the MIR-only selection, the majority <strong>of</strong> selections in the merged channel list are taken from the<br />
FIR water vapor absorption lines. Compared to the previous results with both low noise sensors,
56<br />
Ch. Selection Rank<br />
500<br />
400<br />
300<br />
200<br />
100<br />
0<br />
200 400 600<br />
800 1000 1200 1400 1600 1800 2000<br />
Ch. Selection Rank<br />
500<br />
400<br />
300<br />
200<br />
100<br />
0<br />
200 400 600<br />
800 1000 1200 1400 1600 1800 2000<br />
Wavenumber [cm −1 ]<br />
Figure 4.6 Constrained selection using the base (low noise) FIR and MIR sensors. 250 channels<br />
selected from FIR only, followed by 250 channels selected from merged FIR and MIR channel<br />
list (top); 250 channels from MIR only, followed by 250 channels selected from merged FIR and<br />
MIR channel list (bottom). Figure from Merrelli and Turner (2011).
57<br />
relatively more MIR channels are selected. For example, 12 channels are selected from the MIR<br />
water vapor absorption, up from 3 selected when both low noise sensors are used. Preferentially<br />
less channels on the FIR side <strong>of</strong> the CO 2 absorption band are selected, as the noise level is now<br />
much higher for these channels compared to the MIR CO 2 channels.<br />
4.2.4 <strong>Information</strong> <strong>Content</strong><br />
Continuing with the same climatological priors, the DFS statistic is calculated at the prior<br />
mean pr<strong>of</strong>ile for all three sensor variants: baseline, high spectral resolution (∆ν / 4), and high<br />
noise (×3 NEDR). <strong>The</strong> DFS is split into information in the temperature pr<strong>of</strong>ile and information in<br />
the water vapor pr<strong>of</strong>ile by computing the trace along only the section <strong>of</strong> theAmatrix that contains<br />
the corresponding pr<strong>of</strong>ile. Recalling from section 4.1.3 that the stratospheric levels in the prior are<br />
synthetic, the DFS are computed only from the tropospheric levels. Figure 4.8 shows the results<br />
for all conditions.<br />
Comparing FIR and MIR temperature DFS results, the FIR shows a small information content<br />
advantage (0.2–1 DFS increase) in nearly all situations. For the Darwin DJF prior, there is a slight<br />
(0.2 DFS) advantage for the MIR. In this case the high water vapor column amount causes the<br />
atmosphere to become fully opaque at the lowest levels in the FIR, which cases this slight drop<br />
relative to the MIR DFS. <strong>The</strong> water vapor DFS is sharply higher in the FIR in the Darwin DJF<br />
prior, in contrast to the temperature DFS.<br />
Comparing the FIR and MIR for the water vapor DFS results, the FIR shows a slightly larger<br />
advantage (0.5–2.0 DFS) in all situations. Interestingly, the DFS advantage for the FIR is highest<br />
in the high water vapor pr<strong>of</strong>ile, Darwin DJF. Although the high water vapor amount means the FIR<br />
loses all sensitivity to the lowest levels which should cause a DFS drop, within the tropical prior<br />
the lower troposphere levels are fairly constrained by the prior. Tropical atmospheres tend to be<br />
nearly saturated at the lowest levels. Saturation implies a narrower range <strong>of</strong> water vapor mixing<br />
ratio, and less potential for the measurement to help constrain the state estimate. <strong>The</strong>refore, even<br />
though the lowest level water vapor cannot be constrained by the FIR measurement, it is already<br />
constrained by the prior so there is no significant DFS drop in this situation. In contrast, the upper
58<br />
Ch. Selection Rank<br />
500<br />
400<br />
300<br />
200<br />
100<br />
0<br />
200 400 600<br />
800 1000 1200 1400 1600 1800 2000<br />
Ch. Selection Rank<br />
500<br />
400<br />
300<br />
200<br />
100<br />
0<br />
200 400 600<br />
800 1000 1200 1400 1600 1800 2000<br />
Wavenumber [cm −1 ]<br />
Figure 4.7 Same as Figure 4.6, but using high noise FIR and low noise MIR spectrometers.<br />
Figure from Merrelli and Turner (2011).
59<br />
troposphere levels in the tropical pr<strong>of</strong>ile have the largest information content advantage for the FIR<br />
due to the cold emission temperatures (section 2.3.2).<br />
Pr<strong>of</strong>iles <strong>of</strong> the DFS per level are shown in Figure 4.9. <strong>The</strong>se pr<strong>of</strong>iles display the DFS per km,<br />
which is simply the DFS pr<strong>of</strong>ile (the diagonal <strong>of</strong> theAmatrix) divided by the layer thickness at that<br />
altitude. <strong>The</strong> pr<strong>of</strong>iles at all four climatologies are shown, computed for the FIR-only, MIR-only,<br />
and combined (FIR + MIR) spectral measurements. In the three cases shown in Figure 4.9 the DFS<br />
pr<strong>of</strong>iles are computed with different a priori state covariance matrices to emphasize the affect <strong>of</strong> the<br />
prior on the resulting DFS. <strong>The</strong> top image shows the results using the prior covariance computed<br />
from the radiosonde climatology. <strong>The</strong> tropopause is easily visible as the altitude where the water<br />
vapor DFS sharply drops, since there is little information where the water vapor concentration is<br />
extremely small (roughly 16, 13, 11, 9 km, from left to right). <strong>The</strong>re is a similar feature at these<br />
altitudes in the temperature DFS, but this is related to a reduction in the prior variance above the<br />
tropopause. <strong>The</strong> stratospheric data was simulated using 1 K RMS variation, which is significantly<br />
smaller than the RMS temperature variation for all radiosonde climatologies except for the tropical<br />
(Darwin) case. <strong>The</strong> tropical temperature RMS is very low (1–2 K at all levels). <strong>The</strong> DFS pr<strong>of</strong>iles<br />
also show some small spatial scale fluctuation due to the propagation <strong>of</strong> sampling noise from the<br />
covariance calculation. This prior includes any temperature–water vapor correlation found in the<br />
radiosonde data as well. By computing a synthetic covariance using the exponentially decaying<br />
correlation (equation 3.19), much <strong>of</strong> the sampling noise can be removed. This tuned synthetic a<br />
priori covariance has the same variance (diagonal) as the computed covariance with the <strong>of</strong>f diagonal<br />
elements recomputed from the exponential equation. All cross-correlations between temperature<br />
and water vapor are set to zero. <strong>The</strong> resulting DFS pr<strong>of</strong>iles are shown in the middle plot in Figure<br />
4.9. <strong>The</strong> tropical temperature DFS stands out as being much lower than the other pr<strong>of</strong>iles. This is<br />
due to the small RMS (1–2 K) mentioned earlier. Since the prior has such a small volume in state<br />
space, there is not much added information for temperature. <strong>The</strong> water vapor pr<strong>of</strong>ile, however,<br />
has a high amount <strong>of</strong> information since there is a large amount <strong>of</strong> variance in the prior above<br />
the boundary layer. Finally, to focus on the difference between the prior mean pr<strong>of</strong>iles, a single<br />
synthetic covariance was applied to all pr<strong>of</strong>iles. <strong>The</strong> synthetic covariance matches Figure 3.2.
60<br />
Baseline<br />
Baseline<br />
8<br />
12<br />
Temperature DFS<br />
6<br />
4<br />
Water Vapor DFS<br />
10<br />
8<br />
6<br />
4<br />
2<br />
Darwin<br />
DJF<br />
SGP<br />
JJA<br />
SGP<br />
DJF<br />
NSA<br />
DJF<br />
2<br />
Darwin<br />
DJF<br />
SGP<br />
JJA<br />
SGP<br />
DJF<br />
NSA<br />
DJF<br />
8<br />
∆ν/4<br />
12<br />
∆ν/4<br />
Temperature DFS<br />
6<br />
4<br />
Water Vapor DFS<br />
10<br />
8<br />
6<br />
4<br />
2<br />
Darwin<br />
DJF<br />
SGP<br />
JJA<br />
SGP<br />
DJF<br />
NSA<br />
DJF<br />
2<br />
Darwin<br />
DJF<br />
SGP<br />
JJA<br />
SGP<br />
DJF<br />
NSA<br />
DJF<br />
8<br />
NEdR×3<br />
12<br />
NEdR×3<br />
Temperature DFS<br />
6<br />
4<br />
Water Vapor DFS<br />
10<br />
8<br />
6<br />
4<br />
2<br />
Darwin<br />
DJF<br />
SGP<br />
JJA<br />
SGP<br />
DJF<br />
NSA<br />
DJF<br />
2<br />
Darwin<br />
DJF<br />
SGP<br />
JJA<br />
SGP<br />
DJF<br />
NSA<br />
DJF<br />
Figure 4.8 DFS results for the temperature pr<strong>of</strong>ile (left column) and water vapor pr<strong>of</strong>ile (right<br />
column). All three simulated spectrometer types are represented: baseline (top row), high spectral<br />
resolution∆ν/4 (middle row), and high noise (NEDR×3) (bottom row). <strong>The</strong> plot markers match<br />
those used earlier in Figure 4.3, namely: light gray and X for FIR results; dark gray and square<br />
for MIR results. <strong>The</strong> solid line and dashed lines now represent different aspects. <strong>The</strong> solid line<br />
represents results using the ad hoc channel selection (MIR window, and trace gas sensitive<br />
channels are removed), and the dashed line represents the OE channel selection using 250<br />
channels (500 channels for high spectral resolution). Figure from Merrelli and Turner (2011).
61<br />
<strong>The</strong> differences are now dependent only on the atmosphere pr<strong>of</strong>ile, which affects the calculation<br />
through the K matrix computed at the prior mean pr<strong>of</strong>ile. <strong>The</strong> DFS pr<strong>of</strong>iles are shown in the<br />
bottom part <strong>of</strong> Figure 4.9. Since there is no sampling noise, the pr<strong>of</strong>iles are much smoother. <strong>The</strong><br />
tropical temperature DFS pr<strong>of</strong>ile no longer stands out since all pr<strong>of</strong>iles have the same total variance<br />
in the prior.<br />
A number <strong>of</strong> important qualitative features can be seen by comparing the results using different<br />
spectra. <strong>The</strong> lack <strong>of</strong> sensitivity at the lowest levels in the FIR can be seen in the high water vapor<br />
pr<strong>of</strong>iles (Darwin DJF and SGP JJA). However, there are enough microwindows between water<br />
vapor absorption lines that even in the tropical pr<strong>of</strong>ile there is information down to ≈ 2 km. <strong>The</strong><br />
FIR generally shows increased water vapor DFS at all altitudes. <strong>The</strong> temperature DFS is generally<br />
equivalent between the FIR and MIR. <strong>The</strong> combined measurement shows the strengths <strong>of</strong> both FIR<br />
and MIR spectra.<br />
<strong>The</strong> effect <strong>of</strong> sensor noise and spectral resolution on the DFS pr<strong>of</strong>ile can be examined by<br />
plotting the difference between pr<strong>of</strong>iles using different instrument specifications. For these comparisons,<br />
the single synthetic covariance is used, in order to eliminate the sampling noise and focus<br />
on the differences in the atmospheric pr<strong>of</strong>ile rather than the shape <strong>of</strong> the prior covariance. Figures<br />
4.10 and 4.11 show the difference between the baseline and high noise (NEDR ×3) and the high<br />
spectral resolution (∆ν/4) and the baseline. Qualitatively, each plot shows similar overall features.<br />
<strong>The</strong>re is increased DFS primarily in the tropospheric levels with a small amount extending<br />
into stratospheric levels. <strong>The</strong> sensor noise reduction (from high noise to low noise) appears to have<br />
a smaller effect in the stratosphere water vapor DFS relative to the spectral resolution increase.<br />
This difference is mainly due to the fact that DFS for stratospheric water vapor is close to zero for<br />
the baseline and NEDR×3 sensor specifications. <strong>The</strong> increased DFS for stratospheric water vapor<br />
in the high spectral resolution case is an interesting result. <strong>The</strong> implication is that a stratospheric<br />
water vapor pr<strong>of</strong>ile may be retrievable with a spectral resolution increase to 0.125 cm −1 .
62<br />
30<br />
FIR<br />
Temp. W. V.<br />
MIR<br />
Temp. W. V.<br />
Combined<br />
Temp. W. V.<br />
1.0<br />
0.9<br />
25<br />
0.8<br />
0.7<br />
Altitude [km]<br />
20<br />
15<br />
0.6<br />
0.5<br />
0.4<br />
DFS [1/km]<br />
10<br />
0.3<br />
5<br />
0.2<br />
0.1<br />
0<br />
Dar DJF<br />
SGP JJA<br />
SGP DJF<br />
NSA DJF<br />
Dar DJF<br />
SGP JJA<br />
SGP DJF<br />
NSA DJF<br />
Dar DJF<br />
SGP JJA<br />
SGP DJF<br />
NSA DJF<br />
Dar DJF<br />
SGP JJA<br />
SGP DJF<br />
NSA DJF<br />
Dar DJF<br />
SGP JJA<br />
SGP DJF<br />
NSA DJF<br />
Dar DJF<br />
SGP JJA<br />
SGP DJF<br />
NSA DJF<br />
0.0<br />
Figure 4.9 DFS pr<strong>of</strong>iles for temperature and water vapor, using a priori covariance computed<br />
from radiosonde climatologies (top), a priori variance computed from radiosonde climatologies,<br />
but with correlation set by equation 3.19 (middle), and a single synthetic covariance (Figure 3.2)<br />
applied to all climatologies (bottom). Each plot shows results from FIR spectra (left), MIR<br />
spectra (middle) and FIR + MIR spectra (right), with each image showing temperature DFS<br />
pr<strong>of</strong>iles on the left, and water vapor pr<strong>of</strong>iles on the right.
63<br />
30<br />
FIR<br />
Temp. W. V.<br />
MIR<br />
Temp. W. V.<br />
Combined<br />
Temp. W. V.<br />
0.20<br />
0.16<br />
25<br />
0.12<br />
0.08<br />
Altitude [km]<br />
20<br />
15<br />
10<br />
0.04<br />
0.00<br />
−0.04<br />
−0.08<br />
\Delta DFS [1/km]<br />
5<br />
−0.12<br />
−0.16<br />
0<br />
Dar DJF<br />
SGP JJA<br />
SGP DJF<br />
NSA DJF<br />
Dar DJF<br />
SGP JJA<br />
SGP DJF<br />
NSA DJF<br />
Dar DJF<br />
SGP JJA<br />
SGP DJF<br />
NSA DJF<br />
Dar DJF<br />
SGP JJA<br />
SGP DJF<br />
NSA DJF<br />
Dar DJF<br />
SGP JJA<br />
SGP DJF<br />
NSA DJF<br />
Dar DJF<br />
SGP JJA<br />
SGP DJF<br />
NSA DJF<br />
−0.20<br />
Figure 4.10 “∆ DFS” pr<strong>of</strong>iles: DFS pr<strong>of</strong>iles from the high noise (NEDR×3) instrument<br />
subtracted from the DFS pr<strong>of</strong>iles from the baseline instrument. Plot layout identical to Figure 4.9<br />
30<br />
FIR<br />
Temp. W. V.<br />
MIR<br />
Temp. W. V.<br />
Combined<br />
Temp. W. V.<br />
0.20<br />
0.16<br />
25<br />
0.12<br />
0.08<br />
Altitude [km]<br />
20<br />
15<br />
0.04<br />
0.00<br />
−0.04<br />
∆ DFS [1/km]<br />
10<br />
−0.08<br />
5<br />
−0.12<br />
−0.16<br />
0<br />
Dar DJF<br />
SGP JJA<br />
SGP DJF<br />
NSA DJF<br />
Dar DJF<br />
SGP JJA<br />
SGP DJF<br />
NSA DJF<br />
Dar DJF<br />
SGP JJA<br />
SGP DJF<br />
NSA DJF<br />
Dar DJF<br />
SGP JJA<br />
SGP DJF<br />
NSA DJF<br />
Dar DJF<br />
SGP JJA<br />
SGP DJF<br />
NSA DJF<br />
Dar DJF<br />
SGP JJA<br />
SGP DJF<br />
NSA DJF<br />
−0.20<br />
Figure 4.11 “∆ DFS” pr<strong>of</strong>iles from the baseline instrument subtracted from the DFS pr<strong>of</strong>iles<br />
from the high spectral resolution (∆ν/4) instrument. Plot layout identical to Figure 4.9
64<br />
4.2.5 Vertical Resolution<br />
<strong>The</strong> averaging kernel FWHM calculation presented earlier (Figure 3.1) can be used to compute<br />
the vertical pr<strong>of</strong>ile <strong>of</strong> the averaging kernel width, by computing the FWHM for each row in A.<br />
Figure 4.12 shows these pr<strong>of</strong>iles for the baseline instrument, using the same set <strong>of</strong> a priori covariances<br />
as used in Figure 4.9. Several patterns emerge, that are similar to patterns seen in the DFS<br />
pr<strong>of</strong>iles. Regions <strong>of</strong> low DFS (stratospheric water vapor in particular) show very poor vertical resolution<br />
(<strong>of</strong>f scale, meaning > 10 km), which reflects the fact that little can be added to the pr<strong>of</strong>ile<br />
beyond the a priori in this region. Removing the measured T–Q cross correlations and replacing<br />
the T–T and Q–Q correlation with the exponential equation (middle plot) shows improved vertical<br />
resolution for all but the tropical temperature pr<strong>of</strong>ile. In general, removing the temperature–water<br />
vapor correlations should increase resolution, since the retrieval can independently fit each pr<strong>of</strong>ile.<br />
For the tropical pr<strong>of</strong>ile, it appears that the correlation between temperature and water vapor was<br />
adding information and resolution to the temperature pr<strong>of</strong>ile through the cross-correlation to water<br />
vapor. <strong>The</strong> significant impact after removing this cross-correlation is due to the fact that the tropical<br />
pr<strong>of</strong>ile has a relatively small temperature and large water vapor variance. Applying the same<br />
covariance to all four climatologies (bottom plot) improves the resolution in the tropical pr<strong>of</strong>ile to<br />
match the pattern suggested by the other three pr<strong>of</strong>iles.<br />
In Figure 4.13, the summary resolution statistics are plotted in a layout that matches the DFS<br />
summary shown in Figure 4.8. Each single point in this case is the average <strong>of</strong> the AK resolution<br />
pr<strong>of</strong>ile within the troposphere for that prior climatology and sensor specification. <strong>The</strong> measured a<br />
priori covariances are used in these calculations. <strong>The</strong> relatively poor resolution for the Darwin temperature<br />
is related to the previously discussed combination <strong>of</strong> low total variance and a high degree<br />
<strong>of</strong> correlation between levels in the radiosonde climatology. <strong>The</strong> FIR shows a small advantage in<br />
vertical resolution in all virtually all cases. <strong>The</strong> OE channel selection algorithm again shows good<br />
performance, with only a very small (< 10%) degradation in vertical resolution in all cases.
30<br />
25<br />
FIR<br />
Temp. W. V.<br />
MIR<br />
Temp. W. V.<br />
Combined<br />
Temp. W. V.<br />
10<br />
9<br />
8<br />
65<br />
Altitude [km]<br />
20<br />
15<br />
10<br />
5<br />
7<br />
6<br />
5<br />
4<br />
3<br />
2<br />
1<br />
A.K. FWHM [km]<br />
0<br />
Dar DJF<br />
SGP JJA<br />
SGP DJF<br />
NSA DJF<br />
Dar DJF<br />
SGP JJA<br />
SGP DJF<br />
NSA DJF<br />
Dar DJF<br />
SGP JJA<br />
SGP DJF<br />
NSA DJF<br />
Dar DJF<br />
SGP JJA<br />
SGP DJF<br />
NSA DJF<br />
Dar DJF<br />
SGP JJA<br />
SGP DJF<br />
NSA DJF<br />
Dar DJF<br />
SGP JJA<br />
SGP DJF<br />
NSA DJF<br />
0<br />
30<br />
FIR<br />
Temp. W. V.<br />
MIR<br />
Temp. W. V.<br />
Combined<br />
Temp. W. V.<br />
10<br />
9<br />
25<br />
8<br />
7<br />
Altitude [km]<br />
20<br />
15<br />
6<br />
5<br />
4<br />
A.K. FWHM [km]<br />
10<br />
3<br />
5<br />
2<br />
1<br />
0<br />
Dar DJF<br />
SGP JJA<br />
SGP DJF<br />
NSA DJF<br />
Dar DJF<br />
SGP JJA<br />
SGP DJF<br />
NSA DJF<br />
Dar DJF<br />
SGP JJA<br />
SGP DJF<br />
NSA DJF<br />
Dar DJF<br />
SGP JJA<br />
SGP DJF<br />
NSA DJF<br />
Dar DJF<br />
SGP JJA<br />
SGP DJF<br />
NSA DJF<br />
Dar DJF<br />
SGP JJA<br />
SGP DJF<br />
NSA DJF<br />
0<br />
Figure 4.12 Vertical pr<strong>of</strong>iles <strong>of</strong> averaging kernel FWHM. Layout and annotations match Figure<br />
4.9 except the colorbar range is now FWHM in km.
66<br />
Temperature Vert. Res. [km]<br />
6<br />
4<br />
2<br />
Darwin<br />
DJF<br />
Baseline<br />
SGP<br />
JJA<br />
SGP<br />
DJF<br />
NSA<br />
DJF<br />
Water Vapor Vert. Res. [km]<br />
6<br />
4<br />
2<br />
Darwin<br />
DJF<br />
Baseline<br />
SGP<br />
JJA<br />
SGP<br />
DJF<br />
NSA<br />
DJF<br />
Temperature Vert. Res. [km]<br />
6<br />
4<br />
2<br />
Darwin<br />
DJF<br />
SGP<br />
JJA<br />
∆ν/4<br />
SGP<br />
DJF<br />
NSA<br />
DJF<br />
Water Vapor Vert. Res. [km]<br />
6<br />
4<br />
2<br />
Darwin<br />
DJF<br />
SGP<br />
JJA<br />
∆ν/4<br />
SGP<br />
DJF<br />
NSA<br />
DJF<br />
Temperature Vert. Res. [km]<br />
6<br />
4<br />
2<br />
Darwin<br />
DJF<br />
NEdR×3<br />
SGP<br />
JJA<br />
SGP<br />
DJF<br />
NSA<br />
DJF<br />
Water Vapor Vert. Res. [km]<br />
6<br />
4<br />
2<br />
Darwin<br />
DJF<br />
NEdR×3<br />
SGP<br />
JJA<br />
SGP<br />
DJF<br />
NSA<br />
DJF<br />
Figure 4.13 Summary <strong>of</strong> average troposphere vertical resolution. Label markers match those in<br />
Figure 4.8. Figure from Merrelli and Turner (2011).
67<br />
4.3 Summary<br />
A series <strong>of</strong> modeling and retrieval experiments enabled a detailed comparison <strong>of</strong> the information<br />
content for clear sky thermodynamic pr<strong>of</strong>ile retrievals. <strong>The</strong> comparison reveals that the FIR<br />
<strong>of</strong>fers some key advantages over the MIR for these retrievals. First, fewer trace gas absorption<br />
lines in the FIR water vapor absorption band result in a retrieval that is more robust for model errors<br />
in trace gas characteristics. For high water vapor absorption amounts, the atmosphere becomes<br />
opaque near the surface, making the FIR pr<strong>of</strong>ile retrieval immune to any surface mischaracterization.<br />
While the opaque levels near the surface do imply a loss <strong>of</strong> information since these levels<br />
will be undetectable, there are still microwindows with partial transmission down to about 2 km<br />
in the highest water vapor atmosphere (Darwin). Even with an opaque total atmosphere column,<br />
the partial transmission allows a thermodynamic pr<strong>of</strong>ile to be retrieved from a large fraction <strong>of</strong> the<br />
troposphere.<br />
From an information content perspective, the FIR consistently shows an advantage in the water<br />
vapor pr<strong>of</strong>ile and an equivalent temperature pr<strong>of</strong>ile in clear skies when compared to the MIR. For<br />
high water vapor, the lowest levels would need to be retrieved by an MIR measurement. <strong>The</strong><br />
increased information using the higher spectral resolution measurement also suggests a potential<br />
to retrieve water vapor in the stratosphere using the FIR, although this aspect should be further<br />
investigated using more realistic measurements <strong>of</strong> the stratospheric water vapor pr<strong>of</strong>ile mean and<br />
variance (i.e., with more accurately defined a priori information). Using the averaging kernel<br />
FWHM to estimate vertical resolution, the FIR shows a small but consistent resolution advantage.<br />
It is important to note that the comparisons above used particular spectral shapes for the sensor<br />
NEDR for each measurement (Figure 3.4), which have roughly equivalent minimum noise in<br />
radiance units. <strong>The</strong> more realistic combination for the CLARREO instrument is thought to be<br />
the higher noise FIR with the baseline (low noise) MIR (Merrelli and Turner, 2011). Repeating<br />
a similar “∆ DFS” calculation as used above in Figure 4.10 shows the impact <strong>of</strong> this different<br />
noise level. Starting on the left half <strong>of</strong> Figure 4.14, a comparison is shown between the DFS <strong>of</strong> an<br />
FIR-only and combined FIR-MIR measurement versus an MIR-only measurement. <strong>The</strong> leftmost
68<br />
image, (a), shows the DFS <strong>of</strong> the FIR-only measurement minus the DFS <strong>of</strong> the MIR-only measurement,<br />
so the change in DFS can be considered the difference in information between the FIR and<br />
MIR measurements. <strong>The</strong> middle left image, (b), is now the DFS in the combined (FIR and MIR)<br />
measurement, minus the MIR only measurement. This can be viewed as the added information<br />
that would be obtained by extending an MIR spectrum into the FIR region. For these two images,<br />
the baseline specification (low noise) is used for both the FIR and MIR. <strong>The</strong> middle right and far<br />
right images, (c) and (d), show the same quantities, but now using the high noise FIR measurement.<br />
Considering images (a) and (b), there is added information in water vapor throughout the<br />
entire pr<strong>of</strong>ile and within the troposphere for temperature. <strong>The</strong> combined measurement also shows<br />
significant additional information in the boundary layer where the FIR is blind. This increase is<br />
likely due to the improved characterization <strong>of</strong> levels just above the boundary layer, which can improve<br />
the MIR result by allowing it to rely less on correlations to estimate the boundary layer state.<br />
<strong>The</strong> result with the high noise FIR measurement shows that there is little advantage over the MIR;<br />
the FIR-only measurement is slightly worse in all cases for the temperature pr<strong>of</strong>ile, and worse for<br />
the water vapor pr<strong>of</strong>ile in the boundary layer. Above the boundary layer, the water vapor pr<strong>of</strong>ile<br />
is roughly equivalent. In the combined measurement, the added information is marginal. Thus,<br />
answering the question <strong>of</strong> which spectral region produces the best sounding is difficult to answer<br />
without detailed knowledge <strong>of</strong> the actual sensor noise performance.
69<br />
Altitude [km]<br />
30<br />
25<br />
20<br />
15<br />
10<br />
5<br />
FIR-MIR<br />
Temp. W. V.<br />
(a)<br />
Comb.-MIR<br />
Temp. W. V.<br />
(b)<br />
FIR-MIR<br />
Temp. W. V.<br />
(c)<br />
Comb.-MIR<br />
Temp. W. V.<br />
(d)<br />
0.20<br />
0.16<br />
0.12<br />
0.08<br />
0.04<br />
0.00<br />
−0.04<br />
−0.08<br />
−0.12<br />
−0.16<br />
∆ DFS [1/km]<br />
0<br />
Dar DJF<br />
SGP JJA<br />
SGP DJF<br />
NSA DJF<br />
Dar DJF<br />
SGP JJA<br />
SGP DJF<br />
NSA DJF<br />
Dar DJF<br />
SGP JJA<br />
SGP DJF<br />
NSA DJF<br />
Dar DJF<br />
SGP JJA<br />
SGP DJF<br />
NSA DJF<br />
Dar DJF<br />
SGP JJA<br />
SGP DJF<br />
NSA DJF<br />
Dar DJF<br />
SGP JJA<br />
SGP DJF<br />
NSA DJF<br />
Dar DJF<br />
SGP JJA<br />
SGP DJF<br />
NSA DJF<br />
Dar DJF<br />
SGP JJA<br />
SGP DJF<br />
NSA DJF<br />
−0.20<br />
Figure 4.14 “∆ DFS” pr<strong>of</strong>iles, relating various DFS pr<strong>of</strong>iles back to the baseline MIR DFS<br />
pr<strong>of</strong>iles; from left to right: (a) baseline FIR DFS pr<strong>of</strong>iles minus baseline MIR DFS pr<strong>of</strong>iles; (b)<br />
baseline combined (FIR and MIR) DFS pr<strong>of</strong>iles minus baseline MIR DFS pr<strong>of</strong>iles; (c) baseline<br />
FIR DFS pr<strong>of</strong>iles minus baseline MIR DFS pr<strong>of</strong>iles; (d) baseline combined (FIR and MIR) DFS<br />
pr<strong>of</strong>iles minus baseline MIR DFS pr<strong>of</strong>iles. Plot layout for individual images matches Figure 4.9
70<br />
Chapter 5<br />
<strong>Information</strong> <strong>Content</strong> in Cloudy Sky Pr<strong>of</strong>iles<br />
<strong>The</strong> framework discussed in the previous chapter is extended to include single layer ice clouds.<br />
<strong>The</strong> spectral refractive index <strong>of</strong> ice and the scattering size parameter change significantly from the<br />
MIR to FIR, resulting in key differences in the upwelling spectral radiance in cloudy atmospheres.<br />
<strong>The</strong> previously discussed Optimal Estimation (OE) metrics are used throughout as the primary<br />
method to quantify the changes in information content for thermodynamic pr<strong>of</strong>ile and cloud property<br />
retrieval.<br />
5.1 Methods<br />
5.1.1 Modeling Framework<br />
<strong>The</strong> previously defined sensor specifications are used to define the spectral range, resolution,<br />
and noise level. No comparison between the different specifications is made in this section, so<br />
only the final configuration is used for these simulations. Specifically, the FIR sensor uses the<br />
“high noise” NEDR and the MIR sensor uses the “low noise” baseline NEDR.<br />
As discussed previously in Section 3.2.2, LBLDIS is used to simulate radiances in cloudy<br />
conditions. Although LBLDIS can be used to approximate vertically inhomogeneous clouds, by<br />
splitting a single cloud into layers with different particle distributions, this option is not used. All<br />
simulated clouds in this study will be single homogeneous layers.<br />
<strong>The</strong> LBLDIS input parameter file allows for a cloud layer to be defined with 3 key properties:<br />
the particle effective radius, cloud optical depth, and a single altitude value to define the cloud
71<br />
height. <strong>The</strong> particle effective radius is used to compute the single scattering properties for the cloud<br />
particles, by linearly interpolating between effective radius values in a pre-computed database.<br />
<strong>The</strong> cloud particles are assumed to be evenly distributed throughout the layer containing the<br />
input altitude value. <strong>The</strong> layers used by LBLDIS are those defined in the initial LBLRTM run that<br />
computes the layer gaseous optical depths. To allow for precise control over the cloud altitude, the<br />
cloud definition is extended to include an option <strong>of</strong> defining the cloud top and bottom. <strong>The</strong> level<br />
grid is modified by inserting two levels equal to the desired cloud top and bottom, and then the<br />
single-value LBLDIS cloud altitude will be equal to the mean <strong>of</strong> the cloud boundary altitudes. If<br />
the cloud boundaries contain one or more levels in the pre-defined LBLRTM level grid, then the<br />
optical depth is divided among the two or more layers that are now contained within the cloud.<br />
<strong>The</strong> total cloud optical depth is linearly split among these layers according to the vertical altitude<br />
fraction.<br />
5.1.2 Single Scattering Optical Properties<br />
<strong>The</strong> ice particle scattering property database <strong>of</strong> Yang et al. (2005) is used for all simulations.<br />
This database contains the scattering phase function at 498 angles, the particle projected area,<br />
total volume, single scatter albedo, asymmetry parameter, and extinction efficiency. <strong>The</strong> asymmetry<br />
parameter is not directly used, since LBLDIS uses the computed phase function instead <strong>of</strong> a<br />
Henyey-Greenstein function approximation. <strong>The</strong>se databases exist for several different ice crystal<br />
habits: solid column aggregates, bullet rosettes, hollow and solid single columns, plates, droxtals,<br />
and spheroids. Figure 5.1 shows the volume <strong>of</strong> each particle habit as a function <strong>of</strong> particle dimension<br />
scaled by the volume <strong>of</strong> a sphere with equal diameter. Note that the volume <strong>of</strong> droxtals,<br />
spheroids, and aggregates all follow a r 3 scaling, with droxtals closest to the spherical volume.<br />
<strong>The</strong> bullet rosettes and plates increase in volume slower thanr 3 , and the columns initially scale as<br />
r 3 but start to change in aspect ratio forr > 100µm so the volume grows slower than r 3 .<br />
LBLDIS expects single scattering data for a bulk distribution <strong>of</strong> ice particles, meaning the<br />
single-size data must be integrated over an assumed Particle Size Distribution (PSD). In all cases<br />
the alternative gamma distribution form defined in Hansen and Travis (1974) is used as the particle
72<br />
10 1<br />
Volume Relative to Sphere<br />
10 0<br />
10 -1<br />
10 -2<br />
10 -3<br />
Aggregate<br />
Bullet_rosette<br />
Droxtal<br />
Hollow_column<br />
Plate<br />
Solid_column<br />
Spheroid<br />
10 0 10 1 10 2 10 3 10 4<br />
Particle diameter [µm]<br />
Figure 5.1 Volume as a function <strong>of</strong> particle dimension for various habits in the Yang et al. (2005)<br />
database, divided by the volume <strong>of</strong> a sphere with equal diameter.
73<br />
PSD:<br />
N(r) = Cr<br />
1−3v eff<br />
v eff<br />
e − r<br />
v eff r eff (5.1)<br />
where r eff and v eff are the effective radius and effective variance parameters, and C is a constant<br />
related to the total particle number density. <strong>The</strong> effective radius and variance are defined as:<br />
r eff =<br />
v eff =<br />
∫ r2<br />
rπr 2 N(r)dr<br />
r<br />
∫ 1<br />
r2<br />
πr 2 N(r)dr<br />
r 1<br />
∫ r2<br />
(r −r eff ) 2 r 2 N(r)dr<br />
r 1<br />
∫ r2<br />
reff 2 πr2 N(r)dr<br />
r 1<br />
(5.2)<br />
(5.3)<br />
For spherical particles, the effective radius parameterr eff in this equation does match the definition<br />
<strong>of</strong> effective radius commonly used for non-spherical particles (Baum et al., 2007), which is just<br />
ratio <strong>of</strong> the PSD-weighted volume integral to the PSD-weighted area integral times 3/4:<br />
r e = 3 4<br />
∫ r2<br />
r 1<br />
V(r)N(r)dr<br />
∫ r2<br />
r 1<br />
A(r)N(r)dr<br />
= 3 4<br />
∫ r2<br />
r 1<br />
4<br />
3 πr3 N(r)dr<br />
∫ r2<br />
r 1<br />
πr 2 N(r)dr<br />
=<br />
∫ r2<br />
r 1<br />
r 3 N(r)dr<br />
∫ r2<br />
r 1<br />
r 2 N(r)dr<br />
(5.4)<br />
For non-spherical particles, the r eff parameter in equation 5.5 will not be equal to the effective<br />
radius r e as defined in equation 5.4. <strong>The</strong>refore, PSD equation will be rewritten for clarity by<br />
renaming the r eff parameter as the “PSD size parameter”, r 0 , and the width parameter will use the<br />
symbol σ. In addition, the PSD can be expressed as a true PDF (meaning the integral over all r<br />
is equal to unity) multiplied by a constant specifying the total number density (Petty and Huang,<br />
2011):<br />
N(r) = N 0 n(r) =<br />
N 0<br />
(r 0 σ) 1−2σ<br />
σ Γ ( 1−2σ<br />
σ<br />
)r 1−3σ<br />
σ e<br />
− r<br />
σr 0 (5.5)<br />
This alternate form has the advantage <strong>of</strong> decoupling the two parametersr 0 andσ such that changing<br />
r 0 “translates” the PSD and σ “stretches” the PSD. Figure 5.2 shows sample PSD curves for a<br />
variety <strong>of</strong> coefficient values, plotted in both linear and logarithmic scales.
74<br />
Normalized number density<br />
0.06<br />
0.05<br />
0.04<br />
0.03<br />
0.02<br />
0.01<br />
Various r 0 for σ = 0.1<br />
r 0 = 12.5<br />
r 0 = 25.0<br />
r 0 = 50.0<br />
r 0 = 100.0<br />
0.06<br />
0.05<br />
0.04<br />
0.03<br />
0.02<br />
0.01<br />
Various σ for r 0 = 50.0<br />
σ = 0.025<br />
σ = 0.050<br />
σ = 0.100<br />
σ = 0.200<br />
0.00<br />
0.00<br />
0 50 100 150 200 0 50 100 150 200<br />
10 0 -2 10 -1 10 0 10 1 10 2<br />
10 0<br />
10 -1<br />
10 -1<br />
10 -2<br />
10 -2<br />
10 -3<br />
10 -3<br />
10 -4<br />
10 -4<br />
10 -5<br />
10 -5<br />
10 -6<br />
10 -2 10 -1 10 0 10 1 10 2 10 3 10 -6<br />
10 10 3<br />
Particle size [µm]<br />
Particle size [µm]<br />
Figure 5.2 Gamma function PSDs in the alternate form defined in Hansen and Travis (1974) for<br />
various values <strong>of</strong> the PSD size parameter and PSD width parameter.
75<br />
Bulk single scattering properties are computed by the appropriately weighted integrals. <strong>The</strong><br />
key properties for LBLDIS are the extinction efficiency, single scatter albedo, and phase function.<br />
<strong>The</strong> integrals can be expressed as follows, using the single size data computed for a single habit<br />
(Baum et al., 2007):<br />
¯Q ext (ν;r 0 ,σ) =<br />
¯ω(ν;r 0 ,σ) =<br />
¯P(θ,ν;r 0 ,σ) =<br />
∫ r2<br />
r 1<br />
Q ext (ν,r)A(r)N(r;r 0 ,σ)dr<br />
∫ r2<br />
r 1<br />
A(r)N(r;r 0 ,σ)dr<br />
∫ r2<br />
r 1<br />
ω(ν,r)Q ext (ν,r)A(r)N(r;r 0 ,σ)dr<br />
∫ r2<br />
r 1<br />
Q ext (ν,r)A(r)N(r;r 0 ,σ)dr<br />
∫ r2<br />
r 1<br />
P(θ,ν,r)ω(ν,r)Q ext (ν,r)A(r)N(r;r 0 ,σ)dr<br />
∫ r2<br />
r 1<br />
ω(ν,r)Q ext (ν,r)A(r)N(r;r 0 ,σ)dr<br />
(5.6)<br />
(5.7)<br />
(5.8)<br />
Each single scattering property is a function <strong>of</strong> wavenumber (ν) and PSD parameters (r 0 and<br />
σ), and the phase function is additionally a function <strong>of</strong> the scattering angle θ. <strong>The</strong>se values are<br />
pre-computed and stored within databases for LBLDIS. <strong>The</strong> LBLDIS input parameter contains<br />
wavenumber and effective radius, so a simple numerical inversion routine is used to compute the<br />
required r 0 parameter values for the desired grid values inr e . <strong>The</strong> sigma parameter is not an input<br />
parameter for LBLDIS so must be adjusted by recomputing the database at the desired σ value.<br />
Example single scattering properties computed from the column aggregate data are shown in figure<br />
5.3.<br />
5.1.3 Surface Emissivity<br />
<strong>The</strong> spectral variation <strong>of</strong> surface emissivity can interfere with cloud property retrievals. <strong>The</strong><br />
MIR window (roughly 750–1250 cm −1 ) contains the important spectral features related to the<br />
refractive index <strong>of</strong> ice that allow cloud property retrieval. Particle effective radius can be estimated<br />
from the slope <strong>of</strong> the spectrum through the IR window (Huang et al., 2004). Any slope due to<br />
spectral changes in the surface emissivity can introduce bias errors in cloud property retrievals by<br />
altering the spectral slope. For the clear sky simulations, this was not a serious concern, since<br />
the impact on thermodynamic pr<strong>of</strong>ile retrieval is not as important. In those simulations a constant<br />
surface (graybody) emissivity is assumed. For these cloudy simulations, an approximate surface
76<br />
wavelength [µm]<br />
Q ext<br />
ω 0<br />
g<br />
Q ext<br />
ω 0<br />
g<br />
3.0<br />
2.5<br />
2.0<br />
1.5<br />
1.0<br />
0.5<br />
0.0<br />
1.0<br />
0.8<br />
0.6<br />
0.4<br />
0.2<br />
0.0<br />
1.0<br />
0.8<br />
0.6<br />
0.4<br />
0.2<br />
0.0<br />
3.0<br />
2.5<br />
2.0<br />
1.5<br />
1.0<br />
0.5<br />
0.0<br />
1.0<br />
0.8<br />
0.6<br />
0.4<br />
0.2<br />
0.0<br />
1.0<br />
0.8<br />
0.6<br />
0.4<br />
0.2<br />
0.0<br />
20.00 10.00 6.67 5.00 4.00 3.33<br />
r e = 5<br />
r e = 10<br />
r e = 40<br />
σ = 0.025<br />
σ = 0.100<br />
σ = 0.400<br />
500 1000 1500 2000 2500 3000<br />
wavenumber [cm −1 ]<br />
Figure 5.3 Bulk single scattering properties computed for solid column aggregates. Top three<br />
plots show the primary scattering properties (Q ext , ω 0 , and g) for three values <strong>of</strong> effective radius,<br />
and σ = 0.1 for the PSD width parameter. <strong>The</strong> bottom three plots show the same scattering<br />
properties for three values <strong>of</strong> the width parameter forr e = 10 µm. <strong>The</strong> solid green lines are<br />
identical for each pair <strong>of</strong> scattering property plots in the top and bottom plot groups.
77<br />
spectral emissivity shape is used that represents a linear mixture between soil-like and vegetationlike<br />
surface spectral emissivity (?). <strong>The</strong> soil-like emissivity shows a strong feature at 1100–1200<br />
cm −1 which is highly correlated to the spectral emissivity <strong>of</strong> quartz measured in the lab (figure<br />
5.4). <strong>The</strong> soil-like spectral emissivity is extrapolated to the FIR by using a spectral fit <strong>of</strong> the<br />
quartz emissivity spectrum. <strong>The</strong>re are no spectral emissivity measurements <strong>of</strong> vegetated surfaces<br />
in the FIR, so the vegetation-like emissivity spectrum is assumed to be flat with ǫ = 0.997. A<br />
simple composite surface emissivity is used with the spectrum equal to the sum <strong>of</strong> the soil-like and<br />
vegetation-like spectra with the constraint that the two coefficients must sum to unity:<br />
ǫ(ν) = aǫ soil (ν)+(1−a)ǫ veg (ν) (5.9)<br />
Because <strong>of</strong> the constraint, the emissivity has only one coefficient to represent the relative weight<br />
<strong>of</strong> the two spectra. <strong>The</strong> assumed prior mean state for the surface emissivity coefficient is 0.5 (equal<br />
weighting). Figure 5.4 shows the equal weighted spectrum with the endmember spectra (a = 1 or<br />
0, indicating 100% soil-like or vegetation-like spectra).<br />
5.1.4 State Vector<br />
As with the clear sky simulations, the state vector contains the pr<strong>of</strong>iles <strong>of</strong> atmospheric temperature<br />
and logarithm <strong>of</strong> the water vapor mass mixing ratio. <strong>The</strong> mean pr<strong>of</strong>ile is taken from the<br />
standard atmosphere data (Anderson et al., 1986) rather than the computed priors from ACRF radiosonde<br />
data. <strong>The</strong> following variables are added to the state vector to describe cloud and boundary<br />
properties: cloud visible optical depth, PSD size parameter r 0 , PSD width parameter σ, cloud top<br />
altitude, surface temperature, and surface emissivity coefficient. <strong>The</strong> entire state vector for the<br />
cloudy sky simulation can be expressed as:<br />
x = [τ,r 0 ,σ,z,T s ,a,T(z k ),ln(q(z k ))] T (5.10)<br />
<strong>The</strong> assumed prior covariance for these additional components is assumed to be diagonal, while<br />
the temperature and water vapor pr<strong>of</strong>iles have the synthetic correlation structure shown in figure<br />
3.2. Table 5.1 shows the assumed prior variance for each variable. <strong>The</strong>se are ad hoc selections but
78<br />
1.02<br />
1.00<br />
0.98<br />
emissivity (ǫ)<br />
0.96<br />
0.94<br />
0.92<br />
0.90<br />
0.88<br />
Soil 100% / Vege 0%<br />
Soil 50% / Vege 50%<br />
Soil 0% / Vege 100%<br />
0.86<br />
0 500 1000 1500 2000 2500 3000<br />
wavenumber [cm −1 ]<br />
Figure 5.4 Spectral surface emissivity model containing a soil-like and vegetation-like MIR<br />
spectra, extrapolated into the FIR using the quartz emissivity spectrum in Christensen et al.<br />
(2000).
79<br />
Table 5.1 Assumed prior variances for additional pr<strong>of</strong>iles in cloudy simulations<br />
Variable Variance Units Note<br />
optical depth (τ) 25 N/A increased toτ 2 when τ > 5<br />
PSD size parameter (r 0 ) 200 2 µm 2<br />
PSD width parameter (σ) 0.25 N/A<br />
cloud height (z) 4 km 2<br />
surface temperature (T s ) 4 K 2<br />
emissivity coefficient (a) 50 2 Pct.<br />
are intended to represent relatively good prior information on the cloud boundaries (cloud height<br />
and surface temperature) but little prior information on cloud properties (cloud optical depth and<br />
PSD parameters) and the surface emissivity coefficient.<br />
5.1.5 Model Error<br />
<strong>The</strong> layer cloud assumption is a significantly limiting approximation, since real clouds are<br />
rarely homogeneous over a typical satellite sounder’s field <strong>of</strong> view (∼ 10 km). <strong>The</strong> forward model<br />
error introduced by this assumption is difficult to estimate, but a simple approximation can be<br />
made by using the independent pixel approximation and simulating the sensor field <strong>of</strong> view as<br />
a collection <strong>of</strong> smaller subpixels. <strong>The</strong> independent pixel assumption is less limiting as long as<br />
highly three dimensional cloud fields (e.g., fair weather cumulus) are avoided. <strong>The</strong> focus <strong>of</strong> this<br />
research is high altitude ice clouds, such as cirrus and convective anvils, so the problematic three<br />
dimensional cases are avoided.<br />
<strong>The</strong> forward model error approximation is computed by computing a number <strong>of</strong> 4 sub-pixel<br />
spectral radiances and averaging the results to get a single simulated radiance. Each <strong>of</strong> the 4 subpixel<br />
clouds is assigned a random τ value, such that the mean <strong>of</strong> the 4 values is equal to some<br />
selected fixed value and the variance is equal to 10% <strong>of</strong> the mean. For example a cloud with an<br />
optical depth <strong>of</strong> 10 could have a sub-pixel realization with the four optical depth values 9.1, 10.2,
80<br />
11.3, and 9.4. <strong>The</strong> simulated radiance is then the mean <strong>of</strong> the radiance computed for the four individual<br />
τ values. Because the radiance has a nonlinear relationship to τ, this mean radiance will<br />
not be equal to the radiance <strong>of</strong> a single simulation with τ = 10. Repeating this calculation for a<br />
large number <strong>of</strong> realizations produces many spectral radiances all with the same average τ value<br />
(10 in this case), from which a spectral covariance can be computed. For these experiments, the<br />
random variation is a Gaussian random variable with mean 1 and standard deviation 0.1 that multiplies<br />
the optical depth value. <strong>The</strong> model error must be computed for each set <strong>of</strong> cloud properties.<br />
<strong>The</strong> computed error depends strongly on cloud optical depth and cloud height with particle size<br />
and habit causing smaller higher order affects. Thus, the model error is pre-computed for several<br />
optical depth values for the tropical standard atmosphere for the column aggregate habit and an<br />
effective particle radius <strong>of</strong> 5µm. Figure 5.5 shows an example <strong>of</strong> the model error covariance forτ<br />
= 1. This error covariance is then used in DFS and posterior error calculations by adding it to the<br />
sensor noise error covariance (equation 3.4).<br />
5.1.6 IWP and IWP Error Propagation<br />
<strong>The</strong> total Ice Water Path (IWP) in the cloud layer is a key property connecting the cloud radiative<br />
properties to the hydrological cycle in the atmosphere. Dynamic processes lift different<br />
amounts <strong>of</strong> water vapor into the upper atmosphere where it condenses to form ice clouds. Although<br />
the radiative forcing <strong>of</strong> these clouds on the Outgoing Longwave Radiation (OLR) is well<br />
measured by satellites, the IWP has not as well known. GCMs also show a wide range in global<br />
IWP distributions (John and Soden, 2006). Much <strong>of</strong> this variation can be accounted by differences<br />
in ice particle PSD. Two PSDs with significant shape differences can lead to very different IWP<br />
while simultaneously having similar optical depth. Part <strong>of</strong> the aim <strong>of</strong> the cloudy pr<strong>of</strong>ile simulations<br />
is to gain some insight about the extent to which hyperspectral measurements constrain the IWP,<br />
and if extending the spectral measurement into the FIR will improve the IWP estimate.<br />
<strong>The</strong> PSD and volume-dimensional relationships for the cloud particles are known in these<br />
simulations. <strong>The</strong> IWP <strong>of</strong> the cloud layer (I) is a straightforward calculation integrating the volume<br />
and PSD product to get the Ice Water <strong>Content</strong> (IWC) and then integrating IWC over the cloud
81<br />
40.0<br />
1.4<br />
wavelength [µm]<br />
20.0<br />
13.3<br />
10.0<br />
8.0<br />
1.2<br />
1.0<br />
0.8<br />
0.6<br />
0.4<br />
0.2<br />
Radiance 2 [mW / (m 2 sr cm −1 )] 2<br />
250 500 750 1000 1250<br />
wavenumber [cm −1 ]<br />
0.0<br />
Figure 5.5 Model error covariance for a cloud with optical depth 1.
82<br />
thickness:<br />
∫ z2<br />
[ ∫ r2<br />
]<br />
I = ρ i N 0 V(r)N(r;r 0 ,σ)dr dz (5.11)<br />
z 1 r 1<br />
where ρ i is the mass density <strong>of</strong> bulk ice, 0.917 g cm −3 , and N 0 is the as yet unspecified constant<br />
proportional to the total particle number density (recall that the size distribution N(r) is a true<br />
PDF, so it integrates to unity and has units <strong>of</strong> inverse length). <strong>The</strong> expression can be rearranged<br />
in a more convenient form by first writing the visible optical depth (Q ext = 2) as another double<br />
integral <strong>of</strong> similar form to the IWP equation above:<br />
∫ z2<br />
[ ∫ r2<br />
]<br />
τ = ρ i N 0 2A(r)N(r;r 0 ,σ)dr dz (5.12)<br />
z 1 r 1<br />
Rearranging the equation for I and then substituting τ gives the following equation for I in<br />
terms <strong>of</strong> known quantities:<br />
I = 1 2 ρ iτ<br />
∫ r2<br />
r 1<br />
V(r)N(r;r 0 ,σ)dr<br />
∫ r2<br />
r 1<br />
A(r)N(r;r 0 ,σ)dr<br />
(5.13)<br />
Given a posterior covariance Ŝ, standard error linear propagation can be used to compute the<br />
variance on the IWP:<br />
σIWP 2 = KT IWPŜK IWP (5.14)<br />
<strong>The</strong> term K IWP is the Jacobian <strong>of</strong> equation 5.13 with respect to the state variables τ, r 0 and<br />
σ. K IWP is a three element column vector, since the other state variables (thermodynamic pr<strong>of</strong>ile,<br />
cloud height, surface properties) do not affect the IWP calculation. <strong>The</strong> components <strong>of</strong> K IWP are<br />
presented in Appendix B.<br />
5.2 Results<br />
<strong>The</strong> main calculations for the cloudy pr<strong>of</strong>ile investigation are the OE metrics at the prior mean<br />
pr<strong>of</strong>iles. <strong>The</strong> metrics are computed in a grid spanning a section <strong>of</strong> state space across optical depth<br />
and cloud particle size. An approximately logarithmic grid for cloud optical depth is used to span<br />
the range 0.02–50 with 11 discrete values. For particle effective radius, five values from 5 µm to
83<br />
75µm are selected. A single cloud is simulated at 14 km altitude for the tropical pr<strong>of</strong>ile and 10 km<br />
altitude for the subarctic pr<strong>of</strong>ile. For the particle distribution, the width parameter σ is set to 0.1<br />
and the solid column aggregate habit is used.<br />
5.2.1 <strong>The</strong>rmodynamic Pr<strong>of</strong>ile<br />
∆DFS for the thermodynamic pr<strong>of</strong>iles showing the difference between combined measurements<br />
and MIR-only measurements are shown in figure 5.6. With this sign convention, a positive<br />
∆DFS implies the FIR adds new information to the MIR measurement. <strong>The</strong> temperature pr<strong>of</strong>ile<br />
shows significant through-cloud DFS increase for the smallest particle size and little increase for<br />
the large particle size. At the small particle size, the increased DFS is shown for all but theτ = 50<br />
pr<strong>of</strong>ile, meaning radiance from below the cloud is transmitted even for the τ = 20 cloud. <strong>The</strong><br />
significant drop in Q ext in the FIR for small particles implies a much lower optical depth. At 300<br />
cm −1 , Q ext drops to about 20% <strong>of</strong> the visible optical depth, so the τ = 20 cloud has an optical<br />
depth as low as 4 in the FIR (figure 5.3). At slightly higher wavenumbers (400 cm −1 ) the Q ext<br />
rises to about 50% <strong>of</strong> the visible optical depth at the same time the single scatter albedo rises to<br />
0.85 which will also increase the cloud transmittance. For larger particle sizes, the Q ext increases<br />
and ω 0 decreases, resulting in less transmittance through the cloud layer.<br />
In addition to the increased information in the water vapor and temperature pr<strong>of</strong>iles below the<br />
cloud, the water vapor pr<strong>of</strong>ile shows increased information above the cloud. <strong>The</strong> increase above<br />
the cloud is caused by the changed Jacobian pr<strong>of</strong>ile shapes that result from the interaction between<br />
water vapor and the cloud layer. In the clear sky case, there are many weighting functions centered<br />
on water vapor absorption lines that peak near or below the cloud altitude. A high optical<br />
depth cloud has the effect <strong>of</strong> truncating the weighting function at the cloud altitude. <strong>The</strong> truncated<br />
weighting function is much narrower since it only contains the high altitude tail <strong>of</strong> the clear sky<br />
weighting function. In addition, the scattering <strong>of</strong> the cloud layer in the FIR creates cases where the<br />
sign <strong>of</strong> the water vapor Jacobian changes sign near the cloud top. In clear sky cases, an increase<br />
in water vapor will always lead to a decrease in radiance, due to the lapse rate in the troposphere.<br />
Higher water vapor will block radiance from lower, warmer layers, and emit at colder emission
84<br />
temperatures. Higher water vapor inside a partially reflective cloud can have the opposite effect,<br />
by essentially reducing the effective single scatter albedo <strong>of</strong> the ice particle and water vapor mixture.<br />
In these cases an increase in water vapor can increase the radiance. Figure 5.7 shows several<br />
example Jacobian pr<strong>of</strong>iles at FIR wavenumbers with different amounts <strong>of</strong> ice particle scattering.<br />
Compared to the clear sky, the cloudy atmosphere does tend to produce sharper and more independently<br />
shaped Jacobian pr<strong>of</strong>iles for upper troposphere water vapor in this case. Both <strong>of</strong> these<br />
effects increase the DFS <strong>of</strong> the water vapor pr<strong>of</strong>ile.<br />
Finally, recalling the relative advantage <strong>of</strong> the FIR over the MIR for cold upper atmosphere<br />
temperatures (discussed in section 2.3.2), the actual radiance signature associated with the water<br />
vapor changes will be larger in the FIR. <strong>The</strong> MIR Jacobian pr<strong>of</strong>iles in figure 5.7 show much smaller<br />
magnitudes and would be associated with a much smaller information content for the water vapor<br />
pr<strong>of</strong>ile. <strong>The</strong> result is the significant DFS increase above the cloud when combining the FIR spectra<br />
with the MIR. <strong>The</strong> increase appears strongest for the higher cloud optical depth, as shown in figure<br />
5.6.<br />
<strong>The</strong> total pr<strong>of</strong>ile DFS (sum <strong>of</strong> temperature and water vapor DFS pr<strong>of</strong>iles) can be summed<br />
for the below cloud and above cloud layers to show the effect with respect to radius and cloud<br />
optical depth more clearly (figure 5.8). <strong>The</strong> additional DFS added due to the cloud reflectance<br />
or transmission can be estimated by subtracting the value for the lowest τ value. <strong>The</strong> additional<br />
DFS above the cloud is fairly small, peaking at roughly 0.4 DFS. <strong>The</strong> below cloud shows a much<br />
stronger effect, peaking at 3–4 additional DFS in the ideal conditions <strong>of</strong> large τ and small particle<br />
size.<br />
5.2.2 Cloud Microphysics<br />
For each cloud property state variable, the DFS is plotted individually as a series <strong>of</strong> lines (one<br />
per effective radius) as a function <strong>of</strong> cloud optical depth alongside the posterior error for the same<br />
variable. Figures 5.9 and 5.10 show the results for the MIR-only measurements and the combined<br />
measurements, respectively. A number <strong>of</strong> important qualitative features stand out in the MIR-only<br />
measurements. First, for cloud optical depth, the DFS is nearly one at optical depths below 20 with
85<br />
Altitude [km]<br />
Temp. W. V.<br />
20<br />
15<br />
10<br />
5<br />
R e =5µm<br />
R e =10µm<br />
Temp. W. V.<br />
R e =20µm<br />
Temp. W. V.<br />
R e =40µm<br />
Temp. W. V.<br />
0.40<br />
0.36<br />
0.32<br />
0.28<br />
0.24<br />
0.20<br />
0.16<br />
0.12<br />
0.08<br />
0.04<br />
∆DFS [1/km]<br />
0<br />
1 5 50 1 5 50 1 5 50 1 5 50 1 5 50 1 5 50 1 5 50 1 5 50<br />
Cloud Visible Optical Depth<br />
0.00<br />
Figure 5.6 ∆DFS pr<strong>of</strong>iles (combined minus MIR) for clouds with different particle effective<br />
radii. <strong>The</strong>xaxis in each image is an approximately logarithmic spacing in cloud visible optical<br />
depth from 0.1 to 50. (Top) tropical atmosphere with cloud layer at 14 km and (bottom) subarctic<br />
winter atmosphere with cloud layer at 10 km.
86<br />
315.00 cm −1 −0.2−0.1 0.0 0.1<br />
374.50 cm −1 −0.2−0.1 0.0 0.1<br />
423.00 cm −1 −0.2−0.1 0.0 0.1<br />
Altitude [km]<br />
20<br />
19<br />
18<br />
17<br />
16<br />
15<br />
1457.00 cm −1 clear<br />
Jacobian<br />
pr<strong>of</strong>ile<br />
cloudy<br />
Jacobian<br />
pr<strong>of</strong>ile<br />
cloud<br />
boundary<br />
21<br />
14<br />
13<br />
12<br />
−0.2−0.1 0.0 0.1<br />
[mW / (m 2 sr cm −1 )] / ln(water vapor mass mixing ratio)<br />
Figure 5.7 Selected Jacobian pr<strong>of</strong>iles for nearly clear sky (τ = 0.02, black lines) and high optical<br />
depth cloud layer (τ = 50, gray lines) in a standard tropical atmosphere. All selected<br />
wavenumbers are centered on strong water vapor absorption lines. <strong>The</strong> three FIR wavenumbers<br />
show significant differences in the Jacobian pr<strong>of</strong>ile. All MIR Jacobian pr<strong>of</strong>iles show a similar<br />
shape to the single pr<strong>of</strong>ile shown here.
87<br />
∆ DFS (above cloud)<br />
1.4<br />
1.2<br />
1.0<br />
0.8<br />
0.6<br />
0.4<br />
0.2<br />
0.0<br />
5<br />
tropical ∆ DFS<br />
Subarc win. ∆ DFS<br />
R e = 5.0 µm<br />
R e =10.0 µm<br />
R e =20.0 µm<br />
R e =40.0 µm<br />
R e =75.0 µm<br />
∆ DFS (below cloud)<br />
4<br />
3<br />
2<br />
1<br />
0<br />
10 -2 10 -1 10 0 10 1 10 2<br />
Cloud τ<br />
10 -2 10 -1 10 0 10 1 10 2<br />
Cloud τ<br />
Figure 5.8 Summed∆DFS for all above cloud levels (top row) and below cloud levels (bottom<br />
row), for the results shown in figure 5.6.
88<br />
a steep drop for the highest values <strong>of</strong> optical depth. Since the prior variance for optical depth is<br />
25, the DFS is large even for very thin clouds since the retrieval can strongly constrain the optical<br />
depth to be near zero. <strong>The</strong> posterior error, expressed as a fractional error, does show that the error<br />
increases for thin clouds as expected. <strong>The</strong> posterior error is similar for all particle sizes, with a<br />
minimum error <strong>of</strong> a few percent in the region <strong>of</strong> highest sensitivity (1 < τ < 5). <strong>The</strong> error increases<br />
to> 20% for the smallestτ and increases to the prior error for the largeτ. Similar patterns are seen<br />
in both particle PSD parameters (r 0 and σ). <strong>The</strong> best sensitivity is for moderate range in optical<br />
depth. <strong>The</strong> performance is poor at low τ (< 0.5) due to the smaller magnitude radiance signature.<br />
At high τ (> 10) the performance is poor due to the cloud emissivity becoming near unity at all<br />
MIR wavenumbers. <strong>The</strong> spectral signatures used to retrieve the microphysical properties saturate<br />
and the sensitivity is lost. Large particle radii (>= 40 µm) also show lower sensitivity, since the<br />
scattering properties tend to show less spectral variation as particle size increases.<br />
<strong>The</strong> cloud height DFS and error shows rapid change as optical depth increases, converging to<br />
a minimum error at approximately τ = 1. This behavior is expected since the cloud temperature,<br />
and thus cloud height, is measured most accurately when the cloud is opaque. For the surface temperature<br />
and emissivity, the DFS and error curve shapes can be entirely explained by the amount<br />
<strong>of</strong> cloud transmittance. For large τ the transmittance drops to zero, in turn reducing the DFS to<br />
zero and increasing the posterior error to the prior value. <strong>The</strong> smallest particle size shows slightly<br />
increased DFS and reduced error. Recalling the larger single scatter albedo and smaller extinction<br />
efficiency <strong>of</strong> small particles (figure 5.3), the clouds with small particles should have larger<br />
transmittance relative to clouds with larger particles.<br />
Combining the FIR and MIR measurements significantly improves in the microphysical retrieval,<br />
but has little effect on the surface property and cloud height retrievals. Since the MIR<br />
contains window channels, the radiance contrast between the warm surface and cold cloud temperature<br />
allows for accurate τ and z retrievals. <strong>The</strong> cloud free emission in the FIR is largely<br />
from water vapor that is almost always colder than the surface. <strong>The</strong> result is a much smaller radiance<br />
contrast, so the FIR will not significantly improve τ and z retrievals. By adding the FIR<br />
spectrum, the microphysical parameters show much improved posterior errors, particularly for the
89<br />
larger particle sizes and large τ. <strong>The</strong> MIR spectral signatures tend to saturate in those conditions,<br />
as discussed above. <strong>The</strong> FIR scattering properties show elevated single scatter albedo for a wider<br />
range <strong>of</strong> particle sizes than the MIR, and the lower asymmetry parameter leads to proportionally<br />
more backscattering. <strong>The</strong> result is a partially reflective cloud even for τ > 20 with the spectral<br />
shape <strong>of</strong> the reflective component dependent on the PSD parameters. <strong>The</strong> reflective signature adds<br />
information for the PSD parameters up to the largestτ (50) in all cases but the largest particle size<br />
(75 µm). Improvement is also seen in theτ retrieval itself for the large τ cases.<br />
Focusing on the improvement <strong>of</strong> the FIR spectral measurement, figure 5.11 shows the ∆DFS<br />
plots and error reductions computed as the difference between the FIR and combined results.<br />
Specifically, the ∆DFS plots show the MIR-only DFS subtracted from the combined DFS, and<br />
the error plots show the combined error subtracted from the MIR-only error. <strong>The</strong> sign choice implies<br />
improvement is a positive number for all plots. <strong>The</strong>se plots emphasize the ability <strong>of</strong> the FIR<br />
to improve the retrievals for large τ and large r e clouds. Little change is seen in clouds with small<br />
r e and moderate τ. In these cases, the sensitivity <strong>of</strong> the MIR is very large, because the spectral<br />
shape <strong>of</strong> the cloud emissivity changes greatly through the MIR window region. Given our assumed<br />
spectral sensor noise, the effective SNR <strong>of</strong> this signature is far larger in the MIR, so the FIR does<br />
little to improve the retrieval <strong>of</strong> small particles.<br />
5.2.3 IWP<br />
Equation 5.14 is applied to the posterior error covariances from the MIR-only and combined<br />
FIR + MIR measurements. IWP error expressed as a relative percentage <strong>of</strong> the total computed IWP<br />
is presented in figure 5.12. <strong>The</strong> general form <strong>of</strong> the IWP error from the MIR-only measurement<br />
matches expectations based on the shape <strong>of</strong> the DFS and posterior error plots shown in figure 5.9.<br />
Specifically, increased error is seen for larger particle size, large optical depth, and small optical<br />
depth, as discussed in the previous section. By adding the FIR measurement the IWP error is much<br />
less dependent on particle size and the large particle IWP error is within a factor <strong>of</strong> 1–2 <strong>of</strong> the<br />
small particle IWP error in the range <strong>of</strong> good sensitivity (0.1 < τ < 10). <strong>The</strong> error reduction for<br />
small particles and largeτ is quite dramatic with just over a 60% reduction.
90<br />
MIR<br />
τ DFS<br />
r 0 DFS<br />
σ DFS<br />
z DFS<br />
T s DFS<br />
ǫ s DFS<br />
1.0<br />
0.8<br />
0.6<br />
0.4<br />
0.2<br />
0.0<br />
1.0<br />
0.8<br />
0.6<br />
0.4<br />
0.2<br />
0.0<br />
1.0<br />
0.8<br />
0.6<br />
0.4<br />
0.2<br />
0.0<br />
1.0<br />
0.8<br />
0.6<br />
0.4<br />
0.2<br />
0.0<br />
1.0<br />
0.8<br />
0.6<br />
0.4<br />
0.2<br />
0.0<br />
1.0<br />
0.8<br />
0.6<br />
0.4<br />
0.2<br />
0.0<br />
Diagonal el. <strong>of</strong> A<br />
R e =5.00<br />
R e =10.00<br />
R e =20.00<br />
R e =40.00<br />
R e =75.00<br />
10 -1 10 0 10 1 10 2<br />
Cloud τ<br />
Sqrt. diagonal el. <strong>of</strong> Ŝ<br />
10 2<br />
10 1<br />
10 0<br />
10 2<br />
10 1<br />
10 0<br />
0.5<br />
0.4<br />
0.3<br />
0.2<br />
0.1<br />
0.0<br />
2.0<br />
1.5<br />
1.0<br />
0.5<br />
0.0<br />
2.0<br />
1.5<br />
1.0<br />
0.5<br />
0.0<br />
50<br />
40<br />
30<br />
20<br />
10<br />
10 -1 10 0 10 1 10 20<br />
error [rel. %]<br />
error [rel. %]<br />
error [σ]<br />
error [km]<br />
error [K]<br />
error [%]<br />
Figure 5.9 Simulated cloud layer at 14 km in a tropical standard atmosphere. (Left) DFS and<br />
(right) posterior error for cloud microphysical and boundary variables using the MIR-only<br />
measurement. <strong>The</strong> dotted lines on the right side show the standard deviation in the prior, where<br />
applicable.
91<br />
combined<br />
τ DFS<br />
r 0 DFS<br />
σ DFS<br />
z DFS<br />
T s DFS<br />
ǫ s DFS<br />
1.0<br />
0.8<br />
0.6<br />
0.4<br />
0.2<br />
0.0<br />
1.0<br />
0.8<br />
0.6<br />
0.4<br />
0.2<br />
0.0<br />
1.0<br />
0.8<br />
0.6<br />
0.4<br />
0.2<br />
0.0<br />
1.0<br />
0.8<br />
0.6<br />
0.4<br />
0.2<br />
0.0<br />
1.0<br />
0.8<br />
0.6<br />
0.4<br />
0.2<br />
0.0<br />
1.0<br />
0.8<br />
0.6<br />
0.4<br />
0.2<br />
0.0<br />
Diagonal el. <strong>of</strong> A<br />
R e =5.00<br />
R e =10.00<br />
R e =20.00<br />
R e =40.00<br />
R e =75.00<br />
10 -1 10 0 10 1 10 2<br />
Cloud τ<br />
Sqrt. diagonal el. <strong>of</strong> Ŝ<br />
10 2<br />
10 1<br />
10 0<br />
10 2<br />
10 1<br />
10 0<br />
0.5<br />
0.4<br />
0.3<br />
0.2<br />
0.1<br />
0.0<br />
2.0<br />
1.5<br />
1.0<br />
0.5<br />
0.0<br />
2.0<br />
1.5<br />
1.0<br />
0.5<br />
0.0<br />
50<br />
40<br />
30<br />
20<br />
10<br />
10 -1 10 0 10 1 10 20<br />
error [rel. %]<br />
error [rel. %]<br />
error [σ]<br />
error [km]<br />
error [K]<br />
error [%]<br />
Figure 5.10 Same as figure 5.9, but using combined (FIR + MIR) measurements.
92<br />
τ ∆ DFS<br />
1.0<br />
0.8<br />
0.6<br />
0.4<br />
0.2<br />
0.0<br />
Diagonal el. <strong>of</strong> A<br />
R e =5.00<br />
R e =10.00<br />
R e =20.00<br />
R e =40.00<br />
R e =75.00<br />
Sqrt. diagonal el. <strong>of</strong> Ŝ<br />
60<br />
50<br />
40<br />
30<br />
20<br />
10<br />
0<br />
error reduction [rel. %]<br />
r 0 ∆ DFS<br />
1.0<br />
0.8<br />
0.6<br />
0.4<br />
0.2<br />
0.0<br />
450<br />
400<br />
350<br />
300<br />
250<br />
200<br />
150<br />
100<br />
50<br />
0<br />
error reduction [rel. %]<br />
1.0<br />
0.5<br />
σ ∆ DFS<br />
0.8<br />
0.6<br />
0.4<br />
0.2<br />
0.0<br />
10 -1 10 0 10 1 10 2<br />
Cloud τ<br />
0.4<br />
0.3<br />
0.2<br />
0.1<br />
0.0<br />
10 -1 10 0 10 1 10 2<br />
Cloud τ<br />
error reduction [σ]<br />
Figure 5.11 For the three cloud microphysical properties, (Left) DFS increase by adding FIR to<br />
MIR-only measurements (Right) Reduction in posterior error by adding FIR to MIR-only<br />
measurements.
93<br />
% IWP Error<br />
120<br />
(a)<br />
100<br />
80<br />
60<br />
40<br />
IWP from MIR<br />
IWP from combined<br />
(b)<br />
(c)<br />
Error reduction<br />
r e = 5 µm<br />
r e = 10 µm<br />
r e = 20 µm<br />
r e = 40 µm<br />
r e = 75 µm<br />
20<br />
0<br />
10 -1 10 0 10 1<br />
10 -1 10 0 10 1<br />
Cloud τ<br />
10 -1 10 0 10 1<br />
Figure 5.12 (a) percentage IWP error using MIR-only measurement, (b) percentage IWP error<br />
using combined FIR + MIR measurement, and (c) reduction in IWP error from combining FIR to<br />
MIR measurement (data from (a) minus data from (b)). Simulations using high altitude cloud<br />
layer in tropical atmosphere (same as figures 5.9 – 5.11).
94<br />
5.3 Summary<br />
Using simulations <strong>of</strong> cloudy sky pr<strong>of</strong>iles, extending the MIR spectral measurement into the FIR<br />
improved retrievals <strong>of</strong> thermodynamic pr<strong>of</strong>iles and cloud microphysical properties. For throughcloud<br />
pr<strong>of</strong>iling, the improvement is primarily for thick clouds with very small ice particle size<br />
(r e < 10µm) which is not likely a common occurrence in the real atmosphere. Very small particles<br />
can occur in orographically forced clouds (Kahn et al., 2003), but typical particle sizes in cirrus<br />
clouds from global retrievals are generally in the range10 < r e < 50µm (Radel et al., 2003). <strong>The</strong><br />
higher transmittance does imply a different vertical sensitivity to the cloud particle distribution.<br />
Highly scattering FIR wavenumbers should have weighting functions that extend further into the<br />
cloud compared to wavenumbers with lower scattering. Whether this could lead to retrievable<br />
information on the vertical variation <strong>of</strong> particle size is a topic for future research.<br />
<strong>The</strong> increase in above cloud information content in the thermodynamic pr<strong>of</strong>ile is a more generally<br />
useful result. <strong>The</strong> increased DFS occurs in the upper troposphere and lower stratosphere,<br />
where water vapor measurement is particularly important for climate studies due to its important<br />
role in water vapor feedback, modulation <strong>of</strong> clear sky OLR, and clear sky cooling rates.<br />
Combining FIR and MIR measurements also shows improved retrieval <strong>of</strong> IWP. <strong>The</strong> largest improvement<br />
is shown in high optical depth clouds. It should be noted that thick clouds are much<br />
more likely to have vertically inhomogeneous particle distributions. In retrievals using observations<br />
<strong>of</strong> real clouds, the IWP for thick clouds would be poorly estimated for any FIR or MIR<br />
measurement simply due to the fact that the lower levels <strong>of</strong> the cloud are obscured in the measurement.<br />
Observations <strong>of</strong> much longer wavelengths such as microwave or submillimeter are required<br />
in this case (Buehler et al., 2007). <strong>The</strong> improvement in IWP retrieval for moderate τ and large<br />
particle size is <strong>of</strong> more practical use.
95<br />
Chapter 6<br />
Discussion<br />
6.1 Applications <strong>of</strong> FIR Radiative Transfer and Remote Sensing<br />
6.1.1 FIR Small Particle Signatures in Anvil Clouds<br />
In convective storms, strong updrafts can produce ice particles that are smaller than the ice<br />
particles in the surrounding anvil cloud. This Small Particle Signature (SPS) can be detected as an<br />
isolated area <strong>of</strong> smaller particle effective size embedded in the larger anvil cloud. <strong>The</strong> SPS are associated<br />
with reflectivity detections in ground based radar that indicate strong convective updrafts<br />
(Hart, 2012). Figure 6.1 shows an example retrieval <strong>of</strong> ice particle effective size using the Daytime<br />
Cloud Optical and Microphysical Properties (DCOMP) algorithm (Walther and Heidinger, 2012).<br />
In this case DCOMP is applied to imager data collected from a geostationary weather satellite. <strong>The</strong><br />
algorithm uses shortwave channels (wavelength 0.6 µm and 3.9 µm) to retrieve particle effective<br />
size. Since the FIR has information about particle size for optically thick clouds, FIR measurements<br />
may be able to detect these SPS at night when the DCOMP algorithm is not applicable.<br />
In figure 6.1, the two circles identify SPS within the observed anvil clouds. <strong>The</strong> SPS show<br />
ice particle effective radii in the range 15–20 µm, while the surrounding anvil has an effective<br />
radii <strong>of</strong> > 30 µm. Different types <strong>of</strong> anvil clouds described in Hart (2012) show a wider range<br />
<strong>of</strong> particle effective radii, but the SPS typically shows retrieved radii <strong>of</strong> 10–15 µm smaller than<br />
the surrounding anvil. For a simple sensitivity test, spectral radiances are simulated to show the<br />
MIR and FIR brightness temperature contrast between the SPS and surrounding anvil cloud. Two<br />
situations are simulated based on the typical effective radii ranges noted above. In each case, the<br />
cloud layer is simulated with an optical depth <strong>of</strong> τ = 20. In the first case, the SPS and anvil
Figure 6.1 DCOMP retrieved ice particle effective size in convective anvil clouds over south<br />
central United States. <strong>The</strong>se clouds were observed on May 22, 2008, in multispectral imagery<br />
from a geostationary satellite. <strong>The</strong> orange circles mark Small Particle Signatures (r e < 20 µm<br />
surrounded by r e > 30µm) that are associated with strong convective updrafts. Figure from Hart<br />
(2012).<br />
96
97<br />
BTD [K]<br />
4.0<br />
3.5<br />
3.0<br />
2.5<br />
2.0<br />
1.5<br />
1.0<br />
0.5<br />
0.0<br />
−0.5<br />
wavelength [µm]<br />
20.00 10.00 6.67 5.00<br />
r e = 35 − 20 µm<br />
r e = 45 − 30 µm<br />
500 1000 1500 2000<br />
wavenumber [1/cm]<br />
Figure 6.2 Simulated brightness temperature difference across the MIR and FIR spectral ranges.<br />
Two clouds are simulated, matching DCOMP retrievals <strong>of</strong> particle effective radius (see figure<br />
6.1). <strong>The</strong> gray line is <strong>of</strong>fset by +1 K to better show the differences in the two spectra.<br />
have effective particle radii <strong>of</strong> 20 and 35 µm and in the second case the radii are 30 and 45 µm.<br />
<strong>The</strong> standard midlatitude summer pr<strong>of</strong>ile is used for the atmosphere. DCOMP uses the scattering<br />
property database from Baum et al. (2007), which is based on the same single size scattering data<br />
(Yang et al., 2005) used in these simulations. <strong>The</strong> particle habit used in these simulations is the<br />
column aggregate, which does not match the Baum et al. (2007) habit distribution. However,<br />
the resulting difference in sensitivity to effective particle radius should be small. For each <strong>of</strong><br />
the two pairs <strong>of</strong> effective radii, the two spectral radiances are computed and subtracted to get<br />
a brightness temperature difference spectrum. <strong>The</strong> difference spectra show which wavenumbers<br />
would be sensitive to the difference in particle size between the SPS and anvil. <strong>The</strong>se spectra are<br />
shown in figure 6.2. <strong>The</strong> MIR wavenumber range shows maximum differences <strong>of</strong> about 0.1 K,<br />
while the peak scattering wavenumbers in the FIR (400 cm −1 ) show 1.5–2.5 K difference. <strong>The</strong>se<br />
spectral differences suggest that a FIR imager channel with a noise level below 1 K in brightness<br />
temperature could detect the SPS.
98<br />
6.1.2 FIR Radiative Transfer in GCMs<br />
In large domain atmosphere models such as General Circulation Models (GCMs), the primary<br />
radiative quantity is the vertical pr<strong>of</strong>ile <strong>of</strong> the spectrally integrated flux. <strong>The</strong> flux pr<strong>of</strong>ile is directly<br />
related to the heating rate, which in turn couples the radiation field to dynamical processes in the<br />
atmosphere. <strong>The</strong> spectrally resolved flux or radiance is not directly important, since the spectrally<br />
integrated quantity is what controls the heating rate pr<strong>of</strong>ile. Typically the radiative transfer implemented<br />
within these models uses optimized parameterizations over a relatively small number<br />
<strong>of</strong> wide spectral bands covering the entire spectrum (longwave and shortwave). <strong>The</strong>se optimized<br />
methods are tuned to reproduce the heating rate pr<strong>of</strong>iles computed with more accurate but computationally<br />
expensive reference codes. <strong>The</strong> FIR is particularly important since a large fraction <strong>of</strong><br />
the clear sky longwave heating occurs in this spectral range (Clough et al., 1992). Any updated<br />
knowledge <strong>of</strong> FIR radiative transfer should lead to updated parameterized codes used in GCMs or<br />
other forecast models.<br />
One such parameterized model, the Rapid Radiative Transfer Model developed at AER (RRTM,<br />
Mlawer et al. (1997)) is based on the same MT CKD water vapor continuum as used in the<br />
LBLRTM. Recent field campaign data has led to updates in the MT CKD continuum parameters<br />
in the FIR (Turner and Mlawer, 2010). Since the RRTM is used within the Community Earth System<br />
Model (CESM), a coupled GCM developed at the National Center for <strong>Atmospheric</strong> Research<br />
(NCAR), the changes to the FIR water vapor continuum can be quickly adapted to the model. <strong>The</strong><br />
change to the water vapor continuum absorption introduces an altered pr<strong>of</strong>ile in the clear sky heating<br />
rate. <strong>The</strong> zonal average clear sky heating rate change is shown in Figure 6.3. <strong>The</strong> model quickly<br />
adjusts to this energy imbalance by adjusting the temperature, cloud and water vapor fields. <strong>The</strong><br />
higher altitude layer that is heated by the changed water vapor absorption warms and the relative<br />
humidity drops. Lower humidity causes a slight drop (0.5%) in global cloud cover. <strong>The</strong> pattern<br />
<strong>of</strong> zonal heating changes due to the cloud and humidity adjustment in a way that tends to cancel<br />
the heating change introduced by the water vapor continuum model update. This set <strong>of</strong> GCM runs<br />
shows a direct connection between the clear sky radiative transfer parameterizations and the model<br />
thermodynamic fields. No significant changes were noted in the model’s dynamical fields, as the
99<br />
thermodynamic and cloud adjustment appeared to balance. <strong>The</strong> gradual improvement <strong>of</strong> radiative<br />
transfer parameterizations can be noted by comparing the impact <strong>of</strong> this recent MT CKD update to<br />
those in the previous generation <strong>of</strong> radiation parameterizations (Collins et al., 2002). In this earlier<br />
study, the pattern <strong>of</strong> zonal heating change from the longwave radiative transfer update shows a<br />
qualitatively similar pattern in the upper troposphere (P
100<br />
QRLC Zonal mean cross section<br />
0.08<br />
Zonal Mean Residual Heating Difference<br />
0.08<br />
200<br />
0.06<br />
200<br />
0.06<br />
0.04<br />
0.04<br />
Pressure [hPa]<br />
400<br />
600<br />
K day −1 −0.08<br />
0.02<br />
0<br />
−0.02<br />
400<br />
600<br />
K day −1 −0.08<br />
0.02<br />
0<br />
−0.02<br />
800<br />
−0.04<br />
800<br />
−0.04<br />
−0.06<br />
−0.06<br />
1000<br />
−90 −60 −30 0 30 60 90<br />
Latitude<br />
1000<br />
−90 −60 −30 0 30 60 90<br />
Latitude<br />
Figure 6.3 (Left) the zonally-averaged clear sky longwave heating rate change between a control<br />
CESM run (using the default RRTM and MT CKD water vapor continuum model) and an<br />
experimental CESM (using RRTM modified to include a updates to the MT CKD water vapor<br />
continuum based on FIR measurements). (Right) zonally-averaged total heating rate change. <strong>The</strong><br />
total heating rate includes including clear sky longwave and shortwave heating rates, cloud<br />
forcing, latent heating, and heating from subgrid turbulent diffusion parameterizations. <strong>The</strong> total<br />
heating rate change shows that the adjustment to the various model fields (clouds, temperature,<br />
and humidity) tend to reduce the heating rate change introduced by the MT CKD update. Figure<br />
from Turner et al. (2012).
101<br />
• Observations <strong>of</strong> the upwelling FIR spectrum in the presence <strong>of</strong> clouds are needed. Some<br />
limited data does exist for cirrus clouds (Cox et al., 2010), but a larger dataset is needed, for<br />
a wider range <strong>of</strong> cloud conditions. <strong>The</strong> results <strong>of</strong> this dissertation suggest potential benefits<br />
for FIR observations <strong>of</strong> anvil clouds, which would require newly designed field campaigns<br />
targeting these cloud types.<br />
• Of particular importance is better validation <strong>of</strong> the different ice crystal habits within the<br />
single scattering property databases. Observations combining near IR (reflected solar radiation)<br />
and MIR are particularly useful to help constrain habit (Baran and Francis, 2004), and<br />
it would be very informative to repeat similar measurements but combine FIR, MIR, and reflected<br />
solar radiation in the near IR or visible wavelengths. Radiative closure over the entire<br />
thermal and reflected solar wavelength range is needed to produce self consistent scattering<br />
models.<br />
• Measurements <strong>of</strong> FIR surface emissivity are also needed where the microwindows are located.<br />
Even for moderately dry midlatitude atmosphere pr<strong>of</strong>iles, there will be some emission<br />
from the surface. <strong>The</strong>re are no documented observations <strong>of</strong> FIR emissivity other than<br />
the mineral data referenced in this study (Christensen et al., 2000), so it is not known if there<br />
are features due to other natural surfaces (vegetation in particular) that may complicate FIR<br />
retrievals.<br />
Integration within GCMs is extremely important for any updates to FIR radiative transfer. This<br />
is especially important for ice scattering in the FIR, since it is likely to show the largest changes as<br />
our understanding improves.
102<br />
Bibliography<br />
Ackerman, T. P. and G. M. Stokes, 2003: <strong>The</strong> <strong>Atmospheric</strong> Radiation Measurement Program.<br />
Phys. Today, 56 (1), 38–44.<br />
Anderson, G., S. A. Clough, F. X. Kneizys, J. H. Chetwynd, and E. P. Shettle, 1986: AFGL atmospheric<br />
constituent pr<strong>of</strong>iles. Tech. Rep. AFGL-TR-86-110, Air Force Geophysical Laboratory.<br />
Antonelli, P., et al., 2004: A principal component noise filter for high spectral resolution infrared<br />
measurements. J. Geophys. Res., 109 (D23), D23 102, doi:10.1029/2004JD004862.<br />
Atlas, D., 1969: <strong>Atmospheric</strong> exploration by remote probes; final report <strong>of</strong> the panel on remote<br />
atmospheric probing. Tech. rep., National Research Council.<br />
Baran, A. J., 2007: <strong>The</strong> impact <strong>of</strong> cirrus microphysical and macrophysical properties on upwelling<br />
far-infrared spectra. Quart. J. Roy. Meteor. Soc., 133 (627), 1425–1437.<br />
Baran, A. J. and P. N. Francis, 2004: On the radiative properties <strong>of</strong> cirrus cloud at solar and<br />
thermal wavelengths: A test <strong>of</strong> model consistency using high-resolution airborne radiance measurements.<br />
Q.J.R. Meteorol. Soc., 130 (598), 763–778.<br />
Barnes, W., T. Pagano, and V. Salomonson, 1998: Prelaunch characteristics <strong>of</strong> the Moderate Resolution<br />
Imaging Spectroradiometer (MODIS) on EOS-AM1. IEEE Trans. Geosci. Remote Sens.,<br />
36 (4), 1088–1100.<br />
Baum, B. A., P. F. Soulen, K. I. Strabala, M. D. King, S. A. Ackerman, W. P. Menzel, and P. Yang,<br />
2000: Remote sensing <strong>of</strong> cloud properties using MODIS airborne simulator imagery during<br />
SUCCESS 2. cloud thermodynamic phase. J. Geophys. Res., 105 (D9), 11 781–11 792.
103<br />
Baum, B. A., P. Yang, S. Nasiri, A. K. Heidinger, A. Heymsfield, and J. Li, 2007: Bulk scattering<br />
properties for the remote sensing <strong>of</strong> ice clouds. part III: high-resolution spectral models from<br />
100 to 3250 cm-1. J. Appl. Meteor. Climatol., 46 (4), 423–434.<br />
Bianchini, G., L. Palchetti, and B. Carli, 2006: A wide-band nadir-sounding spectroradiometer for<br />
the characterization <strong>of</strong> the earth’s outgoing long-wave radiation. SPIE Proceedings, Vol. 6361,<br />
doi:10.1117/12.689260.<br />
Bingham, G. A., N. S. Pougatchev, M. P. Esplin, W. J. Blackwell, and C. D. Barnet, 2010:<br />
<strong>The</strong> NPOESS cross-track infrared sounder (CrIS) and advanced technology microwave sounder<br />
(ATMS) as a companion to the new generation AIRS/AMSU and IASI/AMSU sounder suites.<br />
6th Annual Symposium on Future National Operational Environmental Satellite Systems-<br />
NPOESS and GOES-R, American Meteorological Society, Atlanta, GA.<br />
Buehler, S. A., et al., 2007: A concept for a satellite mission to measure cloud ice water<br />
path, ice particle size, and cloud altitude. Quart. J. Roy. Meteor. Soc., 133 (2), 109–128, doi:<br />
10.1002/qj.143.<br />
Buehler, S. A., et al., 2012: Observing ice clouds in the submillimeter spectral range: the<br />
CloudIce mission proposal for ESA’s earth explorer 8. Atmos. Meas. Tech., 5 (7), 1529–1549,<br />
doi:10.5194/amt-5-1529-2012.<br />
Cady-Pereira, K. E., M. W. Shephard, D. D. Turner, E. J. Mlawer, S. A. Clough, and T. J. Wagner,<br />
2008: Improved daytime column-integrated precipitable water vapor from vaisala radiosonde<br />
humidity sensors. J. Atmos. Oceanic Technol., 25 (6), 873–883.<br />
Canas, T. A., J. E. Murray, and J. E. Harries, 1997: Tropospheric airborne fourier transform spectrometer<br />
(TAFTS). SPIE Proceedings, Vol. 3220, 91–102, doi:10.1117/12.301139.<br />
Capelle, V., A. Chédin, E. Péquignot, P. Schlüssel, S. M. Newman, and N. A. Scott, 2012: <strong>Infrared</strong><br />
continental surface emissivity spectra and skin temperature retrieved from IASI observations<br />
over the tropics. J. Appl. Meteor. Climatol., doi:10.1175/JAMC-D-11-0145.1.
104<br />
Carissimo, A., I. De Feis, and C. Serio, 2005: <strong>The</strong> physical retrieval methodology<br />
for IASI: the [delta]-IASI code. Environ. Modell. S<strong>of</strong>tware, 20 (9), 1111–1126, doi:<br />
10.1016/j.envs<strong>of</strong>t.2004.07.003.<br />
Chaboureau, J.-P., A. Chédin, and N. A. Scott, 1998: Remote sensing <strong>of</strong> the vertical distribution<br />
<strong>of</strong> atmospheric water vapor from the TOVS observations: Method and validation. J. Geophys.<br />
Res., 103 (D8), 8743–8752, doi:10.1029/98JD00045.<br />
Chahine, M., H. Aumann, and F. Taylor, 1977: Remote sounding <strong>of</strong> cloudy atmospheres. III.<br />
experimental verifications. J. Atmos. Sci., 34 (5), 758–765.<br />
Chahine, M. T., et al., 2006: AIRS: improving weather forecasting and providing new data on<br />
greenhouse gases. Bull. Amer. Meteor. Soc., 87 (7), 911–926, doi:10.1175/BAMS-87-7-911.<br />
Christensen, P. R., J. L. Bandfield, V. E. Hamilton, D. A. Howard, M. D. Lane, J. L. Piatek, S. W.<br />
Ruff, and W. L. Stefanov, 2000: A thermal emission spectral library <strong>of</strong> rock-forming minerals.<br />
J. Geophys. Res., 105 (E4), 9735–9739, doi:10.1029/1998JE000624.<br />
Christensen, P. R., et al., 1992: <strong>The</strong>rmal emission spectrometer experiment: Mars observer mission.<br />
J. Geophys. Res., 97 (E5), 7719–7734, doi:10.1029/92JE00453.<br />
Clough, S., F. Kneizys, and R. Davies, 1989: Line shape and the water vapor continuum. Atm.<br />
Res., 23 (3–4), 229–241, doi:10.1016/0169-8095(89)90020-3.<br />
Clough, S., M. Shephard, E. Mlawer, J. Delamere, M. Iacono, K. Cady-Pereira, S. Boukabara,<br />
and P. Brown, 2005: <strong>Atmospheric</strong> radiative transfer modeling: a summary <strong>of</strong> the AER codes. J.<br />
Quant. Spectrosc. Radiat. Transfer, 91 (2), 233–244, doi:10.1016/j.jqsrt.2004.05.058.<br />
Clough, S. A. and M. J. Iacono, 1995: Line-by-line calculation <strong>of</strong> atmospheric fluxes and cooling<br />
rates 2. application to carbon dioxide, ozone, methane, nitrous oxide and the halocarbons. J.<br />
Geophys. Res., 100 (D8), 16 519–16 535.<br />
Clough, S. A., M. J. Iacono, and J.-L. Moncet, 1992: Line-by-line calculations <strong>of</strong> atmospheric<br />
fluxes and cooling rates: Application to water vapor. 97, 15 761–15 785.
105<br />
Collins, W. D., J. K. Hackney, and D. P. Edwards, 2002: An updated parameterization for infrared<br />
emission and absorption by water vapor in the national center for atmospheric research<br />
community atmosphere model. J. Geophys. Res., 107 (D22), 4664.<br />
Conrath, B. J., R. A. Hanel, V. G. Kunde, and C. Prabhakara, 1970: <strong>The</strong> infrared interferometer<br />
experiment on nimbus 3. J. Geophys. Res., 75 (30), 5831–5857.<br />
Cox, C. V., J. E. Harries, J. P. Taylor, P. D. Green, A. J. Baran, J. C. Pickering, A. E. Last, and<br />
J. Murray, 2010: Measurement and simulation <strong>of</strong> mid- and far-infrared spectra in the presence<br />
<strong>of</strong> cirrus. 136, 718–739.<br />
Cox, C. V., J. E. Murray, J. P. Taylor, P. D. Green, J. C. Pickering, J. E. Harries, and A. E. Last,<br />
2007: Clear-sky far-infrared measurements observed with TAFTS during the EAQUATE campaign,<br />
september 2004. Q.J.R. Meteorol. Soc., 133 (S3), 273–283.<br />
Crevoisier, C., 2012: IASI-New generation onboard EPS-SG: expected impact on accuracy<br />
and vertical resolution for atmospheric variables. International TOVS Study Conference - 18,<br />
Toulouse, France.<br />
Dils, B., et al., 2006: Comparisons between SCIAMACHY and ground-based FTIR data for total<br />
columns <strong>of</strong> CO, CH4, CO2 and N2O. Atmos. Chem. Phys., 6 (7), 1953–1976, doi:10.5194/acp-<br />
6-1953-2006.<br />
Divakarla, M. G., C. D. Barnet, M. D. Goldberg, L. M. McMillin, E. Maddy, W. Wolf, L. Zhou,<br />
and X. Liu, 2006: Validation <strong>of</strong> <strong>Atmospheric</strong> <strong>Infrared</strong> Sounder temperature and water vapor<br />
retrievals with matched radiosonde measurements and forecasts. J. Geophys. Res., 111 (D9),<br />
D09S15, doi:10.1029/2005JD006116.<br />
Downing, H. D. and D. Williams, 1975: Optical constants <strong>of</strong> water in the infrared. J. Geophys.<br />
Res., 80 (12), 1656–1661.
106<br />
Elwell, J. D., et al., 2006: A geosynchronous imaging fourier transform spectrometer (GIFTS) for<br />
hyperspectral atmospheric remote sensing: instrument overview and preliminary performance<br />
results. SPIE Proceedings, Vol. 6297, doi:10.1117/12.684135.<br />
Evans, K. F., S. J. Walter, A. J. Heymsfield, and G. M. Mc<strong>Far</strong>quhar, 2002: Submillimeterwave<br />
cloud ice radiometer: Simulations <strong>of</strong> retrieval algorithm performance. J. Geophys. Res.,<br />
107 (D3), 4028.<br />
Evans, K. F., J. R. Wang, P. E. Racette, G. Heymsfield, and L. Li, 2005: Ice cloud retrievals<br />
and analysis with the compact scanning submillimeter imaging radiometer and the cloud radar<br />
system during CRYSTAL FACE. J. Appl. Meteor., 44 (6), 839–859.<br />
Eyre, J. R., 1989: Inversion <strong>of</strong> cloudy satellite sounding radiances by nonlinear optimal estimation.<br />
II: application to TOVS data. Quart. J. Roy. Meteor. Soc., 115 (489), 1027–1037, doi:<br />
10.1002/qj.49711548903.<br />
Fischer, H., et al., 2008: MIPAS: an instrument for atmospheric and climate research. Atmos.<br />
Chem. Phys., 8 (8), 2151–2188, doi:10.5194/acp-8-2151-2008.<br />
Fu, Q., P. Yang, and W. B. Sun, 1998: An accurate parameterization <strong>of</strong> the infrared radiative<br />
properties <strong>of</strong> cirrus clouds for climate models. J. Climate, 11 (9), 2223–2237, doi:10.1175/1520-<br />
0442(1998)011¡2223:AAPOTI¿2.0.CO;2.<br />
Hanel, R., B. Schlachman, D. Rogers, and D. Vanous, 1971: Nimbus 4 michelson interferometer.<br />
Appl. Opt., 10 (6), 1376–1382.<br />
Hansen, J. E. and L. D. Travis, 1974: Light scattering in planetary atmospheres. Space Sci. Rev.,<br />
16 (4), 527–610, 10.1007/BF00168069.<br />
Harries, J., et al., 2008: <strong>The</strong> far-infrared earth. Rev. Geophys., 46 (4), RG4004.<br />
Hart, C., 2012: Interpretation <strong>of</strong> small particle signatures in satellite observations <strong>of</strong> convective<br />
storms. M.S. thesis, University <strong>of</strong> Wisconsin-Madison.
107<br />
Heidinger, A. K. and M. J. Pavolonis, 2009: Gazing at cirrus clouds for 25 years through a split<br />
window. part i: Methodology. J. Appl. Meteor. Climatol., 48 (6), 1100–1116.<br />
Hilleary, D. T., E. L. Heacock, W. A. Morgan, R. H. Moore, E. C. Mangold, and S. D. Soules, 1966:<br />
Indirect measurements <strong>of</strong> atmospheric temperature pr<strong>of</strong>iles from satellites: III. the spectrometers<br />
and experiments. Mon. Wea. Rev., 94 (6), 367–377.<br />
Hilton, F., N. C. Atkinson, S. J. English, and J. R. Eyre, 2009: Assimilation <strong>of</strong> IASI at the met <strong>of</strong>fice<br />
and assessment <strong>of</strong> its impact through observing system experiments. Quart. J. Roy. Meteor. Soc.,<br />
135 (639), 495–505, doi:10.1002/qj.379.<br />
Hilton, F., et al., 2011: Hyperspectral earth observation from IASI: five years <strong>of</strong> accomplishments.<br />
Bull. Amer. Meteor. Soc., 93 (3), 347–370, doi:10.1175/BAMS-D-11-00027.1.<br />
Huang, H.-L., P. Yang, H. Wei, B. A. Baum, Y. Hu, P. Antonelli, and S. A. Ackerman, 2004: Inference<br />
<strong>of</strong> ice cloud properties from high spectral resolution infrared observations. IEEE Trans.<br />
Geosci. Remote Sens., 42 (4), 842 – 853, doi:10.1109/TGRS.2003.822752.<br />
Inoue, T., 1985: On the temperature and effective emissivity determination <strong>of</strong> semi-transparent<br />
cirrus clouds by bi-spectral measurements in the 10 um window region. J. Meteorol. Soc. Jpn.,<br />
64, 88–99.<br />
John, V. O. and B. J. Soden, 2006: Does convectively-detrained cloud ice enhance water vapor<br />
feedback? Geophys. Res. Lett., 33 (20), L20 701, doi:10.1029/2006GL027260.<br />
Kahn, B. H., S. L. Nasiri, M. M. Schreier, and B. A. Baum, 2011: Impacts <strong>of</strong> subpixel cloud heterogeneity<br />
on infrared thermodynamic phase assessment. J. Geophys. Res., 116 (D20), D20 201,<br />
doi:10.1029/2011JD015774.<br />
Kahn, B. H., et al., 2003: Near micron-sized cirrus cloud particles in high-resolution infrared spectra:<br />
An orographic case study. Geophys. Res. Lett., 30 (8), 1441, doi:10.1029/2003GL016909.<br />
Kaplan, L. D., 1959: Inference <strong>of</strong> atmospheric structure from remote radiation measurements. J.<br />
Opt. Soc. Am., 49 (10), 1004–1006.
108<br />
Knuteson, R. O., F. A. Best, D. H. DeSlover, B. J. Osborne, H. E. Revercomb, and W. L. Smith,<br />
2004a: <strong>Infrared</strong> land surface remote sensing using high spectral resolution aircraft observations.<br />
Adv. Space Res., 33 (7), 1114–1119, doi:10.1016/S0273-1177(03)00752-X.<br />
Knuteson, R. O., et al., 2004b: <strong>Atmospheric</strong> emitted radiance interferometer. part I: instrument<br />
design. J. Atmos. Oceanic Technol., 21 (12), 1763–1776.<br />
Kratz, D. P., 2002: High-resolution modeling <strong>of</strong> the far infrared. Optical Spectroscopic Techniques,<br />
Remote Sensing, and Instrumentation for <strong>Atmospheric</strong> and Space Research IV, A. M. Larar and<br />
M. G. Mlynczak, Eds., SPIE, San Diego, CA, USA, Vol. 4485, 171–180.<br />
Kreisler, A. J. and A. Gaugue, 2000: Recent progress in high-temperature superconductor bolometric<br />
detectors: from the mid-infrared to the far-infrared (THz) range. Supercond. Sci. Technol.,<br />
13 (8), 1235.<br />
Kurucz, R. L., 1992: Synthetic infrared spectra. <strong>Infrared</strong> Solar Physics, Kluwer Academic.<br />
Li, J. and J. Li, 2008: Derivation <strong>of</strong> global hyperspectral resolution surface emissivity spectra<br />
from advanced infrared sounder radiance measurements. Geophys. Res. Lett., 35 (15), L15 807,<br />
doi:10.1029/2008GL034559.<br />
Li, J., et al., 2005: Retrieval <strong>of</strong> cloud microphysical properties from MODIS and AIRS. J. Appl.<br />
Meteor., 44 (10), 1526–1543.<br />
Merrelli, A. and D. D. Turner, 2011: Comparing information content <strong>of</strong> upwelling far-infrared and<br />
midinfrared radiance spectra for clear atmosphere pr<strong>of</strong>iling. J. Atmos. Oceanic Technol., 29 (4),<br />
510–526, doi:10.1175/JTECH-D-11-00113.1.<br />
Mlawer, E. J., V. H. Payne, J.-L. Moncet, J. S. Delamere, M. J. Alvarado, and D. C. Tobin, 2012:<br />
Development and recent evaluation <strong>of</strong> the MT CKD model <strong>of</strong> continuum absorption. Philos.<br />
Trans. R. Soc. London, Ser. A, 370 (1968), 2520–2556, doi:10.1098/rsta.2011.0295.
109<br />
Mlawer, E. J., S. J. Taubman, P. D. Brown, M. J. Iacono, and S. A. Clough, 1997: Radiative transfer<br />
for inhomogeneous atmospheres: RRTM, a validated correlated-k model for the longwave.<br />
102 (D14), 16 663–16 682.<br />
Mlynczak, M., 2010: <strong>Infrared</strong> instrument overview. CLARREO Science Team Meeting, National<br />
Institute <strong>of</strong> Aerospace, Hampton, VA.<br />
Mlynczak, M. G., et al., 2006: First light from the far-infrared spectroscopy <strong>of</strong> the troposphere<br />
(FIRST) instrument. Geophys. Res. Lett., 33.<br />
Nasiri, S. L., H. Van T. Dang, B. H. Kahn, E. J. Fetzer, E. M. Manning, M. M. Schreier, and<br />
R. A. Frey, 2011: Comparing MODIS and AIRS infrared-based cloud retrievals. J. Appl. Meteor.<br />
Climatol., 50 (5), 1057–1072, doi:10.1175/2010JAMC2603.1.<br />
Nordh, H. L., et al., 2003: <strong>The</strong> Odin orbital observatory. Astron. Astrophys., 402, L21–L25, doi:<br />
10.1051/0004-6361:20030334.<br />
Parol, F., J. Buriez, G. Brogniez, and Y. Fouquart, 1991: <strong>Information</strong> content <strong>of</strong> AVHRR channels<br />
4 and 5 with respect to the effective radius <strong>of</strong> cirrus cloud particles. J. Appl. Meteor., 30 (7),<br />
973–984, doi:10.1175/1520-0450-30.7.973.<br />
Petty, G. W. and W. Huang, 2011: <strong>The</strong> modified gamma size distribution applied to inhomogeneous<br />
and nonspherical particles: Key relationships and conversions. J. Atmos. Sci., 68 (7), 1460–1473,<br />
doi:10.1175/2011JAS3645.1.<br />
Purser, R. J. and H.-L. Huang, 1993: Estimating effective data density in a satellite retrieval or an<br />
objective analysis. J. Appl. Meteor., 32 (6), 1092–1107.<br />
Rabier, F., N. Fourrié, D. Chafäi, and P. Prunet, 2002: Channel selection methods for infrared<br />
atmospheric sounding interferometer radiances. Quart. J. Roy. Meteor. Soc., 128 (581), 1011–<br />
1027.
110<br />
Radel, G., C. J. Stubenrauch, R. Holz, and D. L. Mitchell, 2003: Retrieval <strong>of</strong> effective ice crystal<br />
size in the infrared: Sensitivity study and global measurements from TIROS-N operational<br />
vertical sounder. J. Geophys. Res., 108 (D9), 4281, doi:10.1029/2002JD002801.<br />
Rathke, C., J. Fischer, S. Neshyba, and M. Shupe, 2002: Improving IR cloud phase determination<br />
with 20 microns spectral observations. Geophys. Res. Lett., 29 (8), 1209.<br />
Revercomb, H. E., et al., 2003: <strong>The</strong> ARM program’s water vapor intensive observation periods.<br />
Bull. Amer. Meteor. Soc., 84 (2), 217–236, doi:10.1175/BAMS-84-2-217.<br />
Rizzi, R., C. Serio, and R. Amorati, 2002: Sensitivity <strong>of</strong> broadband and spectral measurements <strong>of</strong><br />
outgoing radiance to changes in water vapor content. Optical Spectroscopic Techniques, Remote<br />
Sensing, and Instrumentation for <strong>Atmospheric</strong> and Space Research IV, A. M. Larar and M. G.<br />
Mlynczak, Eds., SPIE, San Diego, CA, USA, Vol. 4485, 181–190.<br />
Rodgers, C. D., 2000: Inverse Methods for <strong>Atmospheric</strong> Sounding, Series on <strong>Atmospheric</strong>, Oceanic<br />
and Planetary Physics, Vol. 2. World Scientific.<br />
Rodgers, C. D., P. B. Hays, and J. Wang, 1996: <strong>Information</strong> content and optimization <strong>of</strong> highspectral-resolution<br />
measurements. Optical Spectroscopic Techniques and Instrumentation for<br />
<strong>Atmospheric</strong> and Space Research II, SPIE, Denver, CO, USA, Vol. 2830, 136–147.<br />
Rothman, L., et al., 2005: <strong>The</strong> HITRAN 2004 molecular spectroscopic database. J. Quant. Spectrosc.<br />
Radiat. Transfer, 96 (2), 139–204, doi:10.1016/j.jqsrt.2004.10.008.<br />
Rothman, L., et al., 2009: <strong>The</strong> HITRAN 2008 molecular spectroscopic database. J. Quant. Spectrosc.<br />
Radiat. Transfer, 110 (9–10), 533–572, doi:10.1016/j.jqsrt.2009.02.013.<br />
Sandford, S. P., et al., 2010: CLARREO: cornerstone <strong>of</strong> the climate observing system measuring<br />
decadal change through accurate emitted infrared and reflected solar spectra and radio occultation.<br />
Sensors, Systems, and Next-Generation Satellites XIV, R. Meynart, S. P. Neeck, and<br />
H. Shimoda, Eds., SPIE, Toulouse, France, Vol. 7826.
111<br />
Schoeberl, M., et al., 2006: Overview <strong>of</strong> the EOS Aura mission. IEEE Trans. Geosci. Remote<br />
Sens., 44 (5), 1066–1074, doi:10.1109/TGRS.2005.861950.<br />
Schwalb, A., 1978: <strong>The</strong> TIROS-N/NOAA A-G satellite series. 75.<br />
Seemann, S. W., E. E. Borbas, R. O. Knuteson, G. R. Stephenson, and H.-L. Huang, 2008: Development<br />
<strong>of</strong> a global infrared land surface emissivity database for application to clear sky sounding<br />
retrievals from multispectral satellite radiance measurements. J. Appl. Meteor., 47 (1), 108–123.<br />
Smith, W. L., D. T. Hilleary, J. C. Fischer, H. B. Howell, and H. M. Woolf, 1974: Nimbus-5 ITPR<br />
experiment. Appl. Opt., 13 (3), 499.<br />
Smith, W. L., H. M. Woolf, and W. J. Jacob, 1970: A regression method for obtaining real-time<br />
temperature and geopotential height pr<strong>of</strong>iles from satellite spectrometer measurements and its<br />
application to numbus 3 ”SIRS” observations. Mon. Wea. Rev., 98 (8), 582–603.<br />
Stamnes, K., S.-C. Tsay, W. Wiscombe, and K. Jayaweera, 1988: Numerically stable algorithm for<br />
discrete-ordinate-method radiative transfer in multiple scattering and emitting layered media.<br />
Appl. Opt., 27 (12), 2502–2509.<br />
Strabala, K. I., S. A. Ackerman, and W. P. Menzel, 1994: Cloud properties inferred from 8-12 µm<br />
data. J. Appl. Meteor., 33 (2), 212–229.<br />
Stubenrauch, C. J., R. Holz, A. Chédin, D. L. Mitchell, and A. J. Baran, 1999: Retrieval <strong>of</strong> cirrus<br />
ice crystal sizes from 8.3 and 11.1 µm emissivities determined by the improved initialization<br />
inversion <strong>of</strong> TIROS-N operational vertical sounder observations. J. Geophys. Res., 104 (D24),<br />
31 793–31 808, doi:10.1029/1999JD900828.<br />
Stuhlmann, R., A. Rodriguez, S. Tjemkes, J. Grandell, A. Arriaga, J.-L. Bézy, D. Aminou, and<br />
P. Bensi, 2005: Plans for EUMETSAT’s third generation meteosat geostationary satellite programme.<br />
Adv. Space Res., 36 (5), 975–981, doi:10.1016/j.asr.2005.03.091.
112<br />
Susskind, J., C. Barnet, and J. Blaisdell, 2003: Retrieval <strong>of</strong> atmospheric and surface parameters<br />
from AIRS/AMSU/HSB data in the presence <strong>of</strong> clouds. IEEE Trans. Geosci. Remote Sens.,<br />
41 (2), 390–409.<br />
Susskind, J., C. Barnet, J. Blaisdell, L. Iredell, F. Keita, L. Kouvaris, G. Molnar, and<br />
M. Chahine, 2006: Accuracy <strong>of</strong> geophysical parameters derived from <strong>Atmospheric</strong> <strong>Infrared</strong><br />
Sounder/Advanced Microwave Sounding Unit as a function <strong>of</strong> fractional cloud cover. J. Geophys.<br />
Res., 111 (D9), journal Article.<br />
Susskind, J., J. Rosenfield, D. Reuter, and M. T. Chahine, 1984: Remote sensing <strong>of</strong> weather and<br />
climate parameters from HIRS2/MSU on TIROS-N. J. Geophys. Res., 89, 4677–4697.<br />
Takahashi, C., S. Ochiai, and M. Suzuki, 2010: Operational retrieval algorithms for JEM/SMILES<br />
level 2 data processing system. J. Quant. Spectrosc. Radiat. Transfer, 111 (1), 160–173, doi:<br />
10.1016/j.jqsrt.2009.06.005.<br />
Turner, D. D., 2005: Arctic mixed-phase cloud properties from AERI lidar observations: Algorithm<br />
and results from SHEBA. J. Appl. Meteor., 44 (4), 427–444.<br />
Turner, D. D. and U. Löhnert, 2012: Retrieved temperature and humidity pr<strong>of</strong>iles from the AERI<br />
during MC3E. <strong>Atmospheric</strong> System Research Science Team Meeting 2012.<br />
Turner, D. D., A. Merrelli, D. Vimont, and E. J. Mlawer, 2012: Impact <strong>of</strong> modifying the longwave<br />
water vapor continuum absorption model on community earth system model simulations. J.<br />
Geophys. Res., 117 (D4), D04 106, doi:10.1029/2011JD016440.<br />
Turner, D. D. and E. J. Mlawer, 2010: <strong>The</strong> radiative heating in underexplored bands campaigns.<br />
Bull. Amer. Meteor. Soc., 91 (7), 911–923.<br />
Turner, D. D., et al., 2004: <strong>The</strong> QME AERI LBLRTM: a closure experiment for downwelling high<br />
spectral resolution infrared radiance. J. Atmos. Sci., 61 (22), 2657–2675.
113<br />
Walther, A. and A. K. Heidinger, 2012: Implementation <strong>of</strong> the daytime cloud optical and microphysical<br />
properties algorithm (DCOMP) in PATMOS-x. J. Appl. Meteor., 51 (7), 1371–1390,<br />
doi:10.1175/JAMC-D-11-0108.1.<br />
Wark, D. Q. and H. E. Fleming, 1966: Indirect measurements <strong>of</strong> atmospheric temperature pr<strong>of</strong>iles<br />
from satellites: I. introduction. Mon. Wea. Rev., 94 (6), 351–362.<br />
Wark, D. Q. and D. T. Hilleary, 1969: <strong>Atmospheric</strong> temperature: Successful test <strong>of</strong> remote probing.<br />
Science, 165 (3899), 1256–1258, doi:10.1126/science.165.3899.1256.<br />
Wark, D. Q., F. Saiedy, and D. G. James, 1967: Indirect measurements <strong>of</strong> atmospheric temperature<br />
pr<strong>of</strong>iles from satellites: VI. high-altitude balloon testing. Mon. Wea. Rev., 95 (7), 468–479.<br />
Warren, S. G. and R. E. Brandt, 2008: Optical constants <strong>of</strong> ice from the ultraviolet to the microwave:<br />
A revised compilation. J. Geophys. Res., 113 (D14), D14 220.<br />
Waters, J., et al., 2006: <strong>The</strong> earth observing system microwave limb sounder (EOS MLS) on the<br />
aura satellite. Geoscience and Remote Sensing, IEEE Transactions on, 44 (5), 1075–1092, doi:<br />
10.1109/TGRS.2006.873771.<br />
Wylie, D. P., W. P. Menzel, H. M. Woolf, and K. I. Strabala, 1994: Four years <strong>of</strong> global cirrus<br />
cloud statistics using HIRS. J. Climate, 7 (12), 1972–1986.<br />
Yang, P., H. Wei, H.-L. Huang, B. A. Baum, Y. X. Hu, G. W. Kattawar, M. I. Mishchenko, and<br />
Q. Fu, 2005: Scattering and absorption property database for nonspherical ice particles in the<br />
near- through far-infrared spectral region. Appl. Opt., 44 (26), 5512–5523.<br />
Yang, P., et al., 2003: Spectral signature <strong>of</strong> ice clouds in the far-infrared region: Single-scattering<br />
calculations and radiative sensitivity study. J. Geophys. Res., 108.<br />
Zhou, D. K., W. L. Smith, X. Liu, A. M. Larar, S. A. Mango, and H.-L. Huang, 2007: Physically<br />
retrieving cloud and thermodynamic parameters from ultraspectral IR measurements. J. Atmos.<br />
Sci., 64 (3), 969–982.
114<br />
Appendix A: List <strong>of</strong> Satellite Instruments<br />
<strong>The</strong> following tables contain a brief summary <strong>of</strong> all satellite instruments mentioned in Chapter<br />
2. References, key specifications (wavenumber coverage, approximate spectral resolution, and<br />
spatial resolution), platforms, and operational dates are listed. <strong>The</strong> comment column lists and<br />
extra information, such as those instruments that are limb sounders, and those that are Fourier<br />
Transform Spectrometers (FTS). For limb sounders, the listed spatial resolution is the width <strong>of</strong> the<br />
beam at the tangent point. <strong>The</strong> number <strong>of</strong> channels listed for an FTS is flexible, since it can change<br />
depending on the processing applied to the raw interferogram. <strong>The</strong> number listed is either the<br />
number used in standard L1 processing, or for the older instruments (e.g., IRIS), just the spectral<br />
coverage divided by the resolution.
115<br />
Table A.1 Satellite instrument acronym list<br />
Acronym Expansion Table<br />
AERI-ER<br />
<strong>Atmospheric</strong> Emitted Radiance Interferometer -<br />
Extended Range<br />
A.4<br />
AIRS <strong>Atmospheric</strong> InfraRed Sounder A.2<br />
AVHRR Advanced Very High Resolution Radiometer A.2<br />
CLARREO CLimate Absolute Radiance and Refractivity Observatory A.4<br />
CrIS Cross-track <strong>Infrared</strong> Sounder A.2<br />
FIRST <strong>Far</strong>-InfraRed Spectroscopy <strong>of</strong> the Troposphere A.4<br />
HIRS High resolution <strong>Infrared</strong> Radiation Sounder (TOVS subsystem) A.2<br />
IASI <strong>Infrared</strong> <strong>Atmospheric</strong> Sounding Interferometer A.2<br />
IASI-NG IASI - New Generation A.2<br />
IRIS InfraRed Interferometer Spectrometer A.2<br />
ITPR <strong>Infrared</strong> Temperature Pr<strong>of</strong>iling Radiometer A.2<br />
MIPAS Michelson Interferometer for Passive <strong>Atmospheric</strong> Sounding A.2<br />
MLS Microwave Limb Sounder A.3<br />
MODIS MODerate resolution Imaging Spectrometer A.2<br />
REFIR Radiation Explorer in the <strong>Far</strong>-InfraRed A.4<br />
SIRS Satellite InfraRed Spectrometer A.2<br />
SMILES Superconducting subMIllimeter-wave Limb Emission Sounder A.3<br />
SMR SubMillimeter Radiometer A.3<br />
TAFTS Tropospheric Airborne Fourier Transform Spectrometer A.4<br />
TOVS TIROS-N Operational Vertical Sounding system A.2
Table A.2 <strong>Infrared</strong> Satellite Instrument list<br />
Instrument Satellite Launch Wavenumber Approx. spec. Num <strong>of</strong> Spatial Comments Ref.<br />
Year coverage [cm −1 ] res. [cm −1 ] spec. chan. res. [km]<br />
SIRS Nimbus 3 1969 670–900 5 7 225 Wark and Hilleary (1969)<br />
IRIS-B Nimbus 3 1969 400–2000 5 320 150 FTS Conrath et al. (1970)<br />
IRIS-D Nimbus 4 1970 400–1600 2.8 420 95 FTS Hanel et al. (1971)<br />
ITPR Nimbus 5 1972 540–2900 5–400 5 20 Smith et al. (1974)<br />
HIRS<br />
Nimbus 6,<br />
TIROS-N<br />
1975 685–2700 3–100 19 17 Schwalb (1978)<br />
AVHRR TIROS-N 1978 800, 900, 2650 75, 300 3 1 Schwalb (1978)<br />
MODIS Aqua, Terra 1999 700–2700 15–150 16 1 Barnes et al. (1998)<br />
MIPAS EnviSat 2002 685–2410 0.025 50,000 30 FTS, Limb Fischer et al. (2008)<br />
AIRS Aqua 2002 650–2665 0.4–2.1 2378 13.5 Chahine et al. (2006)<br />
IASI MetOp-A 2006 645–2760 0.5 8461 12 FTS Hilton et al. (2011)<br />
CrIS Suomi-NPP 2011 650–2550 0.625 1305 14 FTS Bingham et al. (2010)<br />
IASI-NG EPS-SG 2020 645–2760 0.25 16921 12 FTS Crevoisier (2012)<br />
116
Table A.3 Submillimeter Satellite Instrument list<br />
Instrument Satellite Launch Frequency Approx. spec. Num <strong>of</strong> Spatial Comments Ref.<br />
Year coverage [GHz] res. [MHz] spec. chan. res. [km]<br />
SMR Odin 2001 486–581 0.1–1 ∼1000 ? Limb scanner Nordh et al. (2003)<br />
MLS Aura 2004 118–2250 0.2–500 728 2−12 Limb scanner Waters et al. (2006)<br />
SMILES ISS 2009 624–650 1.8 3456 ? Limb scanner Takahashi et al. (2010)<br />
117
Table A.4 <strong>Far</strong> <strong>Infrared</strong> instrument list<br />
Instrument Frequency Approx. spec. Num <strong>of</strong> Comments Ref.<br />
coverage [cm −1 ] res. [cm −1 ] spec. chan.<br />
AERI-ER 400–2400 0.5 2000 FTS, cooled photoelectric detector Knuteson et al. (2004b)<br />
CLARREO 200–2000 0.5 3600 FTS Sandford et al. (2010)<br />
FIRST 50–2000 0.625 FTS, cooled bolometer detector Mlynczak et al. (2006)<br />
REFIR 100–1400 0.5 2600 FTS, room temperature pyroelectric detector Bianchini et al. (2006)<br />
TAFTS 100–600 0.12 FTS, cryogenic photoelectric detectors Canas et al. (1997)<br />
118
119<br />
Appendix B: IWP derivatives<br />
<strong>The</strong> equation relating the IWP error to the posterior error covariance 5.14 requires the derivatives<br />
<strong>of</strong> the IWP with respect to the retrieved state variables. <strong>The</strong> alternative form <strong>of</strong> the gamma<br />
PSD 5.5 and the IWP equation 5.13 are reproduced here for clarity:<br />
N(r) =<br />
N 0<br />
(r 0 σ) 1−2σ<br />
σ Γ ( 1−2σ<br />
σ<br />
) r<br />
1−3σ<br />
σ e − r<br />
σr 0<br />
(B.1)<br />
<strong>The</strong> required derivative is:<br />
I = 1 2 ρ iτ<br />
∫ r2<br />
r 1<br />
V(r)N(r;r 0 ,σ)dr<br />
∫ r2<br />
r 1<br />
A(r)N(r;r 0 ,σ)dr<br />
(B.2)<br />
[ ∂IWP<br />
K I = , ∂IWP<br />
∂τ ∂σ , ∂IWP ]<br />
∂r 0<br />
(B.3)<br />
It is convenient to express this derivative by first calculating the derivatives <strong>of</strong> the PDF function<br />
n(r;r 0 ,σ) with respect to the two PDF parameters,r 0 and σ:<br />
∂n(r;σ,r 0 )<br />
= n(r;σ,r 0 )<br />
∂r 0<br />
∂n(r;σ,r 0 )<br />
∂σ<br />
[ ] r 1<br />
+2σ −1<br />
r 0 σr 0<br />
= n(r;σ,r 0 ) 1 σ 2 [ 1<br />
r 0<br />
(r −r 0 ln<br />
( )) ( r 1−2σ<br />
+ψ 0<br />
σr 0 σ<br />
)<br />
]<br />
+2σ −1<br />
(B.4)<br />
(B.5)<br />
<strong>The</strong> function ψ 0 (x) is the 0-order polygamma function, also known as the digamma function.<br />
It is equal to the first derivative <strong>of</strong> the logarithm <strong>of</strong> the gamma function.<br />
<strong>The</strong> IWP derivatives can then be written in terms <strong>of</strong> the twonderivatives. In these expressions,<br />
the arguments <strong>of</strong>nare omitted for brevity, meaningnin these equations represents n(r;r 0 ,σ):
120<br />
∂IWP<br />
∂τ<br />
∂IWP<br />
∂σ<br />
∂IWP<br />
∂r 0<br />
= IWP<br />
τ<br />
= ρ iτ<br />
2<br />
= ρ iτ<br />
2<br />
∫ ∂n<br />
∂σ V(r)dr ∫<br />
∫ ∫ ∂n<br />
V(r)dr<br />
∂r 0<br />
(B.6)<br />
∫ ∫ ∂n<br />
nA(r)dr−<br />
∂σ A(r)dr nV(r)dr<br />
(∫ ) 2<br />
(B.7)<br />
nA(r)dr<br />
∫ ∫ ∂n<br />
nA(r)dr− A(r)dr nV(r)dr<br />
∂r 0<br />
(∫ ) 2<br />
(B.8)<br />
nA(r)dr<br />
<strong>The</strong> description <strong>of</strong> V(r) and A(r) in the Yang et al. (2005) database are vectors <strong>of</strong> values<br />
computed at the particle size grid values. Since not all particle descriptions have fixed power law<br />
relationships for the volume-size relationship (see figure 5.1), the array <strong>of</strong> pre-computed values<br />
must be used. <strong>The</strong> IWP derivatives must be computed numerically for this reason.