Evaluation of Analytical Methods for EDCs and PPCPs Via ...
Evaluation of Analytical Methods for EDCs and PPCPs Via ...
Evaluation of Analytical Methods for EDCs and PPCPs Via ...
You also want an ePaper? Increase the reach of your titles
YUMPU automatically turns print PDFs into web optimized ePapers that Google loves.
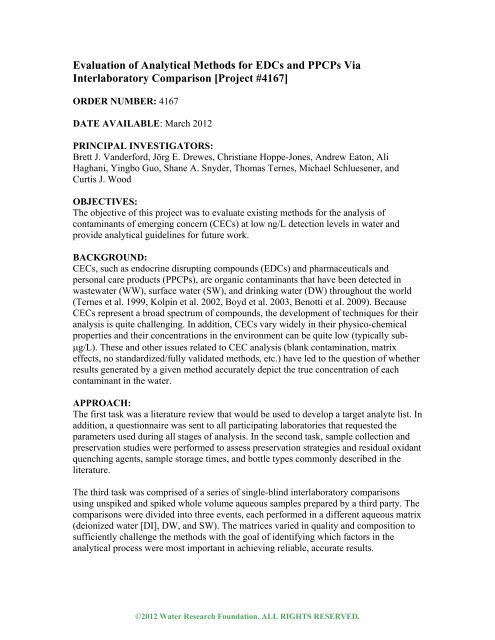
<strong>Evaluation</strong> <strong>of</strong> <strong>Analytical</strong> <strong>Methods</strong> <strong>for</strong> <strong>EDCs</strong> <strong>and</strong> <strong>PPCPs</strong> <strong>Via</strong><br />
Interlaboratory Comparison [Project #4167]<br />
ORDER NUMBER: 4167<br />
DATE AVAILABLE: March 2012<br />
PRINCIPAL INVESTIGATORS:<br />
Brett J. V<strong>and</strong>er<strong>for</strong>d, Jörg E. Drewes, Christiane Hoppe-Jones, Andrew Eaton, Ali<br />
Haghani, Yingbo Guo, Shane A. Snyder, Thomas Ternes, Michael Schluesener, <strong>and</strong><br />
Curtis J. Wood<br />
OBJECTIVES:<br />
The objective <strong>of</strong> this project was to evaluate existing methods <strong>for</strong> the analysis <strong>of</strong><br />
contaminants <strong>of</strong> emerging concern (CECs) at low ng/L detection levels in water <strong>and</strong><br />
provide analytical guidelines <strong>for</strong> future work.<br />
BACKGROUND:<br />
CECs, such as endocrine disrupting compounds (<strong>EDCs</strong>) <strong>and</strong> pharmaceuticals <strong>and</strong><br />
personal care products (<strong>PPCPs</strong>), are organic contaminants that have been detected in<br />
wastewater (WW), surface water (SW), <strong>and</strong> drinking water (DW) throughout the world<br />
(Ternes et al. 1999, Kolpin et al. 2002, Boyd et al. 2003, Benotti et al. 2009). Because<br />
CECs represent a broad spectrum <strong>of</strong> compounds, the development <strong>of</strong> techniques <strong>for</strong> their<br />
analysis is quite challenging. In addition, CECs vary widely in their physico-chemical<br />
properties <strong>and</strong> their concentrations in the environment can be quite low (typically sub-<br />
g/L). These <strong>and</strong> other issues related to CEC analysis (blank contamination, matrix<br />
effects, no st<strong>and</strong>ardized/fully validated methods, etc.) have led to the question <strong>of</strong> whether<br />
results generated by a given method accurately depict the true concentration <strong>of</strong> each<br />
contaminant in the water.<br />
APPROACH:<br />
The first task was a literature review that would be used to develop a target analyte list. In<br />
addition, a questionnaire was sent to all participating laboratories that requested the<br />
parameters used during all stages <strong>of</strong> analysis. In the second task, sample collection <strong>and</strong><br />
preservation studies were per<strong>for</strong>med to assess preservation strategies <strong>and</strong> residual oxidant<br />
quenching agents, sample storage times, <strong>and</strong> bottle types commonly described in the<br />
literature.<br />
The third task was comprised <strong>of</strong> a series <strong>of</strong> single-blind interlaboratory comparisons<br />
using unspiked <strong>and</strong> spiked whole volume aqueous samples prepared by a third party. The<br />
comparisons were divided into three events, each per<strong>for</strong>med in a different aqueous matrix<br />
(deionized water [DI], DW, <strong>and</strong> SW). The matrices varied in quality <strong>and</strong> composition to<br />
sufficiently challenge the methods with the goal <strong>of</strong> identifying which factors in the<br />
analytical process were most important in achieving reliable, accurate results.<br />
©2012 Water Research Foundation. ALL RIGHTS RESERVED.
The fourth task involved the selection <strong>and</strong> validation <strong>of</strong> the most promising sampling<br />
parameters <strong>and</strong> analytical methodologies from the sample collection/preservation studies<br />
<strong>and</strong> the interlaboratory comparisons. The validation was accomplished with initial<br />
demonstrations <strong>of</strong> capability (IDCs), showing accuracy <strong>and</strong> precision in DI <strong>and</strong> DW, <strong>and</strong><br />
a lowest concentration minimum reporting level (LCMRL) study <strong>for</strong> each analyte to<br />
determine RLs across multiple laboratories. The results <strong>of</strong> the study were then<br />
summarized to provide guidance <strong>for</strong> utilities <strong>and</strong> analytical laboratories on the analysis <strong>of</strong><br />
CECs in water.<br />
RESULTS/CONCLUSIONS:<br />
Twenty two target compounds were selected based on the consideration <strong>of</strong> a number <strong>of</strong><br />
factors (physicochemical properties, degree <strong>of</strong> use/sales, published occurrence <strong>and</strong> fate<br />
both in the environment <strong>and</strong> during DW treatment, etc.). The target compounds included<br />
acetaminophen, bisphenol A (BPA), caffeine, carbamazepine, cipr<strong>of</strong>loxacin, dicl<strong>of</strong>enac,<br />
erythromycin, 17β-estradiol (E2), estrone (E1), 17α-ethynylestradiol (EE2), fluoxetine,<br />
gemfibrozil, ibupr<strong>of</strong>en, naproxen, 4-nonylphenol (NP), 4-tert-octylphenol (OP),<br />
primidone, progesterone, sulfamethoxazole, testosterone, triclosan, <strong>and</strong> trimethoprim.<br />
Sample collection/preservation studies<br />
Of the bottle types tested, unsilanized amber glass bottles had the least impact on the<br />
target analytes. As many <strong>of</strong> the target compounds showed poor recoveries in high density<br />
polyethylene (HDPE) bottles, caution is advised when using these bottles to sample<br />
CECs. Three residual oxidant quenching agents were evaluated: ascorbic acid, sodium<br />
thiosulfate, <strong>and</strong> sodium sulfite. The majority <strong>of</strong> the target compounds were compatible<br />
with all <strong>of</strong> the quenching agents. Since ascorbic acid showed the least interaction, its use<br />
is supported <strong>for</strong> the target analytes.<br />
Various combinations <strong>of</strong> temperature, pH, <strong>and</strong> chemical compounds were investigated as<br />
preservation agents. The optimal preservation conditions were found to be compound<br />
dependent; however, a preservation scheme <strong>of</strong> sodium azide <strong>and</strong> storage at 4°C was<br />
found to have the least impact on the target compounds. In addition, sodium omadine was<br />
shown to be a suitable alternative to sodium azide <strong>for</strong> many <strong>of</strong> the target analytes. A<br />
holding time <strong>of</strong> 28 days <strong>for</strong> SW <strong>and</strong> DW was demonstrated <strong>for</strong> sodium azide with storage<br />
at 4°C <strong>for</strong> the majority <strong>of</strong> the target compounds. A holding time <strong>of</strong> 72 hours with storage<br />
at 4°C <strong>and</strong> no chemical preservatives was also investigated <strong>and</strong> showed promising results<br />
<strong>for</strong> many <strong>of</strong> the compounds.<br />
Interlaboratory comparisons<br />
Twenty-five laboratories participated in the three interlaboratory comparisons, using a<br />
total <strong>of</strong> 51 methods. The comparisons included representatives <strong>of</strong> the following types <strong>of</strong><br />
samples <strong>for</strong> every analyte: laboratory reagent blanks (LRBs), low level laboratory<br />
<strong>for</strong>tified blanks (LFBs), high level LFBs, <strong>and</strong>/or low <strong>and</strong> high level laboratory <strong>for</strong>tified<br />
sample matrices (LFSMs). The target compounds were r<strong>and</strong>omly placed into three<br />
separate groups <strong>and</strong> spiked, meaning that there were no samples that were exclusively<br />
©2012 Water Research Foundation. ALL RIGHTS RESERVED.
one type, but every analyte had a representative <strong>of</strong> each type <strong>of</strong> sample in the<br />
comparison.<br />
For the low spikes, concentrations were set at environmentally relevant levels, while still<br />
maintaining a sufficient number <strong>of</strong> laboratories that could analyze each compound. As<br />
there were no widely accepted levels <strong>of</strong> the compounds that were considered harmful to<br />
human health <strong>and</strong> no regulatory basis <strong>for</strong> the RLs <strong>of</strong> the compounds, it was decided to<br />
choose spike amounts that would allow 75% <strong>of</strong> the laboratories to analyze the low level<br />
spike. The high spikes were set at approximately 5–25 times the concentration <strong>of</strong> the low<br />
spikes.<br />
Interlaboratory consensus<br />
The percent relative st<strong>and</strong>ard deviation (%RSD) was calculated <strong>for</strong> each target compound<br />
from the results <strong>of</strong> the interlaboratory comparisons <strong>and</strong>, overall, %RSDs were compound<br />
dependent with the majority <strong>of</strong> compounds having %RSDs in the 20–30% range after<br />
outliers were removed. Even with outliers removed, six compounds had %RSDs > 30%,<br />
three <strong>of</strong> which (cipr<strong>of</strong>loxacin, NP, <strong>and</strong> OP) were ≥ 50%. With outliers included, the<br />
%RSDs <strong>of</strong> all target compounds were > 25% <strong>and</strong> half were > 40%, showing the presence<br />
<strong>of</strong> extreme outliers <strong>and</strong> highlighting the need <strong>for</strong> the st<strong>and</strong>ardization <strong>of</strong> methods <strong>for</strong> all<br />
target compounds.<br />
A notable trend in the data was the higher %RSDs exhibited by nine compounds<br />
(cipr<strong>of</strong>loxacin, erythromycin, E1, fluoxetine, gemfibrozil, ibupr<strong>of</strong>en, naproxen,<br />
primidone, <strong>and</strong> trimethoprim) in the first comparison relative to the second <strong>and</strong> third.<br />
This is most likely due to the use <strong>of</strong> st<strong>and</strong>ardized materials after the first comparison. The<br />
large decrease in %RSD <strong>for</strong> some compounds suggests that they may degrade easily or<br />
the methods <strong>of</strong> st<strong>and</strong>ard preparation may vary from laboratory to laboratory.<br />
False positives <strong>and</strong> false negatives<br />
Most compounds showed false positive rates <strong>of</strong> < 10% <strong>and</strong> did not demonstrate the need<br />
<strong>for</strong> RL adjustments based on blank contamination or misidentification <strong>of</strong> background<br />
interferences. However, six compounds did have false positive rates ≥ 10% (BPA,<br />
caffeine, cipr<strong>of</strong>loxacin, NP, OP, <strong>and</strong> triclosan). Most <strong>of</strong> the compounds had false<br />
negative rates <strong>of</strong> < 10% with only three compounds having false negative rates ≥ 10%<br />
(cipr<strong>of</strong>loxacin, EE2, <strong>and</strong> NP). In most cases, false negatives were the result <strong>of</strong> only a few<br />
methods reporting RL in the low spike samples, the high<br />
spike samples, or both.<br />
Individual compound analysis<br />
The results <strong>of</strong> all three comparisons were collectively assessed on a compound by<br />
compound basis <strong>and</strong> the techniques <strong>of</strong> choice <strong>for</strong> the detection <strong>and</strong> quantification <strong>of</strong> the<br />
target compounds were overwhelmingly identified as LC-MS/MS <strong>and</strong> isotope dilution<br />
(ID), respectively. A combination <strong>of</strong> the two was recommended <strong>for</strong> 18 <strong>of</strong> the 22<br />
©2012 Water Research Foundation. ALL RIGHTS RESERVED.
compounds. No conclusions could be made <strong>for</strong> three compounds (cipr<strong>of</strong>loxacin, NP, OP).<br />
Based on the analytical difficulty demonstrated here, it is recommended that these<br />
compounds be analyzed by experienced laboratory personnel.<br />
Method analysis<br />
In addition to compound analysis, individual method per<strong>for</strong>mance was studied. The target<br />
compounds were divided into three groups (<strong>PPCPs</strong>, steroids, <strong>and</strong> NP/OP) <strong>and</strong> each<br />
laboratory’s methods were assigned to one <strong>of</strong> those groups. For each method in each<br />
group, a number <strong>of</strong> factors were considered to identify the best overall method.<br />
<strong>PPCPs</strong>. Four methods <strong>for</strong> <strong>PPCPs</strong> had overall median average absolute biases (MAABs) ≤<br />
10% <strong>and</strong> 13 <strong>of</strong> 23 methods had overall MAABs < 20%. Four methods had overall<br />
MAABs > 30%, including two methods with overall MAABs <strong>of</strong> 64% <strong>and</strong> 73%. The high<br />
MAABs <strong>for</strong> some methods indicate that there may be methods currently in use that<br />
cannot accurately quantify many <strong>of</strong> the target compounds. This also suggests that<br />
comparisons <strong>of</strong> data generated at different laboratories should be done with caution.<br />
Method 18CD showed low rates <strong>of</strong> false positives/negatives, analyzed most <strong>of</strong> the target<br />
compounds, <strong>and</strong> had low levels <strong>of</strong> AAB throughout the interlaboratory comparisons. In<br />
addition, this method had an overall MAAB < 10%. There<strong>for</strong>e, method 18CD was<br />
selected <strong>for</strong> validation. This method used LC-ESI-MS/MS <strong>for</strong> analysis <strong>and</strong> ID <strong>for</strong><br />
quantification.<br />
Steroids. Several <strong>of</strong> the methods were able to accurately quantify all five steroids, as<br />
three methods had overall MAABs < 10% <strong>and</strong> seven were < 20%. All <strong>of</strong> the methods<br />
used LC-MS/MS <strong>for</strong> detection, with one exception, suggesting that this technique is<br />
appropriate <strong>for</strong> steroid analysis. Six <strong>of</strong> the seven methods with the least average MAABs<br />
used ID, suggesting this procedure may be the most accurate means <strong>of</strong> calibration.<br />
As method 14B had a low overall MAAB, all AABs ≤ 15%, RLs ≤ 1.0 ng/L, <strong>and</strong> no false<br />
positives/negatives, it was selected <strong>for</strong> validation. This method uses LC-ESI-MS/MS <strong>and</strong><br />
ID <strong>for</strong> analysis <strong>and</strong> quantification, respectively. However, as the USEPA had already<br />
published EPA Method 539, method 14B was not carried through the validation process.<br />
NP/OP. Only eight methods analyzed NP/OP in two <strong>of</strong> the three comparisons <strong>and</strong> all had<br />
an overall MAAB > 40%. Much <strong>of</strong> the inconsistency was the result <strong>of</strong> blank<br />
contamination that affected NP/OP in the second <strong>and</strong> third comparisons, making accurate<br />
determinations <strong>of</strong> NP/OP very difficult. As even the top three methods did not provide an<br />
analysis technique that was able to accurately quantify NP/OP in all three matrices at all<br />
spike levels, a method <strong>for</strong> them was not carried through the validation process.<br />
Method validation<br />
Method 18CD was implemented in a total <strong>of</strong> six laboratories. The method validation<br />
followed protocols that the USEPA used <strong>for</strong> the validation <strong>of</strong> USEPA Method 539, which<br />
©2012 Water Research Foundation. ALL RIGHTS RESERVED.
equired (1) an initial demonstration <strong>of</strong> capability <strong>for</strong> low system background <strong>and</strong><br />
acceptable accuracy <strong>and</strong> precision, <strong>and</strong> (2) the determination <strong>of</strong> LCMRLs.<br />
Initial demonstration <strong>of</strong> capability (IDC)<br />
All laboratories were able to demonstrate low system background <strong>and</strong>, with only two<br />
exceptions, %RSDs calculated from LFBs <strong>and</strong> LFSMs <strong>for</strong> every compound were ≤ 10%<br />
in DI <strong>and</strong> DW, indicating a high level <strong>of</strong> precision in these matrices. The same set <strong>of</strong><br />
replicate data was used to calculate average percent recoveries <strong>of</strong> the compounds to<br />
evaluate the accuracy <strong>of</strong> the method. With the exception <strong>of</strong> one laboratory <strong>for</strong> one<br />
compound, all mean recoveries were between 90–120%. There<strong>for</strong>e, it is expected that<br />
this method will provide similar LFSM recoveries <strong>for</strong> DI <strong>and</strong> most DW matrices in the<br />
mid-level calibration range.<br />
Determination <strong>of</strong> LCMRLs<br />
The LCMRL method was chosen <strong>for</strong> this study because <strong>of</strong> its use <strong>of</strong> both precision <strong>and</strong><br />
accuracy <strong>and</strong> because it has been recently adopted by the USEPA. Five laboratories<br />
participated in the LCMRL determination. Overall, the LCMRLs from the laboratories<br />
were similar <strong>and</strong> were determined to be at low ng/L levels. The maximum LCMRL <strong>for</strong><br />
most compounds was < 10 ng/L, indicating that this method would be expected to yield <<br />
20 ng/L RLs <strong>for</strong> all target compounds in most laboratories.<br />
APPLICATIONS/RECOMMENDATIONS<br />
Quality assurance/quality control (QA/QC) recommendations<br />
Accuracy<br />
It is recommended that frequent LFSMs be per<strong>for</strong>med to determine the analytical<br />
accuracy in each matrix. In addition, control limits should be determined <strong>for</strong> each<br />
compound individually due to the compound dependent variations seen in the<br />
interlaboratory comparisons. LFSMs should be per<strong>for</strong>med at both low <strong>and</strong> high levels<br />
relative to the RLs <strong>of</strong> the method <strong>and</strong> the expected concentrations in the samples. A<br />
higher degree <strong>of</strong> bias was observed at low spike levels, so testing at those levels is<br />
strongly encouraged.<br />
As shown in the final method validation <strong>for</strong> the <strong>PPCPs</strong> studied in this project, average<br />
LFSM recoveries in both matrices <strong>for</strong> these compounds were between 90–120%. This<br />
indicates that LFSM recoveries can be obtained <strong>for</strong> many <strong>of</strong> the CECs in drinking water<br />
at ng/L levels. As such, it is recommended that methods <strong>for</strong> these compounds be able to<br />
demonstrate that they can achieve these recoveries be<strong>for</strong>e any samples are collected.<br />
As discussed above, the st<strong>and</strong>ardization <strong>of</strong> solutions had a significant impact on the<br />
outcome <strong>of</strong> the interlaboratory comparisons. Cipr<strong>of</strong>loxacin, erythromycin, E1, fluoxetine,<br />
gemfibrozil, ibupr<strong>of</strong>en, naproxen, primidone, <strong>and</strong> trimethoprim displayed > 25%<br />
©2012 Water Research Foundation. ALL RIGHTS RESERVED.
eductions in %RSD from the first to the second comparison after st<strong>and</strong>ardized solutions<br />
were used. The large decrease in %RSD <strong>for</strong> some compounds suggests that they may<br />
degrade easily <strong>and</strong> be more unstable than the others. There<strong>for</strong>e, it is recommended that<br />
st<strong>and</strong>ards <strong>of</strong> these compounds are frequently checked <strong>for</strong> accuracy <strong>and</strong> freshly prepared<br />
on a regular basis.<br />
Precision<br />
It is recommended that frequent replicates be per<strong>for</strong>med to determine the analytical<br />
precision in each matrix. Most <strong>of</strong> the target compounds showed average %RSDs > 20%<br />
overall; however, during the method validation, it was shown <strong>for</strong> <strong>PPCPs</strong> that %RSDs <<br />
10% were attainable using a single method in multiple laboratories. Accordingly, it is<br />
realistic to expect methods <strong>for</strong> these compounds to produce %RSDs < 10% in drinking<br />
water. On the other h<strong>and</strong>, methods <strong>for</strong> NP/OP were found to be highly variable, in part<br />
due to frequent blank contamination. <strong>Methods</strong> <strong>for</strong> these compounds should be thoroughly<br />
assessed in terms <strong>of</strong> precision to ensure that reproducible results can be obtained.<br />
Blanks<br />
As false positives were recorded <strong>for</strong> all but one <strong>of</strong> the target compounds, it is highly<br />
recommended that frequent laboratory, travel, <strong>and</strong> field blanks be incorporated into any<br />
sampling campaign <strong>for</strong> these compounds to monitor contamination. This is especially<br />
true <strong>for</strong> BPA, caffeine, cipr<strong>of</strong>loxacin, NP, OP, <strong>and</strong> triclosan, which showed relatively<br />
high false positive rates during the interlaboratory comparisons. Reporting limits should<br />
be assessed in terms <strong>of</strong> observed contamination <strong>and</strong> false positive rates <strong>and</strong> adjusted<br />
accordingly.<br />
Reporting limits<br />
False negatives were frequently observed <strong>for</strong> many <strong>of</strong> the target compounds, especially<br />
the steroids. It is there<strong>for</strong>e recommended that <strong>for</strong>mal RL determinations using established<br />
protocols be conducted to help ensure the reliability <strong>of</strong> the RLs used <strong>for</strong> any project<br />
involving these compounds. In addition, LFBs <strong>and</strong> LFSMs near the RLs should be<br />
analyzed when a method <strong>for</strong> these compounds is established <strong>and</strong> at regular intervals<br />
thereafter to verify their validity in the matrices being tested.<br />
MULTIMEDIA:<br />
This report includes a CD-ROM that contains the following material:<br />
A summary <strong>of</strong> the methods found in the literature review<br />
Summaries <strong>of</strong> questionnaire responses <strong>for</strong> each laboratory/method<br />
Detailed analysis <strong>of</strong> each compound <strong>for</strong> each interlaboratory comparison<br />
Master data spreadsheets containing raw data from all three interlaboratory<br />
comparisons<br />
SOP <strong>of</strong> method 18CD that was validated during the project<br />
This material is also available on the 4167 project page under Web tools.<br />
©2012 Water Research Foundation. ALL RIGHTS RESERVED.


