Prediction of batch heat transfer coefficients for pseudoplastic fluids ...
Prediction of batch heat transfer coefficients for pseudoplastic fluids ... Prediction of batch heat transfer coefficients for pseudoplastic fluids ...
120 greater than 2.0. In this case therefore there is a 90% probability that the difference in variance between correlation A ~nd C is significant. Thus correlation C is a better fit for the anchor data. It may be seen from this example that in order for a correlation to be significantly better than another the ratio of the variances must be about 1 • .5 or gl"eatel", depending upon the degrees of freedom and choice of probability limits desired.. Comparison of the variances listed in Table 5-7 shows that the above eXELmple was the only case in Hhich one correlation 1-laS significantly better than another for all of the fluids tested. Thus, except for the anchor agitator, the three correlations fit the data equally v.Jell.. It l
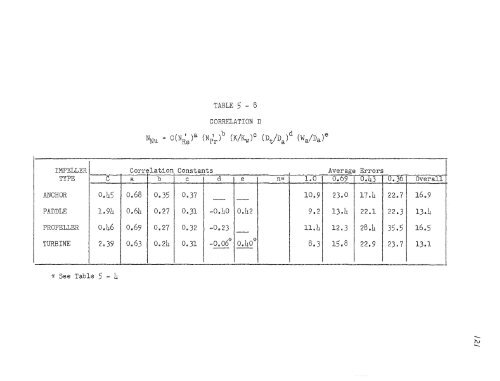
TABLE 5 - 8 NNu '" C(N~e)a CORRELATION D (Npr)b (K/Kw)C (Dt/Da)d (Wa/Da)e IMPELLER Correlation Constants Average Errors TYPE C a b c d e n= l.0 0.69 0.43 0.36 Overall ltNCHOR 0.45 0.68 0.35 0.37 10.9 23.0 17.4 22.7 16 .. 9 - - PADDLE 1.94 0.64 0.27 0.31 -0.40 0.42 9.2 13.4 22.1 22.3 13e4 PROPELLER 0.!.~6 0.69 0.27 0.32 -0.23 11.4 12.3 2B.h 35.5 16.5 TURBINE 2.39 0.63 0.24 0.31 -0.06* - O~ O.hOn B.3 15.8 22.9 23.7 13.1 .,l- See Table 5 - 4 -1\) --
- Page 81 and 82: 69 The average heat transfer coeffi
- Page 83 and 84: N"v = C Iv''' (;';~-"')&'i'~ (%t-n,
- Page 85 and 86: 73 Semi-Empirical Correlation i ..,
- Page 87 and 88: 75 7I1C1?/lfOCOUPLc .JuNe T/ON IMBE
- Page 89 and 90: 77 _I"---- / SCALE I ~~, .5 j t /Z.
- Page 91 and 92: also cop~ected to the pipes leading
- Page 93 and 94: 81 Ve8sel :J all th:l c]me 8 8 .) '
- Page 95 and 96: 83 potentiometer for varing the mot
- Page 97 and 98: 85 MATERIAL 7:0 STAIIJLESS STEEL /
- Page 99 and 100: 11 Wa.ll (Mi€1dl~) Same as #5 81
- Page 101 and 102: 89 shea.r ra.tes, tl?1ey a.re unaff
- Page 103: and if' lO"V'l$' a sm.all amount of
- Page 106 and 107: 94- was about 40-45 ndmutes .. Tke
- Page 108 and 109: 96 vThere N is in rev./sec .. and S
- Page 110 and 111: 88 ql\fETI A = 6 T \--T -s L/kw (1+
- Page 112 and 113: I {)D The generalized Reynolds n~mb
- Page 114 and 115: 02. CHAPTER !2. RESUI,TS Many heat
- Page 116 and 117: 01 TABLE 5-2 sutn~U{Y OF ADDITIONAL
- Page 118 and 119: 108 the batch than the other ticJO
- Page 120 and 121: 108 optimum impeller heights were u
- Page 122 and 123: 10 I r "'" , •• ,'., "",' """",
- Page 124 and 125: 112 correlations for the prediction
- Page 126 and 127: TABLE 5 - 4 Correlation Constants A
- Page 128 and 129: 1/6 Table 5-5 and 5-6. A measure of
- Page 130 and 131: TABLE S - 6 IMPELLER Correlation Co
- Page 134 and 135: 12.2
- Page 136 and 137: TABLE 5 - 9 CORRELATION E t (a/n +1
- Page 138 and 139: TABLE 5 - 10 IMPELLER Correlation C
- Page 140 and 141: TABLE 5 - 11 CORRELATION G (1.30/61
- Page 142 and 143: 1.30 of the substantial improvement
- Page 144 and 145: 1.3 2. The probable error in the ca
- Page 146 and 147: 134 .,;' : :: :::: : ~ !~. , " . .'
- Page 148 and 149: T." ••••••• ,_ .....
- Page 150 and 151: 38 the cooling of nitration liquors
- Page 152 and 153: 140 The average deviation of the me
- Page 154 and 155: 42 tween 0.25 and 0.58. L~~l had re
- Page 156 and 157: 144 transfer coefficients to non-Ne
- Page 158 and 159: 16 of fit and it may t...herefore b
- Page 160 and 161: 148 'tvas insufficient data to eval
- Page 162 and 163: 50 A ::: Apr ... B ::: C p ::: CPr
- Page 164 and 165: 52. Q ::. Average heat transfer rat
- Page 166 and 167: Xc = Function of Reynolds nL:l.m.be
- Page 168 and 169: IS6 G REE:>{ ALPHABET 0 ::: Value o
- Page 170 and 171: 158 coefficient. Thus, for the wate
- Page 172 and 173: 160 , ., I .. : I :. '. • • !.
- Page 174 and 175: 162 I , . I . "I '1 I i I 1 I 1· '
- Page 176 and 177: 64 ncr --~iIluto e torque of the in
- Page 178 and 179: 166 rive different temperatures; ab
- Page 180 and 181: 168 TABLE A-4. SLOPE OF "LOG SHEAR
TABLE 5 - 8<br />
NNu '" C(N~e)a<br />
CORRELATION D<br />
(Npr)b (K/Kw)C (Dt/Da)d (Wa/Da)e<br />
IMPELLER Correlation Constants Average Errors<br />
TYPE C a b c d e n= l.0 0.69 0.43 0.36 Overall<br />
ltNCHOR 0.45 0.68 0.35 0.37 10.9 23.0 17.4 22.7 16 .. 9<br />
- -<br />
PADDLE 1.94 0.64 0.27 0.31 -0.40 0.42 9.2 13.4 22.1 22.3 13e4<br />
PROPELLER 0.!.~6 0.69 0.27 0.32 -0.23 11.4 12.3 2B.h 35.5 16.5<br />
TURBINE 2.39 0.63 0.24 0.31 -0.06*<br />
-<br />
O~<br />
O.hOn B.3 15.8 22.9 23.7 13.1<br />
.,l- See Table 5 - 4<br />
-1\)<br />
--


