Chi-square Test for Independence
Chi-square Test for Independence Chi-square Test for Independence
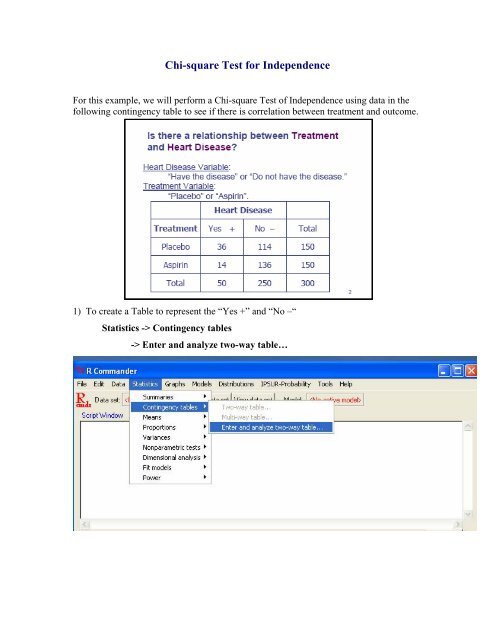
Chi-square Test for Independence For this example, we will perform a Chi-square Test of Independence using data in the following contingency table to see if there is correlation between treatment and outcome. 1) To create a Table to represent the “Yes +” and “No –“ Statistics -> Contingency tables -> Enter and analyze two-way table…
<strong>Chi</strong>-<strong>square</strong> <strong>Test</strong> <strong>for</strong> <strong>Independence</strong><br />
For this example, we will per<strong>for</strong>m a <strong>Chi</strong>-<strong>square</strong> <strong>Test</strong> of <strong>Independence</strong> using data in the<br />
following contingency table to see if there is correlation between treatment and outcome.<br />
1) To create a Table to represent the “Yes +” and “No –“<br />
Statistics -> Contingency tables<br />
-> Enter and analyze two-way table…
2) Enter the Data from the above chart to match the table in the R Commander window<br />
as shown below:<br />
Compute Percentages:<br />
If one needs the percentages, it<br />
can be calculated by selecting<br />
the bullet next to the needed<br />
percentage. For example, No<br />
percentages is selected.<br />
Hypothesis <strong>Test</strong>s:<br />
Choose: <strong>Chi</strong>-<strong>square</strong> test of<br />
independence<br />
And click OK button.<br />
Interpret Results:<br />
Pearson's <strong>Chi</strong>-<strong>square</strong>d test<br />
data: .Table<br />
X-<strong>square</strong>d = 11.616, df = 1, p-value = 0.0006539<br />
For this example: The resultant is a <strong>Chi</strong>-<strong>square</strong>d statistic = 11.616 and a p-value of<br />
0.00065.<br />
To test the hypothesis at 5% level of significance:<br />
P-value Approach:<br />
One would reject Null Hypothesis since the p-value: 0.00065 < 0.05<br />
Critical Value Approach:<br />
Reject null hypothesis since <strong>Chi</strong>-<strong>square</strong>d: 11.616 > 3.84


