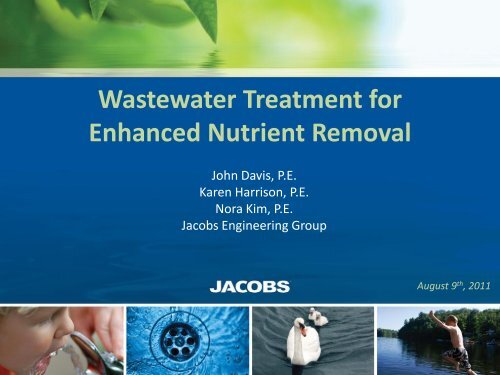
Davis & Harrison & Kim.Jacobs.Wastewater Treatment for Enhanced ...
Davis & Harrison & Kim.Jacobs.Wastewater Treatment for Enhanced ...
Davis & Harrison & Kim.Jacobs.Wastewater Treatment for Enhanced ...

Create successful ePaper yourself
Turn your PDF publications into a flip-book with our unique Google optimized e-Paper software.
<strong>Wastewater</strong> <strong>Treatment</strong> <strong>for</strong><br />
<strong>Enhanced</strong> Nutrient Removal<br />
John <strong>Davis</strong>, P.E.<br />
Karen <strong>Harrison</strong>, P.E.<br />
Nora <strong>Kim</strong>, P.E.<br />
<strong>Jacobs</strong> Engineering Group<br />
August 9 th , 2011
Outline<br />
• What is enhanced nutrient removal (ENR)?<br />
• Why is it required?<br />
• Where has it been required?<br />
• How is it accomplished?<br />
• Issues, lessons, and observations <strong>for</strong> two key<br />
processes:<br />
– Three-stage treatment<br />
– Simultaneous nitrification/denitrification (SND)
What is ENR?<br />
<strong>Treatment</strong> Level<br />
Typical Effluent<br />
Nutrient Levels<br />
Typical Process<br />
Nutrient<br />
Removal<br />
<strong>Enhanced</strong><br />
Nutrient<br />
Removal<br />
Wow!<br />
You’re Serious?<br />
Nutrient Removal<br />
8 mg/L TN<br />
and/or<br />
1 mg/L TP<br />
3 mg/L TN<br />
and/or<br />
0.1 mg/L TP<br />
1 mg/L TN<br />
and/or<br />
Why is ENR Required?<br />
Nitrogen and phosphorus<br />
waste loads in streams,<br />
lakes, and coastal estuaries<br />
can cause algae<br />
proliferation,<br />
eutrophication, & low<br />
oxygen levels.
Where has ENR been Required?<br />
• For Nitrogen<br />
– Typically coastal regions<br />
– Groundwater recharge<br />
– Chesapeake Bay<br />
– Florida<br />
– Long Island Sound<br />
• For Phosphorus<br />
– Typically upstream of freshwater lakes<br />
– Throughout U.S.
How is ENR accomplished?<br />
Sample of Low Nitrogen Plants<br />
<strong>Treatment</strong> Plant Process Supplement<br />
Carbon<br />
95 th %tile<br />
TN, mg/L<br />
Average<br />
TN, mg/L<br />
Truckee Meadows WRF, NV Fixed Film Nit/Denit & Filters Yes 2.5 1.7<br />
River Oaks WWTP, FL Separate Sludge & Filters Yes 2.3 1.5<br />
Howard F. Curran WWTP, FL Nitrification & Denit Filters Yes 3.0 NA<br />
WSSC Western Branch WWTP, MD Separate Sludge & Filters Yes 2.2 1.5<br />
Scituate WWTP, MA Nitrification & Denit Filters Yes 3.8 2.4<br />
Eastern WRF, FL Bardenpho & Filters No 6.7 4.3 (Median)<br />
WSSC Parkway WWTP, MD Bardenpho Yes 5.1 3.1<br />
Fiesta Village, FL Simult Nit/Denit & Denit Filters Yes 2.2 1.1<br />
Kalaska CWP, MI Ox Ditch Bardenpho No 2.8 2.2<br />
Iron Bridge WRF, FL Ox Ditch Bardenpho & Filters No 2.4 1.9<br />
WSSC Piscataway, WWTP, MD Step Feed & Filters No 7.2 3.1<br />
Ten Bardenpho Plants, FL Bardenpho & Filters Yes 3.5 2.4<br />
Five 3-Stage with Denite Filters, FL 3-Stage & Denit Filters Yes 3.0 2.1<br />
Source: WERF/WEF Real World LOT Nutrient Removal: Achievable Limits and Statistical Reliability Workshop,<br />
October 11, 2009
How is ENR accomplished <strong>for</strong><br />
Low Nitrogen?<br />
• Typical Processes<br />
– Separate Sludge<br />
– Attached-Growth Denitrification<br />
– Bardenpho<br />
– Simultaneous Nitrification/Denitrification (SND)<br />
PLUS<br />
• Chemical Addition<br />
– Methanol, Acetic Acid, Other Carbon Source
How is Nitrogen Removal<br />
Accomplished?<br />
A Basin Meeting Three Main Requirements<br />
1. Nitrified Influent<br />
2. Anoxic Conditions<br />
3. Carbon Source
Separate Sludge<br />
Supplemental<br />
Carbon<br />
Nitrification<br />
Stage<br />
1 st Stage<br />
Clarifiers<br />
De-Nitrification<br />
Stage<br />
2 nd Stage<br />
Clarifiers<br />
• Common in earliest low TN applications (70s and 80s)<br />
• Effective<br />
• High cost <strong>for</strong> capital and chemical
Attached-Growth Denitrification<br />
Supplemental<br />
Carbon<br />
Anaerobic<br />
Stage<br />
Anoxic<br />
Stage<br />
Aerobic<br />
Stage<br />
Clarifiers<br />
Denitrifying<br />
Filters<br />
• Combined with upstream activated sludge<br />
• TN removal with upstream nitrification<br />
• TN polishing with upstream 3-stage process
Bardenpho<br />
Supplemental<br />
Carbon<br />
Anaerobic<br />
Stage<br />
1 st Anoxic<br />
Stage<br />
1 st Aerobic<br />
Stage<br />
2 nd Anoxic<br />
Stage<br />
2 nd Aerobic<br />
Stage<br />
Clarifiers<br />
Filters<br />
• Responds well to flow and load changes<br />
• Limits supplemental carbon need<br />
• Has become very common <strong>for</strong> low TN applications
Simultaneous<br />
Nitrification/Denitrification (SND)<br />
• More of an operational method than a<br />
process configuration<br />
• DO = 0.3 to 0.7 mg/L Nitrify & Denitrify<br />
• Used in many process configurations<br />
• Key is maintaining DO in low, narrow range<br />
– DO too high exceed on TN<br />
– DO too low exceed on NH 3 -N<br />
• Supplemental carbon may not be needed
SND Mechanism<br />
O 2<br />
Aerobic<br />
CO 2<br />
Anoxic<br />
N 2<br />
Ammonia<br />
NO 2<br />
NO 3<br />
BOD
How is ENR accomplished?<br />
Sample of Low Phosphorus Plants<br />
<strong>Treatment</strong> Plant BioP ChemP 95 th %tile<br />
TP, mg/L<br />
Average TP,<br />
mg/L<br />
Clark County, NV Yes Pre & Post 0.153 0.086<br />
Rocky Creek, OR Yes Pre & Post 0.151 0.067<br />
Blue Plains, DC Yes Pre & Co 0.161 0.067<br />
Iowa Hill WRF, CO Yes Post 0.031 0.013<br />
F. Wayne Hill, Gwinnett County, GA Yes Post 0.090 0.044<br />
Cauley Creek, Fulton County, GA Yes Co (MBR) 0.116 0.077<br />
Alexandia Sanitation Authority WWTP, VA Some Co & Post 0.101 0.046<br />
Pinery WWTP, CO Yes Post 0.042 0.023<br />
WSSC Piscataway, WWTP, MD Some Post 0.178 0.087<br />
Kalispell AWWTP, MT Yes No 0.168 0.110<br />
Kelowna WWTF, BC Yes Co 0.217 0.160<br />
Source: WERF/WEF Real World LOT Nutrient Removal: Achievable Limits and Statistical Reliability Workshop,<br />
October 11, 2009
How is ENR accomplished <strong>for</strong><br />
• Typical Processes<br />
Low Phosphorus?<br />
– Post-precipitation with tertiary clarifiers followed<br />
by filters<br />
– Co-precipitation in a Membrane Bioreactor (MBR)<br />
– Upstream biological phosphorus removal is<br />
warranted to save on chemical costs
Post-Precipitation<br />
Alum or<br />
Ferric<br />
Alum or<br />
Ferric<br />
Anaerobic<br />
Stage<br />
Anoxic<br />
Stage<br />
Aerobic<br />
Stage<br />
Clarifiers<br />
Chemical<br />
Clarifiers<br />
Chemical<br />
Filters<br />
• Need two sets of clarifiers plus filters<br />
• Multiple chemical feed points are common<br />
• Georgia has many examples on Lake Lanier, Chattahoochee
Co-Precipitation with MBR<br />
Alum or<br />
Ferric<br />
Anaerobic<br />
Stage<br />
Anoxic<br />
Stage<br />
Aerobic<br />
Stage<br />
RAS DeOx<br />
Tank<br />
Membrane<br />
Tank<br />
• Membranes replace two sets of clarifiers, and media filters<br />
• Air Scour DO can interfere with anaerobic/anoxic treatment<br />
• Georgia has many examples on Lake Lanier, Chattahoochee
Minimizing Chemical Costs<br />
As ENR standards become more common two<br />
process approaches will standout as keys to<br />
limiting chemical costs:<br />
– 3-Stage <strong>Treatment</strong><br />
• Example: Mauldin Road WWTP<br />
– Simultaneous Nitrification/Denitrification<br />
• Example: Yulee/Nassau Regional WRF
3-Stage <strong>Treatment</strong> – Mauldin Rd WWTP<br />
Anaerobic<br />
Stage<br />
Anoxic<br />
Stage<br />
Aerobic<br />
Stage<br />
Clarifiers<br />
Filters<br />
• Removes N and P to degree possible w/o chemicals<br />
• Can achieve low TN if extended into Bardenpho or followed<br />
by denitrifying filters<br />
• Can achieve < 1 mg/L TP w/o chemicals
TN, mg/L<br />
TP, mg/L<br />
3-Stage Process - SRT Sweet Spot<br />
30<br />
25<br />
20<br />
5<br />
4.5<br />
4<br />
3.5<br />
3<br />
15<br />
10<br />
5<br />
0<br />
0 10 20 30 40 50 60<br />
Sludge Retention Time (SRT), days<br />
2.5<br />
2<br />
1.5<br />
1<br />
0.5<br />
0<br />
TN Results<br />
TP Results
3-Stage Process – Other Observations<br />
• Phosphorus accumulating organisms (PAOs) and<br />
denitrifying organisms compete <strong>for</strong> carbon<br />
• Primary clarifiers will be counter-productive<br />
• Biologically fixed phosphorus must be removed with<br />
sludge<br />
• Long SRTs due to low plant loading will interfere with<br />
phosphorus removal<br />
• If denitrification is carbon-limited, more nitrified<br />
recycle won’t help TN removal.<br />
• DO and NO 3 in RAS can interfere with<br />
PAOs/phosphorus removal
SND - Yulee/Nassau Regional WRF<br />
Recycle<br />
Influent<br />
Flow<br />
Discharge<br />
Screening and Flow<br />
Split<br />
Anoxic Aerobic Anoxic MBR<br />
UV<br />
Disinfection
Effluent Limits<br />
Parameter<br />
cBOD 5<br />
Total Suspended Solids (TSS)<br />
Ammonia-Nitrogen (NH 3 -N)<br />
Total Nitrogen (TN)<br />
Total Phosphorus (TP)<br />
Limit<br />
5 mg/L<br />
5 mg/L<br />
1 mg/L<br />
3 mg/L<br />
1 mg/L
Process Highlights<br />
• SymBio® Process<br />
– Simultaneous nitrification-denitrification (SND)<br />
– Operates at low dissolved oxygen (0.2 – 0.5 mg/L)<br />
• Alum feed <strong>for</strong> P removal<br />
• Kubota flat plate membranes
Process Modeling<br />
• BioWin model used as operational tool<br />
• BioWin switching functions require<br />
adjustment<br />
• Jimenez (2010) research on SND switching<br />
functions
Concentration, mg/L<br />
Original Operation<br />
8<br />
7<br />
Nov 2006 to Jan 2007 Effluent Data<br />
Effluent TN<br />
Effluent TP<br />
6<br />
5<br />
4<br />
3<br />
2<br />
1<br />
0
Recommended Modifications<br />
• Added new aeration blower with VFD – 400 to<br />
1300 scfm capacity<br />
• Aeration tank minimum air reduced from 600<br />
scfm to 400 scfm<br />
• Operation of fewer trains at low loads<br />
• Consulted membrane vendor and reduced<br />
minimum scour air from 1400 to 700 scfm per<br />
membrane tank
Concentration, mg/L<br />
Modified Operation<br />
2010 Effluent Data<br />
7<br />
6<br />
Effluent TN<br />
Effluent TP<br />
5<br />
4<br />
3<br />
2<br />
1<br />
0
Questions?<br />
john.davis@jacobs.com


![VIA CERTIFIED MAIL (Return Receipt Requested) [DATE] Ms ...](https://img.yumpu.com/43063436/1/190x245/via-certified-mail-return-receipt-requested-date-ms-.jpg?quality=85)