Phase II Final Report - NASA's Institute for Advanced Concepts
Phase II Final Report - NASA's Institute for Advanced Concepts
Phase II Final Report - NASA's Institute for Advanced Concepts
You also want an ePaper? Increase the reach of your titles
YUMPU automatically turns print PDFs into web optimized ePapers that Google loves.
List of Figures<br />
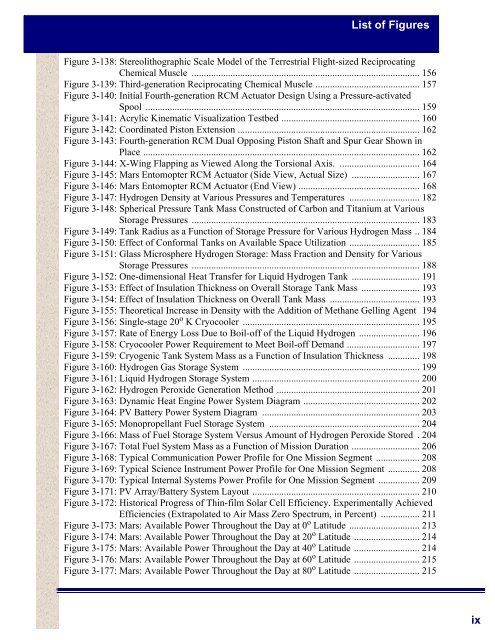
Figure 3-138: Stereolithographic Scale Model of the Terrestrial Flight-sized Reciprocating<br />
Chemical Muscle .............................................................................................. 156<br />
Figure 3-139: Third-generation Reciprocating Chemical Muscle ........................................... 157<br />
Figure 3-140: Initial Fourth-generation RCM Actuator Design Using a Pressure-activated<br />
Spool ................................................................................................................. 159<br />
Figure 3-141: Acrylic Kinematic Visualization Testbed ......................................................... 160<br />
Figure 3-142: Coordinated Piston Extension ........................................................................... 162<br />
Figure 3-143: Fourth-generation RCM Dual Opposing Piston Shaft and Spur Gear Shown in<br />
Place .................................................................................................................. 162<br />
Figure 3-144: X-Wing Flapping as Viewed Along the Torsional Axis. ................................. 164<br />
Figure 3-145: Mars Entomopter RCM Actuator (Side View, Actual Size) ............................ 167<br />
Figure 3-146: Mars Entomopter RCM Actuator (End View) .................................................. 168<br />
Figure 3-147: Hydrogen Density at Various Pressures and Temperatures ............................. 182<br />
Figure 3-148: Spherical Pressure Tank Mass Constructed of Carbon and Titanium at Various<br />
Storage Pressures .............................................................................................. 183<br />
Figure 3-149: Tank Radius as a Function of Storage Pressure <strong>for</strong> Various Hydrogen Mass .. 184<br />
Figure 3-150: Effect of Con<strong>for</strong>mal Tanks on Available Space Utilization ............................. 185<br />
Figure 3-151: Glass Microsphere Hydrogen Storage: Mass Fraction and Density <strong>for</strong> Various<br />
Storage Pressures .............................................................................................. 188<br />
Figure 3-152: One-dimensional Heat Transfer <strong>for</strong> Liquid Hydrogen Tank ............................ 191<br />
Figure 3-153: Effect of Insulation Thickness on Overall Storage Tank Mass ........................ 193<br />
Figure 3-154: Effect of Insulation Thickness on Overall Tank Mass ..................................... 193<br />
Figure 3-155: Theoretical Increase in Density with the Addition of Methane Gelling Agent 194<br />
Figure 3-156: Single-stage 20 o K Cryocooler ......................................................................... 195<br />
Figure 3-157: Rate of Energy Loss Due to Boil-off of the Liquid Hydrogen ......................... 196<br />
Figure 3-158: Cryocooler Power Requirement to Meet Boil-off Demand .............................. 197<br />
Figure 3-159: Cryogenic Tank System Mass as a Function of Insulation Thickness ............. 198<br />
Figure 3-160: Hydrogen Gas Storage System ......................................................................... 199<br />
Figure 3-161: Liquid Hydrogen Storage System ..................................................................... 200<br />
Figure 3-162: Hydrogen Peroxide Generation Method ........................................................... 201<br />
Figure 3-163: Dynamic Heat Engine Power System Diagram ................................................ 202<br />
Figure 3-164: PV Battery Power System Diagram ................................................................. 203<br />
Figure 3-165: Monopropellant Fuel Storage System .............................................................. 204<br />
Figure 3-166: Mass of Fuel Storage System Versus Amount of Hydrogen Peroxide Stored . 204<br />
Figure 3-167: Total Fuel System Mass as a Function of Mission Duration ............................ 206<br />
Figure 3-168: Typical Communication Power Profile <strong>for</strong> One Mission Segment .................. 208<br />
Figure 3-169: Typical Science Instrument Power Profile <strong>for</strong> One Mission Segment ............. 208<br />
Figure 3-170: Typical Internal Systems Power Profile <strong>for</strong> One Mission Segment ................. 209<br />
Figure 3-171: PV Array/Battery System Layout ..................................................................... 210<br />
Figure 3-172: Historical Progress of Thin-film Solar Cell Efficiency. Experimentally Achieved<br />
Efficiencies (Extrapolated to Air Mass Zero Spectrum, in Percent) ................ 211<br />
Figure 3-173: Mars: Available Power Throughout the Day at 0 o Latitude ............................. 213<br />
Figure 3-174: Mars: Available Power Throughout the Day at 20 o Latitude ........................... 214<br />
Figure 3-175: Mars: Available Power Throughout the Day at 40 o Latitude ........................... 214<br />
Figure 3-176: Mars: Available Power Throughout the Day at 60 o Latitude ........................... 215<br />
Figure 3-177: Mars: Available Power Throughout the Day at 80 o Latitude ........................... 215<br />
ix


