Users guide to MACRO5.0, a model of water flow and solute
Users guide to MACRO5.0, a model of water flow and solute
Users guide to MACRO5.0, a model of water flow and solute

You also want an ePaper? Increase the reach of your titles
YUMPU automatically turns print PDFs into web optimized ePapers that Google loves.
Studies in the Biogeophysical Environment<br />
<strong>Users</strong> <strong>guide</strong> <strong>to</strong> <strong>MACRO5.0</strong>, a <strong>model</strong> <strong>of</strong> <strong>water</strong><br />
<strong>flow</strong> <strong>and</strong> <strong>solute</strong> transport in macroporous soil.<br />
Fredrik Stenemo <strong>and</strong> Nicholas Jarvis<br />
Swedish University <strong>of</strong> Agricultural Sciences Emergo 2003:10<br />
Department <strong>of</strong> Soil Sciences<br />
Report<br />
Division <strong>of</strong> Environmental Physics ISSN 1651-7210<br />
ISBN 91-576-6610-5
Contents<br />
1. Structure <strong>of</strong> the program, 1<br />
1.1. File formats, 3<br />
2. Creating a project, 7<br />
3. Defining a simulation, 8<br />
3.1. Soil properties, 8<br />
3.2. Options, 9<br />
3.3. Parameters, 10<br />
3.4. Outputs, 11<br />
3.5. Simulation setup, 11<br />
4. Saving a simulation, 14<br />
5. Opening an existing project <strong>and</strong> simulation, 14<br />
6. Executing simulations, 15<br />
6.1. Batch mode, 16<br />
7. Looking at simulation outputs, 16<br />
7.1. The PG graphics program, 16<br />
7.2. File conversion <strong>and</strong> exporting data, 16<br />
7.3. Inbuilt <strong>to</strong>ols <strong>and</strong> functions, 17<br />
8. Parameter estimation with SUFI, 18<br />
8.1. Creating a new project, 18<br />
8.2. Creating a new iteration, 20<br />
8.3. Executing an iteration, 22<br />
8.4. Analysing an iteration, 22<br />
8.5. Measured data, 27<br />
9. Monte Carlo simulation, 27<br />
9.1. Sampling <strong>of</strong> parameter values, 28<br />
9.2. Execution <strong>of</strong> parameter variation file, 30<br />
9.3. Analysing the results <strong>of</strong> Monte Carlo simulations, 32<br />
10. References, 34<br />
Appendices
<strong>Users</strong> <strong>guide</strong> <strong>to</strong> <strong>MACRO5.0</strong>, a <strong>model</strong> <strong>of</strong> <strong>water</strong><br />
<strong>flow</strong> <strong>and</strong> <strong>solute</strong> transport in macroporous soil<br />
<strong>MACRO5.0</strong> is a Windows-based dual-permeability <strong>model</strong> <strong>of</strong> <strong>water</strong> <strong>flow</strong> <strong>and</strong> <strong>solute</strong><br />
transport in structured macroporous soils. Larsbo <strong>and</strong> Jarvis (2003) give a detailed<br />
technical description <strong>of</strong> the <strong>model</strong>. This manual is designed <strong>to</strong> help a first-time user<br />
get started with the <strong>model</strong>.<br />
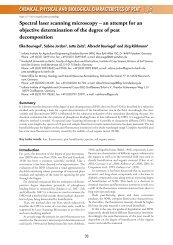
1. Structure <strong>of</strong> the program<br />
<strong>MACRO5.0</strong> consists <strong>of</strong> a number <strong>of</strong> different linked modules <strong>and</strong> components, as<br />
shown in the schematic figure below.<br />
MACRO <strong>model</strong><br />
Database<br />
Files<br />
•weather data,<br />
measured data<br />
MACRO shell<br />
program<br />
Additional programs<br />
•Monte Carlo simulation<br />
The <strong>model</strong> code itself is written in FORTRAN, <strong>and</strong> this is linked <strong>to</strong> a ‘shell’ or<br />
user-interface program written in VB6. The simulation <strong>model</strong> <strong>and</strong> the shell program<br />
communicate through files (e.g. driving data files) that are either in ASCII<br />
(extension .txt) or binary format (extension .bin). All information needed <strong>to</strong> run the<br />
system is s<strong>to</strong>red in a Micros<strong>of</strong>t Access database. Although this is not necessary,<br />
several different <strong>MACRO5.0</strong> databases can be maintained, containing information<br />
on different projects. You can switch between these different databases by clicking<br />
on “File-> Change database”.<br />
1
The default database supplied with the <strong>model</strong> is called PROJECT_MACRO_5.mdb.<br />
The shell program is also ‘loose-linked’ <strong>to</strong> some auxiliary s<strong>of</strong>tware programs, for<br />
example the UNCSAM programs for <strong>model</strong> sensitivity <strong>and</strong> uncertainty analysis.<br />
2
1.1. File formats<br />
This section describes the formats used for input weather data files <strong>and</strong> files<br />
containing measured data, how <strong>to</strong> create these files in text format, <strong>and</strong> how <strong>to</strong><br />
convert them in<strong>to</strong> MACRO binary formatted files using the <strong>MACRO5.0</strong> Wizard.<br />
Input files should be prepared as ASCII files with .txt extension, using an ordinary<br />
text edi<strong>to</strong>r (e.g. Micros<strong>of</strong>t Wordpad or Notepad) or Excel. Columns should be tabseparated,<br />
<strong>and</strong> without headers. It is important <strong>to</strong> make sure that the decimal<br />
separa<strong>to</strong>r (comma or point) in the text files matches the regional settings on your<br />
PC. The files are free format, but the date/time should always be in the first<br />
column, specified as follows:<br />
YYYYMMDDHHMM (e.g. 199903171245 which is 17 th March 1999 at 12:45).<br />
If all your data has a daily resolution, then the hours <strong>and</strong> minutes can be skipped<br />
(e.g. 19990317)<br />
1.1.1. Weather data<br />
Two weather data files are needed <strong>to</strong> run a simulation in <strong>MACRO5.0</strong>, one<br />
containing only precipitation data, the second containing air temperatures <strong>and</strong><br />
either pre-calculated daily potential evapotranspiration, or the meteorological data<br />
required <strong>to</strong> calculate potential evapotranspiration:<br />
1.) Either hourly or daily rainfall data may be used. Figures are given in<br />
millimetres. A daily rainfall data file might look like this:<br />
19990104 2.2<br />
19990105 0.0<br />
19990106 0.2<br />
19990107 0.6 <strong>and</strong> so on…..<br />
An hourly rainfall file might look like this:<br />
199901041030 2.2<br />
199901041130 0.0<br />
199901041230 0.2<br />
199901041330 0.6<br />
199901041430 0.0 <strong>and</strong> so on…..<br />
2.) The remaining weather data required by the <strong>model</strong> can be specified in two<br />
different ways. In both cases, a daily resolution is required:<br />
a.) A file containing the meteorological data required <strong>to</strong> calculate<br />
potential evapotranspiration internally in the <strong>model</strong> using the<br />
Penman-Monteith equation. The data needed are: solar radiation<br />
(Wm -2 ), maximum <strong>and</strong> minimum air temperatures ( o C), vapour<br />
pressure (kPa) <strong>and</strong> wind speed (m s -1 ). The columns <strong>of</strong> data can be in<br />
3
any order. If maximum <strong>and</strong> minimum temperatures are not available,<br />
the daily mean temperature can be substituted for both variables (i.e.<br />
two identical columns <strong>of</strong> temperature data must be input).<br />
b.) A file containing pre-calculated potential evapotranspiration <strong>and</strong><br />
maximum <strong>and</strong> minimum temperatures. Again, the columns <strong>of</strong> data<br />
can be in any order. If maximum <strong>and</strong> minimum temperatures are not<br />
available, the daily mean temperature can, as before, be used twice.<br />
Hourly rainfall data files can be generated from daily rainfall data using an inbuilt<br />
s<strong>to</strong>chastic disaggregation ‘cascade’ <strong>model</strong>, based on the temporal scale-invariance<br />
<strong>of</strong> rainfall patterns (Olsson, 1998). You will find this <strong>to</strong>ol under “Tools-> Convert<br />
files -> Daily <strong>to</strong> hourly rainfall”.<br />
As <strong>model</strong> input, the disaggregation <strong>to</strong>ol requires the user <strong>to</strong> input a series <strong>of</strong><br />
probabilities that define the temporal distribution <strong>of</strong> rainfall as the time resolution<br />
changes from daily <strong>to</strong> hourly.<br />
4
Use the browse but<strong>to</strong>n <strong>to</strong> select the .bin formatted file containing daily rainfall data.<br />
Define a name for the output file that will contain the hourly data. When you click<br />
on “Disaggregate”, the <strong>to</strong>ol will make a s<strong>to</strong>chastic conversion from daily <strong>to</strong> hourly<br />
rainfall data based on the probabilities given in the table on the left. The <strong>model</strong><br />
disaggregates rainfall data by doubling the time resolution for each disaggregation<br />
level. In MACRO 5.0, the daily rainfall series is first disaggregated <strong>to</strong> a series with<br />
a 45-minutes resolution. Each 45-minute interval is then further divided in<strong>to</strong> three<br />
15-minute intervals. The 15-minute intervals are added <strong>to</strong>gether four <strong>and</strong> four <strong>to</strong><br />
create a series with an hourly time resolution. Rainfall ‘boxes’ are defined,<br />
classified in<strong>to</strong> four different types depending on their position within a continuous<br />
rainfall period: ‘start’, ‘end’, ‘enclosed’ <strong>and</strong> ‘isolated’. These classes are further<br />
subdivided in<strong>to</strong> ‘boxes’ that have higher or lower rainfall amounts than the<br />
observed mean (indicated with an ‘a’ for above <strong>and</strong> a ‘b’ for below in the <strong>to</strong>ol).<br />
Each <strong>of</strong> these classes is associated with three probability parameters (wet/dry,<br />
dry/wet, wet/wet). Three default parameterisations are available in <strong>MACRO5.0</strong>,<br />
based on analyses <strong>of</strong> rainfall patterns in southern Sweden, Engl<strong>and</strong>, <strong>and</strong> Brazil<br />
(Olsson, 1998; Güntner et al., 2001).<br />
1.1.2. Measured data<br />
<strong>MACRO5.0</strong> allows graphical <strong>and</strong> statistical comparisons <strong>of</strong> <strong>model</strong> simulations <strong>and</strong><br />
measured data, <strong>and</strong> also includes an inbuilt parameter estimation methodology<br />
(‘inverse <strong>model</strong>ling’) based on quantitative estimates <strong>of</strong> <strong>model</strong> goodness-<strong>of</strong>-fit <strong>to</strong><br />
data. The file containing the measured data should be created as a .txt file formatted<br />
in the same way as the weather data files. Missing data should be denoted with an<br />
unusual integer number such as –999.<br />
1.1.3. File conversion from ASCII <strong>to</strong> binary format<br />
Text files can be converted in<strong>to</strong> the .bin format required by MACRO using the file<br />
conversion wizard that you will find under “Tools->Convert files->ASCII <strong>to</strong> .bin”.<br />
5
First, you specify the type <strong>of</strong> data in the file. If the file contains measured data, you<br />
should click on ‘Other’ <strong>and</strong> then fill in the correct number <strong>of</strong> variables (the<br />
date/time is not counted as a variable).<br />
Click on ‘Next’, select the text file using the browse but<strong>to</strong>n, fill in appropriate<br />
column headings for each variable, <strong>and</strong> finally click on ‘Finish’.<br />
6
2. Creating a project<br />
You can create a new project in <strong>MACRO5.0</strong> by clicking on “File->New”.<br />
Give an appropriate project name <strong>and</strong> description, <strong>and</strong> then click on ‘O.K.’<br />
7
All inputs in <strong>MACRO5.0</strong> are then au<strong>to</strong>matically given default values. You now<br />
define your simulation by modifying these default inputs under ‘Edit’.<br />
You specify the soil properties, options, parameter values, output variables, <strong>and</strong> the<br />
simulation setup (driving data, start/s<strong>to</strong>p times for the simulation, output interval<br />
etc.), that <strong>to</strong>gether define a unique simulation under the ‘umbrella’ <strong>of</strong> the project<br />
that is currently open.<br />
3. Defining a simulation<br />
The different components <strong>of</strong> a simulation can be defined in any order, but it usually<br />
makes sense <strong>to</strong> follow the order <strong>of</strong> the menu items.<br />
3.1. Soil properties<br />
Here, you can give some background information on the site <strong>and</strong> soil pr<strong>of</strong>ile that<br />
you are simulating. You also define basic properties <strong>of</strong> each horizon in the soil<br />
pr<strong>of</strong>ile. Each horizon is characterised by a designation, a thickness, the texture (%<br />
s<strong>and</strong>, silt, clay), FAO soil structure, pH, organic carbon content (%) <strong>and</strong> bulk<br />
density. These properties <strong>of</strong> the soil are not <strong>model</strong> parameters as such, but can be<br />
used <strong>to</strong> estimate hydraulic parameters in the <strong>model</strong> (hydraulic conductivity, <strong>water</strong><br />
retention) using inbuilt pedotransfer functions (see Appendix 1). The organic<br />
carbon content, clay content <strong>and</strong> bulk density are also used <strong>to</strong> au<strong>to</strong>matically<br />
estimate thermal properties <strong>of</strong> the soil (heat conductivity, thermal capacity, see<br />
Larsbo <strong>and</strong> Jarvis, 2003). You should ensure that the horizon designation for the<br />
<strong>to</strong>psoil includes the capital letter ‘A’. This is because different pedotransfer<br />
8
functions for soil hydraulic properties are used for the <strong>to</strong>psoil <strong>and</strong> subsoil horizons,<br />
<strong>and</strong> the program will only recognize a <strong>to</strong>psoil horizon by the designation ‘A’.<br />
You should also specify the number <strong>of</strong> numerical layers in the pr<strong>of</strong>ile. This may<br />
vary between 60 <strong>and</strong> 200 depending on the depth <strong>of</strong> pr<strong>of</strong>ile you are simulating.<br />
Internally, the program then allocates these numerical layers <strong>to</strong> each specified<br />
horizon. Model parameters are constant for all numerical layers in each horizon.<br />
3.2. Options<br />
Under “Options”, you make basic choices that define the kind <strong>of</strong> simulation you<br />
want <strong>to</strong> run. These options are classified under four headings: ‘Boundary/initial<br />
conditions’, ‘Site Management’, ‘Crop’ <strong>and</strong> ‘Solute’. The parameters needed <strong>to</strong> run<br />
the simulation <strong>and</strong> the output variables that are available, depend on these choices.<br />
9
3.3. Parameters<br />
Once you have set all the options, you should click on “Parameters” <strong>to</strong> define all<br />
the parameter values required by the <strong>model</strong> for this simulation.<br />
These parameters are grouped under eight headings: ‘Crop’, ‘Initial/Boundary<br />
conditions’, ‘Irrigation’, ‘Physical parameters’, ‘Site’, ‘Solute’, ‘Management’ <strong>and</strong><br />
‘Numerical Layers’. For a new project, all parameters will have been given default<br />
values, <strong>and</strong> this is denoted by the black colour.<br />
When you overwrite the default value, the font colour will change <strong>to</strong> green <strong>to</strong><br />
denote a user-defined parameter value. ‘Tool-tip’ help text is available for all<br />
parameters, <strong>to</strong>gether with cross-references <strong>to</strong> the relevant equations in the technical<br />
description (Larsbo <strong>and</strong> Jarvis, 2003). Soil physical properties can also be<br />
estimated from the basic soil properties you have already defined by clicking on the<br />
“Pedotransfer” but<strong>to</strong>n.<br />
10
You then specify which parameters you would like <strong>to</strong> estimate, <strong>and</strong> for which<br />
horizons in the soil pr<strong>of</strong>ile. The various pedotransfer functions used in <strong>MACRO5.0</strong><br />
are described in Appendix 1. The calculations are made when you click on O.K.,<br />
<strong>and</strong> the estimated parameter values are then shown in red font.<br />
3.4. Outputs<br />
Here you can select output variables grouped under four headings: ‘Water<br />
balance’, ‘Solute balance’, ‘Miscellaneous (<strong>water</strong>)’ <strong>and</strong> ‘Miscellaneous (other)’.<br />
For array output variables, you can select single or multiple numerical layers in the<br />
pr<strong>of</strong>ile, using the Ctrl <strong>and</strong> Shift keys according <strong>to</strong> Windows conventions.<br />
3.5. Simulation setup<br />
In this screen, you define all the driving data files (e.g. weather data files) that are<br />
needed for the currently defined simulation. Click on “Add file(s)”.<br />
11
A Wizard will then <strong>guide</strong> you through the process <strong>of</strong> defining a driving data file.<br />
If you have already created the required *.bin file, click “Next”, <strong>and</strong> then define the<br />
kind <strong>of</strong> driving data that the file contains.<br />
Then select the .bin file using the browse but<strong>to</strong>n, check that the data appears<br />
correct, <strong>and</strong> click on “Finish” <strong>to</strong> add the file <strong>to</strong> the simulation.<br />
12
You will then return <strong>to</strong> the main menu under “Simulation set-up”. On this screen,<br />
you also set the start <strong>and</strong> s<strong>to</strong>p times for the simulation <strong>and</strong> define how you would<br />
like the outputs <strong>to</strong> be calculated. You can choose between values calculated as<br />
averages for each output interval or the actual values at the end <strong>of</strong> each output<br />
interval. Output intervals can either be defined as a constant value (e.g. daily) or<br />
irregularly spaced times can be read in from a *.bin file. An output direc<strong>to</strong>ry path<br />
<strong>and</strong> file name can also be specified here. The default name is MACROXXX.bin<br />
where XXX is a unique run ID number given <strong>to</strong> the simulation.<br />
13
4. Saving a simulation<br />
A MACRO simulation under the umbrella <strong>of</strong> the currently defined project can be<br />
defined at any time by clicking on “File->Save As”.<br />
Give an appropriate name <strong>and</strong> description for the simulation <strong>and</strong> click on ‘Save’.<br />
All current settings will be saved <strong>to</strong> the database under this name. You can save any<br />
further changes that you may make <strong>to</strong> the definition <strong>of</strong> the simulation by clicking on<br />
“File->Save” at any time.<br />
5. Opening an existing project <strong>and</strong> simulation<br />
You can open an existing project <strong>and</strong> previously defined simulation by clicking on<br />
“File->Open”. You will find descriptions <strong>of</strong> each project <strong>and</strong> simulation,<br />
information on when each simulation was last modified <strong>and</strong> its unique Run ID.<br />
14
6. Executing simulations<br />
The currently defined simulation can be executed at any time by clicking on<br />
“Execute->Current”. You will then get some information on the simulation name,<br />
project name, a Run ID for the simulation, <strong>and</strong> the output filenames. You can also<br />
save the current definition <strong>of</strong> the simulation <strong>to</strong> the database prior <strong>to</strong> running it.<br />
When the simulation starts, you will see the following screen.<br />
On completion, you are provided with some information on how long the<br />
simulation <strong>to</strong>ok <strong>to</strong> run, <strong>and</strong> the mass balance errors for both <strong>water</strong> <strong>and</strong> <strong>solute</strong>.<br />
15
6.1. Batch mode<br />
Batch mode can be used <strong>to</strong> run a series <strong>of</strong> simulations. Each simulation must first<br />
be defined <strong>and</strong> saved <strong>to</strong> the database. You create the batch run under “Tools-<br />
>Setup batch file”. Add a simulation by clicking on “Add”. Click O.K. <strong>to</strong> finish.<br />
The batch file is run under “Execute->Batch file”.<br />
7. Looking at simulation outputs<br />
The file containing the simulation results is binary formatted with extension *.bin.<br />
There are three different ways <strong>of</strong> looking at these outputs.<br />
7.1. The PG graphics program<br />
The *.bin file can be read directly using the auxiliary program PG that is supplied<br />
with <strong>MACRO5.0</strong>. You first click twice on pg.exe <strong>to</strong> start the program, <strong>and</strong> then<br />
press the F2 key <strong>to</strong> list all the available *.bin files. Use the up <strong>and</strong> down arrow keys<br />
<strong>to</strong> move on <strong>to</strong>p <strong>of</strong> the file you wish <strong>to</strong> read in, <strong>and</strong> then press return twice. A list<br />
containing useful comm<strong>and</strong>s in PG is given in Appendix 2 <strong>to</strong> this report. It should<br />
be noted that PG can only h<strong>and</strong>le a maximum <strong>of</strong> 400 output variables.<br />
7.2. File conversion <strong>and</strong> exporting data<br />
You can convert the *.bin file <strong>to</strong> a text file using the File conversion wizard<br />
included in <strong>MACRO5.0</strong>. Click on “Tools->Convert files-> .bin <strong>to</strong> ASCII”. You can<br />
then import the data in<strong>to</strong> any graphics program you like (e.g. Excel). Note that the<br />
text file created by the wizard is ‘Tab delimited’.<br />
16
7.3. Inbuilt <strong>to</strong>ols <strong>and</strong> functions<br />
You can make a quick statistical <strong>and</strong>/or graphical comparison <strong>of</strong> the simulated<br />
results with measured data by clicking on “Tools->Compare with measured”. By<br />
clicking “Compute goal function”, you can calculate the goodness <strong>of</strong> fit <strong>of</strong><br />
simulated variables with measured data, using either the root mean square error<br />
(RMSE) or <strong>model</strong> efficiency (EF) criteria.<br />
A graphical comparison with measured data contained in a binary formatted file<br />
(see ‘File Formats’, ‘Measured data’) can be made using the simple inbuilt plot<br />
routine in <strong>MACRO5.0</strong>. Click on “Plot” <strong>and</strong> then “Plot -> New”,<strong>and</strong> use the browse<br />
but<strong>to</strong>ns <strong>to</strong> select the correct files containing simulated <strong>and</strong> measured data.<br />
You can only plot time series. To change the formatting, click on the graph with the<br />
right-h<strong>and</strong> mouse but<strong>to</strong>n.<br />
17
8. Parameter estimation with SUFI<br />
The SUFI parameter estimation methodology (Abbaspour et al., 1997) has been<br />
incorporated in<strong>to</strong> <strong>MACRO5.0</strong>. You will find SUFI by clicking on “Tools->SUFI”.<br />
The work with SUFI is organised in<strong>to</strong> projects <strong>and</strong> iterations. Each project is<br />
characterised by a name, a base simulation <strong>and</strong> a number <strong>of</strong> specified parameters<br />
that you would like <strong>to</strong> estimate.<br />
Since the number <strong>of</strong> simulations <strong>to</strong> be run in any given calibration problem can be<br />
very large, you have the possibility with <strong>MACRO5.0</strong> <strong>to</strong> partition the simulations<br />
between any number <strong>of</strong> participating computers. One database, located on a server,<br />
then controls the execution <strong>of</strong> the project, with respect <strong>to</strong> identifying values <strong>of</strong> the<br />
parameters <strong>to</strong> be calibrated <strong>and</strong> partitioning <strong>of</strong> the simulations between computers.<br />
This database is specified at the base <strong>of</strong> the main SUFI screen (see below). The<br />
simulations are run on each individual computer, where a local database, defined<br />
under the main menu <strong>of</strong> <strong>MACRO5.0</strong>, controls all other aspects <strong>of</strong> the simulation<br />
(e.g. driving data files, fixed parameter values).<br />
8.1. Creating a new project<br />
Click on “File->New Project” in order <strong>to</strong> create a new SUFI project.<br />
18
Give the project a name <strong>and</strong> add a descriptive comment. Click “Open” <strong>to</strong> select the<br />
base simulation. This is a previously defined MACRO 5.0 simulation that defines<br />
all the parameters that are given constant values during the iteration.<br />
19
After selecting the base simulation, add the parameters that you want <strong>to</strong> include in<br />
the calibration. MACRO parameters describing <strong>solute</strong>, pesticide <strong>and</strong> physicalhydraulic<br />
properties can be selected in the three drop-down boxes. For parameters<br />
that vary with depth in the pr<strong>of</strong>ile, you should specify the relevant horizon or<br />
choose <strong>to</strong> vary the parameter for all horizons. If you want a parameter <strong>to</strong> vary in the<br />
same way for two or more horizons, click “Covariation” <strong>to</strong> bring up the dialogue<br />
box shown below. By clicking on the table, you can <strong>to</strong>ggle the text “Covary” on<br />
<strong>and</strong> <strong>of</strong>f. In this example, ASCALE <strong>and</strong> KSM will always take the same values in<br />
horizons one <strong>and</strong> two, while the values in horizons 3 <strong>and</strong> 4 will be unaffected.<br />
8.2. Creating a new iteration<br />
On returning <strong>to</strong> the main SUFI menu, you will find that all previously defined SUFI<br />
projects are shown in a list. Click on the project you want <strong>to</strong> work with in the list<br />
<strong>and</strong> then click on “Iteration->New…” <strong>to</strong> bring up the dialogue shown below.<br />
The selected parameters are shown in the table <strong>to</strong> the right. Enter the minimum <strong>and</strong><br />
maximum value <strong>and</strong> the number <strong>of</strong> strata for each parameter. The parameter range<br />
20
(i.e. maximum minus minimum) is divided in<strong>to</strong> the specified number <strong>of</strong> (equalsized)<br />
strata. You can choose either exhaustive or r<strong>and</strong>om sampling. Exhaustive<br />
sampling means that all combinations <strong>of</strong> parameter values are run, using the midpoint<br />
value <strong>of</strong> each strata as the parameter estimate. R<strong>and</strong>om sampling means that a<br />
specified subset <strong>of</strong> all the strata combinations will be selected at r<strong>and</strong>om <strong>and</strong><br />
propagated through the simulation <strong>model</strong>. The program calculates the <strong>to</strong>tal number<br />
<strong>of</strong> simulations that will be run. For exhaustive sampling, this is equal <strong>to</strong> the number<br />
<strong>of</strong> strata raised <strong>to</strong> the power <strong>of</strong> the number <strong>of</strong> parameters (if the same number <strong>of</strong><br />
strata is specified for each parameter).<br />
An output direc<strong>to</strong>ry is also specified for the iteration. The output files from the<br />
MACRO simulation will be renamed <strong>and</strong> moved <strong>to</strong> this direc<strong>to</strong>ry. The new file<br />
name will be “iter[iteration number]_[simulation number].bin”. In order for the<br />
analysis <strong>to</strong>ol <strong>to</strong> work, all output files should be located in the specified output file<br />
direc<strong>to</strong>ry <strong>and</strong> they must not be renamed. Note that it is possible <strong>to</strong> change the<br />
output file direc<strong>to</strong>ry after the iteration has been executed. This is useful if output<br />
files are moved from one computer <strong>to</strong> another. Note that the selected output times<br />
in the base simulation must correspond <strong>to</strong> the dates <strong>and</strong> times for the measured data<br />
in order <strong>to</strong> make the computation <strong>of</strong> the goal function possible. You create the<br />
iteration by clicking on “O.K.” You then return <strong>to</strong> the main SUFI menu, where the<br />
information that you just entered is displayed in the lower part <strong>of</strong> the screen. You<br />
can also change the output path at this point.<br />
21
Even if you intend <strong>to</strong> execute the iteration simultaneously on several computers, the<br />
complete iteration must be defined on each computer, in exactly the same way.<br />
8.3. Executing an iteration<br />
It is recommended that before executing a SUFI iteration, you first check that the<br />
selected base simulation runs properly in “manual” mode, making sure that the<br />
correct output variables have been selected.<br />
After clicking “Iteration->Execute current” the program will execute all the<br />
simulations in the iteration. For parallel execution, you should give this comm<strong>and</strong><br />
on each computer. The simulations will then be au<strong>to</strong>matically divided up between<br />
the participating computers. It is possible <strong>to</strong> abort the execution <strong>and</strong> resume it later.<br />
You will receive a message when the iteration has been completed.<br />
8.4. Analysing an iteration<br />
The analysis is performed in a step-wise manner with the help <strong>of</strong> an ‘analysis<br />
wizard'. After clicking on “Iteration->Analyse”, you first select the project <strong>and</strong><br />
iteration that you wish <strong>to</strong> analyse.<br />
Measured data (e.g. for <strong>water</strong> contents or <strong>solute</strong> concentrations) <strong>of</strong>ten represents a<br />
value averaged over some depth interval in the soil, while the simulation output<br />
variable will usually be given for a larger number <strong>of</strong> smaller depth intervals<br />
corresponding <strong>to</strong> numerical layers in the <strong>model</strong>. By clicking on “Aggregate”, it is<br />
22
possible <strong>to</strong> calculate a weighted average representing the same depth interval as the<br />
measured data for the output variables in question (see below). It should be noted<br />
that the original .bin file is overwritten by this operation, so it is recommended <strong>to</strong><br />
make a backup copy <strong>of</strong> the original file prior <strong>to</strong> aggregating outputs.<br />
Select the variables in the left-h<strong>and</strong> list for which a weighted average will be<br />
calculated, <strong>and</strong> then click “Group”. Do this for each group that you wish <strong>to</strong> include.<br />
Note that all the variables used in the subsequent calibration must be selected <strong>and</strong><br />
grouped, even variables that you do not want <strong>to</strong> modify in the weighting procedure.<br />
Click on each <strong>of</strong> the defined groups <strong>and</strong> provide the information in the textboxes <strong>to</strong><br />
the right. To set the weights, click “Set weights”. Weights can be supplied either<br />
manually or calculated based on the thickness <strong>of</strong> the numerical layers.<br />
The goal function can then be defined by returning <strong>to</strong> the first screen <strong>of</strong> the wizard<br />
<strong>and</strong> clicking on “Next”. First, the file with the measured values is located <strong>and</strong> the<br />
23
conditioning variables (the measured values used for the calibration) are selected.<br />
The integer number representing missing data is also specified here.<br />
Secondly, either the root mean square error (RMSE) or the <strong>model</strong> efficiency (EF) is<br />
selected as the goal function. One value <strong>of</strong> the goal function is calculated for each<br />
‘group’, representing different types <strong>of</strong> measured data. For the RMSE, the overall<br />
value <strong>of</strong> the goal function is obtained by either adding or multiplying the values for<br />
the different groups. For EF, the average value is calculated.<br />
24
Next, the conditioning (i.e. measured) variables are matched <strong>to</strong> the appropriate<br />
simulated variables (see dialogue below). This is done by clicking on the measured<br />
variable in the left-h<strong>and</strong> list <strong>and</strong> then on the corresponding simulated variable in the<br />
right-h<strong>and</strong> list.<br />
Next, you indicate how the measured variables should be grouped or aggregated. A<br />
detection limit for each group can be set. Each group can also be given a weight.<br />
25
The number <strong>of</strong> <strong>to</strong>lerance levels is defined in the final step.<br />
The first <strong>to</strong>lerance level is au<strong>to</strong>matically set at the best value <strong>of</strong> the goal function,<br />
while subsequent levels are determined by either adding (‘ab<strong>solute</strong>’) or multiplying<br />
(‘relative’) by a specified value. If the option “percentile” is selected, the second<br />
<strong>to</strong>lerance level will be set at the goal function value that is better than the selected<br />
percentile. Values that have matching dates in the measured data file <strong>and</strong> in the<br />
simulated output file are included in the goal function. This means that if a<br />
measured data point is not missing but has no corresponding date in the simulated<br />
file, it will not be included in the goal function. It is therefore necessary <strong>to</strong> make<br />
sure that the output dates are in agreement with the measured dates. The results are<br />
saved in a number <strong>of</strong> text files (Table 1).<br />
Table 1 Output files from the analysis <strong>of</strong> a SUFI iteration.<br />
File<br />
StrataScores.txt<br />
StrataInformation.txt<br />
Sensitivity.txt<br />
Goalfunction.txt<br />
IterationSummary.txt<br />
Contents<br />
The strata score for each parameter as a function<br />
<strong>of</strong> <strong>to</strong>lerance level<br />
Information for each parameter about the value for<br />
each strata<br />
The average value <strong>of</strong> the goal function as a<br />
function <strong>of</strong> strata number for each parameter<br />
Values <strong>of</strong> the goal function for all strata<br />
combinations (simulations)<br />
Summary information about the iteration<br />
26
These files are located in the iteration files output direc<strong>to</strong>ry <strong>and</strong> can be viewed from<br />
within the wizard (see below) or opened in another program (e.g. Wordpad).<br />
Under ‘Strata information’, you can find the actual parameter values used in the<br />
iteration (Table 1). Under ‘Goal function values’, you will find the individually<br />
calculated values <strong>of</strong> the goal function for each simulation (Table 1). ‘Strata score’<br />
shows you the number <strong>of</strong> ‘hits’ for the defined <strong>to</strong>lerances for each parameter value.<br />
The information in these files forms the basis for the definition <strong>of</strong> the next iteration.<br />
You should now decide on how <strong>to</strong> reduce the prior uncertainty domains for each<br />
parameter for the subsequent iteration, based on this information. Base your<br />
decision on a <strong>to</strong>lerance level that gives a good contrast in the number <strong>of</strong> hits<br />
between strata (i.e. only zeros <strong>and</strong> ones is not a good basis, <strong>and</strong> neither is the<br />
difference between 3 <strong>and</strong> 4 hits for example). You should not be <strong>to</strong>o greedy!<br />
8.5. Measured data<br />
During the analysis phase, the measured data should be available in one single file,<br />
created from within the MACRO 5.0 shell. This file has the extension “.bin”. To<br />
prepare this file, follow the instructions given in section 1.1.2.<br />
9. Monte Carlo simulation<br />
MACRO 5.0 is loose-linked <strong>to</strong> the s<strong>of</strong>tware package UNCSAM for Monte Carlo<br />
sensitivity <strong>and</strong> uncertainty analyses (Janssen et al., 1992). The UNCSAM programs<br />
for both ‘latin hypercube’ sampling <strong>of</strong> <strong>model</strong> parameter distributions <strong>and</strong><br />
27
egression-correlation analysis <strong>of</strong> <strong>model</strong> outputs can be run from within the<br />
MACRO 5.0 shell. These <strong>to</strong>ols are accessed by clicking “Tools->Monte Carlo”.<br />
9.1. Sampling <strong>of</strong> parameter values<br />
This is the first step in any Monte Carlo analysis. Click on “Sample” under “Tools-<br />
> Monte Carlo”. First, some general information must be provided, including the<br />
number <strong>of</strong> simulations <strong>to</strong> be run, <strong>and</strong> the ‘seed number’ for the r<strong>and</strong>om number<br />
genera<strong>to</strong>r. All the UNCSAM files will use the specified file prefix.<br />
28
In the next step, the parameters are selected <strong>and</strong> their distributions defined. You<br />
may choose between uniform, normal <strong>and</strong> log-normal distributions. For parameters<br />
that vary with depth, you can select which horizon <strong>to</strong> sample or specify that all<br />
horizons should be varied in the same way.<br />
Next, correlation coefficients among the parameters are specified (see below).<br />
Finally, you create three UNCSAM formatted files (*.fam, *.sam <strong>and</strong> *.par) by<br />
clicking on “Generate”.<br />
29
The *.fam file can be used <strong>to</strong> run all the generated MACRO parameter<br />
combinations in batch mode using the <strong>to</strong>ol “Execute parameter variation file”.<br />
9.2. Execution <strong>of</strong> parameter variation file<br />
The next step is <strong>to</strong> run the Monte Carlo simulations. Click on “Tools-> Monte<br />
Carlo-> Execute variation file”. Using this wizard, you can execute a large number<br />
<strong>of</strong> parameter combinations in batch mode. Two file formats are supported:<br />
1.) UNCSAM *.fam file (Janssen et al., 1992) created with the in-built<br />
sampling <strong>to</strong>ol (see above).<br />
2.) MACRO default. This is a text file (*.txt) where the first line contains a<br />
tab-separated list <strong>of</strong> the names <strong>of</strong> the parameters <strong>to</strong> vary, <strong>and</strong> the<br />
subsequent lines contain tab-separated parameter values. This fuile can<br />
either be created manually, or by an external program created by the user.<br />
The parameter variation file defines a number <strong>of</strong> simulations (one for each row in<br />
the file) for which selected parameter values are varied. In addition <strong>to</strong> executing the<br />
defined simulations, the <strong>to</strong>ol also creates a file that can be used for analysis <strong>of</strong> the<br />
outputs in UNCSAM (*.sgn file).<br />
Step I<br />
First, a base-simulation must be selected that defines the values <strong>of</strong> those parameters<br />
that are kept constant.<br />
Step II<br />
The parameter variation file defining the simulations is then selected.<br />
30
In order for the program <strong>to</strong> identify the correct parameter, the specified parameter<br />
names must have the following format: [ _]. If is specified as ‘all’, the parameter will be varied<br />
for all horizons (if this is possible). This applies <strong>to</strong> both file formats.<br />
Step III<br />
The following output settings must be specified:<br />
1.) the direc<strong>to</strong>ry where the output files (*.bin, *.sum <strong>and</strong> *.sgn) are s<strong>to</strong>red.<br />
2.) the output filename prefix.<br />
The output files will be moved <strong>to</strong> the specified direc<strong>to</strong>ry <strong>and</strong> renamed according <strong>to</strong><br />
“_”. The generated UNCSAM *.sgn file<br />
will be named “.sgn”.<br />
31
Step IV<br />
Step IV involves settings that define the UNCSAM input file, with extension *.sgn.<br />
The output variables that you want <strong>to</strong> include in the sensitivity analysis are selected<br />
in the listbox. For each <strong>of</strong> the selected outputs, the parameter name that will be<br />
written <strong>to</strong> the *.sgn file must also be specified. The result will be a space-separated<br />
list, with the same number <strong>of</strong> entries as the number <strong>of</strong> selected outputs.<br />
The selected output variables are read from the MACRO output file after the<br />
termination <strong>of</strong> each simulation, <strong>and</strong> an entry is written <strong>to</strong> the UNCSAM *.sgn file.<br />
If the selected output is not an accumulated variable, the value <strong>of</strong> the variable for<br />
the last time-step <strong>of</strong> the simulation will be used. Note that this step must be carried<br />
out even if you do not intend <strong>to</strong> use UNCSAM for further analysis.<br />
When you click on the but<strong>to</strong>n “Execute”, the simulations will be run in the order in<br />
which they are defined in the parameter variation file. After each simulation, the<br />
output files are moved <strong>to</strong> the specified direc<strong>to</strong>ry <strong>and</strong> an entry is written <strong>to</strong> the *.sgn<br />
file. If an error should occur during the simulation, so that no simulation results are<br />
available, an entry will be written <strong>to</strong> the file ‘parvar.log’ (in the program direc<strong>to</strong>ry)<br />
with the error message, <strong>and</strong> the entry in the *.sgn file will be set <strong>to</strong> ‘-99’ for each <strong>of</strong><br />
the selected variables, <strong>to</strong> indicate missing values. If an error should occur when<br />
trying <strong>to</strong> access the simulation results in the *.bin file, an entry describing the error<br />
will be written <strong>to</strong> the file ‘sgn.log’ (in the program direc<strong>to</strong>ry).<br />
9.3. Analysing the results <strong>of</strong> the Monte Carlo simulations<br />
In order <strong>to</strong> access the analysis <strong>to</strong>ol in UNCSAM, click on “Analyze” under “Tools-<br />
> Monte Carlo”. A file prefix needs <strong>to</strong> be specified. This is the same prefix<br />
specified when sampling the parameter values, which should also be the prefix <strong>of</strong><br />
32
the UNCSAM *.sgn file. Make sure that the UNCSAM programs SIMGEN,<br />
UNCERT <strong>and</strong> TABREG are in the MACRO 5.0 direc<strong>to</strong>ry. These programs are<br />
normally placed in the program direc<strong>to</strong>ry during installation <strong>and</strong> are executed when<br />
you click on 'Analyze'. The *.sgn (simulation results) <strong>and</strong> *.sam (sampled<br />
parameter values) files must also be present in the program direc<strong>to</strong>ry.<br />
After execution <strong>of</strong> SIMGEN <strong>and</strong> UNCERT, the program TABREG is launched that<br />
requires some input from the user in order <strong>to</strong> determine what results <strong>to</strong> display.<br />
The results are s<strong>to</strong>red in a *.reg file that can be viewed from within <strong>MACRO5.0</strong>.<br />
Note that the UNCSAM s<strong>of</strong>tware package includes additional programs for<br />
analysis <strong>and</strong> presentation <strong>of</strong> the results <strong>of</strong> a Monte Carlo analysis. These can be run<br />
manually outside the MACRO shell.<br />
33
10. References<br />
Abbaspour, K.C., van Genuchten, M.T., Schulin, R. & Schläppi, E., 1997. A<br />
sequential uncertainty domain inverse procedure for estimating subsurface <strong>flow</strong><br />
<strong>and</strong> transport parameters. Water Resources Research, 33: 1879-1892.<br />
Güntner, A., Olsson, J., Calver, A. & Gannon, B. 2001. Cascade-based<br />
disaggregation <strong>of</strong> continuous rainfall time series: the influence <strong>of</strong> climate.<br />
Hydrology <strong>and</strong> Earth System Sciences, 5, 145-164.<br />
Hollis, J.M. & Woods, S.M. 1989. The measurement <strong>and</strong> estimation <strong>of</strong> saturated soil<br />
hydraulic conductivity. SSLRC Research Report, Cranfield Univ., U.K., 19 pp.<br />
Janssen, P.H.M., P.S.C. Heuberger & R. S<strong>and</strong>ers. 1992. UNCSAM 1.1: a s<strong>of</strong>tware<br />
package for sensitivity <strong>and</strong> uncertainty analysis. Report nr. 959101004,<br />
National Institute <strong>of</strong> Public Health <strong>and</strong> Environmental Protection (RIVM),<br />
Bilthoven, Netherl<strong>and</strong>s.<br />
Jarvis, N.J., Hollis, J.M., Nicholls, P.H., Mayr, T. & Evans, S.P. 1997. MACRO_DB:<br />
a decision-support <strong>to</strong>ol <strong>to</strong> assess the fate <strong>and</strong> mobility <strong>of</strong> pesticides in soils.<br />
Environmental Modelling & S<strong>of</strong>tware, 12, 251-265.<br />
Jarvis, N.J., Zavattaro, L., Rajkai, K. Reynolds, W.D. Olsen, P-A., McGechan, M.,<br />
Mecke, M., Mohanty, B., Leeds-Harrison, P.B. & Jacques, D. 2002. Indirect<br />
estimation <strong>of</strong> near-saturated hydraulic conductivity from readily available soil<br />
information. Geoderma, 108, 1-17.<br />
Larsbo, M. & Jarvis, N.J. 2003. <strong>MACRO5.0</strong>. A <strong>model</strong> <strong>of</strong> <strong>water</strong> <strong>flow</strong> <strong>and</strong> <strong>solute</strong><br />
transport in macroporous soil. Technical description. Studies in the<br />
Biogeophysical Environment, Emergo 2003:6, Department <strong>of</strong> Soil Sciences,<br />
SLU, Uppsala, Sweden, 48 pp.<br />
Olsson, J. 1998. Evaluation <strong>of</strong> a scaling cascade <strong>model</strong> for temporal rainfall<br />
disaggregation. Hydrology <strong>and</strong> Earth System Sciences, 2, 19-30.<br />
Stenemo, F. & Jarvis, N.J. 2002. Guidance document <strong>and</strong> manual for the use <strong>of</strong><br />
MACRO_DB v.2.0. Unpublished report (http://www.mv.slu.se/bgf/defeng.htm).<br />
Wösten, J.H.M., Lilly, A., Nemes, A., Le Bas, C. 1998. Using existing soil data <strong>to</strong><br />
derive hydraulic parameters for simulation <strong>model</strong>s in environmental studies <strong>and</strong><br />
in l<strong>and</strong> use planning. Report 156, Win<strong>and</strong> Staring Centre, SC-DLO, Wageningen,<br />
Netherl<strong>and</strong>s, 106 pp.<br />
34
Appendix 1: Pedotransfer functions<br />
The saturated <strong>water</strong> content θ s (‘TPORV’) <strong>and</strong> the shape parameters (‘ALPHA’ <strong>and</strong><br />
‘N’) <strong>of</strong> the van Genuchten soil <strong>water</strong> retention curve are estimated using the<br />
pedotransfer functions developed for European soils by Wösten et al. (1998, Table<br />
11, page 73). The pressure potential defining the boundary between micropores <strong>and</strong><br />
macropores (‘CTEN’) is fixed at –10 cm. The <strong>water</strong> contents at pressure potentials<br />
<strong>of</strong> –10 cm (‘XMPOR’, saturated micropore <strong>water</strong> content) <strong>and</strong> –15000 cm<br />
(‘WILT’, wilting point) are calculated using the calculated values <strong>of</strong> the <strong>water</strong><br />
retention parameters.<br />
The effective diffusion pathlength (‘ASCALE’) is estimated from the FAO soil<br />
structural description using the method described in Jarvis et al. (1997, Table 8).<br />
The saturated micropore hydraulic conductivity (i.e. ‘KSM’, the conductivity at a<br />
pressure potential <strong>of</strong> –10 cm) is calculated as a function <strong>of</strong> the geometric mean<br />
particle size (Jarvis et al., 2002, equation 6 in Table 2).<br />
The <strong>to</strong>tal saturated hydraulic conductivity (‘KSATMIN’ in mm/h) is calculated<br />
from the texture, soil effective porosity <strong>and</strong> FAO structural development using a<br />
modified version <strong>of</strong> the algorithm proposed by Hollis <strong>and</strong> Woods (1989). This<br />
algorithm is also included in version 2 <strong>of</strong> MACRO_DB (Stenemo <strong>and</strong> Jarvis,<br />
2002). The code for this algorithm, which in this modified form is completely<br />
untested, is presented on the following page.<br />
35
Algorithm used <strong>to</strong> calculate saturated hydraulic conductivity<br />
ac = Saturated <strong>water</strong> content minus <strong>water</strong> content at a pressure head <strong>of</strong> -50 cm (%)<br />
clay = clay content (%)<br />
silt = silt content (%)<br />
s1= strength <strong>of</strong> structural development (FAO)<br />
If clay < 16 And silt + (clay * 2) < 31 Then<br />
If ac < 7.5 Then<br />
ksatmin = (0.4535 * ac ^ 1.03423) * (10 / 24#)<br />
Else<br />
ksatmin = (8.03578 - (6.7707 * ac) + (0.833 * ac ^ 2)) * (10 / 24#)<br />
End If<br />
Else<br />
If s1 = "none" Then<br />
xfac<strong>to</strong>r = 1<br />
ElseIf s1 = "weak" Then<br />
If ac > 10 Then<br />
xfac<strong>to</strong>r = 10 ^ 0.5<br />
Else<br />
xfac<strong>to</strong>r = 10 ^ (0.5 + (0.03 * (10 - ac)))<br />
End If<br />
ElseIf s1 = "moderate" Then<br />
If ac > 10 Then<br />
xfac<strong>to</strong>r = 10 ^ 0.7<br />
Else<br />
xfac<strong>to</strong>r = 10 ^ (0.7 + (0.05 * (10 - ac)))<br />
End If<br />
Else<br />
If ac > 10 Then<br />
xfac<strong>to</strong>r = 10<br />
Else<br />
xfac<strong>to</strong>r = 10 ^ (1 + (0.1 * (10 - ac)))<br />
End If<br />
End If<br />
If ac < 4# Then<br />
ksatmin = ((0.14143 * Exp(0.46944 * ac)) * (10 / 24#)) * xfac<strong>to</strong>r<br />
Else<br />
ksatmin(i) = ((5.8521 - (5.4125 * ac) + (1.05138 * ac ^ 2)) * (10 / 24#)) * xfac<strong>to</strong>r<br />
End If<br />
36
Appendix 2: Useful comm<strong>and</strong>s in PG<br />
L ( = List)<br />
L1 List the variable descriptions (with max. <strong>and</strong> min.values)<br />
L3 List the variable values for each output time step<br />
P ( = Plot)<br />
P2 Time series<br />
P5 Depth pr<strong>of</strong>ile<br />
C ( = Create new files)<br />
C1 Perform calculations <strong>and</strong> transformations<br />
C6 Combine two files with different variables (i.e. simulation results <strong>and</strong> data)<br />
C7 Combine two files with the same variables but different periods<br />
G ( = General utilities)<br />
G4 Read in new .BIN file<br />
G7 General settings (i.e. define plotting period)<br />
E ( = exit from program)<br />
E2 log file deleted<br />
37
Division <strong>of</strong> Environmental Physics<br />
Department <strong>of</strong> Soil Sciences<br />
Swedish University <strong>of</strong> Agricultural Sciences<br />
List <strong>of</strong> publications in Emergo<br />
2003:1 Holmberg, H. Me<strong>to</strong>dutveckling för utvärdering av simulerings<strong>model</strong>ler med hjälp av<br />
fluorescer<strong>and</strong>e ämnen (Development <strong>of</strong> methods <strong>to</strong> evaluate simulation <strong>model</strong>s using<br />
fluorescent dye tracers). M.Sc. thesis. 50 pages.<br />
2003:2 Olsson, C. Översvämningsåtgärder i Emån- simulering i Mike 11 <strong>model</strong>len (Effects <strong>of</strong><br />
proposed embankments along the river Emån- Simulation in the Mike 11 <strong>model</strong>). M.Sc. thesis.<br />
34 pages.<br />
2003:3 Gärdenäs, A. Eckersten, H. & Lillemägi, M. Modeling long-term effects <strong>of</strong> N fertilization <strong>and</strong><br />
N deposition on the N balance <strong>of</strong> forest st<strong>and</strong>s in Sweden. 30 pages.<br />
2003:4 Jarvis, N. Hanze, K. Larsbo, M. Stenemo, F. Persson, L. Roulier, S. Alavi, G. Gärdenäs, A. &<br />
Rönngren, J. Scenario development <strong>and</strong> parameterization for pesticide exposure assessments<br />
for Swedish ground<strong>water</strong>. 26 pages. ISBN: 91-576-6588-5<br />
2003:5 Eckersten, H., Gärdenäs, A. & Lewan, E. (Eds.) Bioge<strong>of</strong>ysik – en introduktion (Environmental<br />
physics – an introduction). 141 pages. ISBN: 91-576-6591-5<br />
2003:6 Larsbo, M & Jarvis, N. <strong>MACRO5.0</strong>. A <strong>model</strong> <strong>of</strong> <strong>water</strong> <strong>flow</strong> <strong>and</strong> <strong>solute</strong> transport in<br />
macroporous soil. Technical description. 47 pages. ISBN: 91-576-6592-3<br />
2003:7 Nylund, E. Cadmium uptake in willow (Salix viminalis L.) <strong>and</strong> spring wheat (Triticum<br />
aestivum L.) in relation <strong>to</strong> plant growth <strong>and</strong> Cd concentration in soil solution. M.Sc. thesis. 33<br />
pages.<br />
2003:8 Strömqvist, J. Leaching <strong>of</strong> fungicides from golf greens: Simulation <strong>and</strong> risk assessment. M.Sc.<br />
thesis. 41 pages<br />
2003:9 Blombäck, K, Str<strong>and</strong>berg, M. & Lundström, L. Det organiska materialets betydelse för<br />
markens biologiska aktivitet och gräsets etablering och tillväxt i en golfgreen (The influence <strong>of</strong><br />
soil organic matter on soil microbial activity <strong>and</strong> grass establishment <strong>and</strong> growth in a putting<br />
green).<br />
2003:10 Stenemo, F & Jarvis, N. <strong>Users</strong> <strong>guide</strong> <strong>to</strong> <strong>MACRO5.0</strong>, a <strong>model</strong> <strong>of</strong> <strong>water</strong> <strong>flow</strong> <strong>and</strong> <strong>solute</strong> transport<br />
in macroporous soil. ISBN: 91-576-6610-5.<br />
38