

Institutional Equities - Online Share Trading
Institutional Equities - Online Share Trading
Institutional Equities - Online Share Trading

Create successful ePaper yourself
Turn your PDF publications into a flip-book with our unique Google optimized e-Paper software.
<strong>Institutional</strong> <strong>Equities</strong><br />
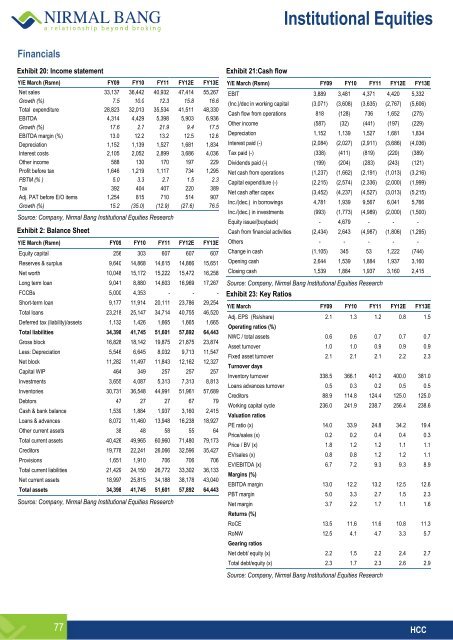
Financials<br />
Exhibit 20: Income statement<br />
Y/E March (Rsmn) FY09 FY10 FY11 FY12E FY13E<br />
Net sales 33,137 36,442 40,932 47,414 55,267<br />
Growth (%) 7.5 10.0 12.3 15.8 16.6<br />
Total expenditure 28,823 32,013 35,534 41,511 48,330<br />
EBITDA 4,314 4,429 5,398 5,903 6,936<br />
Growth (%) 17.6 2.7 21.9 9.4 17.5<br />
EBITDA margin (%) 13.0 12.2 13.2 12.5 12.6<br />
Depreciation 1,152 1,139 1,527 1,681 1,834<br />
Interest costs 2,105 2,052 2,899 3,686 4,036<br />
Other income 588 130 170 197 229<br />
Profit before tax 1,646 1,219 1,117 734 1,295<br />
PBTM (% ) 5.0 3.3 2.7 1.5 2.3<br />
Tax 392 404 407 220 389<br />
Adj. PAT before E/O items 1,254 815 710 514 907<br />
Growth (%) 15.2 (35.0) (12.9) (27.6) 76.5<br />
Source: Company, Nirmal Bang <strong>Institutional</strong> <strong>Equities</strong> Research<br />
Exhibit 2: Balance Sheet<br />
Y/E March (Rsmn) FY09 FY10 FY11 FY12E FY13E<br />
Equity capital 256 303 607 607 607<br />
Reserves & surplus 9,640 14,868 14,615 14,866 15,651<br />
Net worth 10,048 15,172 15,222 15,472 16,258<br />
Long term loan 9,041 8,880 14,603 16,969 17,267<br />
FCCBs 5,000 4,353 - - -<br />
Short-term loan 9,177 11,914 20,111 23,786 29,254<br />
Total loans 23,218 25,147 34,714 40,755 46,520<br />
Deferred tax (liability)/assets 1,132 1,426 1,665 1,665 1,665<br />
Total liabilities 34,398 41,745 51,601 57,892 64,443<br />
Gross block 16,828 18,142 19,875 21,875 23,874<br />
Less: Depreciation 5,546 6,645 8,032 9,713 11,547<br />
Net block 11,282 11,497 11,843 12,162 12,327<br />
Capital WIP 464 349 257 257 257<br />
Investments 3,655 4,087 5,313 7,313 8,813<br />
Inventories 30,731 36,548 44,991 51,961 57,689<br />
Debtors 47 27 27 67 79<br />
Cash & bank balance 1,539 1,884 1,937 3,160 2,415<br />
Loans & advances 8,072 11,460 13,948 16,238 18,927<br />
Other current assets 38 48 58 55 64<br />
Total current assets 40,426 49,965 60,960 71,480 79,173<br />
Creditors 19,778 22,241 26,066 32,596 35,427<br />
Provisions 1,651 1,910 706 706 706<br />
Total current liabilities 21,429 24,150 26,772 33,302 36,133<br />
Net current assets 18,997 25,815 34,188 38,178 43,040<br />
Total assets 34,398 41,745 51,601 57,892 64,443<br />
Source: Company, Nirmal Bang <strong>Institutional</strong> <strong>Equities</strong> Research<br />
Exhibit 21:Cash flow<br />
Y/E March (Rsmn) FY09 FY10 FY11 FY12E FY13E<br />
EBIT 3,889 3,481 4,371 4,420 5,332<br />
(Inc.)/dec in working capital (3,071) (3,608) (3,635) (2,767) (5,606)<br />
Cash flow from operations 818 (128) 736 1,652 (275)<br />
Other income (587) (32) (441) (197) (229)<br />
Depreciation 1,152 1,139 1,527 1,681 1,834<br />
Interest paid (-) (2,084) (2,027) (2,911) (3,686) (4,036)<br />
Tax paid (-) (338) (411) (819) (220) (389)<br />
Dividends paid (-) (199) (204) (283) (243) (121)<br />
Net cash from operations (1,237) (1,662) (2,191) (1,013) (3,216)<br />
Capital expenditure (-) (2,215) (2,574) (2,336) (2,000) (1,999)<br />
Net cash after capex (3,452) (4,237) (4,527) (3,013) (5,215)<br />
Inc./(dec.) in borrowings 4,781 1,939 9,567 6,041 5,766<br />
Inc./(dec.) in investments (993) (1,773) (4,989) (2,000) (1,500)<br />
Equity issue/(buyback) - 4,679 - - -<br />
Cash from financial activities (2,434) 2,643 (4,987) (1,806) (1,295)<br />
Others - - - - -<br />
Change in cash (1,105) 345 53 1,222 (744)<br />
Opening cash 2,644 1,539 1,884 1,937 3,160<br />
Closing cash 1,539 1,884 1,937 3,160 2,415<br />
Source: Company, Nirmal Bang <strong>Institutional</strong> <strong>Equities</strong> Research<br />
Exhibit 23: Key Ratios<br />
Y/E March FY09 FY10 FY11 FY12E FY13E<br />
Adj. EPS (Rs/share) 2.1 1.3 1.2 0.8 1.5<br />
Operating ratios (%)<br />
NWC / total assets 0.6 0.6 0.7 0.7 0.7<br />
Asset turnover 1.0 1.0 0.9 0.9 0.9<br />
Fixed asset turnover 2.1 2.1 2.1 2.2 2.3<br />
Turnover days<br />
Inventory turnover 338.5 366.1 401.2 400.0 381.0<br />
Loans advances turnover 0.5 0.3 0.2 0.5 0.5<br />
Creditors 88.9 114.8 124.4 125.0 125.0<br />
Working capital cycle 236.0 241.9 238.7 256.4 238.6<br />
Valuation ratios<br />
PE ratio (x) 14.0 33.9 24.8 34.2 19.4<br />
Price/sales (x) 0.2 0.2 0.4 0.4 0.3<br />
Price / BV (x) 1.8 1.2 1.2 1.1 1.1<br />
EV/sales (x) 0.8 0.8 1.2 1.2 1.1<br />
EV/EBITDA (x) 6.7 7.2 9.3 9.3 8.9<br />
Margins (%)<br />
EBITDA margin 13.0 12.2 13.2 12.5 12.6<br />
PBT margin 5.0 3.3 2.7 1.5 2.3<br />
Net margin 3.7 2.2 1.7 1.1 1.6<br />
Returns (%)<br />
RoCE 13.5 11.6 11.6 10.8 11.3<br />
RoNW 12.5 4.1 4.7 3.3 5.7<br />
Gearing ratios<br />
Net debt/ equity (x) 2.2 1.5 2.2 2.4 2.7<br />
Total debt/equity (x) 2.3 1.7 2.3 2.6 2.9<br />
Source: Company, Nirmal Bang <strong>Institutional</strong> <strong>Equities</strong> Research<br />
77 HCC


