

Institutional Equities - Online Share Trading
Institutional Equities - Online Share Trading
Institutional Equities - Online Share Trading

Create successful ePaper yourself
Turn your PDF publications into a flip-book with our unique Google optimized e-Paper software.
<strong>Institutional</strong> <strong>Equities</strong><br />
Financials<br />
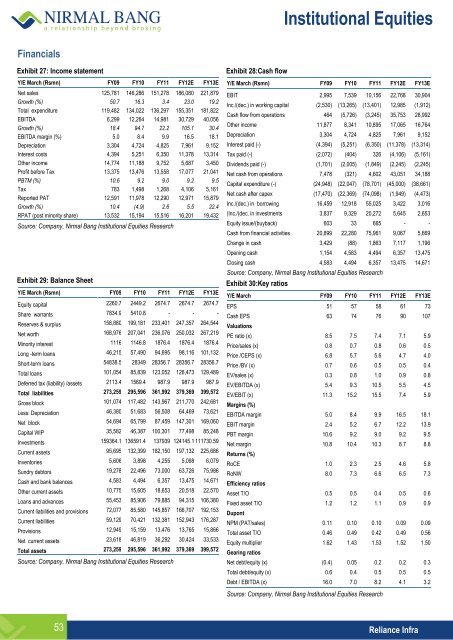
Exhibit 27: Income statement<br />
Y/E March (Rsmn) FY09 FY10 FY11 FY12E FY13E<br />
Net sales 125,781 146,286 151,278 186,080 221,879<br />
Growth (%) 50.7 16.3 3.4 23.0 19.2<br />
Total expenditure 119,482 134,022 136,297 155,351 181,822<br />
EBITDA 6,299 12,264 14,981 30,729 40,056<br />
Growth (%) 18.4 94.7 22.2 105.1 30.4<br />
EBITDA margin (%) 5.0 8.4 9.9 16.5 18.1<br />
Depreciation 3,304 4,724 4,825 7,961 9,152<br />
Interest costs 4,394 5,251 6,350 11,378 13,314<br />
Other income 14,774 11,188 9,752 5,687 3,450<br />
Profit before Tax 13,375 13,476 13,558 17,077 21,041<br />
PBTM (%) 10.6 9.2 9.0 9.2 9.5<br />
Tax 783 1,498 1,268 4,106 5,161<br />
Reported PAT 12,591 11,978 12,290 12,971 15,879<br />
Growth (%) 10.4 (4.9) 2.6 5.5 22.4<br />
RPAT (post minority share) 13,532 15,194 15,516 16,201 19,432<br />
Source: Company, Nirmal Bang <strong>Institutional</strong> <strong>Equities</strong> Research<br />
Exhibit 29: Balance Sheet<br />
Y/E March (Rsmn) FY09 FY10 FY11 FY12E FY13E<br />
Equity capital 2260.7 2449.2 2674.7 2674.7 2674.7<br />
<strong>Share</strong> warrants 7834.9 5410.8 - - -<br />
Reserves & surplus 158,880 199,181 233,401 247,357 264,544<br />
Net worth 168,976 207,041 236,076 250,032 267,219<br />
Minority interest 1116 1146.8 1876.4 1876.4 1876.4<br />
Long -term loans 46,215 57,490 94,695 98,116 101,132<br />
Short-term loans 54838.5 28349 28356.7 28356.7 28356.7<br />
Total loans 101,054 85,839 123,052 126,473 129,489<br />
Deferred tax (liability) /assets 2113.4 1569.4 987.9 987.9 987.9<br />
Total liabilities 273,259 295,596 361,992 379,369 399,572<br />
Gross block 101,074 117,482 143,967 211,770 242,681<br />
Less: Depreciation 46,380 51,683 56,508 64,469 73,621<br />
Net block 54,694 65,799 87,459 147,301 169,060<br />
Capital WIP 35,582 46,387 100,301 77,498 85,248<br />
Investments 159364.1 136591.4 137939 124145.1 111730.59<br />
Current assets 95,695 132,399 182,150 197,132 225,686<br />
Inventories 5,606 3,898 4,255 5,098 6,079<br />
Sundry debtors 19,278 22,496 73,000 63,726 75,986<br />
Cash and bank balances 4,583 4,494 6,357 13,475 14,671<br />
Other current assets 10,775 15,605 18,653 20,518 22,570<br />
Loans and advances 55,453 85,906 79,885 94,315 106,380<br />
Current liabilities and provisions 72,077 85,580 145,857 166,707 192,153<br />
Current liabilities 59,129 70,421 132,381 152,943 176,287<br />
Provisions 12,949 15,159 13,476 13,765 15,866<br />
Net current assets 23,618 46,819 36,292 30,424 33,533<br />
Total assets 273,259 295,596 361,992 379,369 399,572<br />
Source: Company, Nirmal Bang <strong>Institutional</strong> <strong>Equities</strong> Research<br />
Exhibit 28:Cash flow<br />
Y/E March (Rsmn) FY09 FY10 FY11 FY12E FY13E<br />
EBIT 2,995 7,539 10,156 22,768 30,904<br />
Inc./(dec.) in working capital (2,530) (13,265) (13,401) 12,985 (1,912)<br />
Cash flow from operations 464 (5,726) (3,245) 35,753 28,992<br />
Other income 11,877 8,341 10,895 17,065 16,764<br />
Depreciation 3,304 4,724 4,825 7,961 9,152<br />
Interest paid (-) (4,394) (5,251) (6,350) (11,378) (13,314)<br />
Tax paid (-) (2,072) (404) 326 (4,106) (5,161)<br />
Dividends paid (-) (1,701) (2,005) (1,849) (2,245) (2,245)<br />
Net cash from operations 7,478 (321) 4,602 43,051 34,188<br />
Capital expenditure (-) (24,948) (22,047) (78,701) (45,000) (38,661)<br />
Net cash after capex (17,470) (22,369) (74,098) (1,949) (4,473)<br />
Inc./(dec.) in borrowing 16,459 12,918 55,025 3,422 3,016<br />
(Inc./(dec. in investments 3,837 9,329 20,272 5,645 2,653<br />
Equity issue/(buyback) 603 33 665 - -<br />
Cash from financial activities 20,899 22,280 75,961 9,067 5,669<br />
Change in cash 3,429 (88) 1,863 7,117 1,196<br />
Opening cash 1,154 4,583 4,494 6,357 13,475<br />
Closing cash 4,583 4,494 6,357 13,475 14,671<br />
Source: Company, Nirmal Bang <strong>Institutional</strong> <strong>Equities</strong> Research<br />
Exhibit 30:Key ratios<br />
Y/E March FY09 FY10 FY11 FY12E FY13E<br />
EPS 51 57 58 61 73<br />
Cash EPS 63 74 76 90 107<br />
Valuations<br />
PE ratio (x) 8.5 7.5 7.4 7.1 5.9<br />
Price/sales (x) 0.8 0.7 0.8 0.6 0.5<br />
Price /CEPS (x) 6.8 5.7 5.6 4.7 4.0<br />
Price /BV (x) 0.7 0.6 0.5 0.5 0.4<br />
EV/sales (x) 0.3 0.8 1.0 0.9 0.8<br />
EV/EBITDA (x) 5.4 9.3 10.5 5.5 4.5<br />
EV/EBIT (x) 11.3 15.2 15.5 7.4 5.9<br />
Margins (%)<br />
EBITDA margin 5.0 8.4 9.9 16.5 18.1<br />
EBIT margin 2.4 5.2 6.7 12.2 13.9<br />
PBT margin 10.6 9.2 9.0 9.2 9.5<br />
Net margin 10.8 10.4 10.3 8.7 8.8<br />
Returns (%)<br />
RoCE 1.0 2.3 2.5 4.6 5.8<br />
RoNW 8.0 7.3 6.6 6.5 7.3<br />
Efficiency ratios<br />
Asset T/O 0.5 0.5 0.4 0.5 0.6<br />
Fixed asset T/O 1.2 1.2 1.1 0.9 0.9<br />
Dupont<br />
NPM (PAT/sales) 0.11 0.10 0.10 0.09 0.09<br />
Total asset T/O 0.46 0.49 0.42 0.49 0.56<br />
Equity multiplier 1.62 1.43 1.53 1.52 1.50<br />
Gearing ratios<br />
Net debt/equity (x) (0.4) 0.05 0.2 0.2 0.3<br />
Total debt/equity (x) 0.6 0.4 0.5 0.5 0.5<br />
Debt / EBITDA (x) 16.0 7.0 8.2 4.1 3.2<br />
Source: Company, Nirmal Bang <strong>Institutional</strong> <strong>Equities</strong> Research<br />
53 Reliance Infra


