Measurement of the Osmotic Properties of Thin Polymer Films and ...
Measurement of the Osmotic Properties of Thin Polymer Films and ...
Measurement of the Osmotic Properties of Thin Polymer Films and ...

You also want an ePaper? Increase the reach of your titles
YUMPU automatically turns print PDFs into web optimized ePapers that Google loves.
988 Biomacromolecules 2005, 6, 988-993<br />
<strong>Measurement</strong> <strong>of</strong> <strong>the</strong> <strong>Osmotic</strong> <strong>Properties</strong> <strong>of</strong> <strong>Thin</strong> <strong>Polymer</strong> <strong>Films</strong><br />
<strong>and</strong> Biological Tissue Samples<br />
Ferenc Horkay,* Iren Horkayne-Szakaly, <strong>and</strong> Peter J. Basser<br />
Section on Tissue Biophysics <strong>and</strong> Biomimetics, Laboratory <strong>of</strong> Integrative <strong>and</strong> Medical Biophysics, NICHD,<br />
National Institutes <strong>of</strong> Health, 13 South Drive, Be<strong>the</strong>sda, Maryl<strong>and</strong> 20892<br />
Received October 22, 2004; Revised Manuscript Received December 15, 2004<br />
A new type <strong>of</strong> micro-osmometer is described in which water absorption <strong>of</strong> small tissue samples is measured<br />
by a quartz crystal microbalance (QCM). The swelling <strong>of</strong> <strong>the</strong> sample deposited on <strong>the</strong> surface <strong>of</strong> a quartz<br />
crystal is determined by monitoring <strong>the</strong> change in resonance frequency <strong>of</strong> <strong>the</strong> quartz sensor as a function <strong>of</strong><br />
<strong>the</strong> vapor pressure in <strong>the</strong> surrounding environment. The measurement principle is verified by studying <strong>the</strong><br />
water uptake <strong>of</strong> poly(vinyl alcohol) films. Reasonable agreement is found between <strong>the</strong> results obtained by<br />
<strong>the</strong> QCM-based osmometer <strong>and</strong> previous osmotic pressure measurements made on a similar poly(vinyl<br />
alcohol) sample. The feasibility <strong>of</strong> <strong>the</strong> new method is demonstrated by measuring <strong>the</strong> osmotic response <strong>of</strong><br />
tissue-engineered cartilage samples. It is found that <strong>the</strong> osmotic pressure <strong>of</strong> cartilage substantially increases<br />
with culture time. The present result is consistent with cartilage models, suggesting that <strong>the</strong> proteoglycan<br />
content governs <strong>the</strong> compressive resistance <strong>of</strong> <strong>the</strong> tissue.<br />
Introduction<br />
Precise measurement <strong>of</strong> water uptake from <strong>the</strong> environment<br />
is <strong>of</strong> great significance in a variety <strong>of</strong> contexts. The<br />
physical properties <strong>of</strong> both syn<strong>the</strong>tic <strong>and</strong> biopolymers are<br />
strongly influenced by <strong>the</strong>ir water content. Underst<strong>and</strong>ing<br />
<strong>the</strong> relationship between hydration <strong>and</strong> function is critical<br />
in biology <strong>and</strong> biophysics, as well as in many biotechnological<br />
applications, such as <strong>the</strong> stabilization <strong>of</strong> protein<br />
preparations for pharmaceutical use or food preservation. 1-4<br />
Biological s<strong>of</strong>t tissues swell or shrink in response to<br />
changes in osmotic pressure or composition <strong>of</strong> <strong>the</strong>ir environment.<br />
For example, in articular cartilage, swelling governs<br />
both tissue mechanics <strong>and</strong> function. 5-8 Changes in <strong>the</strong><br />
osmotic swelling pressure <strong>of</strong> cartilage may also serve as an<br />
indicator <strong>of</strong> degenerative joint disease. In <strong>the</strong> initial stage <strong>of</strong><br />
osteoarthrosis, cartilage swelling may be <strong>the</strong> first detectable<br />
macroscopic event, occurring before cartilage erosion <strong>and</strong><br />
loss. 9,10<br />
Studying <strong>the</strong> osmotic properties <strong>of</strong> tissue samples poses<br />
several challenges. Most commercial osmometers have been<br />
developed to investigate homogeneous polymer solutions.<br />
In conventional osmotic pressure measurements <strong>the</strong> minimum<br />
sample size requirement is at least a few hundred microliters.<br />
In general, however, biological specimens are inhomogeneous<br />
<strong>and</strong> exhibit gel-like properties, in addition to <strong>of</strong>ten<br />
being limited in quantity.<br />
To address <strong>the</strong>se issues, we have developed a new microosmometer<br />
that can measure minute amounts <strong>of</strong> water<br />
absorbed by thin polymer films or small tissue samples as a<br />
function <strong>of</strong> <strong>the</strong> water activity in <strong>the</strong> surrounding vapor phase.<br />
The measurement principle is based on <strong>the</strong> high sensitivity<br />
* To whom correspondence should be addressed. Phone: 301 435-7229.<br />
Fax: 301 435-5035. E-mail: horkay@helix.nih.gov.<br />
<strong>of</strong> <strong>the</strong> resonance frequency <strong>of</strong> <strong>the</strong> quartz crystal to small<br />
changes in <strong>the</strong> amount <strong>of</strong> material deposited on its surface<br />
(quartz crystal microbalance, QCM, technique). The polymer-<br />
(or tissue-) coated quartz sensor is placed in an environment<br />
where <strong>the</strong> relative humidity is precisely controlled. The<br />
change in resonant frequency due to water uptake <strong>of</strong> <strong>the</strong><br />
specimen is measured <strong>and</strong> related to its water content. High<br />
sensitivity mass change measurements allow us to determine<br />
<strong>the</strong> osmotic properties <strong>of</strong> very small samples (
Tissue Osmometer Biomacromolecules, Vol. 6, No. 2, 2005 989<br />
in <strong>the</strong> osmotic behavior may reflect age <strong>and</strong> disease related<br />
changes in <strong>the</strong> tissue structure <strong>and</strong> function. 6-10<br />
First we describe briefly <strong>the</strong> measurement technique <strong>and</strong><br />
<strong>the</strong> basic features <strong>of</strong> <strong>the</strong> apparatus. Then water sorption<br />
measurements made on PVA films are presented. The<br />
equilibrium swelling data are analyzed in terms <strong>of</strong> <strong>the</strong> Flory-<br />
Huggins <strong>the</strong>ory, which is <strong>the</strong> st<strong>and</strong>ard framework for<br />
describing <strong>the</strong> osmotic pressure <strong>of</strong> polymer solutions. 21 The<br />
QCM results are compared with osmotic data obtained by<br />
independent measurements performed on similar PVA<br />
samples. Finally, we report osmotic swelling pressure<br />
measurements made on tissue-engineered cartilage samples<br />
after different culture times.<br />
Experimental Section<br />
QCM. In <strong>the</strong> osmometer <strong>the</strong> mass sensor is a QCM<br />
(QCM-9000, ELCHEMA, Potsdam, NY). 22 In <strong>the</strong> apparatus<br />
a precision piece <strong>of</strong> AT cut quartz crystal is s<strong>and</strong>wiched<br />
between two gold electrodes. The vibration modes excited<br />
by an alternating electric potential result in a transverse<br />
acoustic st<strong>and</strong>ing shear wave pattern in <strong>the</strong> crystal. A rigid<br />
thin film deposited on <strong>the</strong> surface couples to <strong>the</strong> oscillations<br />
<strong>of</strong> <strong>the</strong> crystal <strong>and</strong> alters its resonant frequency. The resonant<br />
frequency <strong>of</strong> <strong>the</strong> quartz crystal is inversely proportional to<br />
<strong>the</strong> thickness. If this thickness is increased by <strong>the</strong> deposition<br />
<strong>of</strong> material, <strong>the</strong> frequency decreases. Sauerbrey 23 showed that<br />
<strong>the</strong> decrease in <strong>the</strong> resonant frequency, ∆f, is proportional<br />
to <strong>the</strong> mass, ∆m, deposited per unit area<br />
∆f ) f dry - f ) (2f 0 2 /Fv)∆m (1)<br />
where f 0 is <strong>the</strong> resonant frequency <strong>of</strong> <strong>the</strong> quartz crystal <strong>and</strong><br />
F <strong>and</strong> v are <strong>the</strong> density <strong>and</strong> shear velocity <strong>of</strong> sound waves<br />
in <strong>the</strong> quartz crystal, respectively.<br />
Measuring <strong>the</strong> electrical response <strong>of</strong> <strong>the</strong> crystal monitors<br />
changes in <strong>the</strong> resonant frequency. The electronics used in<br />
<strong>the</strong> present instrument allow us to measure frequency changes<br />
within 1 Hz. The 10-MHz quartz crystal is suitable for<br />
detecting a mass change ≈ 10 ng/cm 2 , which corresponds<br />
to a thickness <strong>of</strong> approximately a 0.1-nm water layer over<br />
<strong>the</strong> area <strong>of</strong> <strong>the</strong> electrode. This makes <strong>the</strong> QCM an extremely<br />
sensitive technique for measuring very small changes in <strong>the</strong><br />
amounts <strong>of</strong> material deposited on <strong>the</strong> surface <strong>of</strong> <strong>the</strong> crystal.<br />
The vapor sorption measurements are carried out in a<br />
temperature-controlled sample chamber containing NaCl<br />
solution <strong>of</strong> a known water activity. The sample chamber is<br />
placed in a Faraday cage. In <strong>the</strong> prototype apparatus, <strong>the</strong><br />
volume <strong>of</strong> <strong>the</strong> sample chamber is approximately 200 cm 3 ,<br />
suitable to accommodate six quartz crystal electrodes. First<br />
<strong>the</strong> resonant frequency <strong>of</strong> <strong>the</strong> uncoated quartz crystal is<br />
determined. After <strong>the</strong> material (polymer or tissue) is deposited<br />
onto <strong>the</strong> crystal <strong>the</strong> new resonant frequency is measured.<br />
The resonant frequency decreases when <strong>the</strong> polymer absorbs<br />
water (swells) <strong>and</strong> increases when water molecules leave <strong>the</strong><br />
film (deswells). Each experiment begins with a 2-h conditioning<br />
period in air. This conditioning is necessary to<br />
minimize <strong>the</strong> effect <strong>of</strong> <strong>the</strong> prior history <strong>of</strong> <strong>the</strong> sample<br />
(residual volatile components, etc.) on <strong>the</strong> mass changes<br />
Table 1. Biochemical Analysis <strong>of</strong> Tissue-Engineered Cartilage<br />
Constructs<br />
culture time<br />
(days)<br />
collagen<br />
(% wet weight)<br />
glycosaminoglycan<br />
(% wet weight)<br />
measured in <strong>the</strong> actual run. The 2-h period was chosen<br />
arbitrarily <strong>and</strong> may be decreased for certain samples. [In <strong>the</strong><br />
case <strong>of</strong> PVA films, no appreciable differences were observed<br />
between <strong>the</strong> results obtained after 1, 2, <strong>and</strong> 12 h (overnight)<br />
conditioning.] Changing <strong>the</strong> concentration <strong>of</strong> <strong>the</strong> NaCl<br />
solution in <strong>the</strong> sample chamber induces stepwise changes in<br />
<strong>the</strong> water vapor pressure. The response <strong>of</strong> <strong>the</strong> quartz crystal<br />
is monitored until no fur<strong>the</strong>r change in <strong>the</strong> resonant frequency<br />
is detected. The dry weight <strong>of</strong> <strong>the</strong> sample is measured at <strong>the</strong><br />
end <strong>of</strong> each experiment by removing <strong>the</strong> water from <strong>the</strong><br />
sample with dry air.<br />
Sample Preparation. PVA Gel Film. PVA (molecular<br />
weight ) 90 000; degree <strong>of</strong> hydrolysis: 99%) was purchased<br />
from Sigma-Aldrich. The polymer was dissolved in deionized<br />
water at 99 °C.<br />
<strong>Polymer</strong>s from aqueous solutions can be relatively easily<br />
deposited on hydrophilic surfaces using st<strong>and</strong>ard coating<br />
techniques (e.g., drop coating), because <strong>the</strong>y spontaneously<br />
wet <strong>the</strong> surface. Prior to <strong>the</strong> coating process, <strong>the</strong> surface <strong>of</strong><br />
<strong>the</strong> gold electrode was cleaned with Piranha solution (one<br />
part 30% H 2 O 2 in three parts 98% H 2 SO 4 ). The quartz crystal<br />
was immersed in a Piranha solution for 20 min <strong>and</strong> <strong>the</strong>n<br />
was rinsed with deionized water. After drying with nitrogen<br />
<strong>the</strong> gold surface was drop coated with a 0.1% (w/w) PVA<br />
solution.<br />
Cartilage Sample. Cartilage was aseptically harvested from<br />
a chick embryo sternum (16 days old). Chondrocytes were<br />
isolated by digestion with collagenase <strong>and</strong> resuspended in<br />
culture medium (Dulbecco’s modified Eagle’s medium<br />
containing 10% fetal bovine serum, antibiotics, <strong>and</strong> 50 µg/<br />
mL ascorbate). PVA hydrogel disks (diameter, 25 mm;<br />
thickness, 2 mm) were swollen with <strong>the</strong> medium <strong>and</strong> seeded<br />
uniformly with chondrocytes (125 million cells per disk).<br />
The cell-laden hydrogel scaffolds were cultured under static<br />
conditions at 37 °C in a humid environment with 5% CO 2<br />
for 5 weeks. The medium was replaced every 1-2 days.<br />
After each culture period, <strong>the</strong> resulting cartilagenuous<br />
tissue was gently removed from <strong>the</strong> surface <strong>of</strong> <strong>the</strong> PVA<br />
scaffold <strong>and</strong> suspended in 0.05% (w/w) PVA solution. The<br />
gold electrode was uniformly coated with <strong>the</strong> suspension.<br />
The role <strong>of</strong> dissolved PVA was to improve adhesion between<br />
<strong>the</strong> tissue <strong>and</strong> <strong>the</strong> gold surface.<br />
For biochemical assays cartilage samples taken after<br />
different culture times were digested by papain <strong>and</strong> analyzed<br />
to determine <strong>the</strong> total DNA content, 24 total sulfated glycosaminoglycan<br />
content, 25 <strong>and</strong> total collagen content 26 (based<br />
on hydroxyproline). Typical results <strong>of</strong> <strong>the</strong> biochemical<br />
analysis 27 are shown in Table 1.<br />
Results <strong>and</strong> Discussion<br />
DNA<br />
(µg/mg wet weight)<br />
10 0.18 ( 0.04 1.1 ( 0.2 0.46 ( 0.06<br />
20 0.33 ( 0.07 1.4 ( 0.3 0.49 ( 0.06<br />
30 0.56 ( 0.15 1.8 ( 0.3 0.67 ( 0.07<br />
When <strong>the</strong> surface <strong>of</strong> <strong>the</strong> crystal is coated with polymer<br />
<strong>the</strong> resonant frequency is decreased. The Sauerbrey equation
990 Biomacromolecules, Vol. 6, No. 2, 2005 Horkay et al.<br />
Figure 1. Water uptake, ∆m, as a function <strong>of</strong> time for PVA films <strong>of</strong><br />
different thicknesses. The water vapor pressure was set by a 2%<br />
(w/w) NaCl solution.<br />
predicts that when <strong>the</strong> film is rigidly attached to <strong>the</strong> surface,<br />
<strong>the</strong> change in resonant frequency is linearly proportional to<br />
<strong>the</strong> mass <strong>of</strong> <strong>the</strong> material deposited on <strong>the</strong> electrode. In a<br />
nonideal system, however, many factors (e.g., s<strong>of</strong>tening,<br />
viscoelastic energy dissipation, nonuniform film thickness,<br />
poor adhesion, interfacial slippage) may contribute to <strong>the</strong><br />
deviation from <strong>the</strong> linear response.<br />
Vapor Sorption <strong>Measurement</strong>s on PVA <strong>Films</strong>. Figure<br />
1 shows <strong>the</strong> kinetics <strong>of</strong> water uptake for three PVA films <strong>of</strong><br />
varying thickness. The thicknesses <strong>of</strong> <strong>the</strong>se films, estimated<br />
from <strong>the</strong> weight <strong>and</strong> density <strong>of</strong> <strong>the</strong> dry PVA (F )1.269 g<br />
cm -3 ) are approximately 0.1, 0.2, <strong>and</strong> 0.5 µm, respectively.<br />
In <strong>the</strong> vapor sorption measurements <strong>the</strong> PVA films were<br />
equilibrated with 2% (w/w) NaCl solution. Equilibrium is<br />
attained when <strong>the</strong> water vapor is absorbed <strong>and</strong> desorbed at<br />
<strong>the</strong> same rate. The data indicate that both <strong>the</strong> initial rate <strong>of</strong><br />
water uptake <strong>and</strong> <strong>the</strong> equilibration time increase with <strong>the</strong><br />
thickness <strong>of</strong> <strong>the</strong> polymer film. The initial rapid swelling can<br />
be attributed to <strong>the</strong> larger chemical potential difference across<br />
<strong>the</strong> water vapor/polymer interface. It is likely that in <strong>the</strong><br />
region in contact with <strong>the</strong> vapor phase <strong>the</strong> water concentration<br />
rapidly reaches its equilibrium value. This rapid initial<br />
swelling creates osmotic stresses in <strong>the</strong> film, which are<br />
dissipated by viscous flow. In thick films <strong>the</strong> relaxation <strong>of</strong><br />
<strong>the</strong> high osmotic stress takes longer, that is, <strong>the</strong> equilibration<br />
time increases.<br />
In Figure 2 <strong>the</strong> equilibrium amount <strong>of</strong> water, ∆m, for <strong>the</strong><br />
three PVA films shown in Figure 1, is plotted as a function<br />
<strong>of</strong> increasing <strong>and</strong> decreasing NaCl concentration in <strong>the</strong><br />
equilibrium bath at 25 °C. The results indicate that <strong>the</strong><br />
swelling/deswelling cycle is reversible; that is, <strong>the</strong> amount<br />
<strong>of</strong> water being absorbed into <strong>the</strong> film is <strong>the</strong> same as that<br />
being desorbed for <strong>the</strong> same change in NaCl concentration.<br />
At a constant NaCl concentration <strong>the</strong> water content, ∆m,<br />
increases with <strong>the</strong> thickness <strong>of</strong> <strong>the</strong> film.<br />
It is important to note that <strong>the</strong> rate <strong>of</strong> water vapor uptake<br />
by <strong>the</strong> polymer layer deposited on <strong>the</strong> quartz crystal is<br />
significantly slower than that <strong>of</strong> a free PVA film immersed<br />
in pure water. The diffusion coefficient for PVA is in <strong>the</strong><br />
range 2 × 10 -11 m 2 s -1 . Using this value, <strong>the</strong> equilibration<br />
Figure 2. Equilibrium amount <strong>of</strong> absorbed water, ∆m, as a function<br />
<strong>of</strong> NaCl concentration in <strong>the</strong> equilibrium bath at 25 °C for <strong>the</strong> PVA<br />
samples shown in Figure 1.<br />
Figure 3. PVA volume fraction as a function <strong>of</strong> NaCl concentration<br />
in <strong>the</strong> equilibrium bath at 25 °C.<br />
time <strong>of</strong> a 1-µm film should be <strong>of</strong> <strong>the</strong> order <strong>of</strong> seconds. The<br />
experimental results indicate that <strong>the</strong> actual equilibration time<br />
is longer than 1-2 h. Presumably, this time can be reduced<br />
somewhat by using a smaller sample chamber, that is, by<br />
reducing <strong>the</strong> distance (diffusion path) between <strong>the</strong> sample<br />
<strong>and</strong> <strong>the</strong> NaCl solution. The large deviation between <strong>the</strong><br />
calculated <strong>and</strong> measured swelling equilibration times, however,<br />
suggests that <strong>the</strong> kinetics <strong>of</strong> swelling <strong>of</strong> <strong>the</strong> PVA layer<br />
attached to <strong>the</strong> crystal surface is not a simple diffusioncontrolled<br />
process. O<strong>the</strong>r effects, such as viscoelastic relaxation<br />
<strong>of</strong> <strong>the</strong> polymer, water diffusion in <strong>the</strong> nonuniformly<br />
swollen matrix, mechanical constraints imposed by <strong>the</strong> solid<br />
surface, <strong>and</strong> so forth, may also be important.<br />
Although <strong>the</strong> ∆m versus c NaCl plots differ for PVA films<br />
<strong>of</strong> various thicknesses <strong>the</strong> equilibrium polymer concentration<br />
in <strong>the</strong> swollen films should be <strong>the</strong> function <strong>of</strong> <strong>the</strong> NaCl<br />
concentration only. In Figure 3 <strong>the</strong> same data are displayed<br />
as in Figure 2 but in a different representation. It can be<br />
seen that at high polymer concentration (volume fraction ><br />
0.6) all data collapse on <strong>the</strong> same curve. Deviation from this
Tissue Osmometer Biomacromolecules, Vol. 6, No. 2, 2005 991<br />
behavior can only be observed in <strong>the</strong> case <strong>of</strong> <strong>the</strong> thickest<br />
PVA film at high water content. In thick films <strong>the</strong> acoustic<br />
wave may decay before it reaches <strong>the</strong> outer boundary <strong>of</strong> <strong>the</strong><br />
film, <strong>and</strong> <strong>the</strong> frequency shift is no longer proportional to<br />
<strong>the</strong> mass change. O<strong>the</strong>r factors such as viscoelastic effects<br />
or poor adhesion may also cause deviation from <strong>the</strong> simple<br />
Sauerbrey expression. We observed that at higher swelling<br />
ratios (>2.5) <strong>the</strong> QCM did not oscillate. When <strong>the</strong> water<br />
activity in <strong>the</strong> surrounding vapor phase was reduced,<br />
however, oscillation was regained. <strong>Measurement</strong>s reported<br />
here were made in <strong>the</strong> concentration range in which <strong>the</strong><br />
change in <strong>the</strong> frequency shift with <strong>the</strong> water activity was<br />
reproducible.<br />
At <strong>the</strong>rmodynamic equilibrium <strong>the</strong> chemical potential <strong>of</strong><br />
<strong>the</strong> solvent (in <strong>the</strong> present case water) is <strong>the</strong> same in <strong>the</strong><br />
coexisting phases, that is,<br />
(∆µ 1 ) sol ) (∆µ 1 ) gel ) (∆µ 1 ) vapor ) RT ln a 1 (2)<br />
where <strong>the</strong> subscripts sol, gel, <strong>and</strong> vapor refer to <strong>the</strong> solution,<br />
gel, <strong>and</strong> vapor phases, respectively, R is <strong>the</strong> gas constant, T<br />
is <strong>the</strong> absolute temperature, <strong>and</strong> a 1 is <strong>the</strong> activity <strong>of</strong> <strong>the</strong> water.<br />
In polymer solutions, <strong>the</strong> chemical potential <strong>of</strong> <strong>the</strong> solvent<br />
is directly related to <strong>the</strong> osmotic pressure ∆µ 1 )-ΠV 1 ,<br />
where V 1 is <strong>the</strong> partial molar volume <strong>of</strong> <strong>the</strong> solvent.<br />
In binary polymer mixtures Π is given by <strong>the</strong> Flory-<br />
Huggins equation 21<br />
Π )-(RT/V 1 )[ln(1 - φ) + φ + χ 0 φ 2 + χ 1 φ 3 ] (3)<br />
where φ is <strong>the</strong> volume fraction <strong>of</strong> <strong>the</strong> polymer <strong>and</strong> χ 0 <strong>and</strong><br />
χ 1 are constants that depend on <strong>the</strong> interactions between <strong>the</strong><br />
polymer <strong>and</strong> <strong>the</strong> solvent molecules.<br />
Because <strong>the</strong> QCM response may reflect uncontrollable<br />
changes in <strong>the</strong> physical (e.g., viscoelastic) properties <strong>of</strong> <strong>the</strong><br />
polymer film, it is important to validate <strong>the</strong> results by<br />
independent techniques. Several methods have been developed<br />
to determine <strong>the</strong> swelling properties <strong>of</strong> polymer films<br />
<strong>and</strong> gels. 28-32 Here we compare <strong>the</strong> QCM results with that<br />
obtained by osmotic deswelling. 19,32 The latter is a simple<br />
<strong>and</strong> powerful technique that has been applied successfully<br />
for a variety <strong>of</strong> syn<strong>the</strong>tic <strong>and</strong> biopolymer systems. In <strong>the</strong><br />
osmotic deswelling experiment <strong>the</strong> sample <strong>of</strong> unknown<br />
osmotic pressure is enclosed in a semipermeable membrane<br />
(dialysis bag) surrounded by a polymer solution <strong>of</strong> known<br />
osmotic pressure. At equilibrium, <strong>the</strong> osmotic pressure <strong>of</strong><br />
<strong>the</strong> sample in <strong>the</strong> dialysis bag is equal to <strong>the</strong> osmotic pressure<br />
exerted by <strong>the</strong> polymer solution outside. The role <strong>of</strong> <strong>the</strong><br />
semipermeable membrane is to prevent <strong>the</strong> penetration <strong>of</strong><br />
<strong>the</strong> polymer molecules from <strong>the</strong> solution into <strong>the</strong> gel. This<br />
technique requires much larger samples (>0.1 g) than <strong>the</strong><br />
QCM (3-4 days).<br />
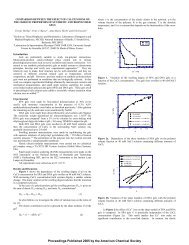
Figure 4 shows <strong>the</strong> dependence <strong>of</strong> <strong>the</strong> osmotic pressure<br />
on <strong>the</strong> PVA volume fraction obtained by <strong>the</strong>se two independent<br />
experimental techniques. The dashed curve is <strong>the</strong><br />
least-squares fit <strong>of</strong> eq 3 to <strong>the</strong> osmotic deswelling data<br />
(triangles). 19 This fit yields for <strong>the</strong> interaction parameter χ 0<br />
) 0.477 <strong>and</strong> χ 1 ) 0.414. The QCM data lie close to <strong>the</strong><br />
extrapolated curve. (Note that <strong>the</strong> QCM experiment probes<br />
Figure 4. Dependence <strong>of</strong> <strong>the</strong> osmotic pressure on <strong>the</strong> volume<br />
fraction <strong>of</strong> <strong>the</strong> PVA. Open symbols, data measured by <strong>the</strong> QCM-based<br />
osmotic technique; filled triangles, data measured by osmotic deswelling.<br />
The dashed curve is <strong>the</strong> least-squares fit <strong>of</strong> eq 3 to <strong>the</strong> data<br />
obtained by osmotic deswelling.<br />
<strong>the</strong> polymer at a higher polymer concentration.) The deviation<br />
from <strong>the</strong> calculated curve at high PVA concentration<br />
(φ > 0.65) may be attributed to higher-order interactions<br />
<strong>and</strong>/or structural changes occurring in <strong>the</strong> PVA film. Increasing<br />
<strong>the</strong> PVA concentration favors association (due to<br />
hydrogen bonding) <strong>and</strong> crystallization. 33 Molecular associations<br />
<strong>and</strong> crystallites act like physical cross-links. Equation<br />
3 is only applicable to un-cross-linked systems at moderate<br />
polymer concentrations.<br />
Vapor Sorption <strong>Measurement</strong>s on Tissue-Engineered<br />
Cartilage. Swelling is known to be critically important in<br />
<strong>the</strong> biomechanical function <strong>of</strong> cartilage, supporting compressive<br />
loads <strong>and</strong> maintaining tissue hydration. 5-10 In light <strong>of</strong><br />
<strong>the</strong> success <strong>of</strong> <strong>the</strong> QCM measurements on PVA films, we<br />
made vapor sorption measurements on tissue-engineered<br />
cartilage samples. Our goal was to demonstrate <strong>the</strong> applicability<br />
<strong>of</strong> <strong>the</strong> QCM-based method for determining <strong>the</strong><br />
osmotic properties <strong>of</strong> biological tissues. It is important to<br />
note that if structural change occurs in <strong>the</strong> tissue sample, it<br />
may affect <strong>the</strong> resonance frequency <strong>of</strong> <strong>the</strong> quartz crystal. 34<br />
In this case <strong>the</strong> frequency shift is no longer proportional to<br />
<strong>the</strong> mass change; that is, <strong>the</strong> Sauerbrey equation cannot be<br />
used.<br />
In general, biological tissues are not homogeneous.<br />
Cartilage consists <strong>of</strong> two major phases: a fluid phase (60-<br />
80% <strong>of</strong> <strong>the</strong> tissue wet weight) <strong>and</strong> a solid matrix, with only<br />
4-5% <strong>of</strong> <strong>the</strong> total tissue volume occupied by chondrocytes<br />
(cartilage cells). 10 The fluid phase is mainly a physiological<br />
electrolyte solution. The solid phase consists <strong>of</strong> proteins<br />
(mainly collagen) <strong>and</strong> proteoglycan molecules. The latter are<br />
immobilized within <strong>the</strong> collagen network. It is generally<br />
assumed that <strong>the</strong> amount <strong>of</strong> proteoglycans governs <strong>the</strong> extent<br />
<strong>of</strong> cartilage swelling. 9,35,36<br />
The QCM technique probes <strong>the</strong> interactions <strong>of</strong> <strong>the</strong> tissue<br />
with <strong>the</strong> electrode surface. To improve <strong>the</strong> adhesion between<br />
<strong>the</strong> tissue sample <strong>and</strong> <strong>the</strong> quartz crystal, we first suspended<br />
<strong>the</strong> tissue in a dilute PVA solution <strong>and</strong> <strong>the</strong>n coated <strong>the</strong>
992 Biomacromolecules, Vol. 6, No. 2, 2005 Horkay et al.<br />
Figure 5. Water uptake <strong>of</strong> tissue-engineered cartilage samples after<br />
different culture times as a function <strong>of</strong> <strong>the</strong> NaCl concentration in <strong>the</strong><br />
bath at 25 °C. The amount <strong>of</strong> water absorbed by <strong>the</strong> PVA matrix is<br />
also shown in <strong>the</strong> figure (open triangles).<br />
electrode with <strong>the</strong> suspension. When <strong>the</strong> coated quartz crystal<br />
is exposed to water vapor both <strong>the</strong> tissue <strong>and</strong> <strong>the</strong> PVA absorb<br />
water. Thus, <strong>the</strong> equilibrium swelling data should be corrected<br />
for <strong>the</strong> amount <strong>of</strong> water absorbed by <strong>the</strong> PVA.<br />
Quartz crystal electrodes coated by known amounts <strong>of</strong><br />
cartilage tissue were equilibrated with water vapor at 25 °C.<br />
The amount <strong>of</strong> absorbed water was determined as a function<br />
<strong>of</strong> <strong>the</strong> NaCl concentration (Figure 5). This figure also shows<br />
<strong>the</strong> water uptake <strong>of</strong> <strong>the</strong> unloaded (cartilage-free) PVA film.<br />
The equilibration time at each NaCl concentration was 2 h.<br />
The complete measurement consisted <strong>of</strong> five sorption/<br />
desorption steps. After <strong>the</strong> fifth step <strong>the</strong> water vapor pressure<br />
was kept constant for 12 h <strong>and</strong> <strong>the</strong>n was reduced in <strong>the</strong> next<br />
steps. It can be seen that even after 12 h <strong>of</strong> equilibration<br />
time <strong>the</strong> amount <strong>of</strong> absorbed water slightly increases,<br />
indicating that <strong>the</strong> system is not in equilibrium. This is also<br />
reflected when comparing <strong>the</strong> absorption <strong>and</strong> desorption data.<br />
When <strong>the</strong> water vapor pressure is decreased <strong>the</strong> amount <strong>of</strong><br />
water leaving <strong>the</strong> tissue should be <strong>the</strong> same as that absorbed<br />
at <strong>the</strong> same water activity when <strong>the</strong> vapor pressure is<br />
increased. It appears that desorption data lie slightly above<br />
<strong>the</strong> absorption data. This hysteresis may be caused by slow<br />
structural or chemical changes (e.g., degradation <strong>of</strong> high<br />
molecular weight proteoglycans) occurring during <strong>the</strong> sorption/desorption<br />
cycle.<br />
The swelling degree, m/m 0 , <strong>of</strong> <strong>the</strong> cartilage was obtained<br />
from <strong>the</strong> measured swollen <strong>and</strong> dry weights <strong>and</strong> <strong>the</strong> known<br />
amount <strong>of</strong> PVA added to <strong>the</strong> tissue<br />
m/m 0 ) (m swollen total - m dry PVA - m water PVA )/(m dry total -<br />
m dry PVA ) (4)<br />
where m total<br />
swollen<br />
<strong>and</strong> m total<br />
dry<br />
are <strong>the</strong> weights <strong>of</strong> <strong>the</strong> swollen<br />
<strong>and</strong> dry samples, respectively, m PVA<br />
dry<br />
is <strong>the</strong> weight <strong>of</strong> <strong>the</strong><br />
dry PVA, <strong>and</strong> m PVA<br />
water<br />
is <strong>the</strong> amount <strong>of</strong> water absorbed by<br />
<strong>the</strong> PVA.<br />
Figure 6. Dependence <strong>of</strong> <strong>the</strong> osmotic swelling pressure on <strong>the</strong><br />
swelling degree in tissue-engineered cartilage samples. The curves<br />
through <strong>the</strong> data points are guides to <strong>the</strong> eye.<br />
The swelling curves determined for cartilage samples after<br />
different culture times (10, 20, <strong>and</strong> 30 days) are shown in<br />
Figure 6. The osmotic pressure <strong>of</strong> <strong>the</strong> cartilage rapidly<br />
decreases with increasing water content. The rate <strong>of</strong> decrease,<br />
[∂Π/∂(m/m 0 )], is proportional to <strong>the</strong> compressive resistance<br />
<strong>of</strong> <strong>the</strong> sample. The results show that <strong>the</strong> compressive<br />
resistance <strong>of</strong> tissue-engineered cartilage increases with culture<br />
time. Cartilage models predict that strong repulsive interaction<br />
between negatively charged proteoglycan molecules<br />
enables cartilage to resist compression under load. The<br />
present results are consistent with this prediction.<br />
Conclusions<br />
In this work, <strong>the</strong> suitability <strong>of</strong> <strong>the</strong> QCM is demonstrated<br />
for studying <strong>the</strong> osmotic properties <strong>of</strong> polymers <strong>and</strong> tissue<br />
samples. The osmotic pressure <strong>of</strong> thin PVA layers deposited<br />
on <strong>the</strong> surface <strong>of</strong> a quartz crystal is determined. Reasonable<br />
agreement is found between <strong>the</strong> results obtained by <strong>the</strong> QCM<br />
<strong>and</strong> those found by macroscopic osmotic pressure observations.<br />
QCM provides a powerful means to measure <strong>the</strong> osmotic<br />
response <strong>of</strong> biological tissue samples. For cartilage, whose<br />
primary function is to absorb shock <strong>and</strong> protect <strong>the</strong> underlying<br />
bone, knowing <strong>the</strong> biomechanical properties is essential.<br />
Preliminary results on tissue-engineered cartilage samples<br />
indicate that <strong>the</strong> compressive resistance <strong>of</strong> <strong>the</strong> neo-cartilage<br />
significantly increases with <strong>the</strong> culture time.<br />
The QCM-based osmotic technique requires considerably<br />
shorter equilibration time than conventional osmometry.<br />
Moreover, <strong>the</strong> small sample requirement <strong>of</strong> <strong>the</strong> QCM (
Tissue Osmometer Biomacromolecules, Vol. 6, No. 2, 2005 993<br />
References <strong>and</strong> Notes<br />
(1) Chong, K. T.; Su, X.; Lee, E. J. D.; O’Shea, S. J. Langmuir 2002,<br />
18, 9932.<br />
(2) Wegener, J.; Seebach, J.; Jansh<strong>of</strong>f, A.; Galla, H. J. Biophys. J. 2000,<br />
78, 2821.<br />
(3) Wang, W. Int. J. Pharm. 1999, 185, 129.<br />
(4) Slade, L.; Levine, H.; Finley, J. W. Food Sci. Technol. 1989, 29, 9.<br />
(5) Hascall, V. C.; Heinegard, D. J. Biol. Chem. 1974, 249, 4242.<br />
(6) Maroudas, A.; Mizrahi, J.; Katz, E. P.; Wachtel, E. J.; Soudry, M. J.<br />
In Articular Cartilage Biochemistry; Kuettner, K., Schleyerbach, R.,<br />
Hascall, V., Eds.; Raven Press: New York, 1987.<br />
(7) Eisenberg, S. R.; Grodzinsky, A. J. J. Orthop. Res. 1985, 3, 148.<br />
(8) Basser, P. J.; Schneiderman, R.; Bank, R. A.; Wachtel, E.; Maroudas,<br />
A. Arch. Biochem. Biophys. 1998, 351, 207.<br />
(9) Maroudas, A. Nature 1976, 260, 808.<br />
(10) Kuettner, K. E. Articular Cartilage <strong>and</strong> Osteoarthritis; Raven<br />
Press: New York, 1992.<br />
(11) Marx, K. A. Biomacromolecules 2003, 4, 1101.<br />
(12) Tjarnhage, T.; Sharp, M. Electrochim. Acta 1994, 39, 623.<br />
(13) Yao, S.; Tan, H.; Zhang, H.; Su, X.; Wei, W. Biotechnol. Prog. 1998,<br />
14, 639-644.<br />
(14) Su, H.; Chong, S.; Thompson, M. Langmuir 1996, 12, 2247-2255.<br />
(15) Smith, A. L.; Shirazi, H. M. J. Therm. Anal. Calorim. 2000,59, 171.<br />
(16) Sugimoto, I.; Nakamura, M.; Ogawa, S.; Seyama, M.; Katoh, T. Sens.<br />
Actuators, B 2000, 64, 216.<br />
(17) Wong, H. C.; Campbell, S. W.; Bhethanabotla, V. R. Fluid Phase<br />
Equilib. 2001, 179, 181.<br />
(18) Horkay, F.; Nagy, M. Acta Chim. Acad. Sci. Hung. 1982, 109, 415.<br />
(19) Horkay, F.; Burchard, W.; Geissler, E.; Hecht, A. M. Macromolecules<br />
1993, 26, 1296.<br />
(20) Horkay, F.; Hecht, A. M.; Geissler, E. Macromolecules 1994, 27,<br />
1795.<br />
(21) Flory, P. J. Principles <strong>of</strong> <strong>Polymer</strong> Chemistry; Cornell University<br />
Press: Ithaca, NY, 1953.<br />
(22) Operational Manual; ELCHEMA: Potsdam, NY, 2000.<br />
(23) Sauerbray, G. Z. Phys. 1959, 155, 206.<br />
(24) Kim, Y. J.; Sah, R. L. Y.; Doong, J. Y. H.; Grodzinsky, A. J. Anal.<br />
Biochem. 1988, 174, 168.<br />
(25) Farndale, R. W.; Buttle, D. J.; Barrett, A. J. Bichim. Biphys. Acta<br />
1986, 883, 173.<br />
(26) Woessner, J. F. Arch. Biochem. Biophys. 1961, 93, 440.<br />
(27) The biochemical analysis <strong>of</strong> tissue engineered cartilage samples was<br />
made by iGORi Analytical Services, Thous<strong>and</strong> Oaks, CA.<br />
(28) Dusek, K.; Prins, W. AdV. Polym. Sci. 1969, 6, 1.<br />
(29) Boyer, K. F. J. Chem. Phys. 1945, 13, 363.<br />
(30) van de Kraats, E. J.; Winkelers, M. A. M.; Potters, J. M.; Prins, W.<br />
Rec. TraV. Chim. 1969, 88, 449.<br />
(31) Gee, G.; Herbert, J. B. M.; Roberts, R. C. <strong>Polymer</strong> 1965, 6,<br />
541.<br />
(32) Horkay, F.; Zrinyi, M. Macromolecules 1982, 15, 1306.<br />
(33) Finch, F. D. Poly(Vinyl alcohol), Basic <strong>Properties</strong> <strong>and</strong> Applications;<br />
Wiley: New York, 1971.<br />
(34) Muratsugu, M.; Romaschin, A. D.; Thompson, M. Anal. Chim. Acta<br />
1997, 342, 23.<br />
(35) Ogston, A. G. In Biological Functions <strong>of</strong> <strong>the</strong> Matrix; Balazs, E. A.,<br />
Ed.; Academic Press: London, 1970.<br />
(36) Khalsa, P. S.; Eisenberg, S. R. J. Biomechanics 1997, 30, 589.<br />
BM049332C