MACHINE LEARNING TECHNIQUES - LASA
MACHINE LEARNING TECHNIQUES - LASA
MACHINE LEARNING TECHNIQUES - LASA

Create successful ePaper yourself
Turn your PDF publications into a flip-book with our unique Google optimized e-Paper software.
79<br />
1 M<br />
The solutions to the dual eigenvalue problem are given by all the eigenvectors α ,..., α with<br />
non-zero eigenvalues λ ,..., λ .<br />
1<br />
M<br />
i i<br />
One Asking can that now the compute eigenvectors the projections v of Cφ<br />
be of normalized, a given query i.e. point v , x v onto = 1 the ∀ ieigenvectors<br />
= 1,. .., M<br />
1 M<br />
i<br />
is equivalent to asking that the dual eigenvectors α ,..., α be such that 1/ λi<br />
= α .<br />
M<br />
M<br />
( ) = ∑ j ( ) ( ) = ∑ j ( )<br />
(5.14)<br />
i i j i j<br />
v , φ x α φ x , φ x α k x , x<br />
j= 1 j=<br />
1<br />
i<br />
v<br />
using:<br />
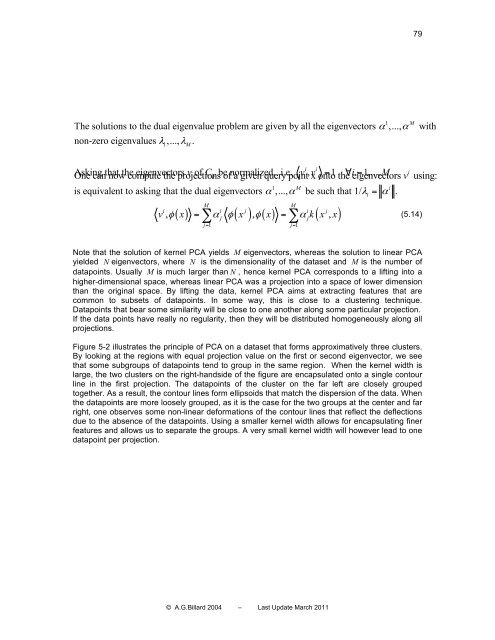
Note that the solution of kernel PCA yields M eigenvectors, whereas the solution to linear PCA<br />
yielded N eigenvectors, where N is the dimensionality of the dataset and M is the number of<br />
datapoints. Usually M is much larger than N , hence kernel PCA corresponds to a lifting into a<br />
higher-dimensional space, whereas linear PCA was a projection into a space of lower dimension<br />
than the original space. By lifting the data, kernel PCA aims at extracting features that are<br />
common to subsets of datapoints. In some way, this is close to a clustering technique.<br />
Datapoints that bear some similarity will be close to one another along some particular projection.<br />
If the data points have really no regularity, then they will be distributed homogeneously along all<br />
projections.<br />
Figure 5-2 illustrates the principle of PCA on a dataset that forms approximatively three clusters.<br />
By looking at the regions with equal projection value on the first or second eigenvector, we see<br />
that some subgroups of datapoints tend to group in the same region. When the kernel width is<br />
large, the two clusters on the right-handside of the figure are encapsulated onto a single contour<br />
line in the first projection. The datapoints of the cluster on the far left are closely grouped<br />
together. As a result, the contour lines form ellipsoids that match the dispersion of the data. When<br />
the datapoints are more loosely grouped, as it is the case for the two groups at the center and far<br />
right, one observes some non-linear deformations of the contour lines that reflect the deflections<br />
due to the absence of the datapoints. Using a smaller kernel width allows for encapsulating finer<br />
features and allows us to separate the groups. A very small kernel width will however lead to one<br />
datapoint per projection.<br />
© A.G.Billard 2004 – Last Update March 2011