MACHINE LEARNING TECHNIQUES - LASA
MACHINE LEARNING TECHNIQUES - LASA
MACHINE LEARNING TECHNIQUES - LASA

You also want an ePaper? Increase the reach of your titles
YUMPU automatically turns print PDFs into web optimized ePapers that Google loves.
SCHOOL OF ENGINEERING<br />
<strong>MACHINE</strong> <strong>LEARNING</strong><br />
<strong>TECHNIQUES</strong><br />
Section Microtechnique<br />
Aude G. Billard<br />
Illustrations based on the<br />
MLdemo Software by Basilio Noris
2<br />
1. I. Introduction .............................................................................................................. 6<br />
1.1 What is Machine Learning? - Definitions ...................................................................... 6<br />
1.1.1 ML Resources: ........................................................................................................... 6<br />
1.2 What is Learning? ........................................................................................................... 7<br />
1.2.1 Taxonomy of Learning Algorithms ........................................................................... 10<br />
1.2.2 Other important terms in machine learning .............................................................. 10<br />
1.2.3 Key features for a good learning system ................................................................. 11<br />
1.2.4 Exercise ................................................................................................................... 12<br />
1.3 Best Practices in ML ..................................................................................................... 12<br />
1.3.1 Training, validation and testing sets ........................................................................ 12<br />
1.3.2 Crossvalidation ........................................................................................................ 13<br />
1.3.3 Performance Measures in ML .................................................................................. 13<br />
1.3.4 In Practice ................................................................................................................ 14<br />
1.4 Focus of this course ..................................................................................................... 14<br />
2. 2 Methods for Correlation Analysis PCA, CCA, ICA .............................................. 16<br />
2.1 Principal Component Analysis .................................................................................... 17<br />
2.1.1 Dimensionality Reduction ........................................................................................ 18<br />
2.1.2 Solving PCA as an optimization under constraint problem ...................................... 20<br />
2.1.3 PCA limitations ........................................................................................................ 21<br />
2.1.4 Projection Pursuit ..................................................................................................... 22<br />
2.1.5 Probabilistic PCA ..................................................................................................... 24<br />
2.2 Canonical Correlation Analysis ................................................................................... 26<br />
2.2.1 CCA for more than two variables ............................................................................. 27<br />
2.2.2 Limitations ................................................................................................................ 27<br />
2.3 Independent Component Analysis .............................................................................. 28<br />
2.3.1 Illustration of ICA ..................................................................................................... 28<br />
2.3.2 Why Gaussian variables are forbidden .................................................................... 31<br />
2.3.3 Definition of ICA ....................................................................................................... 31<br />
2.3.4 Whitening ................................................................................................................. 33<br />
2.3.5 ICA Ambiguities ....................................................................................................... 35<br />
2.3.6 ICA by maximizing non-gaussianity ......................................................................... 35<br />
2.4 Further Readings .......................................................................................................... 38<br />
3. 3 Clustering and Classification ............................................................................... 39<br />
3.1 Clustering Techniques ................................................................................................. 39<br />
3.1.1 Hierarchical Clustering ............................................................................................. 40<br />
3.1.2 K-means clustering .................................................................................................. 45<br />
3.1.3 Soft K-means ........................................................................................................... 47<br />
3.1.4 Clustering with Mixtures of Gaussians ..................................................................... 49<br />
3.1.5 Gaussian Mixture Models ........................................................................................ 51<br />
3.2 Linear Classifiers .......................................................................................................... 56<br />
3.2.1 Linear Discriminant Analysis .................................................................................... 56<br />
3.2.2 Fisher Linear Discriminant ....................................................................................... 57<br />
3.2.3 Mixture of linear classifiers (boosting and bagging) ................................................. 58<br />
3.3 Bayes Classifier ............................................................................................................ 61<br />
3.4 Linear classification with Gaussian Mixture Models ................................................. 62<br />
3.5 Further Readings .......................................................................................................... 63<br />
© A.G.Billard 2004 – Last Update March 2011
3<br />
4. 4 Regression Techniques ........................................................................................ 64<br />
4.1 Linear Regression ......................................................................................................... 64<br />
4.2 Partial Least Square Methods ...................................................................................... 64<br />
4.3 Probabilistic Regression .............................................................................................. 66<br />
4.4 Gaussian Mixture Regression ..................................................................................... 69<br />
4.4.1 One Gaussian Case ................................................................................................ 70<br />
4.4.2 Multi-Gaussian Case ............................................................................................... 71<br />
5. 5 Kernel Methods ...................................................................................................... 73<br />
5.1 The kernel trick ............................................................................................................. 73<br />
5.2 Which kernel, when? .................................................................................................... 75<br />
5.3 Kernel PCA .................................................................................................................... 76<br />
5.4 Kernel CCA .................................................................................................................... 81<br />
5.5 Kernel ICA ...................................................................................................................... 84<br />
5.6 Kernel K-Means ............................................................................................................. 88<br />
5.7 Support Vector Machines ............................................................................................. 90<br />
5.7.1 Support Vector Machine for Linearly Separable Datasets ....................................... 92<br />
5.7.2 Support Vector Machine for Non-linearly Separable Datasets ................................ 96<br />
5.7.3 Non-Linear Support Vector Machines ...................................................................... 97<br />
5.7.4 n-SVM ...................................................................................................................... 98<br />
5.8 Support Vector Regression ......................................................................................... 99<br />
5.8.1 n-SVR .................................................................................................................... 106<br />
5.9 Gaussian Process Regression .................................................................................. 109<br />
5.9.1 What is a Gaussian Process .................................................................................. 109<br />
5.9.2 Equivalence of Gaussian Process Regression and Gaussian Mixture Regression<br />
113<br />
5.9.3 Curse of dimensionality, choice of hyperparameters ............................................. 115<br />
5.10 Gaussian Process Classification .............................................................................. 116<br />
6. 6 Artificial Neural Networks ................................................................................... 120<br />
6.1 Applications of ANN ................................................................................................... 120<br />
6.2 Biological motivation .................................................................................................. 120<br />
6.2.1 The Brain as an Information Processing System ................................................... 120<br />
6.2.2 Neural Networks in the Brain ................................................................................. 121<br />
6.2.3 Neurons and Synapses ......................................................................................... 122<br />
6.2.4 Synaptic Learning .................................................................................................. 122<br />
6.2.5 Summary ............................................................................................................... 123<br />
6.3 Perceptron ................................................................................................................... 124<br />
6.3.1 Learning rule for the Perceptron ............................................................................ 126<br />
6.3.2 Information Theory and the Neuron ....................................................................... 127<br />
6.4 The Backpropagation Learning Rule ........................................................................ 129<br />
6.4.1 The Adaline ............................................................................................................ 130<br />
6.4.2 The Backpropagation Network .............................................................................. 131<br />
6.4.3 The Backpropagation Algorithm ............................................................................ 132<br />
6.5 Willshaw net ................................................................................................................ 133<br />
6.6 Hebbian Learning ........................................................................................................ 134<br />
© A.G.Billard 2004 – Last Update March 2011
4<br />
6.6.1 Weights bounds ..................................................................................................... 135<br />
6.6.2 Weight decay ......................................................................................................... 136<br />
6.6.3 Principal Components ............................................................................................ 137<br />
6.6.4 Oja’s one Neuron Model ........................................................................................ 139<br />
6.6.5 Convergence of the Weights Decay rule ............................................................... 139<br />
6.7 Anti-Hebbian learning ................................................................................................. 140<br />
6.7.1 Foldiak’s models .................................................................................................... 141<br />
6.7.2 CCA Revisited ....................................................................................................... 143<br />
6.7.3 ICA Revisited ......................................................................................................... 145<br />
6.8 The Self-Organizing Map (SOM) ................................................................................ 147<br />
6.8.1 Kohonen Network .................................................................................................. 147<br />
6.8.2 Bayesian self-organizing map ................................................................................ 150<br />
6.9 Static Hopfield Network .............................................................................................. 151<br />
6.9.1 Hopfield Network Structure .................................................................................... 152<br />
6.9.2 Learning Phase ...................................................................................................... 152<br />
6.9.3 Retrieval Phase ..................................................................................................... 153<br />
6.9.4 Capacity of the static Hopfield Network ................................................................. 154<br />
6.9.5 Convergence of the Static Hopfield Network ......................................................... 155<br />
6.10 Continuous Time Hopfield Network and Leaky-Integrator Neurons ...................... 155<br />
7. 7 Markov-Based Models ......................................................................................... 160<br />
7.1 Markov Process .......................................................................................................... 160<br />
7.2 Hidden Markov Models ............................................................................................... 161<br />
7.2.1 Formalism .............................................................................................................. 161<br />
7.2.2 Estimating a HMM ................................................................................................. 163<br />
7.2.3 Determining the number of states .......................................................................... 166<br />
7.2.4 Decoding an HMM ................................................................................................. 167<br />
7.2.5 Further Readings ................................................................................................... 169<br />
7.3 Reinforcement Learning ............................................................................................. 170<br />
7.3.1 Principle ................................................................................................................. 171<br />
7.3.2 Defining the Reward .............................................................................................. 172<br />
7.3.3 Markov World ......................................................................................................... 173<br />
7.3.4 Estimating the policy .............................................................................................. 174<br />
7.3.5 Summary ............................................................................................................... 175<br />
8. 8 Genetic Algorithms .............................................................................................. 177<br />
8.1 Principle ....................................................................................................................... 178<br />
8.2 Encoding ...................................................................................................................... 178<br />
8.3 Breeding and Selection .............................................................................................. 179<br />
8.4 The Algorithm .............................................................................................................. 181<br />
8.5 Convergence ............................................................................................................... 181<br />
9. 9 Annexes ................................................................................................................ 182<br />
9.1 Brief recall of basic transformations from linear algebra ....................................... 182<br />
9.1.1 Eigenvalue Decomposition .................................................................................... 182<br />
9.1.2 Singular Value Decomposition (SVD) .................................................................... 184<br />
9.1.3 Frobenius Norm ..................................................................................................... 184<br />
9.2 Recall of basic notions of statistics and probabilities ............................................ 184<br />
9.2.1 Probabilities ........................................................................................................... 184<br />
© A.G.Billard 2004 – Last Update March 2011
5<br />
9.2.2 Probability Distributions, Probability Density Function ........................................... 186<br />
9.2.3 Distribution Function or Cumulative Distribution Function ..................................... 186<br />
9.2.4 Marginal Probability Distribution or Marginal Density ............................................ 187<br />
9.2.5 Likelihood ............................................................................................................... 188<br />
9.2.6 Probabilistic Independence .................................................................................... 188<br />
9.2.7 Statistical Independence ........................................................................................ 189<br />
9.2.8 Uncorrelatedness ................................................................................................... 189<br />
9.3 Information Theory ..................................................................................................... 189<br />
9.3.1 Entropy .................................................................................................................. 190<br />
9.3.2 Joint and conditional entropy ................................................................................. 191<br />
9.3.3 Mutual Information ................................................................................................. 191<br />
9.3.4 Relation to mutual information ............................................................................... 192<br />
9.3.5 Kullback-Leibler Distance ...................................................................................... 192<br />
9.4 Estimators ................................................................................................................... 193<br />
9.4.1 Gradient descent ................................................................................................... 193<br />
9.4.2 Conjugate Gradient descent .................................................................................. 194<br />
10. 10 References ........................................................................................................... 197<br />
10.1 Other Recommended Textbooks ............................................................................... 197<br />
10.2 Other Recommended Readings ................................................................................ 198<br />
© A.G.Billard 2004 – Last Update March 2011
6<br />
I. Introduction<br />
1.1 What is Machine Learning? - Definitions<br />
Machine Learning is the field of scientific study that concentrates on induction algorithms<br />
and on other algorithms that can be said to “learn”.<br />
Machine Learning Journal, Kluwer Acadnemic<br />
Machine Learning is an area of artificial intelligence involving developing techniques to<br />
allow computers to “learn”. More specifically, machine learning is a method for creating<br />
computer programs by the analysis of data sets, rather than the intuition of engineers.<br />
Machine learning overlaps heavily with statistics, since both fields study the analysis of<br />
data.<br />
Webster Dictionary<br />
Machine learning is a branch of statistics and computer science, which studies algorithms<br />
and architectures that learn from data sets.<br />
WordIQ<br />
1.1.1 ML Resources:<br />
http://www.machinelearning.org/index.html<br />
ML List<br />
http://www.ics.uci.edu/~mlearn/MLList.html<br />
ML Repository<br />
http://www.ics.uci.edu/~mlearn/MLRepository.html<br />
MLnet<br />
http://www.mlnet.org/<br />
KDnet<br />
http://www.kdnet.org/control/index<br />
NIPS<br />
http://nips.cc/<br />
Pascal<br />
http://www.pascal-network.org/<br />
"Archives of the Machine Learning List"<br />
"This is a repository of databases, domain<br />
theories and data generators that are used<br />
by the machine learning community for the<br />
empirical analysis of machine learning<br />
algorithms."<br />
Machine Learning network online information<br />
service. "This site is dedicated to the field of<br />
machine learning, knowledge discovery,<br />
case-based reasoning, knowledge<br />
acquisition, and data mining."<br />
"The KDNet (= Knowledge Discovery<br />
Network of Excellence) is an open Network<br />
of participants from science, industry and the<br />
public sector. The major purpose of this<br />
international project is to integrate real-life<br />
business problems into research discussions<br />
and to collaborate in shaping the future of<br />
Knowledge Discovery and Data Mining."<br />
Neural Information Processing Conference –<br />
on-line repository of all research papers on<br />
theoretical ML<br />
Network of excellence on Pattern<br />
Recognition, Statistical Modelling and<br />
Computational Learning<br />
© A.G.Billard 2004 – Last Update March 2011
7<br />
Journals:<br />
• Machine Learning<br />
• IEEE Transactions on Signal processing<br />
• IEEE Transactions on Pattern Analysis<br />
• IEEE Transactions on Pattern Recognition<br />
• The Journal of Machine Learning Research<br />
• Data Mining and Knowledge Discovery<br />
• ACM Transactions on Information Systems<br />
• Neural Networks<br />
• Neural Computation<br />
• Biological Cybernetics<br />
Conferences:<br />
• ICML: Int. Conf. on Machine Learning<br />
• NIPS: Neural Information Processing Conference<br />
• COLT: Annual Conference on Learning Theory<br />
• IJCAI: Int. Joint Conf. on Artificial Intelligence<br />
• ICANN: Int. Conf. on Artificial Neural Networks<br />
• ESANN: European Conf. on Artificial Neural Networks<br />
• IJCNN: Int. Joint Conf. on Neural Networks<br />
1.2 What is Learning?<br />
A computer program is said to learn from experience E with respect to some class of<br />
tasks T and performance measure P, if its performance at tasks in T, as measured by P,<br />
improves with experience E.<br />
Mitchell, Tom. M. 1997. Machine Learning. New York: McGraw-Hill.<br />
Things learn when they change their behavior in a way that makes them perform better in<br />
the future.<br />
Witten, Ian H., and Eibe Frank. 2000. Data Mining: Practical Machine Learning<br />
Tools and Techniques with Java Implementations. San Diego, CA: Morgan<br />
Kaufmann.<br />
In this class, we will approach the problem by stating that:<br />
Learning consists of gradually finding a solution to a problem.<br />
© A.G.Billard 2004 – Last Update March 2011
8<br />
Why and when do we need learning?<br />
We need learning when the solution to a problem may vary. Any machine bound to interact on a<br />
daily basis with humans or the environment is bound to face variations in its data. Humans cope<br />
with the uncertainty of their environment by constantly adapting and/or learning new behaviors.<br />
Indeed, there is not a day that goes by without us adapting to the circumstances. We adapt our<br />
driving or walking habits to the weather conditions and to the passers-by. We, also, constantly<br />
acquire new knowledge, as we meet new persons, get new information from the media, etc…<br />
Learning here is synonymous to the notion of adaptation. Note that the two terms are sometimes<br />
distinguished in the literature. Learning is usually seen as the creation of a new form of<br />
knowledge (e.g. discovering a law of motion in robotics), while adaptation is simply a slight<br />
update of current knowledge (e.g. changing the parameters of the law of motion).<br />
Learning is a proof of autonomy.<br />
It is however not clear whether all machines should be endowed with long-term open-ended<br />
abilities to learn and adapt.<br />
Most importantly, learning can take an unbearably long time, months if not years. Think simply of<br />
humans. It takes a good year for a baby to master the simple action of using a spoon and one<br />
more year to understand the basics of language.<br />
What would be an acceptable duration of learning in any human-machine interactions?<br />
This remains an open question, and we have yet very few examples to draw inference from. At<br />
present, the only adaptive engines we have at our disposal are speech recognition systems and<br />
web-search engines. It takes about 45 minutes to train a speech engine before it reaches an<br />
acceptable level of performance. A very short duration in comparison to the baby’s learning<br />
curve. However, speech engines remain not very popular.<br />
Probably what is most important is not so much the time it takes for the machine to learn, but,<br />
rather the fact that the learning curve is perceptible to the teacher. While you train your speech<br />
engine, you have no feedback on how well the engine learns. It is only at the end of the 45<br />
minutes that you get to test the machine. If the level remains very unsatisfactory, it is unlikely that<br />
you will be willing to spend yet another three quarters of an hour to retrain it. Teaching and<br />
learning is not a unidirectional process. It is inherently bi-directional. When interacting with a<br />
baby, the caretaker continuously adapts his/her speech and behavior to the baby.<br />
Why are we so dissatisfied with current learning machines (such as speech engines)?<br />
Possibly because learning machines neither reach a level of adaptability similar to the human one<br />
nor achieve a level of perfection associated only with machines. Caretakers draw the motivation<br />
to fetch back the spoon that the baby threw on the floor over and over again because they “care”.<br />
We cannot expect the end-users to “care” about machines the same way they do about humans.<br />
In order to draw the same motivation for the end-user of your learning machine, it is, therefore,<br />
fundamental to think of the reward the user/teacher can find in teaching the machine.<br />
Who says reward thinks also of measure of performance:<br />
Progress in a machine’s performance must be measurable and must be significant. A machine<br />
must eventually reach a minimal level of performance (“good enough”) within an acceptable time<br />
frame.<br />
© A.G.Billard 2004 – Last Update March 2011
9<br />
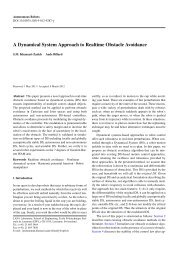
Performance<br />
What would be an optimal learning curve?<br />
What would be an optimal learning curve?<br />
When is “ good enough ” achieved?<br />
1. Time<br />
How long can it take before an<br />
acceptable level of<br />
performance is achieved?<br />
Figure I-1: Schematic of different learning curves<br />
How much can one learn?<br />
While humans and animals are in general very adaptive, they remain limited in what they can<br />
adapt. Our body can adjust to fluctuations of temperatures, as long as these do not overshoot<br />
certain limits in heat or coldness. Moreover, our ability to learn new things decreases over time.<br />
Children up to 7 years old can easily learn two or more languages. After that age, they face the<br />
same difficulty in acquiring a new language as adults do.<br />
There is a reason for this. Searching for a solution is costly, both in time and in the number of<br />
mistakes one can make during the search. As we grow older, we restrict the search space, in<br />
order to allocate time to learning more complex things. If we were still trying to make sense of<br />
syllables, we could never reach the level of understanding full sentences.<br />
When is a good time to stop learning?<br />
In humans, part of what makes us stop learning is a biological clock. Part of it is also related to<br />
our own measure of performance. This measure comes mostly from comparison to others<br />
(parents, peers, colleagues). Determining that you have reached an optimum, as well as<br />
determining the best measure of performance is a crucial problem in machine learning.<br />
Learning implies making mistakes<br />
Inherent to the learning process is the notion of performance. A strong expectation is that, while<br />
you learn, your performance improves continuously. However, there are situations where the<br />
performance can degrade while one learns. For instance, when the search space contains<br />
several optima, as illustrated in Figure I-1, while you search for a solution you may climb your<br />
way up and down the optimality curve. In this class, we will see different methods to search for<br />
the global optimum, by avoiding getting caught in local optima.<br />
The performance and computational analysis of machine learning algorithms is a branch of<br />
statistics known as learning theory. Machine learning algorithms take a training set, form<br />
hypotheses or models, and make predictions about the future. Because the training set is finite<br />
and the future is uncertain, learning theory usually does not yield absolute guarantees of<br />
performance of the algorithms. Instead, probabilistic bounds on the performances of machine<br />
learning algorithms are quite common.<br />
© A.G.Billard 2004 – Last Update March 2011
10<br />
Learning and biases<br />
In order to speed up learning, one can introduce biases. These can take two forms: One can<br />
either introduce a bias in the starting conditions, e.g. making sure that you start nearby the global<br />
optima. Or, one can limit the search to a subpart of the search space that contains optima.<br />
1.2.1 Taxonomy of Learning Algorithms<br />
Machine learning algorithms are often organized according to taxonomy, based on the desired<br />
outcome of the algorithm. Common algorithm types include:<br />
• Supervised learning – where the algorithm learns a function or model that maps best a<br />
set of inputs to a set of desired outputs.<br />
• Reinforcement learning – where the algorithm learns a policy or model of the set of<br />
transitions across a discrete set of input-output states (Markovian world) in order to<br />
maximize a reward value (external reinforcement).<br />
• Unsupervised learning – where the algorithm learns a model that best represents a set<br />
of inputs without any feedback (no desired output, no external reinforcement)<br />
• Learning to learn – where the algorithm learns its own inductive bias based on previous<br />
experiences<br />
In all types of learning, it is important that the training examples contain enough information to<br />
enable the system to find the solution, and that they are representative of the complexity of the<br />
whole dataset in order to avoid an overgeneralization.<br />
Machine learning algorithms can also be classified according to the type of computation they can<br />
perform on a given dataset. Common types of computation include:<br />
• Classification: learn to put instances into pre-defined classes<br />
• Association: learn relationships between the attributes<br />
• Clustering: discover classes of instances that belong together<br />
• Numeric prediction: learn to predict a numeric quantity instead of a class<br />
1.2.2 Other important terms in machine learning<br />
On-line learning: an algorithm is said to work on-line or in real-time, when it can perform its<br />
computation on the data as they stream through. Typical example is an algorithm for vision that<br />
could be performed without slowing down the 30 frames per second flow of images.<br />
Connectionist models, more commonly called Artificial Neural Networks (ANN), form a large<br />
part of the algorithms of machine learning. ANNs encompass a diverse set of algorithms that<br />
share the same principle of computation, pseudo-parallel computation.<br />
In connectionist models, unsupervised learning is also known as self-organization, a principle by<br />
which the network self-organizes to best represent the data. Examples of self-organized networks<br />
are Kohonen, Hopfield and other Associative Memories. Examples of supervised networks are<br />
feed-forward and recurrent neural networks with Backpropagation.<br />
© A.G.Billard 2004 – Last Update March 2011
11<br />
1.2.3 Key features for a good learning system<br />
There are a number of desiderata one could formulate for any given learning system, such as:<br />
Denoising: Working in a real world application implies noise. Noise can mean several things. It<br />
can be imprecision in the measurement (e.g. light affecting infra-red sensors). It can be side<br />
effects from the experimental setups (e.g. systematic bias in the initial conditions). Eliminating<br />
noise is probably the most crucial processing one might want to perform on the data, prior to any<br />
other processing. However, it has its costs. Denoising requires noise model. It is seldom the case<br />
that the model is known. There are methods to learn these models, but the process is slow. An<br />
incorrect noise model is bound to eliminate good data with the noise, or get rid of too little noise.<br />
Decorrelating: Decorrelating the data is often a first step before denoising or proceeding to any<br />
feature extraction. The process of decorrelation aims at making sure that, prior to analyzing the<br />
data, you have found a way to represent the data that explicitly encapsulate the correlations. Data<br />
with low correlations can often be considered as noise, or of little relevance to modeling the<br />
process.<br />
Generalization versus memorization: A general and important feature of a learning system that<br />
differentiates it from a pure “memory” is its ability to generalize. Generalizing consists of<br />
extracting key features from the data, matching those across data (to find resemblances) and<br />
storing a generalized representation of the data features that account best (according to a given<br />
metric) for all the small differences across data. Classification and clustering techniques are<br />
examples of methods that generalize through a categorization of the data. Generalizing is the<br />
opposite of memorizing and often one might want to find a tradeoff between over-generalizing,<br />
hence losing information on the data, and over fitting, i.e. keeping more information than required.<br />
Generalization is particularly important in order to reduce the influence of noise, introduced in the<br />
variability of the data.<br />
Feature extraction Part of the process of learning consists in extracting what is relevant in a set<br />
of data. This is often done by finding what is common across all the examples used for learning.<br />
The common feature to all data may consist of complex patterns (e.g. when training an algorithm<br />
to recognize faces, you may expect the algorithm to learn to extract features such as nose, eyes,<br />
mouth, etc). The process of finding what is common relies usually on a measure of correlation<br />
across data points. Extracting correlation can often reduce the dimensionality of the dataset at<br />
hand, by saving only a subpart of all the information.<br />
Curse of dimensionality A problem which one often encounters in machine learning is what one<br />
calls the curse of dimensionality, whereby the number of samples used for training should grow<br />
exponentially with the dimensionality of your data set to remain representative. This exponential<br />
increase is reflected back into an exponential increase of the computation steps for training. Both<br />
of these are usually not practical and, as we will see in this class, many algorithms have been<br />
developed to reduce the dimensionality of the data prior to further processing.<br />
© A.G.Billard 2004 – Last Update March 2011
12<br />
1.2.4 Exercise<br />
For the following scenarios: 1) learning to drive a bicycle; 2) learning how to open a box with a<br />
lever; 3) learning sign language (if lost on a Island with only deaf people), determine:<br />
a) The variables at hand;<br />
b) A good measure of performance,<br />
c) A criteria of “good enough” optimality,<br />
d) A threshold of sub-optimality (“too poor”)<br />
e) The minimal time lag<br />
1.3 Best Practices in ML<br />
ML algorithms may be extremely sensitive to the particular choice of data you used for training<br />
them. Ideally, you would like your training set to be sufficiently large to sample from the real<br />
distribution of the data you try to estimate. In practice, this is not feasible. For instance, imagine<br />
that you wish to train an algorithm to recognize human faces. When training the algorithm, you<br />
may observe only a subset of all faces you may encounter in life, but you would still like your<br />
algorithm to generalize a model of “human faces” from observing only 100 of them. If you provide<br />
the algorithm with too many examples of the same subset of data of faces (e.g. by training the<br />
algorithm only on faces of people with long hair), the algorithm may overfit, i.e. learn features<br />
that are representatives of this part of the data but not of the global pattern you aimed at training<br />
it on. In this case, the algorithm will end up recognizing only faces with long hair.<br />
Each time an algorithm cannot detect correctly instances of a given class (e.g. human faces with<br />
short hair) is called a false negative.<br />
In addition to training the algorithm on a representative sample of the data to recognize, you<br />
should also provide it with data that are counterexamples to this set to avoid what is called false<br />
positives. For instance, in the above example, an algorithm that retained only the feature long<br />
hair may incorrectly recognize a human face when presented with pictures of horses.<br />
Finally, since ML algorithms are essentially looking at correlations across data, they may fit<br />
spurious correlations, if provided with a poorly chosen set of training data. To ensure then that the<br />
algorithm has generalized correctly over the subsets of training examples you used, a number of<br />
good practices have been developed, which we review briefly below.<br />
1.3.1 Training, validation and testing sets<br />
Common practice to assess the validity of a Machine Learning algorithm is to measure its<br />
performance against three data sets, the training, validation and testing sets. These three sets<br />
are disjoint partitions of all the data at hand.<br />
The training and validation sets are used for crossvalidation (see below) during the training<br />
phase. In the above example when training an algorithm to recognize human faces, one would<br />
typically choose a set of N different faces representative of all gender, ethnicities and other<br />
fashionable additions (hair cuts, glasses, moustache, etc). One would then split this set into a<br />
training set and a validation set, usually half/half or 1/3 rd – 2/3 rd ).<br />
The testing set consists of a subset of the data which you would normally encounter once training<br />
is completed. In the above example, this would consist of faces recorded by the camera of the<br />
client to whom you will have sold the algorithm after training it in the laboratory.<br />
© A.G.Billard 2004 – Last Update March 2011
13<br />
1.3.2 Crossvalidation<br />
To ensure that the splitting of data into training and validation sets was not a lucky split leading to<br />
optimal but non representative performance, one must apply crossvalidation. “Crossvalidation<br />
refers to the practice of confirming an experimental finding by repeating the experiment using an<br />
independent assay technique” (Wikipedia). In ML, this consists of splitting the dataset several<br />
times at random into training and validation sets. The performance of the algorithms is then<br />
measured on the whole set of experiments, e.g. by taking the mean and standard deviation of the<br />
error when applying the algorithm on each set. The standard deviation is important as it gives a<br />
measure of potential discrepancies in the structure of your data set. The crossvalidation phase is<br />
used to fine tune parameters of the algorithm (e.g. thresholds, priors, learning rates, etc) to<br />
ensure optimal performance.<br />
1.3.3 Performance Measures in ML<br />
1.3.3.1 Ground Truth<br />
Comparing the performance of a novel method to existing ones or trivial baselines is crucial.<br />
Whenever possible, one will use the ground truth as a means to compare performance of the<br />
system during training.<br />
In classification, the ground truth can be obtained for instance from manually labeling each data<br />
with the appropriate class label. If the choice of class label may be subjective (e.g. labeling facial<br />
expressions of happiness, sadness, etc), one may ask several raters to label the picture and one<br />
may take the average score across raters for the “true” label.<br />
1.3.3.2 ROC<br />
Graphical representations such as the Receiver Operating Characteristic, so called ROC curve<br />
provide an interesting way to quickly compare algorithms independently of the choice of<br />
parameters.<br />
The ROC curve is used in binary classification algorithms. It balances the so-called true positives<br />
(TP), i.e. instances when the algorithm classified correctly a datapoint to (y=+1) and the false<br />
positives (FP), i.e. instances when the algorithm classified incorrectly datapoints to (y=+1).<br />
Conversely, false positives (FP) and false negatives (FN) correspond to the above two cases with<br />
classification (y=-1).<br />
The ROC curve plots the fraction of true positives and false positives over the total number of<br />
samples of class y=+1 in the dataset. Each point on the curve corresponds to a different value of<br />
the classifier’s parameter (usually a threshold; e.g. a threshold on Bayes’ classification). Typical<br />
ROC curve is drawn below.<br />
© A.G.Billard 2004 – Last Update March 2011
14<br />
100%<br />
p(TP)<br />
Performance improves<br />
Performance drops<br />
0% p(FP)<br />
100%<br />
1.3.4 In Practice<br />
In this course, you will be asked to validate the performance of different algorithms following the<br />
above best practice recommendations. For this, you will first have to create your three sets<br />
(training, validation and testing sets) and explore the effect of choosing training and validation<br />
sets that are not representative of the testing set. It is expected that performance will be optimal<br />
on the training set and will decrease on the validation set.<br />
A large number of algorithms we will see in class require knowing the mean and covariance of the<br />
probability distribution function of the data. In practice, the class means and covariances are not<br />
known. They can, however, be estimated from the training set. Either the maximum likelihood<br />
estimate or the maximum a posteriori estimate may be used in place of the exact value. Further,<br />
several of these algorithms assume that the underlying distribution follow a normal distribution.<br />
This again is usually not true. Thus, one should keep in mind that, although the estimates of the<br />
covariance may be considered optimal, this does not mean that the resulting computation<br />
obtained by substituting these values is optimal, even if the assumption of normally distributed<br />
classes is correct.<br />
Another complication that you will often encounter when dealing with algorithms that require<br />
computing the inverse of the covariance matrix of the data is that, with real data, the number of<br />
observations of each sample exceeds the number of samples. In this case, the covariance<br />
estimates do not have full rank, and so cannot be inverted. There are a number of ways to deal<br />
with this. One is to use the pseudoinverse of the covariance matrix. Another way is to proceed to<br />
singular value decomposition.<br />
1.4 Focus of this course<br />
In this class, we will see a number of architectures that can perform one of these:<br />
• Classification<br />
• Associative learning<br />
• Supervised and unsupervised Learning<br />
• Reinforcement Learning; Learning with incomplete cues<br />
• Dimensionality Reduction, Denoising<br />
• Clustering<br />
• Pattern recognition<br />
© A.G.Billard 2004 – Last Update March 2011
15<br />
In particular, we will consider a number of Artificial Neural Networks models and will see how they<br />
may exhibit different properties (capacity, convergence and stability) depending on their topology,<br />
learning and retrieval rules.<br />
The tutorial and exercises that will accompany the class with revolve around a number of realworld<br />
applications of Machine Learning, namely, for visual processing (face recognition, object<br />
recognition), for motor control (Inverse Kinematics), for learning sensory-motor patterns, and for<br />
simulating biologically plausible computational processes.<br />
© A.G.Billard 2004 – Last Update March 2011
16<br />
2 Methods for Correlation Analysis PCA, CCA, ICA<br />
Principal Component Analysis (PCA), Canonical Correlation Analysis (CCA) and Independent<br />
Component Analysis (ICA) are techniques for<br />
• Discovering or reducing the dimensionality of a multidimensional data set<br />
• Identifying a suitable representation of the multivariate data, by de-correlating the<br />
dataset.<br />
The principle of these techniques consists in determining the directions of the multidimensional<br />
space of the dataset, along which the variability of the data is maximal. These directions<br />
correspond to the principal axes or Eigenvectors of the correlation matrix applied to the whole<br />
dataset. By projecting the data onto the referential defined by the Eigenvectors, one obtains a<br />
representation of the data that minimizes the statistical dependence across the data.<br />
Dimensionality reduction is obtained by discarding the dimensions along which the variance<br />
appears to be smaller than a criterion; the data appear to be quasi constant along these<br />
dimensions.<br />
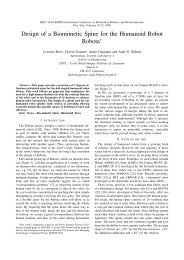
Identifying the best suitable representation of a dataset is fundamental as it can simplify<br />
enormously the search for a solution. Consider the example of Figure 2-1 left. It is clear to a<br />
human viewer that the data align themselves along an ellipse. However, an algorithm would have<br />
trouble finding the regularities underlying the dataset, if the data coordinates are given with<br />
respect to an external coordinate frame. On the other hand, the task becomes much simpler, if<br />
the data are transferred to a coordinate frame alongside the axes of the ellipse, as illustrated in<br />
Figure 2-1 right.<br />
Figure 2-1: The two Eigenvectors determine the axes of an ellipse. The Eigenvalues determine the length of<br />
the axes of an ellipse that fits best the data.<br />
© A.G.Billard 2004 – Last Update March 2011
17<br />
2.1 Principal Component Analysis<br />
Principal component analysis (PCA) performs a linear transformation of the coordinate system, so<br />
as to maximize the variance of the data along the first principal axis of the new coordinate<br />
system, e.g. the first axis of the ellipse as illustrated in Figure 2-1.<br />
It is important that the data on which PCA is performed are correlated. If the data are<br />
independent, nothing can be achieved with PCA.<br />
Formalism:<br />
Consider a data set of<br />
i=<br />
1...<br />
{ j} j=<br />
1,...<br />
M<br />
MN -dimensional data points<br />
i i N<br />
X= x and x ∈ ° , i = 1,..., M :<br />
N<br />
PCA aims at finding a linear map A , such that:<br />
N A q<br />
A: ° ⎯⎯⎯⎯→ ° , with q ≤ N<br />
1<br />
{ }<br />
X ⎯⎯⎯⎯→ Y = AX , with Y = y ,...., y and each y ∈ °<br />
A M i q<br />
Algorithm:<br />
Classical batch algorithm for PCA goes as follows:<br />
The mean of the dataset is denoted by<br />
⎛⎛x<br />
+ .. + x<br />
⎝⎝ M<br />
+ .. + x<br />
M<br />
1 M 1<br />
M<br />
1 1 N N<br />
= ( 1, 1,..., N ) = E( X)<br />
=⎜⎜ ,..., ⎟⎟<br />
µ µ µ µ<br />
and the covariance matrix of the same data set is<br />
1 1<br />
⎛⎛x1 −µ 1,.........,<br />
xN<br />
−µ<br />
⎞⎞<br />
T<br />
N<br />
T BB ⎜⎜<br />
⎟⎟<br />
C = E{ X '( X ')<br />
} = , B = ......................................<br />
M ⎜⎜ ⎟⎟<br />
⎜⎜ M<br />
M<br />
x1 µ<br />
1,.........,<br />
x1<br />
µ ⎟⎟<br />
⎝⎝ −<br />
−<br />
N ⎠⎠<br />
whereby X ' = X- µ , i.e. X' is zero mean X.<br />
x<br />
⎞⎞<br />
⎠⎠<br />
(2.1)<br />
(2.2)<br />
The component cii<br />
is the variance of the vector of components i of all data points, denoted X .<br />
i<br />
The variance of a component indicates the spread of the component values around its mean<br />
value. The components of C, denoted by<br />
1<br />
c ( x )( x )<br />
M<br />
k<br />
k<br />
ij<br />
= ∑ i<br />
−µ i j<br />
−µ<br />
j<br />
M k = 1<br />
, are a measure of the<br />
© A.G.Billard 2004 – Last Update March 2011
18<br />
correlation across the two components<br />
covariance is zero c c 0<br />
ij<br />
ji<br />
X and<br />
i<br />
X<br />
j<br />
. If the two components are uncorrelated, their<br />
= = . The covariance matrix is, by definition, always symmetric. It has,<br />
i<br />
thus, an orthogonal basis, defined by N Eigenvectors e , i 1,... N<br />
λ<br />
i<br />
:<br />
= with associated eigenvalues<br />
Ce<br />
i<br />
i<br />
= λ e<br />
(2.3)<br />
i<br />
The Eigenvalues λ<br />
i<br />
are calculated by solving the equation:<br />
C− λ I = 0<br />
(2.4)<br />
i<br />
When I is the N× N identity matrix and the determinant of the matrix.<br />
If the data vector has N components, the characteristic equation becomes of order N. This is easy<br />
to solve only if N is small.<br />
By ordering the eigenvectors in the order of descending eigenvalues (largest first), one can create<br />
an ordered orthogonal basis with the first eigenvector having the direction of largest variance of<br />
the data. In this way, the eigenvector corresponding to the largest eigenvalue is the direction<br />
along which the variance of the data is maximal. The directions of eigenvectors are drawn in the<br />
Figure 2-1 right as vectors. The first eigenvector having the largest eigenvalue points to the<br />
direction of largest variance (the longest axis of the ellipse) whereas the second eigenvector is<br />
orthogonal to the first one (pointing to the second axis of the ellipse).<br />
2.1.1 Dimensionality Reduction<br />
By chosing the k
19<br />
( )<br />
Xʹ′ = W X − µ<br />
(2.6)<br />
i i i<br />
Components of<br />
X ' can be seen as the coordinates in the orthogonal base of<br />
i<br />
i<br />
In order to reconstruct the original data vector<br />
using the property of an orthogonal matrix<br />
X from<br />
i<br />
X<br />
i<br />
X = W X ʹ′ + µ<br />
T<br />
i i i<br />
W<br />
W<br />
− 1 T<br />
= .<br />
'<br />
X .<br />
, one must compute:<br />
Now, instead of using all the eigenvectors of the covariance matrix, one may represent the data in<br />
terms of only a few basis vectors of the orthogonal basis. If we denote the reduced transfer matrix<br />
W , that contains only the k first eigenvectors. The reduced transformation is, thus:<br />
k<br />
( )<br />
Xʹ′ = W X − µ<br />
i k i i<br />
i<br />
X ' lives now in a coordinates system of dimension k. Such a transformation reduces the meansquare<br />
error between the original data point and its projection. If the data is concentrated in a<br />
linear subspace, this provides a way to compress data without losing much information and<br />
simplifying the representation. By picking the eigenvectors having the largest eigenvalues we lose<br />
as little information as possible in the mean-square sense. One can e.g. choose a fixed number<br />
of eigenvectors and their respective eigenvalues and get a consistent representation, or<br />
abstraction of the data. This preserves a varying amount of energy of the original data.<br />
Alternatively, we can choose approximately the same amount of energy and a varying amount of<br />
eigenvectors and their respective eigenvalues. This would in turn give approximately consistent<br />
amount of information with the expense of varying representations with regard to the dimension of<br />
the subspace.<br />
© A.G.Billard 2004 – Last Update March 2011
20<br />
Figure 2-2: An example of dimensionality reduction using PCA. The source images (left) are 32x32 color<br />
pixels. Each image corresponds to a 3072 dimensional vector. (center) the principal components shown in<br />
decreasing order of eigenvalue, notice how the first components contain the main features of the data (e.g.<br />
color of the balls) while the components further down only contain fine details. (right) projection of the source<br />
images onto the first two principal components.<br />
We are here faced with contradictory goals: On one hand, we should simplify the problem by<br />
reducing the dimension of the representation. On the other hand we want to preserve as much as<br />
possible of the original information content. PCA offers a convenient way to control the trade-off<br />
between loosing information and simplifying the problem at hand.<br />
As it will be noted later, it may be possible to create piecewise linear models by dividing the input<br />
data to smaller regions and fitting linear models locally to the data.<br />
2.1.2 Solving PCA as an optimization under constraint problem<br />
The standard PCA procedure delineated in the previous paragraphs can also be rephrased as an<br />
optimization under constraint problem in two different ways.<br />
2.1.2.1 Variance Maximization through constrained optimization<br />
Observe first that by projecting the original dataset onto the eigenvectors, PCA requires that the<br />
projection form an orthonormal basis. In addition, by projecting onto the eigenvector of the<br />
covariance matrix, it ensures that the first projection is along the direction of maximal variance of<br />
the datat.<br />
This can be formulated as an optimization problem that maximizes the following objective<br />
function:<br />
with<br />
C<br />
M<br />
1<br />
1<br />
T<br />
T<br />
arg max J ( e ,..., e ) = arg max ( e ) x = ( e ) Ce<br />
j j∈ {1,... N} M i=<br />
1<br />
the covariance of the dataset (which is first made zero-mean).<br />
∑ (2.7)<br />
N j i j j<br />
Adding the constraint that the e<br />
( )<br />
j k j<br />
e = 1, ∀ j = 1... q and e e = 0 ∀k ≠ j.<br />
T<br />
j<br />
should for an orthonormal basis<br />
PCA becomes an optimization under constraint problem which can be solved using Lagrange<br />
multipliers. PCA proceeds iteratively by first solving for the first eigenvector, using:<br />
T<br />
( )<br />
T<br />
( ) ( ) λ 1 1 ( )<br />
1 1 1 1 1<br />
Le = e Ce− − e e<br />
(2.8)<br />
where 1<br />
λ is the first Lagrange multiplier, and then solving iteratively for all other eigenvectors,<br />
adding the orthogonality constraint.<br />
© A.G.Billard 2004 – Last Update March 2011
21<br />
2.1.2.2 Reconstruction error minimization through constrained optimization<br />
Earlier on, we showed that PCA finds the optimal (in a mean-square sense) projections of the<br />
dataset. This, again, can be formalized as an optimization under constraint problem taking, that<br />
minimizes the following objective function:<br />
T i<br />
( ex<br />
j )<br />
1<br />
( ,..., , )<br />
q<br />
M<br />
q<br />
1<br />
i<br />
J e e λ = x −µ − λje<br />
M<br />
∑ ∑<br />
j<br />
(2.9)<br />
i= 1 j=<br />
1<br />
where λ = are the projection coefficients and xthe mean of the data.<br />
ij<br />
One optimizes J under the constraints that the eigenvectors form an orthonormal basis, i.e:<br />
j<br />
( )<br />
T<br />
i<br />
i<br />
e = 1 and e ⋅ e = 0, ∀ i, j = 1,..., q.<br />
2.1.3 PCA limitations<br />
PCA is a simple, straightforward means of determining the major dimensions of a dataset. It<br />
suffers, however, from a number of drawbacks. The principal components found by projecting the<br />
dataset onto the perpendicular basis vectors (eigenvectors) are uncorrelated, and their directions<br />
orthogonal. The assumption that the referential is orthogonal is often too constraining, see Figure<br />
2-3 for an illustration.<br />
Figure 2-3: Assume a set of data points whose joint distribution forms a parallelogram. The first PC is the<br />
direction with the greatest spread, along the longest axis of the parallelogram. The second PC is orthogonal<br />
to the first one, by necessity. The independent component directions are, however, parallel to the sides of<br />
the parallelogram.<br />
PCA ensures only uncorrelatedness. This is a less constraining condition than statistical<br />
independence, which makes standard PCA ill suited for dealing with non-Gaussian data. ICA is a<br />
method that specifically ensures statistical independence.<br />
© A.G.Billard 2004 – Last Update March 2011
22<br />
It is clear that PCA can be used as the basis of a clustering method, by grouping the points<br />
according to how they clump along each projection. Each cluster can then be treated separately.<br />
Figure 2-1 illustrates a situation in which PCA is useful in projecting the dataset onto a new frame<br />
of reference, from which the cluster of datapoints can be easily inferred. Figure 2-4 on the other<br />
hand shows an example in which PCA would fail to segment two clusters. By projecting the data<br />
along the principal direction, i.e. the vertical axis, PCA would merge the two clusters. ICA is one<br />
alternative method for separating such clusters.<br />
Figure 2-4: A classical illustration of problems occurring with variance-based methods such as PCA.<br />
2.1.4 Projection Pursuit<br />
Projection–Pursuit (PP) methods aim at finding structures in multivariate data by projecting them<br />
on a lower-dimensional subspace. Since there are infinitely many projections from a higher<br />
dimension to a lower dimension, PP aims at finding a technique to pursue a finite sequence of<br />
projections that can reveal the most “interesting” structures of the data. The interesting<br />
projections are often those that depart from that of normal/Gaussian distributions. For instance,<br />
these structures can take the form of trends, clusters, hypersurfaces, or anomalies. Figure 2-4<br />
illustrates the ``interestingness'' of non-gaussian projections. The data in this figure is clearly<br />
divided into two clusters. However, the principal component, i.e. the direction of maximum<br />
variance, would be vertical, providing no separation between the clusters. In contrast, the strongly<br />
non-gaussian projection pursuit direction would be horizontal, providing optimal separation of the<br />
clusters. Independent Component Analysis (see Section 2.3) is a method for discovering a linear<br />
decomposition into directions that maximize non-Gaussianity. In this respect, it provides a first<br />
step for PP decomposition.<br />
Typically, PP uses a projection index, a functional computed on a projected density (or data set),<br />
to measure the “interestingness” of the current projection and then uses a numerical optimizer to<br />
move the projection direction to a more interesting position. Interesting projections usually refer to<br />
non-linear structures in the data, i.e. structure than cannot be extracted by linear projections such<br />
as PCA and ICA. PP can be formalized as follows:<br />
Given a dataset<br />
P<br />
P<br />
P P<br />
X ∈° and a unit vector a ∈ ° one defines an index Ia<br />
: ° → ° that<br />
measures the interest of the associated projection P ( )<br />
maximize I a<br />
.<br />
a<br />
X . PP finds the parameters a that<br />
© A.G.Billard 2004 – Last Update March 2011
23<br />
PCA is an example of PP approach that takes the variance as the projection index. Further, if we<br />
T<br />
consider a linear projection of each datapoint x through a of the form z = a xand take the<br />
negative Shannon entropy as a measure for the index:<br />
=−∫<br />
(2.10)<br />
( ) log ( )<br />
I f z f z dz<br />
a z z<br />
Where f<br />
z<br />
is the probability density function of the projected data z, then PP is equivalent to<br />
Independent Component Analysis.<br />
© A.G.Billard 2004 – Last Update March 2011
24<br />
2.1.5 Probabilistic PCA<br />
Until now, all variants of PCA we have seen had a deterministic nature. However, implicitly<br />
through the computation of the mean and covariance matrix of the data, one assumed that the<br />
data followed a distribution that could be parameterized through these two parameters. A<br />
distribution parameterized with this is the Gaussian distribution.<br />
Here we will see how the standard PCA procedure can be extended with a probabilistic model.<br />
This rewriting will provide a first step toward introducing a series of methods based on so-called<br />
latent variables, which will see later on.<br />
Latent variables correspond to unobserved variables. They offer a lower dimensional<br />
representation of the data and their dependencies. Fewer dimensions result in more<br />
parsimonious models. Probabilistic PCA (PPCA) is then PCA through projection on a latent<br />
space.<br />
Formalism:<br />
N<br />
Asssume a N-dimenionsal data set X ∈° . X corresponds to the observations. Probabilistic<br />
PCA starts with the assumption that the data X were generated by a Gaussian latent variable<br />
model of the form:<br />
x= Wz + µ + ε<br />
(2.11)<br />
where z ∈ °<br />
W is a N×<br />
q matrix<br />
µ ∈ °<br />
N<br />
q<br />
are the q-dimensional Latent Variable,<br />
is a vector of parameters<br />
( ε )<br />
N<br />
ε ∈ ° is the noise and follows a zero mean Gaussian distribution ε =Ν 0, ∑<br />
Probabilistic PCA hence differs from PCA by assuming that a) the linear transformation through<br />
the matrix W goes from the latent variables to the observables; b) the transformation is no longer<br />
deterministic and is affected by random noise.<br />
Note that the noise is a random variable with zero mean and fixed covariance. If one further<br />
assumes that the covariance matrix of the noise ∑ is diagonal, i.e. that the noise along each<br />
dimension is uncorrelated to the noise along the other dimensions, this leads to a conditional<br />
independence on the observables given the latent variables. In other words, the latent variables z<br />
encapsulate the correlations across the variables. Such conditional independence on the<br />
observables is advantageous for further processing, e.g. to proceed to an estimation of the<br />
likelihood of the model given the data. In this case, one can then simply take the product of the<br />
likelihood of the data for each dimension separately.<br />
Probabilistic PCA consists then in estimating the density of the latent variable z. PPCA does so<br />
through maximum likelihood.<br />
ε<br />
© A.G.Billard 2004 – Last Update March 2011
25<br />
Algorithm:<br />
If one further assume that the noise follows an isotropic Gaussian distribution of the<br />
2<br />
form Ν (0, I) , i.e. that its variance σ is constant along all dimensions. The conditional<br />
σ ε<br />
probability of the observables X given the latent variables px ( | z)<br />
is given by:<br />
2<br />
ε<br />
2<br />
( µσ ε )<br />
px ( | z) =Ν Wz+ , I<br />
(2.12)<br />
The marginal distribution can then be computed by integrating out the latent variable and one<br />
obtains:<br />
If we set B=WW<br />
T<br />
z<br />
T 2<br />
( ) ( µ , σ ε )<br />
p x =Ν WW + I<br />
(2.13)<br />
2<br />
+ σ ε<br />
I, one can then compute the log-likelihood:<br />
M<br />
−1<br />
L ( B, σ<br />
ε<br />
, µ ) =− { N ln( 2π) + ln B + tr ( B C)<br />
}<br />
(2.14)<br />
2<br />
1<br />
where C = x − x −<br />
M<br />
M<br />
i<br />
i<br />
∑( µ )( µ )<br />
i=<br />
1<br />
1 M<br />
{ x x }<br />
M datapoints X= ,..., .<br />
T<br />
is the covariance matrix of the complete set of<br />
The parameters B, µ and σ can then be computed through maximum likelihood, i.e. by<br />
maximizing the quantity L ( B, ε<br />
, )<br />
ε<br />
maximum estimate of µ turns out to be the mean of the dataset.<br />
The maximum-likelihood estimates of B and σ are then:<br />
1<br />
* 2<br />
=<br />
2<br />
q<br />
Λ −<br />
*<br />
( σ∈)<br />
2<br />
( q<br />
σ<br />
ε )<br />
B W I R<br />
1<br />
=<br />
N − q<br />
N<br />
j= q+<br />
1<br />
j<br />
σ µ using expectation-maximization. Unsurprisingly, the<br />
2<br />
∈<br />
(this is also called the residual)<br />
where W is the matrix of eigenvectors of C and the λ are the associated eigenvalues.<br />
q<br />
∑<br />
λ<br />
As in PCA, the dimension N of the original dataset, i.e. the observable X, is reduced by fixing the<br />
dimension q< N of the latent variable. The conditional distribution of the latent variable given<br />
the observable is:<br />
T 2<br />
( )<br />
where B= W W+ I.<br />
σ ε<br />
1 −1 2<br />
( µ σ )<br />
−<br />
( ) ( )<br />
j<br />
p z| x =Ν B W x− , B ε<br />
(2.15)<br />
Finally note that, in the absence of noise, one recovers standard PCA. Simply observe that:<br />
T<br />
−1<br />
(( W)<br />
W) W( x µ )<br />
sets A = ( )<br />
T<br />
( ) − 1<br />
W W W<br />
− is an orthonormal projection of the zero mean dataset, and hence if one<br />
, one recovers the standard PCA transformation.<br />
© A.G.Billard 2004 – Last Update March 2011
26<br />
2.2 Canonical Correlation Analysis<br />
Adapted from Hardoon, Szedmak & Shawe-Taylor, Neural Computation, 16:12, p. 2639-2664, 2004<br />
Canonical Correlation Analysis (CCA) finds basis vectors for two sets of variables such that the<br />
correlation between the projections of the variables onto these basis vectors is mutually<br />
maximized. CCA is, thus, a generalized version of PCA for two or more multi-dimensional<br />
datasets. Note that the two multidimensional datasets do not have the same dimensions nor live<br />
in the same basis. The may code for completely different types of information.<br />
Take for example the case when you may want to develop a biometric system that can identify<br />
different people based on audio recordings of the persons’ voices and sets of video recordings of<br />
each person’s face when talking. Audio and video recordings are recorded simultaneously and<br />
hence when taken as a pair they may reveal some more information than taking each of these<br />
individually. CCA will aim at extracting the features in each dataset (audio and visual) that<br />
correlate best for each person individually. In each space (audio and video), CCA would find one<br />
or more eigenvectors that maximize correlation across pair of first, second, third eigenvectors in<br />
each basis. In other words, CCA tries to find a linear combination of audio features and a linear<br />
combination of video features that correlate best. Data once projected in each of these separate<br />
sets of eigenvectors would then be most representative of a person and hence can be used to<br />
best discriminate afterwards (e.g. by using the projected data in a classifier afterwards).<br />
While PCA works with a single dataset and maximizes the variance of the projections of the data<br />
onto a set of eigenvectors forming a basis of this dataset, CCA works with a pair of random<br />
vectors determined in each basis separately and maximizes correlation between sets of<br />
projections. In other words, while PCA leads to an eigenvector problem, CCA leads to a<br />
generalized eigenvector problem.<br />
M<br />
i N<br />
i q<br />
Consider a pair of multivariate datasets X = { x ∈ } , Y =∈{ y ∈ }<br />
i<br />
i<br />
M<br />
i i<br />
measure a sample of M instances ( x , y )<br />
{ }<br />
i=<br />
1<br />
° ° of which we<br />
M<br />
= 1 = 1<br />
. CCA consists in determining a set of projection<br />
vectors w and w for X and Y such that the correlation ρ between the projections<br />
x<br />
y<br />
T<br />
T<br />
X'<br />
= w X and Y' = w Y (the canonical variates) is maximized.<br />
x<br />
y<br />
T<br />
{ }<br />
T<br />
T<br />
wxE XY wy wxCxywy<br />
ρ = max corr ( X',Y' ) = max = max<br />
(2.16)<br />
wx,<br />
wy<br />
w X w Y w C w w C w<br />
w , T , T T<br />
x w<br />
T<br />
y wx wy<br />
x y x xx x y yy y<br />
Where Cxy, Cxx,<br />
Cxy<br />
are respectively the inter-set and within sets covariance matrices.<br />
C is N× q, C is N× N and C q×<br />
N.<br />
xy xx xy<br />
Given that the correlation is not affected by rescaling the norm of the vectors w , w , we can set<br />
that:<br />
w C w = w C w = 1<br />
(2.17)<br />
T<br />
x<br />
T<br />
xx x y yy y<br />
x<br />
y<br />
© A.G.Billard 2004 – Last Update March 2011
27<br />
The CCA algorithm consists thus in finding the optimum of ρ under the above two constraints.<br />
This again can be resolved through Lagrange and gives:<br />
C C C w<br />
−1 2<br />
xy yy yx x xx x<br />
= λ C w<br />
(2.18)<br />
with λ the Lagrange multiplier of the constraint.<br />
This is a generalized eigenproblem of the form Ax = λBx<br />
. If C is invertible (which is the case if<br />
xx<br />
all the columns of X are independent), then the above problem reduces to a single symmetric<br />
−<br />
eigenvector problem of the form B 1 Ax= λx.<br />
2.2.1 CCA for more than two variables<br />
Given sets of K multivariate random variables<br />
k<br />
k<br />
X with dimension , 1,...,<br />
M× n k = K(note that<br />
k<br />
while each variate can have different dimensions n , k = 1,..., K , they must all have the same<br />
number of observed instances M). The generalized CCA problem consists then in determining the<br />
= , with p= min k = 1.. K<br />
n k<br />
, such that:<br />
k k<br />
W w<br />
=<br />
set { i }<br />
i 1...<br />
p<br />
min<br />
W<br />
∑<br />
XW<br />
l≠ k, k, l=<br />
1,..., K F<br />
k<br />
( )<br />
k k l l<br />
T<br />
k<br />
s.t. W C W = I, ∀ k = 1,.., K,<br />
kk<br />
− XW<br />
k l<br />
wiCklw j<br />
= 0, ∀ i, j = 1,..., p, i ≠ j.<br />
(2.19)<br />
Where is the Frobenius norm (Euclidean distance for matrices). The above consists of K<br />
F<br />
minimization under constraint problems. Unfolding the objective function, we have the sum of the<br />
squared Euclidean distances between all of the pairs of the column vectors of the<br />
k k<br />
matrices XW, k= 1,..., K . This problem can be solved by using singular value decomposition<br />
for arbitrary K.<br />
2.2.2 Limitations<br />
CCA is dependent on the coordinate system in which the variables are described, so even if there<br />
is a very strong linear relationship between two sets of multidimensional variables, depending on<br />
the coordinate system used, this relationship might not be visible as a correlation. Kernel CCA<br />
has been proposed as an extension to CCA, where data are first projected into a higher<br />
dimensional representation. KCCA is covered in Section 5.4 of these Lecture Notes.<br />
© A.G.Billard 2004 – Last Update March 2011
28<br />
2.3 Independent Component Analysis<br />
Adapted from Independent Component Analysis, A. Hyvarinen, J. Karhunen and E. Oja, Wiley<br />
Inter-Sciences. 2001<br />
Similarly to PCA, ICA is a linear transformation that projects the dataset on a sub-manifold, that<br />
best represent the data at hand. While PCA looks for the principal components, ICA looks for the<br />
directions along which statistical dependence of the data is minimal.<br />
ICA is particularly useful in order to decorrelate and denoise data. ICA is very closely related to<br />
the method called blind source separation (BSS) or blind signal separation. The ``source'' is the<br />
original signal, i.e. the independent components, (e.g. the speaker in a cocktail party). ``Blind''<br />
means that neither the mixing matrix nor the independent components are known to start with.<br />
ICA is one method, perhaps the most widely used, for performing blind source separation. It has<br />
been used successfully in a wide range of signal processing applications, e.g. for de-correlating<br />
multiple sound sources or extracting invariant features in image processing.<br />
2.3.1 Illustration of ICA<br />
,<br />
To illustrate the idea of ICA, consider that you have observed four instances of a two-dimensional<br />
distribution S of independent components s 1 and s 2 and that the four instances form the four<br />
corners of a rectangle, as shown in Figure 2-5:<br />
Figure 2-5; Distribution of two independent components<br />
Note that the range of values for these data was chosen so as to make the mean zero and the<br />
variance equal to one, an important constraint of ICA. Now let us mix these two independent<br />
components, using the mixing matrix<br />
⎛⎛x1 ⎞⎞ ⎛⎛s1<br />
⎞⎞<br />
⎜⎜ ⎟⎟= A⋅⎜⎜ ⎟⎟<br />
x s<br />
⎝⎝ 2⎠⎠ ⎝⎝ 2⎠⎠<br />
⎛⎛1 1⎞⎞<br />
A = ⎜⎜ ⎟⎟<br />
⎝⎝1 1⎠⎠<br />
. This gives us two mixed variables, x 1 and x 2 .<br />
© A.G.Billard 2004 – Last Update March 2011
29<br />
Figure 2-6: Mixture of variables<br />
Note that the random variables x 1 and x 2 are not independent any more, see Figure 2-6; an easy<br />
way to see this is to consider, whether it is possible to predict the value of one of them, say x 2 ,<br />
from the value of the other. Clearly it is the case, as they line up along a line of slope 1.<br />
The problem of estimating the data model of ICA is now to estimate the mixing matrix A using<br />
only information contained in the mixtures x 1 and x 2 . In the above example, it is easy to estimate<br />
A by simply solving the inverse for each of the four data points, assuming that we have at least<br />
four points. The problem is less trivial, once we consider a mixture of two arbitrary continuous<br />
distributions.<br />
Let us now assume that s 1 and s 2 were generated by the following uniform distribution:<br />
( )<br />
p s<br />
i<br />
⎧⎧ 1<br />
⎪⎪ if si<br />
≤ 3<br />
= ⎨⎨2 3<br />
(2.20)<br />
⎪⎪⎩⎩ 0 otherwise<br />
Figure 2-7: joint distributions of S1 and S2<br />
© A.G.Billard 2004 – Last Update March 2011
30<br />
If we now mix those two distributions according to<br />
⎛⎛2 3⎞⎞<br />
A = ⎜⎜ ⎟⎟<br />
⎝⎝2 1⎠⎠<br />
, we have:<br />
Figure 2-8: Joint distribution of the two observables X1 and X2<br />
The edges of the parallelogram are in the directions of the columns of A . This means that we<br />
could, in principle, estimate the ICA model by first estimating the joint density of x 1 and x 2 , and<br />
then locating the edges. So, the problem seems to have a solution.<br />
In reality, however, this would be a very poor method because it only works with variables that<br />
have exactly uniform distributions. Moreover, it would be computationally quite complicated. What<br />
we need is a method that works for any distribution of the independent components, and works<br />
fast and reliably.<br />
Figure 2-9: ICA can be applied to separate signals that have been mixed together (e.g. one image bleeding<br />
into another during wireless transmission of a video signal). [DEMOS\ICA\ICA_IMAGE_MIX.M]<br />
© A.G.Billard 2004 – Last Update March 2011
31<br />
2.3.2 Why Gaussian variables are forbidden<br />
A fundamental restriction of ICA is that the independent components must be non-Gaussian for<br />
ICA to be possible. To see why Gaussian variables make ICA impossible, assume that the mixing<br />
matrix is orthogonal and the s i are Gaussian. Then x 1 and x 2 are Gaussian, uncorrelated, and of<br />
unit variance. Their joint density is given by:<br />
( , )<br />
p x x<br />
1 2<br />
1<br />
e<br />
2π<br />
⎛⎛ x1+<br />
x2<br />
⎞⎞<br />
⎜⎜−<br />
2<br />
⎟⎟<br />
⎝⎝ ⎠⎠<br />
= (2.21)<br />
This distribution is illustrated in Figure 2-10. The Figure shows that the density is completely<br />
symmetric. Therefore, it does not contain any information on the directions of the columns of the<br />
mixing matrix A. This is why A cannot be estimated.<br />
Figure 2-10: The multivariate distribution of two independent Gaussian variables<br />
More rigorously, one can prove that the distribution of any orthogonal transformation of the<br />
Gaussian (x 1 ,x 2 ) has exactly the same distribution as (x 1 ,x 2 ), and that x 1 and x 2 are independent.<br />
Thus, in the case of Gaussian variables, we can only estimate the ICA model up to an orthogonal<br />
transformation. In other words, the matrix A is not identifiable for Gaussian independent<br />
components. Note that if just one of the independent components is Gaussian, the ICA model can<br />
still be estimated.<br />
2.3.3 Definition of ICA<br />
Let x= { x1<br />
,..., x N<br />
} be a N-dimensional random vector of observables.<br />
ICA consists of finding a linear transform s<br />
are linearly independent.<br />
To proceed, one builds a general linear model of the form:<br />
= Wx so that the projections s ,..., 1 q<br />
s of x through W<br />
© A.G.Billard 2004 – Last Update March 2011
32<br />
x= A⋅ s+<br />
ε<br />
Where A is a q<br />
× N ‘mixing’ matrix, s ,..., 1<br />
s<br />
q<br />
the set of independent components and ε a q-<br />
dimensional random noise vector 1 . The independent components are latent variables, meaning<br />
that they cannot be directly observed.<br />
This formulation reduces the ICA problem to ordinary estimation of a latent variable model.<br />
Because the estimation of the latent variable in the noisy case can be very tricky, the majority of<br />
ICA research has concentrated on the noise-free ICA model, where:<br />
x<br />
x<br />
= A⋅ s<br />
(2.22)<br />
q<br />
= ∑ a s<br />
(2.23)<br />
i ij j<br />
j=<br />
1<br />
W = A −1 (this is possible only if A is invertible; to this<br />
The matrix W is then the inverse of A, i.e.<br />
end, one can ensure that A is full rank by reducing its dimension to that of the independent<br />
component, see below)..<br />
Hypotheses of ICA:<br />
The starting point for ICA is the following assumptions:<br />
• Without loss of generality, we can assume that, both the mixture variables x and the<br />
independent components s have zero mean. Observe that the observable variables x<br />
can always be centered by subtracting the sample mean, i.e. x x'<br />
E{ x'<br />
}<br />
= − .<br />
Consequently, the independent component have also zero mean,<br />
−<br />
E s = A 1 E x .<br />
since { } { }<br />
• The components s i are statistically independent. Statistical independence is rigorously<br />
defined in Section 9.2.7. It is a stronger constraint than uncorrelatedness (which is<br />
ensured through PCA). Hence, ICA decomposition results usually in different estimates<br />
from that found through PCA decomposition.<br />
• As discussed before, we must also assume that the independent components have non-<br />
Gaussian distributions. Usually, assuming that the data follow a Gaussian distribution is<br />
handy and is done in many other techniques we will see in this course (see e.g. PPCA or<br />
GMM). Gaussian distributions are so-called parametric distribution that is the distribution<br />
is fully determined once its parameters have been defined. Hence, assuming a Gaussian<br />
distribution simplifies the estimation of the density as one must solely estimates the<br />
parameters of the Gaussian (or mixture of Gaussians, as in GMM). Since ICA does not<br />
make any assumption regarding the form of the distribution of the independent<br />
component, it looks as if ICA would estimate the full density of s. This is a very difficult<br />
problem. ICA will overcome this difficulty by not estimating explicitly the density of s.<br />
Rather; the density of s can be recovered by sampling through x and using the inverse<br />
transformation.<br />
1 Note the similarity between this model and that introduced in PPCA, see Section 2.1.5; the<br />
difference here lies in the optimization method whereby ICA optimizes for statistical<br />
independence and PCA optimizes for maximal variance.<br />
© A.G.Billard 2004 – Last Update March 2011
33<br />
• In our general definition of the ICA model given previously, we have assumed that A was<br />
a q× N matrix. Here, we will focus on a simplified version of ICA whereby one assumes<br />
that the unknown mixing matrix A is square, i.e. that the number of independent<br />
components is equal to the number of observed mixtures and thus A is. q× q (note that<br />
this assumption can be sometimes relaxed (see extensions proposed in Hyvarinen et al<br />
2001). This can be done for instance by performing first PCA on the original dataset and<br />
then use a reduced set of q dimensions obtained by PCA for ICA. If A is square, then,<br />
after estimating the matrix A , one can compute its inverse, W = A −1 , and obtain the<br />
independent component simply by:<br />
−1<br />
s Wx A x<br />
= = (2.24)<br />
• The data is white, i.e. each datapoint is uncorrelated and the variance of the dataset is<br />
equal to unity. This will be a basic preprocessing step in ICA, as we will discuss next.<br />
2.3.4 Whitening<br />
A useful preprocessing strategy in ICA is to first whiten the observed variables. This means that<br />
before the application of the ICA algorithm (and after centering), we transform the observed<br />
vector x linearly so that we obtain a new vector x%, which is white, i.e. its components are<br />
uncorrelated and its variance equal unity. In other words, the covariance matrix of x%equals the<br />
identity matrix:<br />
E xx %% T = I<br />
(2.25)<br />
{ }<br />
The whitening transformation is always possible. One popular method for whitening is to use the<br />
%% T<br />
T , where U is the orthogonal<br />
eigen-value decomposition of the covariance matrix E{ xx }<br />
= UDU<br />
matrix of eigenvectors of the basis of x and D is the diagonal matrix of its eigenvalues,<br />
= ( ,..., 1 n ). Note that { T<br />
}<br />
D diag λ λ<br />
E xx%% is the empirical means, i.e. it is estimated from the<br />
available data samples. Whitening can now be done by computing:<br />
1<br />
−<br />
2 T<br />
% (2.26)<br />
x = UD U x<br />
The matrix<br />
1<br />
2<br />
D −<br />
is computed by a simple component-wise operation, such that:<br />
1 1 1<br />
− ⎛⎛ − − ⎞⎞<br />
2 2 2<br />
D = diag ⎜⎜d1 ,..., dn<br />
⎟⎟<br />
⎝⎝ ⎠⎠<br />
It is easy to check that now Exx {%% T } = I.<br />
Whitening transforms the mixing matrix into a new one, A % :<br />
.<br />
1<br />
−<br />
2 T<br />
% (2.27)<br />
x= UD U As= As %<br />
The utility of whitening resides in the fact that the new mixing matrix A % is orthogonal. This can be<br />
seen from<br />
© A.G.Billard 2004 – Last Update March 2011
34<br />
{ } { }<br />
% % %%<br />
%% (2.28)<br />
T T T T<br />
E xx = AE ss A = AA = I<br />
Here we see that whitening reduces the number of parameters to be estimated. Instead of having<br />
to estimate the<br />
2<br />
N parameters that are the elements of the original matrix A , we only need to<br />
estimate the new, orthogonal mixing matrix A % . An orthogonal matrix has ( )<br />
N N− 1/2 degrees<br />
of freedom. For example, in two dimensions, an orthogonal transformation is determined by a<br />
single angle parameter. In larger dimensions, an orthogonal matrix contains only about half of the<br />
number of parameters of an arbitrary matrix. Thus one can say that whitening solves half of the<br />
problem of ICA. Because whitening is a very simple and standard procedure, much simpler than<br />
any ICA algorithms, it is a good idea to reduce the complexity of the problem this way.<br />
It may also be quite useful to reduce the dimensionality of the data at the same time as we do the<br />
whitening. For instance, one can look at the eigenvalues of Exx { T } and discard those that are<br />
too small, as is often done in the statistical technique of principal component analysis. This often<br />
has the effect of reducing noise. Moreover, dimension reduction prevents overlearning, which can<br />
sometimes be observed in ICA<br />
A graphical illustration of the effect of whitening can be seen in Figure 2-11, in which the data in<br />
Figure 2-8 has been whitened. The square defining the distribution is now clearly a rotated<br />
version of the original square in Figure 2-7. All that is left is the estimation of a single angle that<br />
gives the rotation.<br />
Figure 2-11: The joint distribution of the whitened<br />
mixtures<br />
In the rest of this chapter, we assume that the data has been preprocessed by centering and<br />
whitening. For simplicity of notation, we denote the preprocessed data just by x , and the<br />
transformed mixing matrix by A , omitting the tildes.<br />
© A.G.Billard 2004 – Last Update March 2011
35<br />
2.3.5 ICA Ambiguities<br />
We cannot determine the variances of the independent components. The reason is that, both<br />
s and A being unknown, any scalar multiplier in one of the sources s i could always be cancelled<br />
by dividing the corresponding column a of A by the same scalar, sayα .<br />
i<br />
⎛⎛ 1 ⎞⎞<br />
x= a s ⋅α<br />
i ⎝⎝αi<br />
⎠⎠<br />
∑ ⎜⎜ i⎟⎟( i i)<br />
(2.29)<br />
As a consequence, we may as well fix the magnitudes of the independent components; as they<br />
are random variables. The most natural way to do this is to assume that each component has unit<br />
E s<br />
2 = 1. Then the matrix A will be adapted in the ICA solution methods to take<br />
variance, i.e. { } i<br />
into account this restriction. Note that this still leaves the ambiguity of the sign: we could multiply<br />
any of the independent components by -1 without affecting the model. This ambiguity is,<br />
fortunately, insignificant in most applications.<br />
We cannot determine the order of the independent components.<br />
The reason is that, again both s and A being unknown, we can freely change the order of the<br />
terms in the sum in (2.23) and call any of the independent components the first one. Formally, a<br />
−1<br />
permutation matrix P and its inverse can be substituted in the model to give x= AP Ps. The<br />
1<br />
elements of Ps are the original independent variables s j , but in another order. The matrix AP − is<br />
just a new unknown mixing matrix, to be solved by the ICA algorithms.<br />
ICA properties are:<br />
• Redundancy reduction: reducing redundancy in a dataset has numerous advantages. When<br />
the data show no redundancy any longer, the correlations across the data is null. In other<br />
words, each data point is significant and encapsulates a relevant characteristic of the<br />
dataset. Moreover, such a dataset is noise-free, because noise affects all data similarly. The<br />
brain seems to rely particularly on redundancy reduction. As we will see in later on in these<br />
lecture notes, the capacity of Neural Networks based on Hebbian Learning is maximal with<br />
non-redundant datasets.<br />
• Project pursuit: In a noise-free or non-redundant dataset, there might still be a number of<br />
features irrelevant to the task. Project pursuit is a method for determining the relevant<br />
directions along which lie the data.<br />
i<br />
2.3.6 ICA by maximizing non-gaussianity<br />
A simple and intuitive way of estimating ICA is done through the FastICA method. FastICA is<br />
based on a fixed-point iteration scheme for finding a maximum of a measure of nongaussianity.<br />
We present this solution here. Note that other objective functions have been proposed in the<br />
literature to solve ICA, such as minimizing mutual information or maximizing the likelihood. We<br />
will not review these here. In Section 6.7.2, we will offer another solution to ICA using Artificial<br />
Neural Networks.<br />
© A.G.Billard 2004 – Last Update March 2011
36<br />
2.3.6.1 Negentropy<br />
To obtain a measure of non-Gaussianity that is zero for a Gaussian variable and always<br />
nonnegative, one often uses a slightly modified version of the definition of differential entropy,<br />
called the negentropy. The negentropy J is defined as follows<br />
where<br />
y<br />
gauss<br />
( ) ( ) ( )<br />
J y = H y − H y<br />
(2.30)<br />
gauss<br />
is a Gaussian random variable of the same covariance matrix as y to the abovementioned<br />
properties. The negentropy is always non-negative, and it is zero if and only if y has a<br />
Gaussian distribution. Negentropy is invariant for invertible linear transformations.<br />
The advantage of using negentropy, or, equivalently, differential entropy, as a measure of<br />
nongaussianity is that it is well justified by statistical theory. In fact, negentropy is in some sense<br />
the optimal estimator of nongaussianity, as far as statistical properties are concerned. The<br />
problem in using negentropy is, however, that it is computationally very difficult. Estimating<br />
negentropy using the above definition would require an estimate (possibly nonparametric) of the<br />
pdf of the independent component. Therefore, simpler approximations of negentropy are very<br />
useful. For instance, Hyvarinen et al 2001 propose to use the following approximation. For a<br />
given non-linear quadratic function G, then:<br />
( ) ∝⎡⎡<br />
( )<br />
( ) − ( ( Gauss ))<br />
J y<br />
⎣⎣<br />
E G y E G y<br />
T<br />
( ) ∝⎡⎡<br />
( )<br />
( ) − ( Gauss )<br />
2<br />
( )<br />
J y E G w x E G y<br />
⎣⎣<br />
⎤⎤<br />
⎦⎦<br />
⎤⎤<br />
⎦⎦<br />
2<br />
(2.31)<br />
2.3.6.2 FastICA for one unit<br />
To begin with, we shall show the one-unit version of FastICA. By a "unit" we refer to a<br />
computational unit. As we will see in Section 6.7.2, this can also be considered as the output of a<br />
neuron.<br />
The FastICA learning rule determines a direction, i.e. a unit vector w such that the projection<br />
T<br />
wx maximizes nongaussianity. Nongaussianity is here measured by the approximation of the<br />
J w x .<br />
T<br />
empirical measure of Negentropy on the projection, i.e. ( )<br />
T<br />
Recall that the variance of wxmust here be constrained to unity; for whitened data this is<br />
equivalent to constraining the norm of w to be unity.<br />
The FastICA is based on a fixed-point iteration scheme for finding a maximum of the<br />
T<br />
nongaussianity of wx. It can be also derived as an approximative Newton iteration, minimizing<br />
for the derivative of the Negentropy, i.e.<br />
either of the two following quadratic functions:<br />
1<br />
G1<br />
( y) = log ( cosh ( a⋅y)<br />
) , 1 ≤ a ≤ 2<br />
a<br />
2<br />
( )<br />
G y =−e<br />
−<br />
1 2<br />
y<br />
2<br />
( = w T x)<br />
dJ y<br />
dw<br />
. Hyvarinen et al 2001 propose to use<br />
© A.G.Billard 2004 – Last Update March 2011
37<br />
Denote by g the derivative of the above two functions, we have:<br />
( ) = tanh ( )<br />
g u au<br />
1 1<br />
2<br />
( )<br />
g u = ue<br />
⎛⎛<br />
2<br />
u ⎞⎞<br />
⎜⎜<br />
⎜⎜<br />
− ⎟⎟<br />
2 ⎟⎟<br />
⎝⎝ ⎠⎠<br />
1≤a<br />
≤2is some suitable constant, often taken as a 1 =1. These function are monotonic<br />
where<br />
1<br />
and hence particularly well suited for performing gradient descent.<br />
The basic form of the FastICA algorithm is as follows:<br />
1. Choose an initial (e.g. random) weight vector W.<br />
T<br />
2. Compute the quantity ( )<br />
T<br />
{ } { ( )}<br />
w + = E xg w x − E g w x w<br />
3. Proceed to a normalization of the weight vector:<br />
w =<br />
+<br />
w<br />
+<br />
w<br />
r<br />
−1 ⋅ ≠1<br />
4. If the weights have not converged, i.e. wt ( ) wt ( )<br />
r<br />
, go back to step 2.<br />
Note that it is not necessary that the vector converge to a single point, since w and -w define the<br />
same direction. Recall also that it is here assumed that the data have been whitened.<br />
2.3.6.3 FastICA for several units<br />
The one-unit algorithm of the preceding subsection estimates just one of the independent<br />
components, or one projection pursuit direction. To estimate several independent components,<br />
we need to run the one-unit FastICA algorithm using several units (e.g. neurons) with weight<br />
w w .<br />
vectors<br />
1 ,..., q<br />
To prevent different vectors from converging to the same maxima we must decorrelate the<br />
outputs T ,..., T<br />
w1 w at each iteration. We present here three methods for achieving this.<br />
q<br />
A simple way of achieving decorrelation is a deflation scheme based on a Gram-Schmidt-like<br />
decorrelation. This means that we estimate the independent components one by one. When we<br />
have estimated p independent components, or p vectors w ,..., 1<br />
w<br />
p<br />
, we run the one-unit fixedpoint<br />
algorithm for w<br />
p + 1, and after every iteration step subtract from w<br />
p + 1<br />
the ``projections''<br />
+<br />
= of the previously estimated p vectors, and then renormalize w<br />
p + 1:<br />
T<br />
wp 1<br />
wjwj, j 1,... p<br />
1. Let<br />
p<br />
T<br />
p+ 1<br />
=<br />
p+ 1−∑<br />
p+<br />
1 j j<br />
j=<br />
1<br />
w w w w w<br />
2. Let w = w / w w<br />
T<br />
p+ 1 p+ 1 p+ 1 p+<br />
1<br />
(2.32)<br />
© A.G.Billard 2004 – Last Update March 2011
38<br />
In certain applications, however, it may be desired to use a symmetric decorrelation, in which no<br />
vectors are ``privileged'' over others. This can be accomplished, e.g., by the classical method<br />
involving matrix square roots,<br />
Let<br />
−<br />
T<br />
( ) 1/2<br />
W WW W<br />
= (2.33)<br />
WW − is<br />
where W is the matrix ( ,..., T<br />
w1 wq<br />
) of the vectors, and the inverse square root ( ) 1<br />
T 2<br />
obtained from the eigenvalue decomposition of<br />
simpler alternative is the following iterative algorithm:<br />
WW<br />
T<br />
1<br />
−<br />
T<br />
T<br />
= FΛ F as<br />
2<br />
( )<br />
1<br />
−<br />
2 T<br />
= Λ . A<br />
WW F F<br />
1. Let W = W / WW<br />
Repeat 2. until convergence<br />
3 3 T<br />
2. Let W = W − WW W<br />
2 2<br />
T<br />
(2.34)<br />
The norm in step 1 can be almost any ordinary matrix norm, e.g., the 2-norm or the largest<br />
absolute row (or column) sum (but not the Frobenius norm).<br />
Figure 2-12: (Left) Original distribution; (right) decorrelated distribution after projection through ICA<br />
projection. The original axes and the ICA projected axes are the horizontal and vertical axes respectively.<br />
2.4 Further Readings<br />
In this chapter, we have focused only on the linear version of ICA, and, on one method for solving<br />
ICA, namely fast ICA. Note that there exist also methods for non-linear ICA and for timedependent<br />
ICA. The reader can refer to [Hyvarien et al, 2003] for further readings on ICA and its<br />
applications.<br />
© A.G.Billard 2004 – Last Update March 2011
39<br />
3 Clustering and Classification<br />
Classification consists of categorizing data according to some criteria. This can be used as a<br />
means to reduce the dimensionality of the dataset, prior to performing other form of data<br />
processing on the constructed categories.<br />
Classification is a key feature of most learning methods. In this chapter, we will first look at one<br />
way to perform classification through data clustering. Then, we will look at a number of linear<br />
classification methods that exploit eigenvalue decomposition such as those seen for PCA and<br />
CCA in the previous chapter. All of these methods are in effect supervised as they rely on an<br />
apriori estimate of the number of classes or clusters. Note that we will see other methods that can<br />
be used to perform classification in other chapters of these lecture notes. These are for instance<br />
feed-forward neural networks, or Hidden Markov Models. As it is often the case, machine learning<br />
methods may be used in various ways and there is thus not a single way to classify these!<br />
3.1 Clustering Techniques<br />
Clustering is a type of multivariate statistical analysis also known as cluster analysis,<br />
unsupervised classification analysis, or numerical taxonomy.<br />
Looking at Figure 3-1, one can easily see that the points group naturally into 3 separate clusters,<br />
albeit of different shape and size. While it is obvious to see this when looking at the graph, it<br />
would become less so obvious if you were to look at the coordinates of these points.<br />
Figure 3-1: Example of a dataset that form 3 clusters<br />
There are many ways to cluster data depending on the criteria required for the task. One can, for<br />
instance, group the data or segment the data into clusters. Clusters can be either globular or<br />
convex, such that any line you can draw between two cluster members stays inside the<br />
boundaries of the cluster, or non-globular or concave, i.e. taking any shape. Clusters can contain<br />
an equal number of data, or be of equal size (distance between the data). Central to all of the<br />
goals of cluster analysis is the notion of degree of similarity (or dissimilarity) between the<br />
individual objects being clustered. This notion determines the type of clusters that will be formed.<br />
In this chapter, we will see different methods of clustering that belong to two major classes of<br />
clustering algorithms, namely hierarchical clustering and partitioning algorithms. We will<br />
discuss the limitation of such methods. In particular, we will look at a generalization of K-means<br />
clustering, namely soft k-means and mixture of Gaussians that enable to overcome some but<br />
no all limitations of simple K-means.<br />
© A.G.Billard 2004 – Last Update March 2011
40<br />
While hierarchical algorithms build clusters gradually (as crystals are grown), partitioning<br />
algorithms learn clusters directly. In doing so, they either try to discover clusters by iteratively<br />
relocating points between subsets, or try to identify clusters as areas highly populated with data.<br />
Algorithms of the first kind are surveyed in the section Partitioning Relocation Methods. They are<br />
further categorized into k-means methods (different schemes, initialization, optimization,<br />
harmonic means, extensions) and probabilistic clustering or density-Based Partitioning (E.g.<br />
soft-K-means and Mixture of Gaussians). Such methods concentrate on how well points fit into<br />
their clusters and tend to build clusters of proper convex shapes.<br />
When reading the following section, keep in mind that the major properties one is concerned with<br />
when designing a clustering methods include:<br />
• Type of attributes algorithm can handle<br />
• Scalability to large datasets<br />
• Ability to work with high dimensional data<br />
• Ability to find clusters of irregular shape<br />
• Handling outliers<br />
• Time complexity (when there is no confusion, we use the term complexity)<br />
• Data order dependency<br />
• Labeling or assignment (hard or strict vs. soft of fuzzy)<br />
• Reliance on a priori knowledge and user defined parameters<br />
• Interpretability of results<br />
3.1.1 Hierarchical Clustering<br />
In hierarchical clustering, the data is partitioned iteratively, by either agglomerating the data or by<br />
dividing the data. The result of such an algorithm can be best represented by a dendrogram.<br />
Figure 3-2: Dendogram<br />
© A.G.Billard 2004 – Last Update March 2011
41<br />
An agglomerative clustering starts with one-point (singleton) clusters and recursively merges two<br />
or more most appropriate clusters. A divisive clustering starts with one cluster of all data points<br />
and recursively splits the most appropriate cluster. The process continues until a stopping<br />
criterion (frequently, the requested number k of clusters) is achieved.<br />
To merge or split subsets of points rather than individual points, the distance between individual<br />
points has to be generalized to the distance between subsets. Such derived proximity measure is<br />
called a linkage metric. The type of the linkage metric used significantly affects hierarchical<br />
algorithms, since it reflects the particular concept of closeness and connectivity. Major intercluster<br />
linkage metrics include single link, average link, and complete link. The underlying<br />
dissimilarity measure (usually, distance) is computed for every pair of points with one point in the<br />
first set and another point in the second set. A specific operation such as minimum (single link),<br />
average (average link), or maximum (complete link) is applied to pair-wise dissimilarity measures:<br />
( ) ( )<br />
{ }<br />
d c, c = operation d x, y | x∈c,<br />
y∈<br />
c<br />
1 2 1 2<br />
An agglomerative method proceeds as follows:<br />
1. Initialization: To each of the N data points p i , {i=1,..,N} associate one cluster c i . You, thus,<br />
start with N clusters.<br />
2. Find the closest clusters according to a distance metric d(c i, c j ). The distance between groups<br />
can either be:<br />
• Single Linkage Clustering: The distance between the closest pair of data points<br />
d(c i ,, c j ) = Min { d(p i , p j ,) : Where data point p i is in cluster c i and data point p j , is cluster c j }<br />
• Complete Linkage Clustering: The distance between the farthest pair of data points<br />
d(c i ,, c j ) = Max { d(p i , p j ,) : Where data point p i is in cluster c i and data point p j , is cluster c j }<br />
• Average Linkage Clustering: The average distance between all pairs of data points<br />
d(c i ,, c j ) = Mean { d(p i , p j ,) : Where data point p i is in cluster c i and data point p j , is cluster c j }<br />
3. Merge the two clusters into one single cluster taking, e.g., either the mean or the median<br />
across the two clusters.<br />
4. Repeat step 2 and 3 until some criterion is achieved, such as, for instance, when the minimal<br />
number of clusters or the maximal distance between two clusters has been reached.<br />
The divisive hierarchical clustering methods work the other way around. They start by considering<br />
all data points as belonging to one cluster and divide iteratively the clusters, according to the<br />
points furthest apart.<br />
© A.G.Billard 2004 – Last Update March 2011
42<br />
Figure 3-3: Example of distance measurement in hierarchical clustering methods<br />
It is clear that the number and type of clusters will strongly depend on the choice of the distance<br />
metric and on the method used to merge the clusters. A typical measure of distance between two<br />
N-dimensional data points xy , takes the general form:<br />
p<br />
d ( x, y)<br />
= x −y<br />
N<br />
∑ i i<br />
p<br />
(3.1)<br />
i=<br />
1<br />
The 1-norm distance, i.e. p=1, sometimes referred to as the Manhattan distance, because it is the<br />
distance a car would drive in a city laid out in square blocks (if there are no one-way streets). The<br />
2-norm distance is the classical Euclidean distance.<br />
Figure 3-4 shows examples of data sets in which such nearest neighbor technique would fail.<br />
Failure to converge to a correct solution might occur, for instance, when the data points within a<br />
dataset are further apart than the two clusters. An even worse situation occurs when the clusters<br />
contain one another, as shown in Figure 3-4 right. In other words such a simple clustering<br />
technique works well only when the clusters are linearly separable. A solution to such a situation<br />
is to change coordinate system, e.g. using polar coordinates. However, determining the<br />
appropriate coordinate system remains a challenge in itself.<br />
Figure 3-4: Example of pairs of clusters, easy to see but awkward to extract for clustering algorithms<br />
© A.G.Billard 2004 – Last Update March 2011
43<br />
3.1.1.1 The CURE Clustering Algorithm<br />
The CURE algorithm starts with each input point as a separate cluster and at each successive<br />
step merges the closest pair of clusters. In order to compute the distance between a pair of<br />
clusters, for each cluster, c representative points are stored. These are determined by first<br />
choosing c well scattered 2 points within the cluster by a fraction α. The distance between the two<br />
clusters is then the distance between the closest pair of representative points – one belonging to<br />
each of the two clusters. Thus, only the representative points of a cluster are used to compute its<br />
distance from other clusters.<br />
The c representative points attempt to capture the physical shape and geometry of the cluster.<br />
Furthermore, shrinking the scattered points toward the mean by a factor α gets rid of surface<br />
abnormalities and mitigates the effects of outliers. The reason for this is that outliers typically will<br />
be further away from the cluster center, and as a result, the shrinking would cause outliers to<br />
move more toward the center while the remaining representative points would experience<br />
minimal shifts. The larger movements in the outliers would thus reduce their ability to cause the<br />
wrong clusters to be merged. The parameter α can also be used to control the shapes of clusters.<br />
As smaller value of α, the scattered points get located closer to the means, and clusters tend to<br />
be more compact.<br />
Figure 3-5: Shrink factor toward centroid<br />
Figure 3-6: Representatives of clusters<br />
2 In the first iteration, the point farthest from the mean is chosen as the first scattered point. Then, at each<br />
iteration, the point that is the farthest from the previously chosen scattered points is chosen.<br />
© A.G.Billard 2004 – Last Update March 2011
44<br />
The CURE algorithm has a number of features of general significance. It takes special<br />
care of outliers. It also uses two devices to achieve scalability. A major feature of CURE is that it<br />
represents a cluster by a fixed number c of points scattered around it. The distance between two<br />
clusters used in the agglomerative process is equal to the minimum of distances between two<br />
scattered representatives. Therefore, CURE takes a middleground approach between the graph<br />
(all-points) methods and the geometric (one centroid) methods. Single and average link<br />
closeness is replaced by representatives. Selecting representatives scattered around a cluster<br />
makes it possible to cover non-spherical shapes. As before, agglomeration continues until the<br />
requested number k of clusters is achieved. CURE employs one additional device: originally<br />
selected scattered points are shrunk to the geometric centroid of the cluster by user-specified<br />
factor α. Shrinkage suppresses the affect of the outliers since outliers happen to be located<br />
further from the cluster centroid than the other scattered representatives. CURE is capable of<br />
finding clusters of different shapes and sizes, and it is insensitive to outliers. Since CURE uses<br />
sampling, estimation of its complexity is not straightforward.<br />
Figure 3-7: Agglomeration with CURE. Three clusters, each with three representatives, are<br />
shown before and after the merge and shrinkage. Two closest representatives are connected by<br />
arrow.<br />
Summary:<br />
Advantages of hierarchical clustering include:<br />
• Embedded flexibility regarding the level of granularity<br />
• Ease of handling of any forms of similarity or distance<br />
• Consequently, applicability to any attribute types<br />
© A.G.Billard 2004 – Last Update March 2011
45<br />
Disadvantages of hierarchical clustering are related to:<br />
• Vagueness of termination criteria<br />
• The fact that most hierarchical algorithms do not revisit once constructed (intermediate)<br />
clusters with the purpose of their improvement<br />
Exercise:<br />
Determine the optimal distance metric for two examples, in which the data are either not linearly<br />
separable or linearly separable.<br />
3.1.2 K-means clustering<br />
K-Means clustering generates a number K of disjoint, flat (non-hierarchical)<br />
k<br />
clusters k = K so as to minimize the sum-of-squares criterion<br />
C , 1,... ,<br />
J<br />
( ,... )<br />
µ µ = x −µ<br />
1<br />
K<br />
K i k<br />
k = 1<br />
k<br />
i∈C<br />
2<br />
∑∑ (3.2)<br />
where x i<br />
is a vector representing the i th data point and µ is the geometric centroid of the data<br />
k<br />
points associated to cluster C . K-means is well suited to generating globular clusters. The K-<br />
Means method is numerical, unsupervised, non-deterministic and iterative. In general, the<br />
algorithm is not guaranteed to converge to a global minimum of J.<br />
k<br />
K-Means Algorithm:<br />
1 Initialization: Pick K arbitrary centroids and set their geometric means µ ,..., 1<br />
µ to<br />
K<br />
random values.<br />
2 Calculate the distance dx ( , µ ) from each data point i to each centroid k .<br />
3 Assignment Step: Assign the responsibility<br />
i<br />
k<br />
i<br />
r<br />
k<br />
of each data point i to its “closest”<br />
centroid k<br />
i<br />
(E-step). If a tie happens (i.e. two centroids are equidistant to a data<br />
point, one assigns the data point to the smallest winning centroid).<br />
{ ( )}<br />
k arg min d x , µ<br />
= (3.3)<br />
i i k<br />
k<br />
i<br />
k<br />
⎧⎧ 1 if k = k<br />
ri<br />
= ⎨⎨<br />
⎩⎩ 0 otherwise<br />
4 Update Step: Adjust the centroids to be the means of all data points assigned to<br />
them (M-step)<br />
µ =<br />
k<br />
∑<br />
i<br />
∑<br />
i<br />
rx<br />
k<br />
i<br />
r<br />
k<br />
i<br />
i<br />
(3.4)<br />
© A.G.Billard 2004 – Last Update March 2011
46<br />
5 Go back to step 2 and repeat the process until a complete pass through all the data<br />
points results in no data point moving from one cluster to another. At this point the<br />
clusters are stable and the clustering process ends.<br />
K-means clustering corresponds to a particular case of Gaussian Mixture Model estimation with<br />
EM (expectation maximization) where the covariance matrices are fixed (these are actually<br />
diagonal and isotropic), see Section 3.1.4.<br />
The properties of K-means algorithm can be summarized as follows: There are always K clusters.<br />
There is always at least one item in each cluster. The clusters are non-hierarchical and they do<br />
not overlap. Every member of a cluster is closer to its cluster than any other cluster because<br />
closeness does not always involve the 'center' of clusters.<br />
The algorithm is guaranteed to converge in a finite number of iterations.<br />
Advantages:<br />
With a large number of variables, K-Means may be computationally faster than other clustering<br />
techniques, such as hierarchical clustering or non-parametric clustering. K-Means may produce<br />
tighter clusters, especially if the clusters are globular. K-mean is guaranteed to converge.<br />
Drawbacks:<br />
K-mean clustering suffers from several drawbacks. The choice of initial partition can greatly affect<br />
the final clusters that result, in terms of inter-cluster and intra-cluster distances and cohesion.<br />
Hence, one might find it difficult to compare the quality of the clusters produced (e.g. for different<br />
initial partitions or values of K affect outcome). K-means assumes a fixed number K of clusters,<br />
which is difficult to estimate off-hands. It does not work well with non-globular clusters. Different<br />
initial partitions can result in different final clusters (see Figure 3-8). It is, therefore, good practice<br />
to run the algorithm several times using different K values, to determine the optimal number of<br />
clusters.<br />
Figure 3-8: The random initialization of K-Means can lead to different clustering results, (in this case using 3<br />
clusters) [DEMOS\CLUSTERING\KMEANS-RANDOM_INITIALIZATIONS.ML]<br />
© A.G.Billard 2004 – Last Update March 2011
47<br />
Cases where K-means might be viewed as failing:<br />
Unbalanced clusters:<br />
The K-means algorithm takes into account only the distance between the means and data points;<br />
it has no representation of the weight and breadth of each cluster.. Consequently, data points<br />
belonging to unbalanced clusters (clusters with unbalanced number of points, spread with a<br />
smaller breadth) will be incorrectly assigned.<br />
Elongated clusters:<br />
The K-means algorithm has no way to represent the shape of a cluster. Hence, a simple measure<br />
of distance would be unable to separate two elongated clusters as shown in Figure 3-9.<br />
Figure 3-9: Typical examples for which K-means is ill-suited: unbalanced clusters (left) and elongated<br />
clusters (right). In both cases the algorithm fails to separate the two clusters.<br />
[DEMOS\CLUSTERING\KMEANS-UNBALANCED.ML] [DEMOS\CLUSTERING\KMEANS-ELONGATED.ML]<br />
3.1.3 Soft K-means<br />
`Soft K-means algorithm' was offered as an alternative to K-means in order to “soften” the<br />
assignment of variables. Each data point x is given a soft `degree of assignment' to each of the<br />
means. The degree to which<br />
i<br />
i<br />
x is assigned to cluster k is the responsibility<br />
point i and is a real value comprised between 0 and 1.<br />
r<br />
k '<br />
( −β ⋅d( µ k,<br />
xi)<br />
)<br />
= e<br />
∑ ( −β ⋅ ( µ k'<br />
, i)<br />
)<br />
e<br />
(3.5)<br />
k<br />
i d x<br />
i<br />
r<br />
k<br />
of cluster k for<br />
β is the stiffness and determines the binding between clusters. The larger β , the bigger the<br />
1<br />
distance across two clusters. A measure of the disparity across clusters is given by σ ≡ ,<br />
β<br />
the radius of the circle that surrounds the means of the K clusters.<br />
∑<br />
The sum of the K responsibilities for the i th point is 1, i.e. r k = 1<br />
k<br />
i<br />
© A.G.Billard 2004 – Last Update March 2011
48<br />
Update step. The model parameters, i.e. the means, are adjusted to match the sample means of<br />
the data points that they are responsible for.<br />
k<br />
µ<br />
=<br />
∑ r<br />
i<br />
∑<br />
i<br />
k<br />
i<br />
r<br />
⋅ x<br />
k<br />
i<br />
i<br />
The update algorithm of the soft K-means is identical to that of the hard K-means, apart for the<br />
fact that the responsibilities to a particular cluster are now real numbers varying between 0 and 1.<br />
Figure 3-10: Soft K-means algorithm with a small (left), medium (center) and large (right) σ<br />
[DEMOS\CLUSTERING\SOFT-KMEANS-SIGMA.ML]<br />
Figure 3-11: Iterations of the Soft K-means algorithm from the random initialization (left) to convergence<br />
(right). Computed with σ = 10.<br />
[DEMOS\CLUSTERING\SOFT-KMEANS-ITERATIONS.ML]<br />
© A.G.Billard 2004 – Last Update March 2011
49<br />
3.1.4 Clustering with Mixtures of Gaussians<br />
An extension of the soft K-means algorithm consists of fitting the data with a Mixture of<br />
Gaussians (not to be confused with Gaussian Mixture Model (GMM))) which we will review later<br />
on. Instead of simply attaching a responsibility factor to each cluster, one attaches a density of<br />
probability measuring how well each cluster represents the distribution of the data. The method is<br />
bound to converge to a state that maximizes the likelihood of each point to belong to each<br />
distribution.<br />
Soft-Clustering methods are part of model-based approaches to clustering. In clustering with<br />
mixture of Gaussians, the model is naturally a Gaussian. Other model-based methods use, for<br />
instance, the Poisson or the Normal distributions.<br />
The main advantages of model-based clustering are:<br />
• It can make use of well-studied statistical inference techniques;<br />
• Its flexibility in choosing the component distribution;<br />
• It obtains a density estimation for each cluster;<br />
• It is a “soft” means of classification.<br />
Clusters with mixtures of Gaussian places K distributions, whose barycentres are located on the<br />
cluster means, as in Figure 3-13.<br />
Figure 3-12: Examples of clustering with Mixtures of Gaussians (the grey circles represent the first and<br />
second variances of the distributions). [DEMOS\CLUSTERING\GMM-CLUSTERING-SIMPLE.ML]<br />
Algorithm<br />
Assignment Step (E-step): The responsibilities are<br />
r<br />
k<br />
i<br />
=<br />
∑<br />
k '<br />
α<br />
k<br />
α<br />
( 2πσ<br />
k )<br />
k '<br />
1<br />
1<br />
N<br />
( 2πσ<br />
k ' )<br />
e<br />
N<br />
⎛⎛ 1<br />
⎜⎜−<br />
⋅d<br />
⎜⎜ 2<br />
⎝⎝ σ k<br />
e<br />
⎛⎛ 1<br />
⎜⎜−<br />
⋅d<br />
⎜⎜ 2<br />
⎝⎝ σ k '<br />
( µ , x )<br />
k<br />
i<br />
⎞⎞<br />
⎟⎟<br />
⎟⎟<br />
⎠⎠<br />
( µ , x )<br />
k'<br />
i<br />
⎞⎞<br />
⎟⎟<br />
⎟⎟<br />
⎠⎠<br />
(3.6)<br />
© A.G.Billard 2004 – Last Update March 2011
50<br />
where M is the number of datapoints, i.e. x={x 1 , x 2 ,..., x M }, ( , )<br />
measure, e.g. the Euclidean distance.<br />
d x y is a distance<br />
Update Step (M-step): Each cluster’s parameters µ<br />
k, αk and σ are adjusted to<br />
k<br />
match the data points for which the cluster is responsible:<br />
σ<br />
2<br />
k<br />
=<br />
µ =<br />
k<br />
∑<br />
i<br />
∑<br />
i<br />
rx<br />
k<br />
i<br />
r<br />
k<br />
i<br />
∑r<br />
i<br />
N⋅∑<br />
i<br />
∑ ri<br />
i<br />
k<br />
∑∑<br />
α =<br />
( x − µ ) 2<br />
k<br />
i i k<br />
The α represents a measure of the likelihood that the Gaussian k (or cluster k)<br />
k<br />
generated the whole dataset.<br />
k<br />
i<br />
k<br />
i<br />
r<br />
k<br />
i<br />
r<br />
k<br />
i<br />
(3.7)<br />
(3.8)<br />
(3.9)<br />
This fits a mixture of spherical Gaussians. “Spherical” means that the variance of the Gaussians<br />
is the same in all directions. In other words, in the case of multidimensional dataset, the<br />
covariance matrix of the Gaussian is diagonal and isotropic (i.e. all the elements on the diagonal<br />
are equal and all elements on the off-diagonal are zero). This algorithm is still not good at<br />
modeling datasets spread along two elongated clusters, as shown in Figure 3-9. If we wish to<br />
model the clusters by axis-aligned Gaussians, we replace the assignment rule given by Equations<br />
(3.6) and (3.8) with the following:<br />
r<br />
k<br />
i<br />
=<br />
i=<br />
1<br />
k<br />
( 2πσ<br />
) i<br />
k '<br />
( 2πσi<br />
)<br />
⎛⎛ N<br />
⎜⎜ d k<br />
⎜⎜−∑<br />
⎜⎜ i=<br />
1 2<br />
⎝⎝<br />
( µ , x )<br />
k<br />
( σi<br />
)<br />
2 ⎞⎞<br />
i ⎟⎟<br />
2 ⎟⎟<br />
⎟⎟<br />
⎠⎠<br />
(3.10)<br />
⎛⎛ N<br />
2 ⎞⎞<br />
⎜⎜ d( µ k'<br />
, xi)<br />
⎟⎟<br />
⎜⎜−∑<br />
k<br />
2 ⎟⎟<br />
1<br />
⎜⎜ i=<br />
1 2( σi<br />
) ⎟⎟<br />
⎝⎝<br />
⎠⎠<br />
∑αk<br />
e<br />
N<br />
∏<br />
k '<br />
α<br />
k<br />
N<br />
∏<br />
i=<br />
1<br />
k<br />
j<br />
1<br />
µ =<br />
∑<br />
i<br />
∑<br />
i<br />
rx<br />
k<br />
i<br />
r<br />
e<br />
k<br />
i<br />
i,<br />
j<br />
(3.11)<br />
© A.G.Billard 2004 – Last Update March 2011
51<br />
k<br />
( σ<br />
j )<br />
2<br />
=<br />
k<br />
∑<br />
i<br />
α =<br />
r<br />
k<br />
( x ) 2<br />
,<br />
− µ<br />
k<br />
i i j j<br />
N⋅<br />
k<br />
i<br />
∑<br />
∑ r<br />
i<br />
∑∑<br />
i<br />
k<br />
i<br />
r<br />
r<br />
k<br />
i<br />
k<br />
i<br />
(3.12)<br />
(3.13)<br />
Soft K-means and the mixture of Gaussians are two examples of maximum likelihood algorithm.<br />
Figure 3-13: Examples of clustering with Mixtures of Gaussians using spherical Gaussians (left) and nonspherical<br />
Gaussians (i.e. with full covariance matrix) (right). Notice how the clusters become elongated<br />
along the direction of the clusters (the grey circles represent the first and second variances of the<br />
distributions).<br />
[DEMOS\CLUSTERING\GMM-ELONGATED.ML]<br />
A fatal flaw of maximum likelihood (KABOOM!):<br />
The major drawback of maximizing the likelihood (people tend to actually minimize the –log of the<br />
likelihood) is that there is no actual maximum. Indeed, the pdf is a positive but unbounded<br />
function. As a result, one may observe the so-called KABOOM effect.<br />
When the mean of one of the Gaussian is located on a particular data point, and, if the variance is<br />
2<br />
2<br />
already very smallσ<br />
52<br />
The estimation of Mixture of Gaussians we reviewed in the previous section assumed a diagonal<br />
covariance matrix for each Gaussian. This is rather restrictive as it forces the Gaussians to have<br />
their axes aligned with the original axes of the data, see Figure 3-14. As a result, they are illsuited<br />
for estimating highly non-linear densities that have local correlations.<br />
Figure 3-14: A spherical Mixture of Gaussian Model can only fit Gaussians whose axes are<br />
aligned with the data axes. It may require far more local models to account for local correlations<br />
across the dimensions of the data X.<br />
Figure 3-15: In contrast, a Gaussian Mixture Model can exploit local correlations and adapt the<br />
covariance matrix of each Gaussian so that it aligns with the local direction of correlation.<br />
Gaussian Mixture Model is a generic method that fits a mixture of Gaussians with full covariance<br />
matrices. Each Gaussian serves as a local linear model and in effect performs a local PCA on the<br />
data. By mixing the effect of all these local models, one can obtain a very complex density<br />
estimate, see as an illustration the schematics in Figure 3-14 and Figure 3-15.<br />
j<br />
j=<br />
Let suppose that we have at our disposal { } 1,...<br />
X<br />
i<br />
M<br />
= x the set of M N-dimensional data points<br />
i=<br />
1,... N<br />
whose density we wish to estimate. We consider that these are observed instances of the<br />
variable x . The probability distribution function or density of x is further assumed to be<br />
k<br />
k<br />
composed of a mixture of k = 1,.., K Gaussians with mean ∑ , i.e.<br />
µ and covariance matrix<br />
K<br />
k k k k k k<br />
( ) = α<br />
k<br />
⋅<br />
k( | µ , ∑ ), with<br />
k( | µ , ∑ ) = ( µ , ∑ )<br />
∑ (3.14)<br />
p x p x p x N<br />
k=<br />
1<br />
© A.G.Billard 2004 – Last Update March 2011
53<br />
Theα are the so-called mixing coefficients. Their sum is 1, i.e.<br />
k<br />
K<br />
∑<br />
k = 1<br />
α = 1<br />
k<br />
. These coefficients are<br />
usually estimated together with the estimation of the parameters of the Gaussians (i.e. the means<br />
and covariance matrices). In some cases, they can however be set to a constant. For instance to<br />
give equal weight to each Gaussian (in this case, α 1<br />
k<br />
= ∀ k = 1,... K). When the<br />
K<br />
coefficients are estimated, they end up representing a measure of the proportion of data points<br />
that belong most to that particular Gaussian (this is similar to the definition of theα seen in the<br />
case of Mixture of Gaussians in the previous section). In a probabilistic sense, these coefficients<br />
represent the prior probability with which each Gaussian may have generated the whole dataset<br />
M<br />
j<br />
and can hence be written αk<br />
= p( k) =∑ p( k|<br />
x)<br />
.<br />
j=<br />
1<br />
Learning of GMM requires determining the means and covariance matrices and prior probabilities<br />
of the K Gaussians. The most popular method relies on Expectation-Maximization (E-M). We<br />
advise the reader to take a detour here and read the tutorial by Gilmes provided in the annexes of<br />
these lectures notes for a full derivation of GMM parameters estimation through E-M. We briefly<br />
summarize the principle next.<br />
We want to maximize the likelihood of the model’s parameters<br />
1 1 1<br />
{ α ,..... α K , µ ,..... µ<br />
K , ,..... K ,}<br />
Θ= ∑ ∑ given the data, that is:<br />
Assuming that the set of M datapoints { }<br />
j=<br />
1<br />
(iid), we get:<br />
( ) ( )<br />
max L Θ | X = max p X | Θ (3.15)<br />
Θ<br />
X<br />
Θ<br />
j<br />
M<br />
= x is identically and independently distributed<br />
M K<br />
j k k<br />
( Θ ) = ∑α k<br />
⋅p( x µ ∑ )<br />
max p X | max | ,<br />
Θ<br />
Θ<br />
∏ (3.16)<br />
j=<br />
1 k=<br />
1<br />
Taking the log of the likelihood is often a good approach as it simplifies the computation. Using<br />
the fact that the optimum *<br />
log f x , one can<br />
compute:<br />
x of a function f ( x)<br />
is also an optimum of ( )<br />
( Θ ) = p( X Θ)<br />
max p X | max log |<br />
Θ<br />
Θ<br />
⎛⎛<br />
max log | , max log | ,<br />
Θ<br />
Θ<br />
j=<br />
1 k= 1 j= 1 ⎝⎝ k=<br />
1<br />
M K M K<br />
j k k j k k<br />
∏∑α k<br />
⋅p( x µ ∑ ) = ∑ ⎜⎜∑α k<br />
⋅p( x µ ∑ )<br />
⎞⎞<br />
⎟⎟<br />
⎠⎠<br />
(3.17)<br />
The log of a sum is difficult to compute and one is led to proceed iteratively by calculating an<br />
approximation at each step (EM), see Sections 9.4.2.2 The final update procedure runs as<br />
follows:<br />
Initialization of the parameters:<br />
Initialize all parameters to a value to start with. The<br />
p 1<br />
,..,<br />
K<br />
p can for instance be initialized with a<br />
uniform prior, while the means can be initialized by running K-Means first. The complete set of<br />
parameters is then given by:<br />
© A.G.Billard 2004 – Last Update March 2011
54<br />
( ) ( ) ( ) ( ) ( ) ( )<br />
{ α 0 ,..., α 0 , 0 ,..., 0 , 0 ,...,<br />
0<br />
K<br />
µ µ<br />
K K }<br />
Θ = ∑ ∑<br />
0 1 1 1<br />
E-step:<br />
At each step t, estimate, for each Gaussian k, the probability that this Gaussian is being<br />
responsible for generating each point of the dataset by computing:<br />
i k ( t) k( t)<br />
( t)<br />
( )<br />
p<br />
( )<br />
( | ,<br />
t<br />
k<br />
x µ ∑ ) ⋅α<br />
t<br />
k<br />
αk = p( k|<br />
Θ ) =<br />
i k ( t)<br />
t<br />
∑ pk<br />
x | j,<br />
µ ⋅α<br />
(3.18)<br />
j<br />
j<br />
( )<br />
( )<br />
M-step:<br />
Recompute the means, Covariances and prior probabilities so as to maximize the log-likelihood of<br />
the current estimate:<br />
probabilities<br />
( t)<br />
( | )<br />
p k Θ :<br />
( t)<br />
( L( X)<br />
)<br />
log |<br />
Θ and using current estimate of the<br />
∑<br />
( )<br />
j ( t)<br />
p( k| x , Θ )<br />
j ( t)<br />
p k| x , Θ ⋅<br />
k( t 1)<br />
j<br />
µ + =<br />
∑<br />
j<br />
x<br />
j<br />
(3.19)<br />
( + 1)<br />
kt<br />
∑ =<br />
∑<br />
j<br />
( )<br />
( )<br />
( | , )<br />
+ 1 ( + 1)<br />
( µ )( µ )<br />
i ( t)<br />
p( k| x , Θ )<br />
p k x Θ x − x −<br />
( t 1)<br />
α +<br />
k<br />
j t j k t j k t<br />
=<br />
∑<br />
i<br />
∑<br />
j<br />
j ( t)<br />
( | , Θ )<br />
Pk x<br />
M<br />
T<br />
(3.20)<br />
(3.21)<br />
Note finally that we have not discussed how to choose the optimal number of states K. There are<br />
various techniques based on determining a tradeoff between increasing the number of states and<br />
hence the number of parameters (increasing greatly the computation required to estimate such a<br />
large set of parameters) and the improvement that such an increase brings to the computation of<br />
the likelihood. Such a tradeoff can be measured by either of the BIC, DIC or AIC criteria. A more<br />
detailed description is given in 7.2.3.<br />
Figure 3-16 shows an example of clustering using a 3 GMM model with full covariance matrix and<br />
illustrates how a poor initialization can result in poor clustering.<br />
© A.G.Billard 2004 – Last Update March 2011
55<br />
Figure 3-16: Clustering with 3 Gaussians using full covariance matrix. Original data (top left), superposed<br />
Gaussians (top right), regions associated to each Gaussian using Bayes rule for determining the separation<br />
(bottom right); effect of a poor initialization on the clustering (bottom right).<br />
© A.G.Billard 2004 – Last Update March 2011
56<br />
3.2 Linear Classifiers<br />
In this section, we will consider solely ways to provide a linear classification of data. Non-linear<br />
methods for classification such as ANN with backpropagation and Support Vector Machine will be<br />
covered later on, in these lecture notes.<br />
Linear Discriminant Analysis and the related Fisher's linear discriminant are methods to find the<br />
linear combination of features (projections of the data) that best separate two or more classes of<br />
objects. The resulting combination may be used as a linear classifier. We describe these next.<br />
3.2.1 Linear Discriminant Analysis<br />
Linear Discriminant Analysis (LDA) combines concepts of PCA and clustering to determine<br />
projections along which a dataset can be best separated into two distinct classes.<br />
M×<br />
N<br />
Consider a data matrix composed of M N-dimensional data points, i.e. X ∈° . LDA aims to<br />
M×<br />
P<br />
i<br />
find a linear transformation A∈° that maps each column x of X, for i= 1,... M (these are N-<br />
dimensional vectors) into a corresponding q-dimensional vector y<br />
i<br />
. That is,<br />
( )<br />
i i i<br />
: N<br />
q<br />
A x ∈ → y = Ax ∈ q≤N<br />
° ° (3.22)<br />
Let us further assume that the data in X is partitioned into K classes{ } , where each class<br />
k = 1<br />
k<br />
C contains<br />
K<br />
k<br />
n data points and<br />
∑<br />
k = 1<br />
n<br />
k<br />
= M<br />
. LDA aims to find the optimal transformation A such<br />
that the class structure of the original high-dimensional space is preserved in the low-dimensional<br />
space.<br />
In general, if each class is tightly grouped, but well separated from the other classes, the quality<br />
of the cluster is considered to be high. In discriminant analysis, two scatter matrices, called<br />
within-class ( S ) and between-class ( S<br />
w<br />
b<br />
) matrices, are defined to quantify the quality of the<br />
clusters as follows:<br />
where<br />
k 1 1<br />
µ = , µ =<br />
n<br />
N<br />
w<br />
K<br />
i k i k<br />
∑∑( µ )( µ )<br />
S = x − x −<br />
S<br />
∑ ∑∑<br />
k = 1 x ∈C<br />
k<br />
k<br />
x∈C x∈C<br />
k = 1<br />
i<br />
k<br />
( µ µ )( µ µ )<br />
K<br />
k<br />
b<br />
= ∑ n<br />
k<br />
−<br />
k<br />
−<br />
k = 1<br />
K<br />
k<br />
T<br />
T<br />
C<br />
k<br />
K<br />
(3.23)<br />
are, respectively, the mean of the k-th class and the<br />
global mean. An implicit assumption of LDA is that all classes have equal class covariance<br />
(otherwise, the elements of the within-class matrix should be normalized by the covariance on the<br />
set of data points of that class).<br />
© A.G.Billard 2004 – Last Update March 2011
57<br />
When the transformation A is linear, as given by 2.40, solving the above problem consists of<br />
finding the optimum of J( A)<br />
T<br />
ASA<br />
b<br />
= , where represents the matrix determinant.<br />
T<br />
ASA<br />
w<br />
Equivalently, this reduces to maximizing trace( S ) and minimizing trace( S ). It is easy to see<br />
that trace( S ) measures the closeness of the vectors within the classes, while trace(<br />
w<br />
S )<br />
w<br />
measures the separation between classes.<br />
Such an optimization problem is equivalent to an eigenvalue problem of the<br />
form Sx= λSx, λ ≠ 0. The solution can be obtained by performing eigenvalue decomposition<br />
b<br />
on the matrix<br />
w<br />
−1<br />
b<br />
S<br />
S<br />
w<br />
if<br />
Sb<br />
is non singular or on<br />
b<br />
S S<br />
−1<br />
w<br />
b<br />
if<br />
S is non singular.<br />
w<br />
There are at most K-1 eigenvectors corresponding to nonzero eigenvalues, since the rank of the<br />
matrix S is bounded from above by K-1. In effect, LDA requires that at least one of the two<br />
b<br />
matrices Sb,<br />
S be non-singular. The above problem is an intrinsic limitation of LDA and referred<br />
w<br />
to as the singularity problem that is, it fails when all scatter matrices are singular. If both matrices<br />
are singular, then, one can use extension of LDA using pseudo-inverse transformation. Another<br />
approach to deal with the singularity problem is to apply an intermediate dimension reduction<br />
stage using Principal Component Analysis (PCA) before LDA.<br />
w<br />
3.2.2 Fisher Linear Discriminant<br />
The Fisher's linear discriminant is very similar to LDA in that it aims at determining a criterion for<br />
optimizing classification by increasing the between class similarity and decreasing the within<br />
class similarity. It however differs from LDA in that it does not assume that the classes are as<br />
normally distributed classes or equal class covariances. For two classes whose probability<br />
distribution functions have associated means<br />
1 2<br />
between and within-classes matrices are given by:<br />
S<br />
S<br />
w<br />
b<br />
µ , µ and covariance matrices ∑1,<br />
∑ , then the<br />
2<br />
1 2 1 2<br />
( µ µ )( µ µ )<br />
= − −<br />
=∑ +∑<br />
1 2<br />
T<br />
(3.24)<br />
In the case where there are more than two classes (see example for LDA), the analysis used in<br />
the derivation of the Fisher discriminant can be extended to find a subspace which appears to<br />
contain all of the class variability. Then the within and between class matrices are given by:<br />
S<br />
S<br />
k = 1<br />
( µ µ )( µ µ )<br />
K<br />
k<br />
w<br />
= ∑ n<br />
k<br />
−<br />
k<br />
−<br />
k = 1<br />
b<br />
K<br />
∑<br />
= ∑<br />
k<br />
T<br />
(3.25)<br />
© A.G.Billard 2004 – Last Update March 2011
58<br />
When classification results from a linear projection through a map A, as in LDA, then again the<br />
problem corresponds to maximizing J( A)<br />
.<br />
T<br />
ASA<br />
b<br />
= with S ,<br />
w<br />
T<br />
ASA<br />
w<br />
Sb<br />
defined as above.<br />
Figure 3-17: Elongated data from two classes: the black samples are spread more widely than<br />
the white ones (left), the direction of maximum variance found by PCA is not optimal for<br />
separating the two classes. LDA is able to find a better projection but it still does not allow linear<br />
separation. Fisher Linear Discriminant takes into account the difference in variance of the two<br />
distributions and finds a separable projection. [DEMOS\PROJECTION\PCA-LDA-FISHER.ML]<br />
3.2.3 Mixture of linear classifiers (boosting and bagging)<br />
Adapted from Bagging Predictors by Leo Breiman, Machine Learning, 24, 123–140 (1996)<br />
Linear classifiers as described previously rely on regression and can perform only binary<br />
classification. To extend the domain of application of classifiers to allow classification of more<br />
than two classes, linear classifiers can be combined. A number of combining techniques can be<br />
used, among which bagging and boosting have appeared in recent years as the most popular<br />
methods due to their simplicity. All of these methods modify the training data set, build classifiers<br />
on these modified training sets, and then combine them into a final decision rule by simple or<br />
weighted majority voting. However, they perform in a different way.<br />
We briefly review bagging and boosting next. Other multi-class classification methods which we<br />
will see in this course are the multi-layer perceptron and multi-class support vector machines.<br />
3.2.3.1 Bagging<br />
Let us assume, once more, that the complete training set is composed of M N-dimensional data<br />
M i N<br />
points X { x} 1<br />
, x ,<br />
i<br />
= ∈° with associated labels { } ,<br />
1<br />
i=<br />
M<br />
i<br />
= ∈• . The labels are not<br />
i=<br />
Y y y<br />
necessarily binary and hence this allows multi-class classification.<br />
Bagging consists in selecting (drawing with replacement) at random K subsets of training<br />
data<br />
k<br />
X k 1,...<br />
K<br />
{ }<br />
k=<br />
1<br />
k k<br />
= K . Each of these subsets will be used to create a classifier C ( X )<br />
. Each<br />
k<br />
classifier performs a mapping C : X → Y. The final classifier is built from all classifiers and is<br />
such that it outputs the class predicted most often by all K classifiers:<br />
© A.G.Billard 2004 – Last Update March 2011
59<br />
C:<br />
X → Y<br />
( )<br />
C x<br />
K<br />
= arg max ∑ 1<br />
y k<br />
kC : x = y<br />
( )<br />
(3.26)<br />
The hope is, thus, that the aggregation of all the classifiers will give better classification results<br />
than training a single classifier on the whole dataset.<br />
If the classification method bases its estimation on the average of the data, for a very<br />
heterogeneous dataset with local structures in the data, such an approach may fail to properly<br />
represent the local structure unless the classifier is provided with enough granularity to<br />
encapsulate these non-linearities 3 . A set of classifiers based on smaller subsets of the data may<br />
have more chances to catch these local structures. However, training classifiers on only a small<br />
subset of the data at hand may also degrade performance as they may fail to extract the generic<br />
sets of features of the data at hand (because they see too small a set) and focus on noise or<br />
particularities of each subset. This is a usual problem in machine learning and in classification, in<br />
particular. One must find a tradeoff between generalizing (hence having much less parameters<br />
than original datapoints) and representing all the local structures in the data.<br />
3.2.3.2 Boosting / Adaboost<br />
While bagging creates in parallel a set of K classifiers, boosting creates the classifiers<br />
sequentially and uses each previously created classifier to boost training of the next classifier.<br />
Principle:<br />
A weight is associated to each datapoint of the training set as well as to each classifier. Weights<br />
associated to the datapoint are adapted at each iteration step to reflect how well the datapoint is<br />
predicted by the global classifier. The less well classified the data point, the bigger its associated<br />
weight. This way, poorly classified data will be given more influence on the measure of the error<br />
and will be more likely to be selected to train the new classifier created at each iteration. As a<br />
result, they should be better estimated by this new classifier.<br />
Similarly the classifiers are weighted when combined to form the final classifier, so as to reflect<br />
their classification power. The poorer the classification power of a given classifier on the training<br />
set associated with this classifier, the less influence the classifier is given for final classification.<br />
Algorithm:<br />
M<br />
i i i N i<br />
Let us consider a binary classification problem with X = { x , y } , x ∈ , y ∈ { + 1; −1}<br />
v, i 1... M<br />
i<br />
i=<br />
1<br />
° . Let<br />
= be the weights associated to each datapoint. Usually these are uniformly distributed<br />
k<br />
for starters and hence one builds a first set of l classifiers C , k 1,... l<br />
all the set of data points.<br />
= by drawing uniformly from<br />
The final classifier is composed of a linear combination of the classifiers, so that each data point x<br />
is then classified according to the function:<br />
3 For instance in the case of multi-layer perceptron, one can add several hidden neurons and achieve optimal<br />
performance. However in this case one may argue that each neuron in the hidden layer is some sort of subclassifier<br />
(especially when using the threshold function as activation function for the output of the hidden neurons). Similarly in the<br />
case of Support Vector Machines, one may increase the number of support vector points until reaching an optimal<br />
description of all local non-linearities. At maximum, one may take all points as support vectors….!<br />
© A.G.Billard 2004 – Last Update March 2011
60<br />
with w ,..., 1 K<br />
K<br />
k<br />
( ) ( )<br />
C x = ∑ wkC x<br />
k = 1<br />
w the weights associated with each classifier.<br />
Boosting builds classifiers incrementally so as to minimize classification error. To do this, one first<br />
updates the weights associated to each datapoint. These weights represent the probability with<br />
which the datapoint should be used. The less well the point is classified, the more likely it is to be<br />
included in the training set for the new classifier.<br />
Fist one computes how well each classifier represents the whole dataset by computing a local<br />
error:<br />
e<br />
k<br />
1<br />
= ∑ vi<br />
M<br />
(3.27)<br />
i k i i<br />
x : C ( x ) ≠ y<br />
The weight of each classifier is then computed to reflect how well this particular classifier<br />
w = log 1/ β .<br />
represents all the data at hand according to ( )<br />
k<br />
Then, one re-estimates the weight of each datapoint so as to give more weight to points that are<br />
ek<br />
misclassified. If β<br />
k<br />
= , k = 1... K<br />
1−<br />
e<br />
all the weights of the datapoints.<br />
k<br />
, then<br />
∑<br />
vi<br />
→ vi⋅β<br />
k<br />
k i i<br />
C ( x ) = y<br />
k<br />
, followed by a normalization of<br />
More recent advances in boosting techniques determine the weights associated to each classifier<br />
by making a line search on the global error function. The error on the complete classifier is given<br />
by:<br />
i<br />
( )<br />
M<br />
i<br />
( ) sgn 1 ( )<br />
∑ (3.28)<br />
e x = −C x ⋅y<br />
i=<br />
1<br />
Since this function is discontinuous and may change drastically as an effect of adding a new<br />
classifier, one prefers to optimize an upper bound on this function with the following loss function:<br />
i<br />
( ( ))<br />
M<br />
i<br />
( ( )) exp ( )<br />
∑ (3.29)<br />
LC X = − Cx ⋅y<br />
i=<br />
1<br />
which is continuous and onto which one can then perform a line search on a sort of gradient<br />
descent on the error. The local loss reduction resulting from adding a new classifier<br />
associated weight w<br />
k +<br />
can be computed as follows::<br />
1<br />
k +<br />
( ( ) 1<br />
k + 1 ( ))<br />
∂ LC X + w C X<br />
∂w<br />
k 1<br />
C +<br />
with<br />
(3.30)<br />
Deriving and recomputing the weights for each datapoint for the new classifier<br />
with<br />
v<br />
i<br />
=<br />
M<br />
e<br />
∑<br />
j=<br />
1<br />
k + 1<br />
e<br />
k +<br />
i<br />
( x )<br />
j<br />
1 ( x )<br />
, one gets the same reformulation of the weight update as<br />
w<br />
1 ⎛⎛1−<br />
e log<br />
⎝⎝<br />
k+<br />
1<br />
k+<br />
1<br />
= ⎜⎜ ⎟⎟<br />
2 ek<br />
+ 1<br />
⎞⎞<br />
⎠⎠<br />
(3.31)<br />
© A.G.Billard 2004 – Last Update March 2011
61<br />
Figure 3-18: Linear combination of very simple classifiers (learners) trained by boosting. Each<br />
classifier on its own would not be able to separate the data. Their linear combination is able to<br />
separate complex data.[DEMOS\CLASSIFICATION\BOOSTING.ML]<br />
Note:<br />
Boosting and Bagging are methods based on a supervised process, where the “real” class of the<br />
data is known a priori. In contrast, the clustering techniques seen in the first part of this chapter<br />
work in an unsupervised manner, where the true labeling of the data is unknown.<br />
3.3 Bayes Classifier<br />
The simplest means to perform binary classification in probabilistic models is to use the so-called<br />
i<br />
y ∈− 1, + 1 of a set of i = 1.... M datapoints x i .<br />
Bayes Classifier. Assume a binary labeling [ ]<br />
Assume that you have built two probabilistic models p ( y| x) and p ( y|<br />
x)<br />
+ −<br />
that predict the<br />
probability that the data point x had associated label +1 and -1 respectively. A Bayes classifier will<br />
decide on the correct labeling simply by comparing the relative probabilities of each model, i.e.:<br />
( ) ≥ ( )<br />
If p y| x p y| x , then y=+1.<br />
+ −<br />
Otherwise y=-1.<br />
(3.32)<br />
Clearly such a simplistic model is bound to be very erroneous as it does not take into account the<br />
absolute value of the likelihood associated with each model. If both classifiers are predicting the<br />
labeling of x with a very very low likelihood (which happens when the data point x is very far from<br />
the training points or when the two classes overlap heavily in that region) then, deciding on one<br />
class label over the other is usually no better than random. Besides, when p+ and p are two<br />
−<br />
arbitrary densities, comparing these may be dangerous if one did not make sure that the<br />
© A.G.Billard 2004 – Last Update March 2011
62<br />
quantities are comparable. Since a pdf is a positive, but unbounded (above), function, its<br />
likelihood may grow arbitrarily. It usually grows with the numer of parameters. A good precaution<br />
is then to make sure that the two classifiers have the same number of parameters and are trained<br />
on the same number of datapoints. The latter means that one must have at its disposal as many<br />
examples of the positive class as that of the negative class. If this can not be ensured, then one<br />
may apply some normalization term on the likelihood of each classifier or one may use a<br />
threshold on the likelihood of both models to determine when inference is warranted. Despite<br />
these caveats, Bayes classifiers remain quite popular, in part because of their extreme simplicity,<br />
but also because they yield very good performance in practice.<br />
Note that Bayes classification can easily be extended to multiclass classification. Assume that<br />
i<br />
you wish to classify a set of datapoints { }<br />
i=<br />
1<br />
M<br />
X = x into K classes<br />
i<br />
i<br />
y associated to each datapoint x , i = 1.... M,<br />
can then take any value<br />
compute the posterior probability of each class, using:<br />
1 K<br />
C ,...., C . Each label<br />
1 K<br />
C ,...., C . One can then<br />
i<br />
( | )<br />
p y = C x =<br />
i<br />
i<br />
p( y = C ) p( x|<br />
y = C )<br />
K<br />
k<br />
k<br />
∑ p( y = C ) p( x|<br />
y = C )<br />
k = 1<br />
(3.33)<br />
We see next how this can be used when using Gaussian Mixture Models. Note that we will revisit<br />
multi-class classification using kernel methods in Section 5.10.<br />
3.4 Linear classification with Gaussian Mixture Models<br />
The Gaussian Mixture Model, introduced in Section 3.1.5, can be used in conjunction with the<br />
Bayes classifier to perform binary classification. For two knows classes of datapoints, one can<br />
train two separate GMM-s, one for each class of datapoints and use the Bayes classifier to<br />
determine the labeling of any given datapoint. In other word, each GMM yields a density<br />
p and p which can then be used to determine the label of a new training point using (3.32).<br />
+ −<br />
To ensure that the two models are comparable, one should train two GMM with same number of<br />
Gaussians, using the same modeling (with full, diagonal or isotropic covariance matrix in each<br />
case), and using similar number of training points for each GMM. Figure 3-19 shows one example<br />
of such classification using two GMM-s with 8 Gaussians each.<br />
© A.G.Billard 2004 – Last Update March 2011
63<br />
Figure 3-19: Bayes classification using a two GMMs with 8 Gaussians each and full covariance matrix. From<br />
left to right top to bottom: i) original datapoint (in dark, datapoints belonging to class +1, empty circles<br />
denotes datapoints belonging to class -1), ii) result of the classification; all datapoints are correctly classified<br />
in their respective class; iii) the 16 Gaussians superimposed on the datapoints; iv) the region associated to<br />
each class using Bayes classification.<br />
3.5 Further Readings<br />
There exist numerous methods to cluster or classify data. This chapter dealt only with some of<br />
the major algorithms for clustering and classification from which most of state-of-the-art methods<br />
are derived. In this manuscript, we will also see two other techniques for classification as part of<br />
the Artificial Neural Networks chapter. These are the perceptron and the backpropagation<br />
algorithm.<br />
In part-II of this manuscript, we will also consider other techniques for classification, such as<br />
Support Vector Machine and Support Vector Clustering that exploit non-linear transformation of<br />
the data through kernel projection.<br />
© A.G.Billard 2004 – Last Update March 2011
64<br />
4 Regression Techniques<br />
There is a growing interest in machine learning to design powerful algorithms for performing nonlinear<br />
regression. We will here consider a few of these. The principle behind the technique we will<br />
present here is the same as the one used in most other variants we find in the literature and<br />
hence this offers a good background for an interested reader.<br />
Consider a multi-dimensional (zero-mean) variable<br />
N<br />
x∈° and a one-dimensional<br />
variable y ∈ ° , regression techniques aim at approximating a relationship f between y and x by<br />
building a model of the form:<br />
y= f ( x)<br />
(4.1)<br />
4.1 Linear Regression<br />
The most classical technique that the reader will probably be familiar with is the linear regressive<br />
model, whereby one assumes that f is a linear function parametrized by<br />
( , )<br />
T<br />
y f x w x w<br />
w∈ °<br />
N<br />
, that is:<br />
= = (4.2)<br />
For a given instance of the pair x and y one can solve explicitly for w . Consider now the case<br />
i<br />
where we are provided with a set of M observed instances X = { x } and { } i<br />
Y y<br />
i=<br />
1<br />
i=<br />
1<br />
M<br />
M<br />
= of the<br />
variables x and y such that the observation of y has been corrupted by some noise which may<br />
or not be a function of x, i.e. ε ( x)<br />
:<br />
( )<br />
T<br />
y x w ε x<br />
= + (4.3)<br />
Classical means to estimate the parameters w is through mean-square, which we review next.<br />
4.2 Partial Least Square Methods<br />
Adapted from R. Rosipal and N. Kramer, Overview and Recent Advances in Partial Least Squares, C. Saunders et<br />
al. (Eds.): SLSFS 2005, LNCS 3940, pp. 34–51, 2006.<br />
Partial Least Squares (PLS) refer to a wide class of methods for modeling relations between sets<br />
of observed variables by means of latent variables. It comprises regression and classification<br />
tasks as well as dimension reduction techniques and modeling tools. As the name implies, PLS is<br />
i<br />
based on least-square regression. Consider a set of M pairs of variables { }<br />
i=<br />
1<br />
M<br />
i<br />
Y = { y } , least-square regression looks for a mapping w that sends X onto Y, such that:<br />
i=<br />
1<br />
.<br />
X<br />
M<br />
= x and<br />
© A.G.Billard 2004 – Last Update March 2011
65<br />
⎛⎛<br />
min ⎜⎜<br />
w<br />
⎝⎝<br />
N<br />
i=<br />
1<br />
1<br />
2<br />
( ) 2<br />
i<br />
i<br />
xw−<br />
y<br />
⎞⎞<br />
⎟⎟<br />
⎠⎠<br />
∑ (4.4)<br />
Note that each variable pair must have the same dimension. This is hence a particular case of<br />
regression.<br />
PCA and CCA by extension can be viewed as regression problems, whereby one set of variable<br />
Y can be expressed in terms of a linear combination of the second set of variable X.<br />
The primary problem with PCA Regression is that PCA does not take into account the response<br />
variable when constructing the principal components or latent variables. Thus even for easy<br />
classification problems such as that shown in Figure 4-1, the method may select poor latent<br />
variables. PLS incorporates information about the response in the model by using latent<br />
variables.<br />
Figure 4-1: LEFT: Line is direction of maximum variance (w) constructed by PCA. RIGHT:<br />
Line is direction w constructed by PLS.<br />
The underlying assumption of all PLS methods is that the observed data is generated by a<br />
system or process which is driven by a small number of latent (not directly observed or<br />
measured) variables. In its general form PLS creates orthogonal score vectors (also called latent<br />
vectors or components) by maximizing the covariance between different sets of variables. In this<br />
respect, PLS is similar to CCA in its principle. It however differs in the algorithm.<br />
The connections between PCA, CCA and PLS can be seen through the optimization criterion they<br />
use to define projection directions. PCA projects the original variables onto a direction of maximal<br />
variance called principal direction. Similarly, CCA finds the direction of maximal correlation across<br />
two sets of variables. PLS represents a form of CCA, where the criterion of maximal correlation is<br />
balanced with the requirement to explain as much variance as possible in both X and Y spaces.<br />
Formally, CCA and PLS can be viewed as finding the solution to the following optimization<br />
problem. For two sets of variables X and Y, find the set of vectors w , w that maximizes the<br />
following quantity:<br />
ForγX<br />
γY<br />
0<br />
PLS is found.<br />
max<br />
2<br />
cov ( Xwx,<br />
Ywy)<br />
([ 1 ] var( x)<br />
) [ 1 ] var( y)<br />
( )<br />
γX Xw γX γY Yw γY<br />
wx<br />
= wy<br />
= 1<br />
− + − +<br />
= = , the above optimization leads to CCA. While forγX<br />
= γY<br />
= 1, the solution to<br />
x<br />
y<br />
(4.5)<br />
© A.G.Billard 2004 – Last Update March 2011
66<br />
4.3 Probabilistic Regression<br />
Probabilistic regression is a statistical approach to classical linear regression and assumes that<br />
the observed instances of x and y have been generated by an underlying probabilistic process of<br />
which it will try to build an estimate. The rationale goes as follows:<br />
If one knows the joint distribution ( , )<br />
p x y of x and y , then an estimate y ) of the output y can be<br />
built from knowing the input x by computing the expectation of y given x ,<br />
{ ( )}<br />
yˆ E p y|<br />
x<br />
= (4.6)<br />
Note that in many cases, if one is solely interested in constructing a regressive model, one does<br />
not need to build a model of the joint density but needs solely to estimate the<br />
conditional ( | )<br />
p y x .<br />
Probabilistic regression extends the concept of linear regression by assuming that the observed<br />
values of y differ from f ( x ) by an additive random noiseε (noise is usually assumed to be<br />
independent of the observable x ):<br />
( , )<br />
y= f x w + ε<br />
(4.7)<br />
Usually, to simplify computation, one further assumes that the noise follows a zero-mean<br />
2<br />
Gaussian distribution with uncorrelated isotropic varianceσ . The covariance matrix is diagonal<br />
with all elements equal to 2<br />
2<br />
ε = N 0, σ . Such an assumption is called<br />
putting a prior distribution over the noise.<br />
σ ; so we write simply ( )<br />
Let us first consider the probabilistic solution to the linear regression problem described before,<br />
that is:<br />
2<br />
( 0, )<br />
T<br />
y xw N σ<br />
= + (4.8)<br />
We have now one more variable to estimate, namely the variance of the noiseσ .<br />
Assuming that all pairs of observables are i.i.d (identically independently distributed), we can<br />
construct an estimate of the conditional probability of y given x and a choice of parameters<br />
w,<br />
σ as:<br />
M<br />
i<br />
( | , , σ) p( y| x , w,<br />
σ)<br />
p y x w<br />
= ∏ (4.9)<br />
i=<br />
1<br />
Solving for the fact that sole the noise model is probabilistic and that it follows a Gaussian<br />
distribution with zero mean, we obtain:<br />
© A.G.Billard 2004 – Last Update March 2011
67<br />
T<br />
( yi<br />
− xi<br />
w)<br />
2<br />
M ⎛⎛<br />
⎞⎞<br />
1<br />
⇒ p( y| x, w, σ ) = ∏ exp⎜⎜−<br />
⎟⎟<br />
2<br />
i=<br />
1 2πσ<br />
⎜⎜ 2σ<br />
⎟⎟<br />
⎝⎝<br />
⎠⎠<br />
1 ⎛⎛ 1<br />
= exp⎜⎜− − −<br />
2<br />
2πσ<br />
⎝⎝ 2σ<br />
T<br />
T<br />
T<br />
( y X w) ( y X w)<br />
⎞⎞<br />
⎟⎟<br />
⎠⎠<br />
(4.10)<br />
In other words, the conditional is a Gaussian distribution with mean<br />
matrix<br />
σ<br />
2 I<br />
, i.e.<br />
T 2<br />
( σ) ( σ )<br />
p y| x, w, N X w, I .<br />
T<br />
X wand covariance<br />
= (4.11)<br />
To get a good estimate of the conditional distribution given in (4.11), it remains to find a good<br />
estimate of the two open parameters w and σ .<br />
In Bayesian formalism, to simplify the search for the optimal w , one would also specify a prior<br />
over the parameter w. Typically, one would assume a zero mean Gaussian prior with fixed<br />
covariance matrix ∑ :<br />
w<br />
⎛⎛ 1 T −1<br />
⎞⎞<br />
p( w) = N( 0, ∑<br />
w) = exp ⎜⎜− w ∑w<br />
w⎟⎟<br />
⎝⎝ 2 ⎠⎠<br />
(4.12)<br />
Let us now assume that we are provided with a set of input output pairs{ X,<br />
y }, where X is a<br />
N× M matrix of input and y a 1× N set of associated output. One can then compute the<br />
weight w that explains best (in a likelihood sense) the distribution of input-output pairs in the<br />
training set. To this end, one must first find an expression for the posterior distribution over w ,<br />
which is given using Bayes’ Theorem:<br />
( | , ) ( )<br />
p( y X)<br />
likelihood × prior<br />
p y X w p w<br />
posterior = , p( w| X,<br />
y)<br />
marginal likelihood |<br />
= (4.13)<br />
The marginal likelihood is independent of w and can be computed from our current estimate of<br />
the likelihood and given our prior on the weight distribution:<br />
( | ) ( | , ) ( )<br />
p y X<br />
= ∫ p y X w p w dw<br />
(4.14)<br />
The quantity we are interested in is the posterior over w , which can now solve using:<br />
© A.G.Billard 2004 – Last Update March 2011
68<br />
⎛⎛ 1 T<br />
T<br />
T ⎞⎞ ⎛⎛ 1 T −1<br />
⎞⎞<br />
p( w| X, y) ∝exp⎜⎜− ( y−X w) ( y−X w)<br />
⎟⎟⋅exp⎜⎜− w ∑w<br />
w⎟⎟<br />
⎝⎝ 2 ⎠⎠ ⎝⎝ 2 ⎠⎠<br />
⎛⎛ 1 ⎛⎛ 1 ⎞⎞<br />
∝exp⎜⎜− − ⎜⎜ +∑<br />
2<br />
w ⎟⎟ −<br />
⎝⎝ 2 ⎝⎝σ<br />
⎠⎠<br />
⎛⎛ 1<br />
T −1<br />
⎞⎞<br />
∝exp⎜⎜− ( w−v) ∑v<br />
( w−v)<br />
⎟⎟<br />
⎝⎝ 2<br />
⎠⎠<br />
T<br />
T −1<br />
( w v) XX ( w v)<br />
T<br />
−<br />
T<br />
( w ) and<br />
v ( w )<br />
−2 −2 −1 1<br />
−2 −1<br />
−1<br />
where v = σ σ XX +∑ Xy ∑ = σ XX +∑<br />
⎞⎞<br />
⎟⎟<br />
⎠⎠<br />
(4.15)<br />
The posterior distribution of the weight is thus a Gaussian distribution with mean v and<br />
covariance matrix ∑<br />
ν<br />
. Notice that the first term on the right handside of both terms is the<br />
covariance of the input modulated by the variance of the noise. In a deterministic model where<br />
the variance of the weight is zero and the variance of the noise is the identity, we recover the<br />
classical linear regressive model.<br />
We can compute our best estimate of the weights by computing the expectation over the<br />
posterior distribution, i.e.:<br />
−2 −2 T −1<br />
−<br />
{ ( )} σ ( σ ) 1<br />
w<br />
E p w| y, x = XX +∑ Xy.<br />
(4.16)<br />
This is called the maximum a posteriori (MAP) estimate of w.<br />
Notice that the posterior of the weight and by extension its MAP estimate depend not only on the<br />
input variable X but also on the output variable y . In practice, computation of MAP grows<br />
quadratically with the number of examples M and is a major drawback of such methods. Current<br />
efforts in research related to the development of such regression techniques are all devoted to<br />
reducing the dimension of the training set to make this computation bearable. These are so-called<br />
sparse methods. This is particularly crucial when one extends this computation to kernel<br />
methods, see Chapter 5.<br />
Once the parameters w have been estimated, we can use our probabilistic regressive model to<br />
*<br />
make predictions given new data points. Hence, given a so-called query point x (such point is<br />
usually a point not used for training the model; in other words, this would be a point belonging to<br />
y<br />
* = f x<br />
* . This can be<br />
the testing set or the validation set), we can compute an estimate of ( )<br />
obtained by averaging over all possible values for the weight, i.e.:<br />
where<br />
A<br />
−1 1 T −1<br />
XX<br />
2<br />
w<br />
= +Σ .<br />
σ<br />
( * | * , , ) = ∫ ( * | * , ) ( | , )<br />
p y x X y p y x w p w X y dw<br />
⎛⎛ 1<br />
⎝⎝σ<br />
* T −1 * T −1 *<br />
= N⎜⎜ x A Xy,<br />
x A x<br />
2<br />
⎟⎟<br />
⎞⎞<br />
⎠⎠<br />
(4.17)<br />
The predictive distribution is again Gaussian. Notice that the uncertainty (variance) on the<br />
predictive model grows quadratically with the amplitude of the query point and with the variance<br />
of the weight distribution. This is expected from linear regressive model and hence is a limitation.<br />
This effect is illustrated in Figure 4-2.<br />
© A.G.Billard 2004 – Last Update March 2011
69<br />
Figure 4-2: Illustration of the fact that in a probabilistic regressive model the uncertainty on the predictive<br />
model increases quadratically with the amplifude of the input.<br />
It also grows with the number of training points. This effect can be diminished if one uses a<br />
sparse representation of the data. Parametric models, such as Gaussian Mixture Regression<br />
which we will see next, can also remove the requirement to store all of the training points. Here<br />
we considered solely linear regressive models, non-linear probabilistic regressive models, such<br />
as Gaussian Process Regression, will be covered in Section 5.8.<br />
4.4 Gaussian Mixture Regression<br />
Adapted from Hsi Guang Sung, Gaussian Mixture Regression and Classification, PhD thesis, Rice University,<br />
2004.<br />
In Section 3.1.5, we introduced Gaussian Mixture Models (GMM). Assume<br />
N<br />
z ∈° a multi-<br />
p z = p z ,..., 1<br />
z of the joint distribution of x<br />
N<br />
= 1,.., K Gaussians ( | , ) ( , )<br />
k k<br />
k k<br />
k N<br />
pk<br />
z µ ∑ = N ⎡⎡<br />
⎣⎣µ<br />
∑ ⎤⎤ with mean<br />
⎦⎦ µ ∈°<br />
k N×<br />
N<br />
∑ ∈° , i.e.<br />
dimensional variable GMM builds a model of ( ) ( )<br />
using a mixture of k<br />
and covariance matrix<br />
\<br />
( )<br />
1<br />
p z p z z z<br />
k= 1 k=<br />
1 k<br />
2π<br />
∑<br />
2<br />
K<br />
K<br />
1<br />
k k k<br />
T<br />
k<br />
−<br />
k<br />
( ) = ∑α k<br />
⋅ k ( | µ , ∑ ) = ∑ α<br />
k<br />
⋅ exp<br />
N ( −µ ) ( ∑ ) ( −µ<br />
) (4.18)<br />
The mixing coefficientsα satisfy<br />
k ∑ αk<br />
= 1.<br />
K<br />
k = 1<br />
Gaussian Mixture Regression (GMR) exploits the joint density to construct its estimate using the<br />
expectation on the conditional of the variable onto which we wish to make a prediction. If for<br />
instance, we wish to predict z1<br />
from knowing all other entries z z , then we can compute:<br />
2<br />
,... N<br />
{ ( N)<br />
} ( N)<br />
∫<br />
(4.19)<br />
zˆ = E p z | z ,..., z = z ⋅p z | z ,..., z ⋅dz<br />
1 1 2 1 1 2 1<br />
© A.G.Billard 2004 – Last Update March 2011
70<br />
When applying Bayes’ theorem, we get:<br />
z<br />
1<br />
=<br />
∫<br />
∫<br />
( , ,...,<br />
N )<br />
( , ,..., ) ⋅<br />
z ⋅p z z z ⋅dz<br />
1 1 2 1<br />
p z z z dz<br />
1 2 N 1<br />
(4.20)<br />
In contrast to most regression techniques, GMR also allows to make prediction on multi-<br />
y z , z , z x= z z , then we can<br />
dimensional output in one swipe. So, if we set = { } and { }<br />
compute:<br />
1 2 3<br />
{ ( )} ( 1 2 3 4 5 )<br />
{ }<br />
4 ,..., N<br />
yˆ = E p y| x = E p z , z , z | z , z ,..., z<br />
(4.21)<br />
N<br />
4.4.1 One Gaussian Case<br />
Let us first consider first the case where the joint density p( z) p( y,<br />
x)<br />
= follows a single<br />
Gaussian distribution (and not a mixture). Using the fact that, if the joint distribution of two<br />
variables is Gaussian then each conditional distribution is also Gaussian, see Figure 9-2 for an<br />
illustration, we can compute the conditional density ( | )<br />
where µ Y<br />
and<br />
X<br />
p y x which is given by:<br />
1 −1<br />
( y YX XX x YX YX XX XY)<br />
−<br />
( | ) µ ( ) ( µ ),<br />
( )<br />
p y x = N +∑ ∑ x− ∑ −∑ ∑ ∑ (4.22)<br />
µ are the means of the variable y and x respectively and have thus the<br />
Y X<br />
dimensions of y and x , which we shall call N , N . ∑ XX<br />
variable x has<br />
dimension<br />
dimension ,<br />
N<br />
Y X X Y<br />
N × N N × N respectively.<br />
the covariance matrix of the input<br />
X X<br />
× N and the cross-covariances matrices<br />
YX ,<br />
∑ ∑ have<br />
In predictive regression, we are interested in computing the expectation and uncertainty of the<br />
predictive regressive model at a given query point. When the conditional density is Gaussian, this<br />
*<br />
is easy to obtain and we thus have for a query point x , the estimated output:<br />
−1<br />
{ ( )} µ ( ) ( µ )<br />
* *<br />
yˆ E p y| x<br />
Y YX XX<br />
x<br />
X<br />
= = +∑ ∑ − (4.23)<br />
XY<br />
with associated uncertainty:<br />
−<br />
( p( y x)<br />
) ( ) 1<br />
var | =∑YX −∑YX ∑XX ∑ (4.24)<br />
XY<br />
© A.G.Billard 2004 – Last Update March 2011
71<br />
4.4.2 Multi-Gaussian Case<br />
It is easy to extend the previous result to a mixture of Gaussians, where p( x,<br />
y)<br />
is given by<br />
Equation (4.18). Recall that each joint density pk<br />
( y, x)<br />
, k = 1,.. K can be decomposed<br />
as p ( y, x) = p ( y|<br />
x) ⋅ p ( x)<br />
(Bayes’ Theorem), then the joint density of the complete mixture<br />
k k k<br />
is given by:<br />
K<br />
k = 1<br />
k k k k<br />
( ) ( )<br />
p( y, x) = α<br />
k<br />
⋅pk y| x, µ ( x)<br />
, ∑%<br />
∑ ⋅pk x| µ<br />
X, ∑ XX<br />
−<br />
( x) ( ) ( x ) and %<br />
( )<br />
% (4.25)<br />
1 −1<br />
k k k k k k k k k k<br />
% .<br />
with µ = µ +∑ ∑ −µ<br />
∑ =∑ −∑ ∑ ∑<br />
Y YX XX X YX YX XX XY<br />
The marginal density of x is given by:<br />
k<br />
K<br />
k k k k<br />
( | µ , ∑ ) =<br />
k( | µ , ∑ )<br />
p x p x<br />
∑ (4.26)<br />
Replacing (4.26) in (4.25), we can express the conditional probability of y given x :<br />
Where<br />
w<br />
k<br />
=<br />
K<br />
j=<br />
1<br />
k<br />
j<br />
k<br />
( x| k k<br />
, ∑ )<br />
j( x| j j<br />
, ∑ )<br />
α p µ<br />
∑<br />
α p µ<br />
k=<br />
1<br />
K<br />
∑ k k<br />
(4.27)<br />
k = 1<br />
( | ) = ( ) ⋅ ( | )<br />
p y x w x p y x<br />
.<br />
Equation (4.27) forms the core of the GMR model. One can then compute explicitly the<br />
expectation and variance on the above conditional, similarly to what we did for the probabilistic<br />
regression.<br />
( Y YX XX X )<br />
K<br />
K<br />
−1<br />
k k k k k<br />
{ ( | )} =<br />
k( ) ⋅ µ ( ) =<br />
k( ) ⋅ µ +∑ ( ∑ ) ( −µ<br />
)<br />
∑<br />
E p y x w x x w x x<br />
∑<br />
% (4.28)<br />
k= 1 k=<br />
1<br />
The expectation is thus a non-linear combination of the expectation of each local component. In<br />
effect, the regression signal from GMR is the result of a non-linear weighting of local linear<br />
regressions.<br />
K<br />
{ ( )} k( ) ( )<br />
∑<br />
2 K<br />
k k k<br />
(( µ )<br />
%<br />
( ) ) ∑ k( ) µ ( )<br />
k= 1 k=<br />
1<br />
( )<br />
2 2<br />
var p y|<br />
x = w x ⋅ % x + ∑ − w x ⋅ % x (4.29)<br />
The variance of GMR is no longer a simple function increasing with the amplitude of the input x<br />
(as in probabilistic regression). Rather it is modulated by the variance of each component locally<br />
and hence carries across a notion of local variance.<br />
A schematic of these variables is shown in Figure 4-3.<br />
© A.G.Billard 2004 – Last Update March 2011
72<br />
Figure 4-3: Two-dimensional illustration of a) left: a Gaussian Mixture Model with 3 Gaussians (in violet)<br />
superposed to the original set of pairs (x,y) of datapoints (in grey), b) the Gaussian Mixture Regression<br />
{ }<br />
model resulting from the GMM. The dark line is the regression signal, i.e. E p( Y | X )<br />
envelope around it is one standard devitation computed from var pY ( | X ) .<br />
{ }<br />
. The blue<br />
Figure 4-4: Gaussian Mixture Model (top row) and Regression (bottom row) with different<br />
amounts of Gaussians in the mixture. The center line shows the regression mean, while the two<br />
thinner lines display respectively one and two sigmas. The regression function becomes more<br />
detailed when the data is modeled by more Gaussians, and represents better the modulation of<br />
its variance. [DEMOS\REGRESSION\GMR-THINNING.ML]<br />
© A.G.Billard 2004 – Last Update March 2011
73<br />
5 Kernel Methods<br />
These lecture notes have sofar covered linear methods for performing a variety of computation,<br />
ranging from dimensionality reduction, clustering and classification to regression. The term linear<br />
refers to the assumptions that all of these transformations could be expressed as linear<br />
transformation of the form y= Ax (where y and xare given and A is the unknown<br />
transformation).<br />
Kernel methods relax the assumption of a linear transformation, so as to perform non-linear<br />
regression, classification, etc. Kernel methods proceed by first projecting the data through a nonlinear<br />
transformation into a feature space and then perform the same type of computation (e.g.<br />
classification or regression), as in the linear case, in the feature space. This principle is illustrated<br />
in Figure 5-1.<br />
Figure 5-1: Illustration of the principle of non-linear classification through Support Vector Machine. The data<br />
are first projected from input space to a feature space via a non-linear map φ . Linear separation is then<br />
performed in the feature space. Figure from "Learning with Kernels" by B. Scholkopf and A. Smola, MIT<br />
Press 2002.<br />
In these lecture notes, we will cover solely a subset of the existing Kernel methods, focusing on<br />
kernel methods that extend the algorithms see previously for dimensionality reduction (PCA, ICA,<br />
CCA to kernel PCA, kernel ICA, kernel CCA), for clustering (from K-Means to kernel K-means),<br />
for classification (from linear classifier to support vector machine) and for regression (from<br />
probabilistic regression to Gaussian Process Regression).<br />
5.1 The kernel trick<br />
All kernel methods we will see here are based on the so-called kernel trick. The kernel trick stems<br />
from a variety of fundamental mathematical principles which we will skip here, focusing solely on<br />
explaining its basic principle.<br />
© A.G.Billard 2004 – Last Update March 2011
74<br />
X<br />
M<br />
i<br />
= x is the set of our M observations, we can construct a projection of X onto the<br />
If { }<br />
i=<br />
1<br />
feature space H through a non-linear mapping φ :<br />
φ : X → H<br />
x→φ<br />
( x)<br />
.<br />
(5.1)<br />
Note that if the dimension of X is N , then the dimension of the feature space may be greater<br />
than N .<br />
Finding the appropriate non-linear transformationφ is difficult in practice. The kernel trick relates<br />
i<br />
to the observation that most methods rely on computing an inner product ,<br />
x x<br />
i<br />
observations ,<br />
j<br />
x x<br />
j<br />
across pairs of<br />
∈ X (e.g., recall that in order to perform PCA, we needed to compute the<br />
T<br />
XX ;<br />
covariance matrix on X , which is given by the dot product on all the data points, i.e.<br />
similarly when performing linear regression, we had to multiply by the inverse of the covariance<br />
on X).<br />
Hence, determining an expression for this inner product in feature space may save us from<br />
having to compute explicitly the mappingφ . This inner product in feature space is expressed<br />
through the kernel function (or simply the kernel) k (.,.).<br />
All the kernel methods we will see in these lecture notes assume that the feature space H into<br />
which the data are sent through the non-linear functionφ is a Reproducing Kernel Hilbert Space<br />
{ 1<br />
.,<br />
2<br />
.,...}<br />
(RKHS). H is hence a space H:= h ( ) h ( )<br />
( ) ( )<br />
of functions from<br />
N<br />
° to ° . In this space,<br />
φ ., x i , φ ., x j ∀x i , x j ∈X<br />
defines a set of functions indexed by x . The “reproducing<br />
property" of the kernel ensures that taking the inner product between a pair of functions in H<br />
k ., x : = φ ., x yields the following kernel:<br />
yields a new function in H . Hence setting ( ) ( )<br />
( i , j ) φ( ., i ), φ( ., j ) φ( , i ), φ( ,<br />
j<br />
)<br />
∞<br />
k x x = x x = ∫ z x z x dz<br />
(5.2)<br />
The kernel in (5.2) is the dot product in feature space. Most techniques covered in these lecture<br />
notes will be based on this kernel.<br />
i<br />
Note that, in the literature, people tend to omit the open parameter on φ (.,<br />
x )<br />
simply φ ( x<br />
i<br />
) . We will follow this notation in the remainder of this document.<br />
−∞<br />
and write<br />
For proper use in the algorithms we will see next, the kernel must satisfy a number of properties<br />
that follow the Mercer’s theorem. Among these, we will retain that k is a symmetric continuous<br />
positive function that maps:<br />
k:<br />
X × X →°<br />
( i , j ) → φ( i ),<br />
φ( j<br />
)<br />
k x x x x<br />
(5.3)<br />
© A.G.Billard 2004 – Last Update March 2011
75<br />
The kernel k provides a metric of similarity across datapoints. Using k may allow extracting<br />
features common to all training datapoints. These features are some non-linear correlations not<br />
visible in the original space.<br />
Classical kernels one finds in the literature are:<br />
• Homogeneous Polynomial Kernels: ( )<br />
k x, x' = x, x' , p∈•<br />
;<br />
• Inhomogeneous Polynomial Kernels: ( ) ( p<br />
)<br />
p<br />
k x, x' = x, x' + c , p∈•<br />
, c≥0;<br />
• Hyperbolic Tangent Kernel (similar to the sigmoid function):<br />
( ) ( θ x x )<br />
k x, x' = tanh + , ' , θ∈°<br />
;<br />
• Gaussian Kernel (translation-invariant): ( )<br />
The most popular kernel is the Gaussian kernel.<br />
x−x'<br />
−<br />
k x x e σ σ<br />
2<br />
2<br />
, ' = , ∈° .<br />
5.2 Which kernel, when?<br />
A recurrent question we often hear in class is “how does one choose the kernel”. A number of<br />
recent works have addressed this problem by offering techniques to learn the kernel. This often<br />
amounts to building esimators that rely on mixture of kernels. One then learns how to combine<br />
these kernels to find the optimal mixture. There is however unfortunately no good recipe to<br />
determine which kernel to use when. One may either try different kernel in an iterative manner<br />
and look at which provides the best result for a given technique. For instance, if you perform<br />
classification, you may want to compare the performance obtained on both training and testing<br />
sets after crossvalidation when doing so with either Gaussian kernel or Polynomial kernel. You<br />
may then pick the kernel that yields to best performance.<br />
While choosing the kernel is already an issue, once a kernel is chosen, one is left with the<br />
problem of chosing the hyperparameter of the kernel. These are, for instance, the variance σ in<br />
the Gaussian kernel or the order of the polynome p in the polynomial kernels. There again,<br />
there is no good recipe. When using a Gaussian kernel, a number of approaches, known under<br />
the term of kernel polarization, have been proposed whereby one learns the optimal covariance<br />
parameters. Most of these approaches however are iterative by nature and rely on a discrete<br />
sampling of values taken by the parameters, using some heuristics or boosting techniques to<br />
optimize the search through these parameter values.<br />
© A.G.Billard 2004 – Last Update March 2011
76<br />
5.3 Kernel PCA<br />
We start our review of kernel methods with kernel PCA, a non-linear extension to Principal<br />
Component Analysis (PCA).<br />
To recall, PCA is a powerful technique for extracting structure from high-dimensional data. In<br />
Section 2.1 and Section 6.6.3, of these lecture notes, we review two ways of computing PCA. We<br />
can either do it through an analytical decomposition into eigenvalues and eigenvectors of the data<br />
space, or through an iterative decomposition using Hebbian Learning in multiple input-output<br />
networks.<br />
A key assumption of PCA was that the transformation applied on the data was linear. Kernel PCA<br />
is a generalization of the standard PCA, in that it considers any linear or non-linear transformation<br />
of the data. We first start by reintroducing the PCA notation and show how we can go from linear<br />
PCA to non-linear PCA.<br />
Linear PCA:<br />
Assume that the dataset is composed of a set of vectors x<br />
i<br />
∈ °<br />
N<br />
, i = 1... M . Assume further that the<br />
M<br />
dataset is zero mean, i.e. ∑ x i<br />
= 0.<br />
i = 1<br />
PCA finds an orthonormal basis such that the projections along each axis maximize the variance<br />
of the data. To do so, PCA proceeds by diagonalizing the covariance matrix of the dataset C=XX<br />
T<br />
.<br />
C is positive definite and can thus be diagonalized with non-negative eigenvalues.<br />
The principal components are then all the vectors v<br />
i<br />
, i=<br />
1..., N, solution of:<br />
Cv<br />
i<br />
= λ<br />
i<br />
iv<br />
(5.4)<br />
where λ is a scalar and corresponds to the eigenvalue associated to the eigenvector v<br />
i<br />
i<br />
.<br />
Non-Linear Case:<br />
Observe first that one can rewrite the eigenvalue decomposition problem of linear PCA in terms<br />
i<br />
of dot product across pairs of the training datapoints. Indeed, each principal component v can be<br />
M<br />
1 j j<br />
T<br />
expressed as a linear combination of the datapoints. Using C= ∑ x ( x ) and replacing in<br />
M j = 1<br />
(5.4), we obtain:<br />
M<br />
1<br />
T<br />
Cv = x ( x ) v = λiv<br />
M<br />
i j j i i<br />
j=<br />
1<br />
which allows us to express each eigenvector as follows:<br />
∑ (5.5)<br />
© A.G.Billard 2004 – Last Update March 2011
77<br />
M<br />
1<br />
T<br />
v = ∑ x ( x ) v<br />
M λ<br />
i j j i<br />
1<br />
=<br />
M λ<br />
i<br />
i<br />
j=<br />
1<br />
M<br />
T<br />
∑( ( ) )<br />
j=<br />
1<br />
x v x<br />
j i j<br />
(5.6)<br />
T<br />
( ( ) )<br />
i j i j<br />
Introducing a set of scalars α = x v for each data point x (these correspond to the value of the<br />
j<br />
j<br />
i<br />
projection of x onto the eigenvector vector v .<br />
i<br />
i<br />
Then each eigenvector v with non-zero eigenvalue λ lies in the space spanned<br />
1 M<br />
by the input vectors x ,...., x :<br />
1<br />
v = ∑ .<br />
(5.7)<br />
M<br />
i i j<br />
α<br />
i<br />
j x<br />
Mλ j = 1<br />
Assuming now that the data are projected into a feature space through a non-linear mapφ and<br />
that these are centered in feature space, i.e.<br />
M<br />
i=<br />
1<br />
i<br />
( x )<br />
the Correlation matrix in the feature space is then given by:<br />
∑ φ = 0,<br />
(5.8)<br />
where each i 1,...,<br />
C<br />
1 T<br />
M<br />
FF<br />
φ = (5.9)<br />
= M columns of F are composed of the projections ( x<br />
i<br />
)<br />
φ .<br />
© A.G.Billard 2004 – Last Update March 2011
78<br />
As in the original space, in feature space, the correlation matrix C φ<br />
can be diagonalized and we<br />
have now to find the eigenvalues λi ≥ 0, i= 1... M,<br />
satisfying:<br />
Cv<br />
i<br />
φ<br />
= λ v<br />
i<br />
i<br />
( ) φ<br />
λi<br />
φ( )<br />
j i j i<br />
⇒ φ x , C v = x , v , ∀ i, j = 1,... M<br />
(5.10)<br />
All solutions v with λ ≠ 0 lie in the span of the<br />
Developping the left hand-side<br />
M<br />
j i j i l<br />
( x ), Cφv = ( x ),<br />
Cφ∑<br />
l ( x )<br />
φ φ α φ<br />
=<br />
M<br />
∑<br />
l=<br />
1<br />
1<br />
=<br />
M<br />
1<br />
=<br />
M<br />
l=<br />
1<br />
( x ),<br />
Cφ<br />
( x )<br />
α φ φ<br />
i j l<br />
l<br />
M<br />
∑<br />
l=<br />
1<br />
( x ),<br />
FF ( x )<br />
α φ φ<br />
i j T l<br />
l<br />
M<br />
( x ), ∑ ( x ) ( x ),<br />
( x )<br />
M<br />
i j j j l<br />
∑αl<br />
φ φ φ φ<br />
l= 1 j=<br />
1<br />
φ<br />
1<br />
M<br />
(x ),…, φ(x )<br />
( )<br />
M<br />
i i i j<br />
i i j<br />
j=<br />
1<br />
and we can thus write:<br />
Cv<br />
φ<br />
= λv = λ∑ α φ x<br />
(5.11)<br />
Replacing the latter expression in the definition of the correlation matrix, one gets:<br />
1<br />
M α φ φ φ φ λ α φ φ<br />
M M M<br />
i j j j l i i j<br />
∑ l ( x ), ∑ ( x ) ( x ), ( x ) =<br />
i∑ j ( x ), ( x ) . (5.12)<br />
l= 1 j= 1 j=<br />
1<br />
Using the kernel trick, one can define the Gram Matrix K , whose elements are composed of the<br />
dot product between each pair of datapoints projected in feature space, i.e.<br />
i j<br />
( ) φ( )<br />
K φ x , x .<br />
ij<br />
= Beware that K is M × M , where M is the number of data points.<br />
We can finally rewrite the expression given in (5.12) as an eigenvalue problem of the form:<br />
2 i<br />
i<br />
K α = Mλi<br />
Kα<br />
, i=<br />
1... M<br />
i<br />
i<br />
Kα<br />
= Mλα<br />
i<br />
(5.13)<br />
This is the dual eigenvalue problem of finding the eigenvectors<br />
i<br />
v of C.<br />
© A.G.Billard 2004 – Last Update March 2011
79<br />
1 M<br />
The solutions to the dual eigenvalue problem are given by all the eigenvectors α ,..., α with<br />
non-zero eigenvalues λ ,..., λ .<br />
1<br />
M<br />
i i<br />
One Asking can that now the compute eigenvectors the projections v of Cφ<br />
be of normalized, a given query i.e. point v , x v onto = 1 the ∀ ieigenvectors<br />
= 1,. .., M<br />
1 M<br />
i<br />
is equivalent to asking that the dual eigenvectors α ,..., α be such that 1/ λi<br />
= α .<br />
M<br />
M<br />
( ) = ∑ j ( ) ( ) = ∑ j ( )<br />
(5.14)<br />
i i j i j<br />
v , φ x α φ x , φ x α k x , x<br />
j= 1 j=<br />
1<br />
i<br />
v<br />
using:<br />
Note that the solution of kernel PCA yields M eigenvectors, whereas the solution to linear PCA<br />
yielded N eigenvectors, where N is the dimensionality of the dataset and M is the number of<br />
datapoints. Usually M is much larger than N , hence kernel PCA corresponds to a lifting into a<br />
higher-dimensional space, whereas linear PCA was a projection into a space of lower dimension<br />
than the original space. By lifting the data, kernel PCA aims at extracting features that are<br />
common to subsets of datapoints. In some way, this is close to a clustering technique.<br />
Datapoints that bear some similarity will be close to one another along some particular projection.<br />
If the data points have really no regularity, then they will be distributed homogeneously along all<br />
projections.<br />
Figure 5-2 illustrates the principle of PCA on a dataset that forms approximatively three clusters.<br />
By looking at the regions with equal projection value on the first or second eigenvector, we see<br />
that some subgroups of datapoints tend to group in the same region. When the kernel width is<br />
large, the two clusters on the right-handside of the figure are encapsulated onto a single contour<br />
line in the first projection. The datapoints of the cluster on the far left are closely grouped<br />
together. As a result, the contour lines form ellipsoids that match the dispersion of the data. When<br />
the datapoints are more loosely grouped, as it is the case for the two groups at the center and far<br />
right, one observes some non-linear deformations of the contour lines that reflect the deflections<br />
due to the absence of the datapoints. Using a smaller kernel width allows for encapsulating finer<br />
features and allows us to separate the groups. A very small kernel width will however lead to one<br />
datapoint per projection.<br />
© A.G.Billard 2004 – Last Update March 2011
80<br />
1<br />
X2<br />
0.5<br />
0<br />
-0.5<br />
-1 -0.8 -0.6 -0.4 -0.2 0 0.2 0.4 0.6 0.8 1<br />
1.5 Eigenvector=1; Eigenvalue=0.246 X1<br />
1<br />
X2<br />
0.5<br />
0<br />
-0.5<br />
-1 -0.8 -0.6 -0.4 -0.2 0 0.2 0.4 0.6 0.8 1<br />
1.5 Eigenvector=2; Eigenvalue=0.232 X1<br />
1<br />
X2<br />
0.5<br />
0<br />
-0.5<br />
-1 -0.8 -0.6 -0.4 -0.2 0 0.2 0.4 0.6 0.8 1<br />
1.5 Eigenvector=1; Eigenvalue=0.160 X1<br />
1<br />
X2<br />
0.5<br />
0<br />
-0.5<br />
-1 -0.8 -0.6 -0.4 -0.2 0 0.2 0.4 0.6 0.8 1<br />
1.5 Eigenvector=2; Eigenvalue=0.149 X1<br />
Figure 5-2: Example of clustering done with kernel PCA with a Gaussian Kernel and kernel<br />
widthσ = 0.1 (top) and σ = 0.04 (bottom). Reconstruction in the original dataspace of the projections onto<br />
the first two eigenvectors. The contour lines represent regions with equal projection value.<br />
© A.G.Billard 2004 – Last Update March 2011
81<br />
5.4 Kernel CCA<br />
The linear version of CCA was treated in Section 2.2. Here we consider its extension to nonlinear<br />
projections to find each pair of eigenvectors. We start with a brief recall of CCA.<br />
M<br />
i N<br />
i q<br />
Consider a pair of multivariate datasets X = { x ∈ } , Y =∈{ y ∈ }<br />
i<br />
i<br />
M<br />
i i<br />
measure a sample of M instances ( x , y )<br />
vectors and<br />
x<br />
y<br />
{ }<br />
i=<br />
1<br />
° ° of which we<br />
M<br />
= 1 = 1<br />
. CCA consists in determining a set of projection<br />
w w for X and Y such that the correlation ρ between the projections<br />
T<br />
T<br />
X'<br />
= w X and Y' = w Y (the canonical variates) is maximized:<br />
x<br />
y<br />
T<br />
{ }<br />
T<br />
T<br />
wxE XY wy wxCxywy<br />
ρ = max corr ( X',Y' ) = max = max<br />
(5.15)<br />
wx,<br />
wy<br />
w X w Y w C w w C w<br />
w , T , T T<br />
x w<br />
T<br />
y wx wy<br />
x y x xx x y yy y<br />
Where Cxy, Cxx,<br />
Cxy<br />
are respectively the inter-set and within sets covariance matrices.<br />
C is N× q, C is N× N and C q×<br />
N.<br />
xy xx xy<br />
Non-linear Case:<br />
Kernel CCA extends this notion to non-linear projections. As for kernel PCA, let us assume that<br />
both sets of data have been projected into a feature space through a non-linear map φ , φ , such<br />
i<br />
that we have now the two sets φx( x )<br />
M<br />
i<br />
{ } and { φy( y )}<br />
M<br />
i= 1 i=<br />
1<br />
M<br />
M<br />
. Let us further assume that the<br />
i<br />
i<br />
data are centered in feature space, i.e. ∑φx( x ) = 0 and ∑ φy( y ) = 0 (if the data are not<br />
i= 1 i=<br />
1<br />
centered in feature space, one can find a Gram matrix that ensures that these are centered, as<br />
done for kernel PCA, see exercise session). Kernel canonical correlation analysis aims at<br />
maximizing the correlation between the data in their corresponding projection space. Similarly to<br />
T<br />
kernel PCA, we can construct the two kernel matrices ,<br />
F and F are two M M<br />
x<br />
i<br />
projections φx( x )<br />
y<br />
M<br />
i<br />
{ } and { φy( y )}<br />
x<br />
K = F F K = F F , where<br />
T<br />
x x x y y y<br />
× matrices, whose columns are composed of the<br />
M<br />
i= 1 i=<br />
1<br />
y<br />
, respectively.<br />
The weights w , w can be expressed as a linear combination of the training examples in feature<br />
space, i.e.<br />
following optimization:<br />
w = Fα<br />
and w = Fα<br />
. Substituting into the equation for linear CCA yields the<br />
x x x y y y<br />
α KKα<br />
max ρ = max<br />
(5.16)<br />
α , α α , α<br />
x y x y<br />
x x y y<br />
1/2 1/2<br />
2 2<br />
( αxKxαx) ( αyKyαy)<br />
x<br />
y<br />
© A.G.Billard 2004 – Last Update March 2011
82<br />
One can further add normalization constraints on the denominator, i.e.<br />
α K α = α K α = 1.<br />
2 2<br />
x x x y y y<br />
Then, as done for linear CCA, see Section 2.2, one can express this optimization as a<br />
generalized eigenvalue problem of the form:<br />
2<br />
0 KK<br />
x y α ⎛⎛<br />
x<br />
K<br />
x<br />
0 ⎞⎞ αx<br />
⎛⎛ ⎞⎞⎛⎛ ⎞⎞ ⎛⎛ ⎞⎞<br />
⎜⎜ = ρ<br />
⎜⎜<br />
⎟⎟⎜⎜ 2<br />
KK<br />
y x<br />
0 ⎟⎟ ⎟⎟ ⎜⎜ ⎟⎟<br />
α ⎜⎜<br />
⎜⎜ ⎟⎟<br />
y 0 K ⎟⎟<br />
⎝⎝ ⎠⎠⎝⎝ ⎠⎠ α<br />
⎝⎝ y ⎠⎠⎝⎝ y⎠⎠<br />
(5.17)<br />
A first difficulty that arises when solving the above problem is the fact that its solution is usually<br />
always ρ = 1, irrespective of the kernel. This is due to the fact that the intersection between the<br />
spaces spanned by the columns of K and K is usually non-zero 4 . In this case, there exist two<br />
x<br />
αx<br />
αysuch that Kxαx Kyαy<br />
vectors and<br />
y<br />
= , that are solution of (5.17). Finding a solution to<br />
(5.17) will hence yield different projections depending on the kernel, but all of these will have<br />
maximal correlation. This hence cannot serve as a means to determine which non-linear<br />
transformation K is most appropriate.<br />
A second difficulty when solving (5.17) is that it requires inverting the Gram matrices. These may<br />
not always be invertible, especially as these are not full rank (because of the constraint of zero<br />
mean in feature space).<br />
To counter this effect, one may use a regularization parameter (also called ridge parameter) κ<br />
on the norm of the transformation yielded by K , K and end up with the following regularized<br />
problem:<br />
x<br />
2<br />
⎛⎛⎛⎛<br />
Mκ<br />
⎞⎞<br />
⎞⎞<br />
⎜⎜ Kx<br />
+ I 0 ⎟⎟<br />
⎛⎛ 0 KK<br />
x y⎞⎞⎛⎛αx ⎞⎞<br />
⎜⎜ ⎟⎟<br />
2<br />
αx<br />
ρ<br />
⎜⎜⎝⎝<br />
⎠⎠<br />
⎟⎟⎛⎛ ⎞⎞<br />
⎜⎜ =<br />
⎜⎜<br />
⎟⎟⎜⎜<br />
2<br />
KK<br />
y x<br />
0 ⎟⎟ ⎟⎟<br />
α ⎜⎜ ⎟⎟⎜⎜ ⎟⎟<br />
⎝⎝ y<br />
y<br />
{<br />
Mκ<br />
α<br />
1442443⎠⎠⎝⎝ ⎠⎠ ⎜⎜ ⎛⎛ ⎞⎞ ⎝⎝ ⎠⎠<br />
0 K<br />
y<br />
+ I ⎟⎟<br />
A α ⎜⎜<br />
⎜⎜ ⎟⎟<br />
2<br />
⎟⎟<br />
⎝⎝144444424444443<br />
⎠⎠ ⎠⎠<br />
⇔ Aα<br />
= ρBα<br />
y<br />
B<br />
(5.18)<br />
Thanks to the regularization term, when M is very large, the right-handside matrix becomes PSD<br />
(which is usually the case as the number of datapoints M>>N, the dimension of the dataset; if this<br />
is not the case, then one makes κ very large). In this case, the matrix B can be decomposed<br />
T<br />
into B= C C. Replacing, this yields a classical eigenvalue problem of the form:<br />
T<br />
−<br />
( ) 1 −1<br />
C AC β = ρβ, with β = Cα.<br />
Note that the solution to this eigenvalue problem neither shows the geometry of the kernel<br />
canonical vectors nor gives an optimal correlation of the variates. On the other hand, the<br />
4<br />
K and<br />
x<br />
K are centered and are hence at most of dimensions M − 1 . The dimension of the<br />
y<br />
intersection between the spaces spanned by the column vectors of these matrices is<br />
dim ( C( K ) , ( )) dim ( ( )) dim( ( ) )<br />
x<br />
C Ky ≥ C Kx + C Ky<br />
− M . If M>2, i.e. if we have more than two<br />
datapoints, then the space spanned by the two canonical basis intersect.<br />
© A.G.Billard 2004 – Last Update March 2011
83<br />
additional ridge parameter induces a beneficial control of over-fitting and enhances the numerical<br />
stability of the solutions. (Bach & Jordan, 2002) report that, in many experiments, the solution of<br />
this regularized problem show better generalization abilities than the kernel canonical vectors, in<br />
the sense of giving higher correlated scores for new objects.<br />
Generalizing to multiple multi-dimensional datasets:<br />
As in linear CCA, one can extend this to comparison across several multidimensional datasets. If<br />
may however have different dimensions<br />
X ,...., 1<br />
X are the L datasets, each of which are composed of M observations. Each dataset<br />
L<br />
N ,.... 1<br />
N and hence<br />
L<br />
Xi<br />
: Ni× M . As in the two-<br />
K K and the solution to this<br />
dimensional case, one can construct a set of L Gram matrices ,....., 1 L<br />
kernel CCA problem is given by solving:<br />
2<br />
⎛⎛⎛⎛<br />
2 Mκ<br />
⎞⎞<br />
⎞⎞<br />
⎜⎜ K1<br />
+ I 0<br />
0 KK<br />
1 2<br />
....... KK<br />
1 L<br />
α<br />
⎜⎜ ⎟⎟<br />
⎟⎟<br />
⎛⎛ ⎞⎞⎛⎛ 1 ⎞⎞ ⎜⎜⎝⎝ 2 ⎠⎠<br />
⎟⎟ ⎛⎛ α1<br />
⎞⎞<br />
⎜⎜ ⎟⎟⎜⎜ ⎟⎟<br />
KK<br />
2 1<br />
0 ........ KK<br />
2 L<br />
α ⎜⎜ ⎟⎟ ⎜⎜ ⎟⎟<br />
⎜⎜ ⎟⎟⎜⎜ 2 ⎟⎟<br />
α2<br />
⎜⎜ ⎟⎟ ⎜⎜ ⎟⎟<br />
⎜⎜ . ⎟⎟⎜⎜ . ⎟⎟= ρ ⎜⎜.......<br />
......................................... ⎜⎜ . ⎟⎟ .<br />
⎜⎜ ⎟⎟⎜⎜ ⎟⎟<br />
⎜⎜ . ⎟⎟⎜⎜ . ⎟⎟<br />
⎜⎜ ⎟⎟ ⎜⎜ ⎟⎟<br />
.<br />
⎜⎜ ⎟⎟ ⎟⎟ ⎜⎜ ⎟⎟<br />
⎜⎜KK L 1<br />
KK<br />
L 2<br />
....... KK ⎟⎟⎜⎜<br />
L L<br />
α ⎟⎟<br />
2<br />
⎝⎝ ⎠⎠⎝⎝ L⎠⎠<br />
⎜⎜ ⎜⎜<br />
2 Mκ<br />
α ⎟⎟<br />
⎛⎛ ⎞⎞ ⎟⎟ ⎝⎝ L ⎠⎠<br />
⎜⎜ 0 ⎜⎜KL<br />
+ I ⎟⎟ ⎟⎟<br />
⎝⎝<br />
⎝⎝ 2 ⎠⎠ ⎠⎠<br />
(5.19)<br />
When using a Gaussian kernel, one can see that as the kernel width s increases (or decreases if<br />
s
84<br />
5.5 Kernel ICA<br />
Adapted from Kernel Independent Component Analysis, F. Bach and M.I. Jordan, Journal of Machine Learning<br />
Research 3 (2002) 1-48<br />
In Section 2.3, we covered the linear version of Independent Component Analysis. We first here<br />
revisit ICA and extend this to a non-linear transformation through kernel ICA. To this end, we first<br />
show that ICA can also be solved by minimimization of mutual information and extend this<br />
observation to the non-linear case.<br />
Linear ICA<br />
i=<br />
i<br />
ICA assumes that the set of M observations { } 1...<br />
independent sources { 1 q}<br />
j<br />
M<br />
X = x was generated by a set of statistically<br />
j=<br />
1,... N<br />
S = s ,.... s , with q ≤ N through a linear transformation A :<br />
q<br />
A:<br />
° → °<br />
N<br />
s → x=As<br />
where A: is an unknown N×<br />
q mixing matrix.<br />
ICA consists then in estimating both A and S knowing only X .<br />
ICA bears important similarity with Probabilistic PCA, see Section 2.1.5. The sources S are latent<br />
random variables, i.e. each source s ,.... 1<br />
s was generated by an independent random process and<br />
q<br />
hence as an associated distribution p . ICA differs from PPCA in that it requires that the sources<br />
s i<br />
be statistically independent. PCA in contrast requires solely that the projections be uncorrelated.<br />
Statistical independence is a stronger constraint than un-correlatedness, see definitions in<br />
Annexes, Sections 9.2.7 and 9.2.8.<br />
To solve for ICA would require doing a multi-dimensional density estimation to estimate each of<br />
the densities p ,.... .<br />
s<br />
p This is impractical and hence ICA is usually solved by approximation<br />
1 s q<br />
techniques. In Section 2.3, we saw one method to solve ICA using a measure of non-gaussianity.<br />
The intuition behind this approach was that the distribution of the mixture of independent sources<br />
becomes closer to a Gaussian distribution than the distribution of each source independently.<br />
This, of course, assumed that the distribution of each source is non-gaussian. This idea is<br />
illustrated in Figure 5-3. A measure of non-gaussianity was proposed based on the Negentropy<br />
J y H y H y<br />
H y of the<br />
( ) = ( Gauss ) − ( ). The negentropy measures by how much the entropy ( )<br />
y s of the distribution of the sources differs from the entropy H( y )<br />
current estimate ~<br />
Gaussian distribution with the same mean and covariance as that of the distribution of y . In<br />
information theory, the entropy is a measure of the uncertainty attached to the information<br />
contained in the observation of a given variable. The more entropy, the more uncertain the event<br />
is, see Section 9.3. The notion of entropy can be extended to joint and conditional distributions.<br />
When observing two variables, the joint entropy is a measure of the information conveyed by the<br />
observation of one variable onto the other variable. It is hence tightly linked to the notion of<br />
information. Unsurprisingly, ICA can hence also be formulated in terms of mutual information, as<br />
we will see next.<br />
Gauss<br />
of a<br />
© A.G.Billard 2004 – Last Update March 2011
85<br />
Figure 5-3: TOP: Marginal (left) and joint (right) distributions of two statistically independent sources, a<br />
Gaussian distribution and a uniform distribution. BOTTOM: The marginal distributions after whitening are<br />
closer to that of a Gaussian distribution.<br />
ICA by minimization of mutual information<br />
ICA searches statistically independent sources. These sources must therefore have minimal<br />
mutual information. A measure of the mutual information across the q sources is given by:<br />
q<br />
1<br />
( s<br />
1,...<br />
q) = ( i) − ( ) −log det ( )<br />
∑ (5.20)<br />
I s h s h x A −<br />
where h( x)<br />
is the entropy of the distribution of the observations.<br />
i=<br />
1<br />
To recall, ICA started with the assumption that the data was centered and white, i.e. ~ ( 0, )<br />
x N I .<br />
In practice, this requires to first substract the mean of the data and then to proceed to a<br />
decorrelation through PCA, followed by a normalization, see Section 2.3.4. By extension if<br />
x~ N 0, I then the sources are also centered and white and hence:<br />
( )<br />
T − T −<br />
{ } { }( )<br />
I = E ss = A E xx A<br />
(5.21)<br />
1 1 T<br />
Given that ( I )<br />
det =1<br />
, we have:<br />
−1 T −1<br />
T<br />
( A E{ xx }( A ) )<br />
−<br />
T<br />
( ) { }<br />
det =1<br />
⇔<br />
T<br />
( )<br />
−<br />
( ) ( )<br />
1 1<br />
det A det E xx det A =1.<br />
(5.22)<br />
© A.G.Billard 2004 – Last Update March 2011
86<br />
1<br />
This implies that det ( A − ) is a constant (and is equal to ± 1 in the particular case of whitenend<br />
mixtures).<br />
Assuming then that the data is zero-mean and white, that the number of sources equal the<br />
dimension of the data, i.e. N , and replacing in (5.20), one can see that maximizing the<br />
negentropy is equivalent to minimizing mutual information, as the two quantities differ only by a<br />
constant factor, i.e.<br />
N<br />
I s ,... s cst. J x .<br />
( ) ( )<br />
1<br />
N<br />
= −∑ (5.23)<br />
Given that the mutual information of a random vector is nonnegative, and zero if and only if the<br />
components of the vector are independent, minimization of mutual information for ICA is<br />
interesting in that it has a single global minimum. Unfortunately, the mutual information is difficult<br />
to approximate and optimize on the basis of a finite sample of datapoints, and much research on<br />
ICA has focused on alternative contrast functions. The earliest approach that optimizes for the<br />
negentropy using the fast-ICA algorithm, see Section 2.3.6, relies on an adhoc set of non-linear<br />
functions. While not very generic, this approach remains advantageous in that it allows estimating<br />
each component separately and in that it does the estimation only on uncorrelated patterns.<br />
i=<br />
1<br />
i<br />
Non-linear Case<br />
We will here assume that the sources and the original datapoints have the same dimension and<br />
these are zero-mean and white. In practice this can be achieved by performing first PCA and then<br />
reducing to the smallest set of eigenvectors with best representation. Hence, given a set of<br />
j<br />
j=<br />
observation vectors { } 1,...<br />
i<br />
M<br />
X = x , we will look for the sources s 1<br />
,.... N<br />
i=<br />
1,... N<br />
s , such that:<br />
s and<br />
1<br />
i<br />
= Wxi<br />
W = A − . As in linear ICA, we do not compute A and then its inverse, but rather<br />
estimate directly its inverse by computing the columns of W.<br />
While the fast-ICA method in linear ICA relied on chosing one or two predefined non-linear<br />
functions for the transformation, Kernel ICA solves ICA by considering not just a single non-linear<br />
{ 1<br />
.,<br />
2<br />
.,...}<br />
function, but an entire function space H:= h ( ) h ( )<br />
of candidate nonlinearities. The hope<br />
is that using a function space makes it possible to adapt to a variety of sources and thus would<br />
h, h ,...<br />
make the algorithms more robust to varying source distributions. Each function<br />
1 2<br />
from<br />
goes<br />
° N → ° . We can hence determine a set of N transformations<br />
j=<br />
M<br />
j<br />
{ } 1...<br />
i<br />
h : x H, i 1,... N<br />
i<br />
→ = with associated kernels ( ) ( )<br />
K = h ., h . , i= 1,... N. Beware<br />
i i i<br />
that we are here comparing the projections of the datapoints along the dimensions i= 1,... N of<br />
the original dataset, which is thought to be the same dimension as that of the sources. Each<br />
matrix K is then M × M .<br />
i<br />
In Section 5.4, when considering kernel CCA, we saw that one can determine the projections that<br />
h, h ,...<br />
maximize the correlation across the variables using different sets of projections 1 2<br />
measured by ( K K )<br />
1 ,.... N<br />
. This is<br />
ρ . This quantity is comprised between zero and one. While CCA<br />
aimed at finding the maximal correlation, kernel ICA will try to find the projections that maximize<br />
© A.G.Billard 2004 – Last Update March 2011
87<br />
statistical independence. We define a measure of this independence<br />
through λ( K ,.... K ) 1 ρ( K ,.... K )<br />
= − . This quantity is also comprised between 0 and 1 and<br />
1 N<br />
1<br />
N<br />
is equal to 1 if the variables X ,..., 1<br />
X are pairwise independent. Optimizing for independence<br />
N<br />
can be done by maximizing λ ( K K )<br />
function:<br />
1 ,.... N<br />
. This is equivalent to minimizing the following objective<br />
( ,.... ) log λ ( ,.... )<br />
J K K K K<br />
=− (5.24)<br />
1 N<br />
1<br />
This optimization problem is solved in an iterative method. One starts with an initial guess for W<br />
and then iterates by gradient descent on J. Details can be found in Bach & Jordan 2002.<br />
Interestingly, an implementation of Kernel-ICA, whose computational complexity is linear in the<br />
number of data points, is proposed there. This reduces importantly the computational costs.<br />
N<br />
© A.G.Billard 2004 – Last Update March 2011
88<br />
5.6 Kernel K-Means<br />
Kernel K-Means is one attempt at using the kernel trick to improve the properties of one of the<br />
simplest clustering techiques to date, the so-called K-means clustering technique, see Section<br />
3.1.2.<br />
i<br />
K-means builds partition the data into a finite set of K clusters C , i = 1... K,<br />
(here, do not confuse<br />
the scalar K with the Gram matrix seen previously). K-means relies on a measure of distance<br />
across datapoint, usually the Euclidean distance. It proceeds iteratively by updating, at each<br />
iteration, the centers<br />
datapoints { i} i 1<br />
function:<br />
µ 1<br />
,...., µ of the clusters until no update is required. Given a set of M<br />
K<br />
M<br />
X x =<br />
= , the K-means processus consists in minimizing the following objective<br />
J<br />
( )<br />
1<br />
K<br />
2<br />
j<br />
j i<br />
x C<br />
K<br />
= x −<br />
i i<br />
=<br />
i= 1<br />
j i<br />
x ∈C mi<br />
∑∑ (5.25)<br />
∈<br />
µ ,...., µ µ with µ<br />
Where m is the number of datapoints in cluster C<br />
i .<br />
i<br />
Since each cluster relies on a common distance measure, each cluster is separated from the<br />
other by a linear hyperplane, as illustrated below:<br />
∑<br />
x<br />
j<br />
∗µ1<br />
∗µ2<br />
*µ3<br />
To counter this disadvantage, kernel k-means first maps the datapoints onto a higher-dimensional<br />
feature space through a non-linear mapφ . It then proceeds as classical K-means and search for<br />
hyperplanes in the feature space. To do this, kernel K-means exploits once more the kernel trick<br />
k x, x' = φ x φ x'<br />
as the dot product in feature space. Using the<br />
and sets the kernel ( ) ( ) ( )<br />
observation that kernel k-means objective function can be expanded into a sum of inner product<br />
across datapoints, yields:<br />
© A.G.Billard 2004 – Last Update March 2011
89<br />
J<br />
j<br />
( µ<br />
1,....,<br />
µ<br />
K) = ∑∑ φ( x ) −φ ( µ<br />
i)<br />
=<br />
K<br />
i= 1 x ∈C<br />
K<br />
∑∑<br />
j<br />
j<br />
( x ) φ( x )<br />
( )<br />
2<br />
l j<br />
j l<br />
( x ) φ( x ) ∑ φ( x ) φ( x )<br />
2 φ<br />
l i<br />
∈<br />
− +<br />
m<br />
x , x ∈C<br />
i j<br />
j l<br />
( ) ∑ k( x , x )<br />
( m )<br />
( m )<br />
i= 1 x ∈C i i<br />
⎛⎛<br />
K<br />
⎜⎜<br />
= ∑ ∑ ⎜⎜k x , x<br />
j i<br />
⎜⎜<br />
⎝⎝<br />
i<br />
i<br />
⎛⎛<br />
⎜⎜<br />
⎜⎜φ<br />
⎜⎜<br />
⎝⎝<br />
j j x C<br />
∑<br />
2 k x , x<br />
j i<br />
∈<br />
− +<br />
m<br />
i i x C<br />
∑<br />
j l i<br />
x , x ∈C<br />
i= 1 x ∈C i i<br />
j l i<br />
2<br />
⎞⎞<br />
⎟⎟<br />
⎟⎟<br />
⎟⎟<br />
⎠⎠<br />
2<br />
⎞⎞<br />
⎟⎟<br />
⎟⎟<br />
⎟⎟<br />
⎠⎠<br />
(5.26)<br />
In kernel K-Means, the iteration stops when the change in J is sufficiently small.<br />
As for all kernel methods, a clear bottleneck of kernel K-Means is that each iteration steps<br />
2<br />
requires O( M)<br />
computation step. Smilarly to classical K-means, kernel K-Means is also very<br />
sensitive to the initialization of the centers and may lead to poor partiotioning with a poor<br />
initialization, as shown in Figure 5-4.<br />
Figure 5-4: A difficult clustering problem. Standard K-Means (left) is unable to correctly separate the three<br />
clusters. Using a Gaussian kernel (gamma = 0.01) Kernel K-Means (right) successfully separates the three<br />
clusters. [DEMOS\CLUSTERING\KERNEL-KMEANS.ML]<br />
© A.G.Billard 2004 – Last Update March 2011
90<br />
5.7 Support Vector Machines<br />
Adapted from "Learning with Kernels" by B. Scholkopf and A. Smola, MIT Press 2002, and "A Tutorial on Support<br />
Vector Machines for Pattern Recognition", by C.J.C. Burges, Data Mining and Knowledge Discovery, 2, 1998.<br />
Support vector machine (SVM) is probably one of the most popular applications of kernel<br />
methods. SVM exploits the kernel trick to extend classical linear classification to non-linear<br />
classification. It has been shown to be very powerful at separating highly intertwined data. Its<br />
simplicity of use and the large number of available software makes it easy to implement. We will<br />
here very briefly review the principle and the derivation of the algorithm. We will highlight on the<br />
sensivity to some hyperparameter so as to guide the potential user and ensure optimal use of the<br />
algorithm.<br />
Linear Case<br />
Let us first start by considering a very simple classification problem which illustrates well the<br />
reasoning behind using Kernel methods for classification. Suppose we are given two classes of<br />
objects. We are then faced with a new object, and we have to assign it to one of the two classes.<br />
This problem can be formalized as follows:<br />
Consider a training set composed of M input-output pairs where each input { } i =<br />
i<br />
1...<br />
associated with a label { } i =<br />
i<br />
1...<br />
y<br />
M<br />
. The label<br />
In SVM, we consider solely binary classification problems, i.e.:<br />
i<br />
y denotes the class to which the pattern<br />
{ , i=<br />
1... M<br />
i i<br />
x y } X { 1 }<br />
x<br />
M N<br />
∈ ° is<br />
i<br />
x belongs.<br />
∈ × ± (5.27)<br />
Note that there exist extensions to multiclass SVM. We will here focus first on the binary<br />
classification case.<br />
Given this training set, we wish to build a model of the relationships across the input points and<br />
their associated class label that would be a good predictor of the class to which each pattern<br />
belongs and would allow us to do inference: that is, given a new pattern x , we could estimate the<br />
class to which this new pattern belongs. In some sense, for a given new pattern x , we would<br />
choose a corresponding y, so that the pair { xyis , } somewhat similar to the training examples. To<br />
this end, we need a notion of similarity in X and in{ ± 1}<br />
.<br />
Similarity Measures: Characterizing the similarity of the outputs { 1}<br />
± is easy. In binary<br />
classification, only two situations occur: two labels can either be identical or different. The choice<br />
of the similarity measure for the inputs, on the other hand, is more complex and is tighly linked to<br />
k x, x'<br />
gives a<br />
the idea of kernel. As we have seen previously in these lecture notes, the kernel ( )<br />
measure of similarity across two datapoints x and x' . A natural choice for the kernel when<br />
considering the simple linear classification problem outlined above is to take the dot product, i.e.:<br />
N<br />
k x, x' = x, x' =∑ x x'<br />
(5.28)<br />
( )<br />
The geometrical interpretation of the canonical dot product is that it computes the cosine of the<br />
angle between the vectors x and x ' , provided they are normalized with length 1.<br />
i=<br />
1<br />
i<br />
i<br />
© A.G.Billard 2004 – Last Update March 2011
91<br />
A simple pattern recognition algorithm<br />
We now have all the tools to derive a simple classification algorithm.<br />
It is now possible, using the canonical dot product as a similarity measure in our dot product<br />
space H to design a simple pattern recognition algorithm that will separate our input space into<br />
two classes. The algorithm proceeds as follows:<br />
1. Assign each point randomly to one of the two classes<br />
2. Compute the means of the two classes in the feature space:<br />
c<br />
c<br />
+<br />
−<br />
1<br />
=<br />
m<br />
1<br />
=<br />
m<br />
∑<br />
+ iy | i =+ 1<br />
∑<br />
− iy | i =−1<br />
Where m +<br />
and m −<br />
are the number of examples with positive and negative labels,<br />
respectively. We assume that both classes are non-empty.<br />
3. Reassign each point to the class whose mean is closest.<br />
x<br />
i<br />
i<br />
x<br />
(5.29)<br />
This geometric construction can be formulated in terms of the dot product<br />
between c +<br />
and c −<br />
lies the point c ( c c ) /2<br />
+ −<br />
xx , ' . Halfway<br />
= + . We compute the class to which the point x<br />
belongs by checking whether the vector connecting x− c encloses an angle smaller than π /2<br />
with the vector w= c+ − c connecting the class means. This leads to:<br />
−<br />
( )<br />
y = sgn x−c,<br />
w<br />
( x− ( c+ + c− ) c+ + c−<br />
)<br />
= sgn / 2,<br />
( xc+ − xc−<br />
+ b)<br />
= sgn , , .<br />
(5.30)<br />
1 2 2<br />
with offset b = ( c− − c+<br />
)<br />
: .<br />
2<br />
The decision boundary indicated by the dotted line is a hyperplane, orthogonal to w, see Figure<br />
5-5.<br />
Figure 5-5: A simple geometrical classification algorithm. The decision boundary indicated by the dotted<br />
line is a hyperplane orthogonal to w. (From Scholkopf & Smola 2002)<br />
© A.G.Billard 2004 – Last Update March 2011
92<br />
Let us now rewrite this result in terms of the input patterns<br />
dot product. We get the decision function:<br />
⎛⎛ 1 1<br />
⎞⎞<br />
sgn , i<br />
i<br />
y= ⎜⎜ x x − x,<br />
x + b<br />
⎜⎜<br />
⎟⎟<br />
m+ i= | yi=+ 1<br />
m<br />
⎟⎟<br />
− i= | yi<br />
⎝⎝<br />
=+ 1 ⎠⎠<br />
⎛⎛ 1 1<br />
⎞⎞<br />
i<br />
i<br />
= sgn ⎜⎜ k( x, x ) − k( x,<br />
x ) + b<br />
⎜⎜<br />
⎟⎟<br />
m+ i= | yi=+ 1<br />
m<br />
⎟⎟<br />
− i= | yi<br />
⎝⎝<br />
=+ 1 ⎠⎠<br />
x i , using the kernel k to compute the<br />
∑ ∑ (5.31)<br />
∑ ∑ (5.32)<br />
If b = 0 , i.e. the two classes' means are equidistant to the origin, then k can be viewed as a<br />
probability density when one of its arguments is fixed. By this, we mean that it is positive and has<br />
unit integral,<br />
∫<br />
( ʹ′ )<br />
k x , x dx= 1 ∀xʹ′∈X<br />
X<br />
In this case, y takes the form of the so-called Bayes classifier separating the two classes, subject<br />
to the assumption that the two classes of patterns were generated by sampling from two<br />
probability distributions that are correctly estimated by the Parzen Windows estimator of the two<br />
class densities,<br />
and<br />
where x∈ X .<br />
p<br />
p<br />
+<br />
−<br />
1<br />
i<br />
: = ∑ k x, x<br />
m<br />
+ iy | i =+ 1<br />
− iy | i =−1<br />
( )<br />
1<br />
i<br />
: = ∑ k x, x<br />
m<br />
( )<br />
Thus, given some point x , the class label is computed by checking which of the two values p +<br />
or<br />
p −<br />
is larger. This is the best decision one can take if one has no prior information on the data<br />
distribution.<br />
5.7.1 Support Vector Machine for Linearly Separable Datasets<br />
SVM consists of determining a hyperplane that determines a decision boundary in a binary<br />
classification problem. We consider first the linear case and then move to the non-linear case.<br />
Linear Support Vector Machines<br />
Let us assume for a moment that our datapoints x live in a feature space H . The class of<br />
hyperplanes in the dot product space H is given by:<br />
with the corresponding decision functions<br />
wx , + b= 0, where w∈H,<br />
b∈° (5.33)<br />
© A.G.Billard 2004 – Last Update March 2011
93<br />
( ) ( , )<br />
f x = sign w x + b<br />
(5.34)<br />
We can now define a learning algorithm for linearly separable problems. First, observe that<br />
among all hyperplanes separating the data, there exists a unique optimal hyperplane,<br />
distinguished by the maximum margin of separation between any training point and the<br />
hyperplane, defined by:<br />
{ }<br />
i<br />
maximizew ∈H,<br />
b∈Rmin x−x , x∈ H, w, x + b= 0, i = 1,..., M (5.35)<br />
While in the simple classification problem we had presented earlier on, it was sufficient to simply<br />
compute the distance between the two cluster’ means to define the normal vector and so the<br />
hyperplane, here, the problem of finding the normal vector that leads to the largest margin is<br />
slightly more complex.<br />
To construct the optimal hyperplane, we have to solve for the objective function τ ( w)<br />
:<br />
subject to the inequality constraints:<br />
minimize<br />
1 2<br />
∈ ∈R<br />
τ ( w)<br />
= w<br />
(5.36)<br />
2<br />
w H,<br />
b<br />
i<br />
( )<br />
i<br />
y w, x + b ≥1, ∀ i=1,...M<br />
(5.37)<br />
Consider the points for which the equality in (5.37) holds (requiring that there exists such a point<br />
is equivalent to choosing a scale for w and b). These points lie on two hyperplanes<br />
i<br />
( + = ) and H2 ( wx , 1)<br />
i b<br />
H1 wx , b 1<br />
+ =− with normal w and perpendicular distance from<br />
the origin 1 − b / w . Hence d = d = 1/ w and the margin is simply 2 / w . Note that<br />
1<br />
2<br />
+ −<br />
H and<br />
H are parallel (they have the same normal) and that no training points fall between them. Thus<br />
we can find the pair of hyperplanes which gives the maximum margin by minimizing<br />
to constraints (5.37) that ensures that the class label for a given<br />
for y = −1.<br />
i<br />
2<br />
w , subject<br />
i<br />
i<br />
x will be + 1 if y = + 1, and − 1<br />
Let us now rephrase the minimization under constraint problem given by (5.36) and (5.37) in<br />
terms of the Lagrange multipliers α<br />
i, i= 1,..., l, one for each of the inequality constraints in (5.37).<br />
Recall that the rule is that for constraints of the form ci<br />
≥ 0, the constraint equations are<br />
multiplied by positive Lagrange multipliers and subtracted from the objective function, in (5.36), to<br />
form the Lagrangian. For equality constraints, the Lagrange multipliers are unconstrained. This<br />
gives the Lagrangian:<br />
We must now minimize<br />
of<br />
L with respect to all the<br />
P<br />
l<br />
1 2<br />
i<br />
i<br />
( ) ( )<br />
L wb , , α ≡ w − α y wx , + b + α .<br />
P i i<br />
2 i= 1 i=<br />
1<br />
l<br />
∑ ∑ (5.38)<br />
L with respect to<br />
P<br />
w , b , and simultaneously require that the derivatives<br />
α vanish, all subject to the constraints α ≥ 0. This is a convex<br />
i<br />
i<br />
© A.G.Billard 2004 – Last Update March 2011
94<br />
quadratic programming problem, since the objective function is itself convex, and those points<br />
which satisfy the constraints also form a convex set (any linear constraint defines a convex set,<br />
and a set of N simultaneous linear constraints defines the intersection of N convex sets, which<br />
is also a convex set). This means that we can equivalently solve the following dual problem:<br />
maximize L , subject to the constraints that the gradient of L with respect to w and b vanish,<br />
P<br />
α ≥ .<br />
and subject also to the constraints that the 0<br />
i<br />
Requesting that the gradient of<br />
L with respect to<br />
P<br />
w and b vanish<br />
P<br />
∂<br />
i i<br />
P j i<br />
, j=1,....N<br />
j<br />
w L = w −∑<br />
∂<br />
α y x<br />
(5.39)<br />
j<br />
i<br />
gives the conditions:<br />
∂<br />
∂b L<br />
P<br />
∑ i<br />
(5.40)<br />
i<br />
i<br />
=− α y = 0<br />
M<br />
w = ∑ α<br />
(5.41)<br />
M<br />
i=<br />
1<br />
i=<br />
1<br />
i i<br />
i<br />
yx<br />
i<br />
∑ α i<br />
y = 0.<br />
(5.42)<br />
Since these are equality constraints in the dual formulation, we can substitute them into (5.38) to<br />
give:<br />
1<br />
j<br />
L α = α y − αα y y x , x .<br />
( )<br />
∑ ∑ (5.43)<br />
i i j i<br />
D i i j<br />
i 2 i,<br />
j<br />
Note that we have now given the Lagrangian different labels (P for primal, D for dual) to<br />
emphasize that the two formulations are different: L and L arise from the same objective<br />
function but with diferent constraints; and the solution is found either by minimizing<br />
maximizing<br />
L . Note also that if we formulate the problem with b = 0<br />
D<br />
P<br />
D<br />
L or by<br />
P<br />
, which amounts to<br />
requiring that all hyper-planes contain the origin (this is a mild restriction for high dimensional<br />
spaces, since it amounts to reducing the number of degrees of freedom by one), support vector<br />
training (for the separable, linear case) then amounts to maximizing L with respect to the α ,<br />
subject to constraints (5.42) and positivity of theα , with solution given by (5.41). Notice that<br />
there is a Lagrange multiplier α for every training point. In the solution those points for which<br />
i<br />
α<br />
i<br />
> 0 are called support vectors and lie on one of the hyperplanes H1,<br />
2<br />
α = , and lie either on<br />
1<br />
H , or on that side of<br />
1<br />
points have<br />
i<br />
0<br />
inequality in (5.37) is satisfied.<br />
H or<br />
2<br />
i<br />
D<br />
H . All other training<br />
H or H such that the strict<br />
2<br />
i<br />
For these machines, the support vectors are the critical elements of the training set. They lie<br />
closest to the decision boundary; if all other training points were removed (or moved around, but<br />
so as not to cross H or<br />
1<br />
H ), and training was repeated, the same separating hyperplane would<br />
2<br />
be found.<br />
© A.G.Billard 2004 – Last Update March 2011
95<br />
Figure 5-6: A binary classification toy problem: separate dark balls from white balls. The optimal hyperplane<br />
is shown as the solid line. The problem being separable, there exists a weight vector w and an offset b<br />
i<br />
i<br />
such that y ( w x b)<br />
+ > ( i 1,..., m)<br />
, 0<br />
i<br />
hyperplane satisfy wx , b 1<br />
i<br />
i<br />
satisfying y ( w x b)<br />
= : Rescaling w and b such that the points closest to the<br />
+ = , we obtain a canonical form ( , )<br />
wb of the hyperplane,<br />
, + ≥ 1. Note that, in this case, the margin (the distance to the closest point to the<br />
1 2<br />
hyperplane) equals1/ w . This can be seen by considering two points x , x on opposite sides of the<br />
margin, that is,<br />
1<br />
w/<br />
2<br />
wx , + b= 1, wx , + b=− 1, and projecting them onto the hyperplane normal vector<br />
w . The support vectors are the points on the margin (encircled in the drawing).<br />
The generic minimization problem when one does not assume that the hyperplane goes through<br />
the origin (i.e. b ≠ 0 ) can be found by solving the so-called KKT (Karush-Kuhn-Tucker)<br />
conditions. These state that, at each point of the solution, the product between the dual variables<br />
and constraints has to vanish, i.e.:<br />
i<br />
( )<br />
i<br />
y w, x + b −1≥ 0, i= 1,.., M<br />
(5.44)<br />
αi ≥0, ∀ i= 1,... M<br />
(5.45)<br />
i<br />
i<br />
( ( ) )<br />
α , 1 0, 1,...<br />
i<br />
y w x + b − = ∀ i= M<br />
(5.46)<br />
The KKT conditions are necessary for wbα , , to be a solution.<br />
With all of the above, we now can determine the variables of the SVM problem. w is explicitly<br />
determined by (5.41). The threshold b is determined by solving the KKT "complementarity"<br />
condition given by (5.46): by choosing any i for which αi<br />
≠ 0 , one can compute b (note that it is<br />
numerically safer to take the mean value of b resulting from all such equations).<br />
© A.G.Billard 2004 – Last Update March 2011
96<br />
Figure 5-7: Linear separating hyperplanes for the non-separable case.<br />
5.7.2 Support Vector Machine for Non-linearly Separable Datasets<br />
The above algorithm for separable data, when applied to non-separable data, will find no feasible<br />
solution: this will be evidenced by the objective function (i.e. the dual Lagrangian) growing<br />
arbitrarily large. In order to handle non-separable data, one must relax the constraints (5.37). This<br />
can be done by introducing positive slack variables ξ<br />
i, i= 1,..., M , in the constraints, which then<br />
become:<br />
T i<br />
w x + b≥+ 1− ξ for y =+ 1<br />
(5.47)<br />
i<br />
i<br />
T i<br />
w x + b≤− 1+ ξ for y =− 1<br />
(5.48)<br />
ξ ≥ 0 i<br />
Thus, for an error to occur the corresponding ξ<br />
i<br />
must exceed unity, so<br />
i<br />
i<br />
i<br />
∀ (5.49)<br />
∑<br />
ξ i i<br />
is an upper bound<br />
on the number of training errors. Hence a natural way to assign an extra cost for errors is to<br />
change the objective function to be minimized to include a cost function, such as<br />
M<br />
⎛⎛ 2 C ⎞⎞<br />
min { ⎜⎜ w + ∑ ξi<br />
,<br />
w, ξ M<br />
⎟⎟<br />
⎝⎝<br />
i=<br />
1 ⎠⎠<br />
whereC is a parameter to be chosen by the user, a larger C corresponding to assigning a higher<br />
penalty to errors. As it stands, this is a convex programming problem and the Wolfe dual problem<br />
becomes:<br />
subject to:<br />
The solution is again given by:<br />
1<br />
i j i<br />
L α ≡ α − αα yy x,<br />
x<br />
j<br />
D ∑ i ∑ (5.50)<br />
i j<br />
i 2 i,<br />
j<br />
max { ( )<br />
α<br />
C<br />
≤ ≤ (5.51)<br />
M<br />
i<br />
α y = 0<br />
0 αi<br />
∑ i<br />
(5.52)<br />
i<br />
Ns<br />
w = ∑ α<br />
(5.53)<br />
i=<br />
1<br />
i i<br />
i<br />
yx<br />
© A.G.Billard 2004 – Last Update March 2011
97<br />
where<br />
N is the number of support vectors (to recall, the support vectors are all the points<br />
s<br />
which the corresponding Lagrange multiplier α<br />
i<br />
> 0<br />
x<br />
i<br />
for<br />
; these points lie exactly on the margin).<br />
Thus the only diference from the optimal hyperplane case is that the α<br />
i<br />
now have an upper<br />
C<br />
bound with .<br />
M<br />
Once again, we must use the KKT conditions to solve the primal minimization of<br />
complementary conditions to find b .<br />
L and the KKT<br />
P<br />
5.7.3 Non-Linear Support Vector Machines<br />
Let us now consider an extension of the linear type of classifier we considered before to tackle<br />
non-linear classification problem, such as the one highlighted in Figure 5-8.<br />
Figure 5-8: Degree 3 polynomial kernel. The background colour shows the shape of the decision surface.<br />
Figure 5-9: Classification using a polynomial kernel with different degrees (SVM). The data is not linearly<br />
separable (left). By increasing the degree of the polynomial, the separation plane becomes non-linear and is<br />
able to correctly separate the data. [DEMOS\CLASSIFICATION\SVM-POLY.ML]<br />
Following the same rational as presented earlier on, let us first map the data onto an Euclidean<br />
space H , using a mapping φ :<br />
φ : X a H<br />
x a<br />
φ<br />
( x)<br />
Assume that the training problem is in the form of dot products x x ( x )<br />
i j j<br />
, i T x<br />
(5.54)<br />
= ⋅ . In this case,<br />
the training algorithm in the mapped space would only depend on the data through dot products<br />
i<br />
j<br />
in H , i.e. on functions of the form ( x ), ( x )<br />
φ φ . If we can define a "kernel function" k such<br />
© A.G.Billard 2004 – Last Update March 2011
98<br />
i<br />
that ( , ) ( ),<br />
( )<br />
j<br />
i<br />
j<br />
k x x φ x φ x<br />
= , then training depends only on knowing k and would not<br />
require to know φ .<br />
The optimization problem consists then to maximize the following quantity:<br />
i j<br />
i<br />
( αi −αi )( αi −αi) k( x , x ) −ε ( αi − αi ) + y ( αi −αi<br />
)<br />
M M M<br />
1<br />
− ʹ′ ʹ′ ʹ′<br />
2<br />
l<br />
subject to<br />
1( αi<br />
αʹ′<br />
i=<br />
i )<br />
∑ ∑ ∑ (5.55)<br />
i, j= 1 i= 1 i=<br />
1<br />
∑ − = 0 and α , α [ 0, A<br />
i i ]<br />
ʹ′ ∈ . ε ∈R. In this case, the class label is<br />
computed as follows:<br />
( )<br />
M<br />
⎛⎛<br />
⎞⎞<br />
j<br />
y = sgn ⎜⎜ αik x, x + b⎟⎟<br />
⎝⎝ i<br />
⎠⎠<br />
∑ (5.56)<br />
Each expansion corresponds to a separating hyperplane in a feature space. In this sense, the<br />
can be considered a dual representation of the hyperplane's normal vector. A test point is<br />
classified by comparing it to all the training points with non-zero weight.<br />
α<br />
i<br />
5.7.4 n-SVM<br />
Chosing the right parameter C may be difficult in practice. n-SVM is an alternative that optimizes<br />
for the best tradeoff between model complexity (the largest margin) and penalty on the error<br />
automatically. To this end, it introduces two other parameters n and r. ν ≥ 0 is an open parameter<br />
while ρ will be optimized for. The objective function becomes:<br />
M<br />
⎛⎛ 2 1 ⎞⎞<br />
min { ⎜⎜ w − νρ + ∑ξi<br />
,<br />
w, ξ<br />
M<br />
⎟⎟<br />
⎝⎝<br />
i=<br />
1 ⎠⎠<br />
i<br />
subject to y ,<br />
i<br />
( wx b)<br />
and ξ ≥0, ρ ≥0.<br />
i<br />
+ ≥ ρ−ξ<br />
i<br />
(5.57)<br />
To understand the role of ρ , observe first that when the points are well classified, the margin has<br />
now been changed to 2 ρ / w . The larger ρ the larger the margin. Since points within the margin<br />
may be misclassified, one can compute the margin error, i.e. the number of points that are within<br />
the margin while misclassified. ν varies the effect of this increase in the margin error while<br />
optimizing for a large value of ρ . One can show that:<br />
• ν is an upper bound on the fraction of margin error (i.e. the number of datapoints<br />
misclassified in the margin)<br />
• ν is a lower bound on the number of support vectors<br />
© A.G.Billard 2004 – Last Update March 2011
99<br />
5.8 Support Vector Regression<br />
In SVM, we have consider a mapping from the input data X onto a binary output y =± 1. Support<br />
Vector regression (SVR) extends the principle of SVM to allow a mapping f to a real value<br />
output:<br />
f : X → °<br />
( )<br />
x→ y = f x<br />
(5.58)<br />
SVR starts from the standard linear regression model and applies it in feature space. Assume a<br />
X →φ<br />
X ∈ H. Then, SVR seeks a linear mapping in<br />
projection of the data into a feature space ( )<br />
feature space of the form:<br />
( ) φ ( )<br />
f x = w, x + b, w∈H,<br />
b∈° (5.59)<br />
To recall, SVM approximates the classification problem by choosing a subset of data points, the<br />
support vectors, to support the decision function. This sparsification of the training dataset is the<br />
key strength of the algorithm. When considering non-separable datasets, SVM introduced a slack<br />
variable to give room for imprecise classification. SVR proceeds similarly and tries to find the<br />
optimal number of support vector while allowing for imprecise fitting. The allowed imprecision of<br />
the fitting through f is measured by a parameter ε ≥ 0 and is measured through an e -loss<br />
function:<br />
{ ε}<br />
( ) ( )<br />
y− f x = max 0, y− f x − ,<br />
(5.60)<br />
ε<br />
Points with a non-zero e -loss function lie outside the e-insensitive tube that surrounds the<br />
function f , see Figure 5-10.<br />
Figure 5-10: Effect of a non-linear regression through SVR. The tightness of the e-insensitive tube around<br />
the regression signal varies along the state space as an effect of the distance in feature space between the<br />
support vectors (the support vector are plain circles). Datapoints within the e-insensitive tube do not<br />
influence the regression model and are indicated with un-filled circles.<br />
© A.G.Billard 2004 – Last Update March 2011
100<br />
In SVM, we found that minimizing w was interesting as it allowed a better separation of the two<br />
classes. Scholkopf and Smola argue that, in SVR, minimizing w is also interesting albeit for a<br />
different geometrical reason. They start by computing the e-margin given by:<br />
{ }<br />
( ) ( ) ( ) ( ) ( )<br />
mε f : = inf φ x −φ x' , ∀x, x', s.t. f x − f x' ≥ 2ε<br />
(5.61)<br />
Figure 5-11: Minimizing the e-margin in SVR is equivalent to maximizing the slope of the function f.<br />
Similarly to the margin in SVM, the e-margin is a function of the projection vector w . As illustrated<br />
in Figure 5-11, the flatter the slope w of the function f, the larger the margin. Conversely, the<br />
steeper the slope is, the larger the width of the e-insensitive tube. Hence to maximize the margin,<br />
we must minimize w (minimizing each projection of w will flatten the slope). The linear illustration<br />
in Figure 5-11 holds in feature space as we will proceed to a linear fit in feature space.<br />
Finding the optimal estimate of f can now be formulated as an optimization problem of the form:<br />
⎛⎛1<br />
min ⎜⎜<br />
w ⎝⎝ 2<br />
2 ε<br />
{ w + C⋅R [ f]<br />
⎞⎞<br />
⎟⎟<br />
⎠⎠<br />
(5.62)<br />
ε<br />
Where R [ f]<br />
is a regularized risk function that gives a measure of the e-insensitive error:<br />
1 M i i<br />
[ ] = − ( )<br />
ε<br />
R f ∑ y f x<br />
(5.63)<br />
M<br />
ε<br />
i=<br />
1<br />
C in (5.62) is a constant and hence a free parameter that determines a tradeoff between<br />
minimizing the increase in the error and optimizing for the complexity of the fit. This procedure is<br />
called e-SVR.<br />
Formalism:<br />
© A.G.Billard 2004 – Last Update March 2011
101<br />
The optimization problem given by (5.62) can be rephrased as an optimization under constraint<br />
problem of the form:<br />
1 2<br />
minimize w 2<br />
⎧⎧ i<br />
i<br />
⎪⎪<br />
w,<br />
φ( x ) + b− y ≤ε<br />
subject to ⎨⎨<br />
∀ i=<br />
1,... M<br />
i<br />
i<br />
⎪⎪y − w,<br />
φ( x ) −b≤ε<br />
⎩⎩<br />
(5.64)<br />
Minimizing for the norm of w , we ensure a) that the optimization problem at stake is convex<br />
(hence easier to solve) and b) that the conditions given in (5.64) are easier to satisfy (for a small<br />
value of w , the left handside of each condition is more likely to be bounded above by ε ).<br />
Note that satisfying the conditions of (5.64) may be difficult (or impossible) for an arbitrary small<br />
*<br />
e, one can once more introduce the set of slack variables ξi and ξ<br />
i<br />
( i = 1... M)<br />
for each datapoint,<br />
to denote whether the datapoint is on the left or righthandside of the function f 5 . The slack<br />
variables measure by how much each datapoint is incorrectly fitted. This yields the following<br />
optimization problem:<br />
1 C<br />
minimize w +<br />
2 M<br />
i<br />
( )<br />
i<br />
( )<br />
M<br />
∑( ξi<br />
+ ξi<br />
)<br />
2 *<br />
i=<br />
1<br />
⎧⎧ i<br />
w,<br />
φ x + b− y ≤ ε + ξi<br />
⎪⎪<br />
⎪⎪ i<br />
*<br />
subject to ⎨⎨y − w,<br />
φ x −b≤ ε + ξi<br />
⎪⎪<br />
*<br />
⎪⎪ξi<br />
≥ 0, ξi<br />
≥ 0<br />
⎩⎩<br />
(5.65)<br />
Again, one can solve this quadratic problem through Lagrange. Introducing a set of Lagrange<br />
multipliers α , η ≥ 0 for each of our inequalities constraints and writing the Lagrangian:<br />
i<br />
i<br />
1 C C<br />
L , , *, = +<br />
2 M<br />
M<br />
M<br />
M<br />
2 * * *<br />
( w ξξ b) w ∑( ξi + ξi ) − ∑( ηξ i i<br />
+ ηξ<br />
i i )<br />
M<br />
∑<br />
i=<br />
1<br />
M<br />
i=<br />
1<br />
i<br />
i= 1 i=<br />
1<br />
i<br />
i<br />
( i<br />
y w,<br />
( x ) b)<br />
− α ε + ξ + − φ −<br />
∑<br />
i<br />
i<br />
( y w,<br />
( x ) b<br />
i<br />
)<br />
− α ε + ξ − + φ +<br />
* *<br />
i<br />
(5.66)<br />
Solving for each of the partial derivatives:<br />
∂L ∂L ∂L<br />
= 0; = 0; = 0<br />
(*)<br />
∂b ∂w ∂ξ<br />
M<br />
∂ L =<br />
*<br />
∑ ( αi<br />
− αi<br />
) = 0;<br />
(5.67)<br />
∂b<br />
i=<br />
1<br />
5 We will use the shorthand<br />
ξ<br />
(*)<br />
when the notation applies to both<br />
i<br />
ξ<br />
i<br />
*<br />
and ξ<br />
i<br />
.<br />
© A.G.Billard 2004 – Last Update March 2011
102<br />
M<br />
∂ L =<br />
*<br />
i<br />
w − ∑ ( αi<br />
− αi<br />
) φ( x ) = 0;<br />
∂w<br />
i=<br />
1<br />
(5.68)<br />
∂L<br />
C (*) (*)<br />
= − 0<br />
i( *)<br />
i i<br />
ξ M α − η =<br />
∂<br />
(5.69)<br />
Substituting in (5.66) yields the dual optimization under constraint problem:<br />
M<br />
⎧⎧ 1 * *<br />
i j<br />
⎪⎪ − ∑ ( αi − αi<br />
)( α<br />
j − α<br />
j) ⋅ k( x , x )<br />
⎪⎪ 2 i, j=<br />
1<br />
max { ⎨⎨<br />
M<br />
M<br />
*<br />
αα , ⎪⎪ −<br />
* i *<br />
ε ( αi<br />
+ αi<br />
) + y ( αi<br />
+ αi<br />
⎪⎪ ∑ ∑ )<br />
⎩⎩ i= 1 i=<br />
1<br />
M<br />
* * i ⎡⎡ C ⎤⎤<br />
subject to ∑( αi<br />
− αi<br />
) = 0 and αi<br />
, αi<br />
∈ ⎢⎢ 0,<br />
i=<br />
1<br />
M ⎥⎥<br />
⎣⎣ ⎦⎦<br />
(5.70)<br />
Solving for the above optimization problem will yield solutions for the Lagrange multipliers α * , α .<br />
These can then be used to construct our estimate of the best projection vector w by replacing in<br />
(5.68):<br />
M<br />
w= −<br />
i=<br />
1<br />
*<br />
i<br />
( αi<br />
αi<br />
) φ( x )<br />
∑ (5.71)<br />
To determine the value of the offset b , one must further solve for the Karush-Kuhn-Tucker (KKT)<br />
conditions:<br />
i<br />
i<br />
( i<br />
y w ( x ) b)<br />
i<br />
i<br />
y w ( x ) b<br />
α ε + ξ + − , φ − = 0,<br />
i<br />
(<br />
i<br />
)<br />
α ε + ξ − + , φ + = 0,<br />
* *<br />
i<br />
and<br />
⎛⎛<br />
⎜⎜<br />
⎝⎝<br />
⎛⎛<br />
⎜⎜<br />
⎝⎝<br />
C<br />
M<br />
C<br />
M<br />
⎞⎞<br />
− αi<br />
⎟⎟ξi<br />
= 0,<br />
⎠⎠<br />
* ⎞⎞ *<br />
− αi<br />
⎟⎟ξi<br />
= 0.<br />
⎠⎠<br />
(5.72)<br />
The above optimization problem can be solved using interior-point optimization, see (Scholkopf &<br />
Smola, 2002).<br />
It is worth spending a little bit of time looking at the geometrical implication of conditions (5.72).<br />
(*) C<br />
The last two conditions show that, when the Lagrange multipliers take valueα i<br />
= , the<br />
M<br />
corresponding slack variable (*)<br />
can take arbitrary value and hence the corresponding points can<br />
ξ<br />
i<br />
be anywhere, including outside the e-insensitive tube. Vice-versa, when<br />
have ξ (*) i<br />
= 0 . These become the support vectors.<br />
(*) ⎤⎤ C ⎡⎡<br />
αi<br />
∈ ⎥⎥ 0,<br />
M ⎢⎢<br />
⎦⎦ ⎣⎣ , we<br />
© A.G.Billard 2004 – Last Update March 2011
103<br />
Note that since we never have the projections ( x<br />
i<br />
)<br />
We can however once more exploit the kernel trick to compute f . Using<br />
M<br />
φ , we cannot compute explicitly w in (5.71).<br />
*<br />
i<br />
( ) = ∑( i<br />
− i ) ( ) ( )<br />
w,<br />
φ x α α φ x φ x<br />
i=<br />
1<br />
M<br />
*<br />
i<br />
∑( αi<br />
αi<br />
) k( x x)<br />
= −<br />
i=<br />
1<br />
, ,<br />
we can compute an estimate of our regression function through:<br />
M<br />
*<br />
i<br />
( ) ( αi<br />
αi<br />
) ( , )<br />
f x = ∑ − k x x + b<br />
(5.73)<br />
i=<br />
1<br />
Observe that the computation costs for the regression function grow linearly with the number<br />
M of datapoints. As for SVM, computation can be reduced importantly if one reduces the number<br />
of datapoints for which the elements in the sum are non-zero, the so-called support vectors. This<br />
*<br />
is the case when ( αi<br />
αi<br />
)<br />
*<br />
− = 0. Note that for all points within the e-insensitive tube α = α = 0 (so<br />
as to satisfy the KKT conditions given in (5.72).<br />
i<br />
i<br />
© A.G.Billard 2004 – Last Update March 2011
104<br />
Examples:<br />
Figure 5-12 illustrates the application of SVR on the same dataset (these data were generated<br />
using MLdemos). When using a linear kernel with a large e, one can completely encapsulate the<br />
datapoints, while still yielding a very poor fit. Using a Gaussian kernel allows to fit better the nonlinearities.<br />
This is however very sensitive to the choice of penalty given to poor fit through<br />
parameter C. A high penalty will result in a smoother fit.<br />
Figure 5-12: Example of e-SVR on a two-dimensional datasets. Datapoints are shown in plain dot. The<br />
regression signal is in solid line. The boundaries around the e-insensitite tube are drawn in light grey lines.<br />
using a linear kernel (top) and a Gaussian kernel (bottom). TOP: effect of the increasing the e-tube with<br />
e=0.02 (left) and e=0.1 (right). BOTTOM: effect of increasing parameter C (from left to right, C=10, 100 and<br />
1000) that penalies for poorly fit datapoints.<br />
SVR as all other regression techniques remain very sensitive also the choice of hyperparameter<br />
for the kernel. This is illustrated in Figure 5-13. Too small a kernel width will lead to overfitting of<br />
the data. Too large may lead to very poor performance. The latter effect can be compensated by<br />
choosing appropriate value for the hyperparameters of the optimization function, namely C and e,<br />
see Figure 5-14. The small kernel width that had led to a poor fit in Figure 5-13 is compensated<br />
by relaxing the constraints using a large e and smaller C. We also see that reducing the<br />
constraints and widening e decreases the number of support vectors. While the very tight fit in<br />
Figure 5-13 used almost all datapoints as support vector, the looser fit in Figure 5-14 used much<br />
less.<br />
© A.G.Billard 2004 – Last Update March 2011
105<br />
Figure 5-13: Effect of the kernel width on the fit. Here fit using C=1000, e=0.01, kernel width=0.01 (top), 0.1<br />
(bottom). The points encircled represent the support vectors.<br />
Figure 5-14: Reduction of the effect of the kernel width on the fit by choosing appropriate hyperparameters.<br />
Gaussian SVR fit using C=100, e=0.03, kernel width=0.1.<br />
© A.G.Billard 2004 – Last Update March 2011
106<br />
5.8.1 n-SVR<br />
The e parameter in e-SVR determines the desired accuracy of the approximation. Determining a<br />
good e may be difficult in practice. n-SVR is an alternative method that suppresses the need to<br />
pre-specifying the free parameter C in (5.65), by introducing (yet another!) parameter n. The idea<br />
if that this new parameter will make it easier to estimate e as one finds a tradeoff between model<br />
complexity and slack variables.<br />
By introducing a penalty throughν ≥ 0 , the optimization of (5.65) becomes:<br />
( )<br />
( * M<br />
1 2 ⎛⎛ 1<br />
w ξ ε) w ⎜⎜νε + ∑( ξ *<br />
i<br />
+ ξi<br />
)<br />
minimize L , , + C<br />
2 ⎝⎝<br />
i<br />
( )<br />
i<br />
( )<br />
⎧⎧ i<br />
w,<br />
φ x + b− y ≤ ε + ξi<br />
⎪⎪<br />
⎪⎪ i<br />
*<br />
subject to ⎨⎨y − w,<br />
φ x −b≤ ε + ξi<br />
⎪⎪<br />
*<br />
⎪⎪ξi<br />
≥ 0, ξi<br />
≥ 0, ε ≥ 0<br />
⎩⎩<br />
M<br />
i=<br />
1<br />
⎞⎞<br />
⎟⎟<br />
⎠⎠<br />
(5.74)<br />
Notice that we now optimize also for the value of e. The term νε in the objective function is now<br />
a weighting term that balances a growth ofε and the effect this has on the increase of the poorly<br />
fit datapoints (last term of the objective function).<br />
This last new equality constraint on e yields a new Lagrange solution with associated Lagrange<br />
multiplier β . One can then proceed to the same steps as done when solving e-SVM, i.e. write the<br />
Lagrangian, take the partial derivatives, write the dual and the solution to KKT conditions (see<br />
Scholkopf & Smola 2002 for details). This yields the following n-SVR optimization problem:<br />
For ν ≥ 0, C>0<br />
⎛⎛<br />
M<br />
M<br />
* 1<br />
⎞⎞<br />
i * *<br />
i j<br />
max { ⎜⎜∑( αi −αi<br />
) y − ∑( αi −αi<br />
)( α<br />
j<br />
−α<br />
j) k( x , x ) ⎟⎟,<br />
⎝⎝ i= 1 2 i, j=<br />
1<br />
⎠⎠<br />
(*)<br />
M<br />
α ∈°<br />
M<br />
*<br />
∑ ( αi<br />
αi<br />
)<br />
subject to − = 0,<br />
i, j=<br />
1<br />
α<br />
(*)<br />
i<br />
M<br />
*<br />
∑ ( i i )<br />
i, j=<br />
1<br />
⎡⎡ C ⎤⎤<br />
∈ ⎢⎢ 0, ,<br />
M ⎥⎥<br />
⎣⎣ ⎦⎦<br />
α + α ≤Cν.<br />
(5.75)<br />
The regression estimate then takes the same form as before and is expressed as a linear<br />
(*)<br />
combination of the kernel estimated on each of the data point with non zero α (the support<br />
i<br />
vectors), i.e.:<br />
M<br />
*<br />
i<br />
( ) ( αi<br />
αi<br />
) ( )<br />
f x = ∑ − k x , x + b.<br />
(5.76)<br />
i, j=<br />
1<br />
As we did before solyly for, we can now also find b and ε by solving the KKT conditions.<br />
© A.G.Billard 2004 – Last Update March 2011
107<br />
To better understand the effect that n has on the optimization observe first that if ν ≥ 1 then the<br />
second and third conditions in (5.75) are redundant and hence all values of n greater than 1 will<br />
have the same effect on the optimization. One should then work solely with values ranging<br />
between 0≤ν<br />
≤ 1.<br />
Interestingly, a number of properties can be derived:<br />
(*)<br />
• n is an upper bound on the fraction of error (i.e. the proportion of datapoints with ξ > 0),<br />
• n is a lower bound on the fraction of support vectors.<br />
These two properties are illustrated in Figure 5-16.<br />
In summary, n-SVR is advantageous over e-SVM in that it allows one to automatically adjust the<br />
sensitivity of the algorithm through the automatic computation of e. To some extent, this is<br />
equivalent to fitting a model of the noise on the data (assuming a uniform noise model). This is<br />
illustrated in Figure 5-15.<br />
Figure 5-15: Effect of the automatic adaptation of e using n-SVR. (Top) Data with no noise. (Bottom) Same<br />
dataset with a white noise. In both plots, n-SVR was fitted with C=100, n=0.05, and a Gaussian kernel with<br />
kernel width=0.021.<br />
© A.G.Billard 2004 – Last Update March 2011
108<br />
Figure 5-16: Increase of the number of support vectors and of the proportion of datapoints outside the<br />
e-sensitive tube when increasing n. From top to bottom, n takes value 0.08, 0.1 and 0.9. n-SVR was fitted<br />
with C=50 and a Gaussian kernel with kernel width=0.021.<br />
© A.G.Billard 2004 – Last Update March 2011
109<br />
5.9 Gaussian Process Regression<br />
Adapted from C. E. Rasmussen & C. K. I. Williams, Gaussian Processes for Machine<br />
Learning, the MIT Press, 2006.<br />
In Section 4.3, we introduced probabilistic regression, a method by which the standard linear<br />
T<br />
2<br />
regressive model y w x N( 0, σ )<br />
= + was extended to building a probabilistic estimate of the<br />
conditional distribution p( y|<br />
x ). Then for a new query point x*, one could compute an estimate<br />
y* by taking the expectation of y given x , yˆ = E p( y|<br />
x)<br />
. Further, using the assumption that<br />
{ }<br />
all training points are i.i.d. and using a Gaussian prior with variance ∑<br />
w<br />
on the distribution of the<br />
parameters w of the model, we found that the predictive distribution is also Gaussian and is given<br />
by:<br />
* * ⎛⎛ 1 * T<br />
* T * ⎞⎞<br />
p( y | x , X, y)<br />
= N⎜⎜<br />
x ∑ ,<br />
2 w<br />
Xy x ∑w<br />
x ⎟⎟<br />
⎝⎝σ<br />
⎠⎠<br />
(5.77)<br />
where X is N× M and y is 1× N are the matrix and vector of input-output training points. Next,<br />
we see how this probabilistic linear regressive model can be extended to allow non-linear<br />
regression, exploiting once more the kernel trick.<br />
Non-linear Case<br />
Assuming a non-linear transformation into feature space through the function φ ( x)<br />
, that maps<br />
each N-dimensional datapoint x into a D-dimensional feature space, and substituting everywhere<br />
in the linear model, the predictive distribution for the non-linear model becomes:<br />
1<br />
p y x X y N⎜⎜<br />
x A X y x A x<br />
2<br />
⎝⎝σ<br />
* * ⎛⎛<br />
*<br />
T<br />
−1 *<br />
T<br />
−1 *<br />
( | , , ) = φ( ) Φ( ) , φ( ) φ( )<br />
( ) ( )<br />
−2 T −1<br />
w<br />
with A= σ Φ X Φ X +Σ<br />
*<br />
⎞⎞<br />
⎟⎟<br />
⎠⎠<br />
(5.78)<br />
Φ( X ) is a matrix whose columns are composed of each projection φ ( x)<br />
of each training<br />
point x∈<br />
X . While the expression of this density is quite simple, in practice computing the<br />
inverse of the matrix A may be very difficult as its dimension is proportional to the dimension of<br />
the feature space that may be quite large.<br />
5.9.1 What is a Gaussian Process<br />
The baysian regression model given by (5.78) is one example of Gaussian Process.<br />
In its generic definition, a “Gaussian process is a collection of random variables, any finite<br />
number of which have a joint Gaussian distribution”.<br />
Assume that the real process you wish to describe is regulated by the function ( ) f x , where<br />
x spans the data space. Then, a Gaussian Process (GP) estimate of the function f is entirely<br />
© A.G.Billard 2004 – Last Update March 2011
110<br />
defined by its mean m( x)<br />
and covariance function ( , ')<br />
x’ that span the data space):<br />
( ) =Ε ( )<br />
m x f x<br />
k x x (k is defined for each pair of point x,<br />
{ }<br />
( )( ( ) ( ))<br />
{ }<br />
( , ') ( ) ( )<br />
k x x =Ε f x −m x f x −m x<br />
(5.79)<br />
For simplicity, most GP assume a zero-mean process, i.e. m( x ) = 0. While the above<br />
description may be multidimensional, most regression techniques on GP assume that the output<br />
f ( x)<br />
is unidimensional. This is a limitation in the application of the process for regression as it<br />
allows making inference solely on a single dimension, say y= f ( x),<br />
y∈° . For multidimensional<br />
inference, one may run one GP per output variable.<br />
Using (5.79) and (5.78) and assuming zero-mean distribution, the baysian regression model can<br />
be rewritten as a Gaussian process defined by:<br />
T<br />
{ ( )} φ ( ) { }<br />
E f x = x E w = 0,<br />
T T<br />
T<br />
{ } φ( ) { } φ( ) φ( ) wφ( )<br />
( ) ( ) ( )<br />
k x, x' = E f x f x' = x E ww x' = x Σ x'<br />
(5.80)<br />
We are now endowed with a probabilistic representation of our real process f. The value taken by<br />
f at any given pair of input x, x’ is jointly Gaussian with zero mean and covariance given<br />
by k( x, x ')<br />
. This means that the estimate of f can be drawn only from looking conjointly at the<br />
distribution of f across two or more input variables. In practice, to visualize the process, one may<br />
sample a set *<br />
estimates of f, such that:<br />
Where ( *, *)<br />
* M *<br />
i<br />
X of M* of data points X* { x }<br />
K X X is a M * M *<br />
i j<br />
using ( )<br />
ij ( )<br />
= and compute f* a M*-dimensional vector of<br />
i=<br />
1<br />
( ( ))<br />
f* N 0, K X*, X*<br />
: (5.81)<br />
× covariance matrx, whose elements are computed<br />
K X*, X * = k x , x , ∀ i, j = 1.... M *. Note that if M*<br />
> D, i.e. the number of<br />
datapoints exceed the dimension of the feature space, the matrix is singular as the rank of K is D.<br />
Generating such a vector is called drawing from the prior distribution of f as it uses solely<br />
information on the query datapoints themselves and the prior assumption that the underlying<br />
process if jointly Gaussian and zero mean, as given by (5.81). A better inference can be made if<br />
one can make use of prior information in terms of a set of training points. Consider the set<br />
X<br />
M<br />
i<br />
{ x }<br />
i=<br />
1<br />
= as the training datapoints, one can then express the joint distribution of the<br />
estimates f and f* associated with the training and testing points respectively as:<br />
( , ) ( *, )<br />
( ) ( )<br />
⎡⎡f<br />
⎤⎤ ⎛⎛ ⎡⎡K X X K X X ⎤⎤⎞⎞<br />
⎢⎢ N 0,<br />
f *<br />
⎥⎥ ⎜⎜ ⎢⎢<br />
⎥⎥⎟⎟<br />
⎣⎣ ⎦⎦ ⎜⎜ ⎢⎢K X, X * K X*, X * ⎥⎥⎟⎟<br />
⎝⎝ ⎣⎣<br />
⎦⎦⎠⎠<br />
: (5.82)<br />
© A.G.Billard 2004 – Last Update March 2011
111<br />
One can then use the above expression of the joint distribution over f and f* to compute the<br />
posterior distribution of f* given the training and testing sets X, X * and our prior on f<br />
: N 0, K X,<br />
X which yields:<br />
( ( ))<br />
( ) ( )<br />
−1<br />
f*| X*, X, f : N( K X*, X K X, X f,<br />
−1<br />
( ) − ( ) ( ) ( )<br />
K X*, X* K X*, X K X, X K X, X* )<br />
(5.83)<br />
One can then simply sample from this posterior distribution by evaluating the mean and<br />
covariance matrix from (5.83) and generating samples as done previously for the prior distribution<br />
on f.<br />
Figure 5-17 shows three examples of such sampling. In all three plots the shaded area<br />
represents the pointwise mean plus and plus/minus the standard deviation for each input value<br />
(corresponding to the ~97% confidence region), for the posterior distribution. We used the square<br />
exponential covariance function given by ( )<br />
1<br />
k x, x' = exp ⎛⎛<br />
⎜⎜− x−x'<br />
⎝⎝ 2<br />
2<br />
⎞⎞<br />
⎟⎟<br />
⎠⎠<br />
. We plot in light grey the<br />
area around the regression signal that corresponds to +/- one standard deviation (using the<br />
covariance given by (5.83)). This gives a measure of the uncertainty of the inference of the<br />
model. Areas with large uncertainty are due to lack of training points covering that space. From<br />
left to right, we see the effect of adding one new point (in red) in areas where previously there<br />
were no training points on decreasing locally the variance.<br />
Figure 5-17: The confidence of a Gaussian Process is dependent on the amount of data present in a specific<br />
region of space (left). Regions of low data density have lower confidence. By adding points in those regions,<br />
the confidence increases (center), but the regression function will change to adapt to the new data (right).<br />
[DEMOS\REGRESSION\GPR-CONFIDENCE.ML]<br />
The previous model assumed that the process f was noise free. However, when modeling real data, it is<br />
usual to assume some noise superposition. As in the case of the linear regression mode, we can assume<br />
that the noisy version of our non-linear regression model follows:<br />
( )<br />
( σ)<br />
y= f x + ε<br />
ε ~ N 0,<br />
Where the noise ε follows a zero mean Gaussian distribution.<br />
(5.84)<br />
© A.G.Billard 2004 – Last Update March 2011
112<br />
T<br />
In this case the covariance of the prior becomes: ( )<br />
is a matrix whose columns<br />
i<br />
x through (5.84).<br />
2<br />
( ε) ( ) σ<br />
yy = cov f X + = K X , X + I , where y<br />
i<br />
y , i=1….M, correspond to the projection of the associated training point<br />
As done previously, we can express the joint distribution of the prior y (now including noise in the estimate of<br />
prior on the training datapoints) and the testing points given through f*:<br />
2<br />
( , ) + σ I ( *, )<br />
( ) ( )<br />
⎡⎡y<br />
⎤⎤ ⎛⎛ ⎡⎡K X X K X X ⎤⎤⎞⎞<br />
⎢⎢ N 0,<br />
f *<br />
⎥⎥ ⎜⎜ ⎢⎢<br />
⎥⎥⎟⎟<br />
⎣⎣ ⎦⎦ ⎜⎜ ⎢⎢K X, X * K X*, X * ⎥⎥⎟⎟<br />
⎝⎝ ⎣⎣<br />
⎦⎦⎠⎠<br />
: (5.85)<br />
Again, one can compute the conditional distribution of f* given the pair of training datapoints X,<br />
the testing datapoints X* and the noisy prior y.<br />
( ( ))<br />
f*| X*, X, y : N f*,cov f *<br />
{ } ( ) ⎡⎡ ( )<br />
2<br />
−1<br />
f* = E f*| X*, X, y = K X*, X K X,<br />
X + σ I⎤⎤<br />
y<br />
2<br />
−1<br />
( f ) = K( X X ) − K( X X) ⎡⎡K( X X) + σ I⎤⎤<br />
K( X X )<br />
cov * *, * *, ⎣⎣ , ⎦⎦ , *<br />
⎣⎣<br />
⎦⎦<br />
(5.86)<br />
We are usually interested in computing solely the response of the model to one query point x *.<br />
In this case, the estimate of the associated output y * is given by the following:<br />
T<br />
{ } ( ) ⎡⎡ ( )<br />
2<br />
−1<br />
y*~ f* = E f*| x*, X, y = k x*, X K X,<br />
X + σ I⎤⎤<br />
y<br />
⎣⎣<br />
⎦⎦<br />
(5.87)<br />
i<br />
( ) ( )<br />
k x*, X is the vector of covariance k x*, x between the query point and the<br />
i<br />
M training data points x , i = 1... M.<br />
Since all the training pairs ( )<br />
i i<br />
x , y , i 1... M<br />
= are given, these can be treated as parameters to<br />
the system and hence the prediction on y * from Equation (5.87) can be expressed as a linear<br />
i<br />
combination of kernel functions k( x*, x ):<br />
M<br />
i<br />
{ } ∑αi<br />
( )<br />
y*~ f* = E f*| x*, X, y = k x*,<br />
x<br />
( )<br />
i=<br />
1<br />
2<br />
−1<br />
K X X σ I⎤⎤<br />
y<br />
with α = ⎡⎡<br />
⎣⎣ , +<br />
⎦⎦<br />
(5.88)<br />
We have M kernel functions for each of the M training points<br />
x i .<br />
© A.G.Billard 2004 – Last Update March 2011
113<br />
5.9.2 Equivalence of Gaussian Process Regression and Gaussian Mixture Regression<br />
The expression found in Equation (5.88) is somewhat very similar to that found for Gaussian<br />
i<br />
Mixture Regression, see Section 4.4.2 and Equation(4.28). The non-linear term k( x*, x ) is<br />
equivalent to the non-linear weights ( *)<br />
w x in Equation (4.28), whereas the parametersα<br />
i<br />
i<br />
somewhat correspond to the linear terms stemming from local PCA projections through the<br />
−<br />
i i i<br />
Cross-covariance matrices of each Gaussian in GMM (given by ( ) 1 i<br />
µ ( x µ )<br />
Equation (4.28)).<br />
+∑ ∑ − in<br />
Y YX XX X<br />
The difference between GPR and GMR lies primarily in the fact that GP uses all the datapoints to<br />
do inference, whereas GMM performs some local clustering and uses a much smaller number of<br />
points (the centers of the Gaussians) to do inference. However, the two methods may become<br />
equivalent under certain conditions.<br />
i<br />
Assume a normalized Gaussian kernel for the function k( x*, x ) and a noise free model,<br />
i.e. σ = 0 . Let us further assume that for a well chosen kernel width, ( , )<br />
j i<br />
k x x is non-zero only<br />
for data points deemed close to one another according to the metric k(.,.) and is (almost) zero for<br />
all other pairs. As a result, the matrix K is sparse. We can hence define a partitioning of the<br />
datapoints through a set of m , l= 1... m, centered on m datapoints x<br />
l<br />
l<br />
clusters ( )<br />
i i l<br />
∈ X . δ > 0<br />
is an arbitrary threshold that determines the closenest of the datapoints. How to choose the m<br />
datapoints is core to the problematic of most clustering techniques and we refer to reader to<br />
Chapter 3.1 for a discussion of these techniques.<br />
Rearranging the ordering of the datapoints so that points belonging to each cluster are located on<br />
adjacent columns and duplicating each column of datapoints for points that belong to more than<br />
one cluster one can create the following block diagonal Gram matrix:<br />
l l, i l,<br />
j<br />
where the elements Kij<br />
= k( x , x )<br />
applied on each pair of datapoints ( li , l,<br />
j<br />
, )<br />
1<br />
⎡⎡⎡⎡K%<br />
⎤⎤ 0 ............. 0⎤⎤<br />
⎢⎢⎣⎣<br />
⎦⎦<br />
⎥⎥<br />
K%<br />
= ⎢⎢...............................<br />
⎥⎥<br />
⎢⎢<br />
⎥⎥<br />
m<br />
⎢⎢0 .................. ⎡⎡<br />
⎣⎣<br />
K%<br />
⎤⎤<br />
⎣⎣<br />
⎦⎦⎥⎥⎦⎦<br />
% of the<br />
(5.89)<br />
l<br />
K % matrix are composed of the kernel function<br />
x x belonging to the associated cluster.<br />
Using properties for the inverse of a block diagonal matrix, we obtain a simplified expression for:<br />
© A.G.Billard 2004 – Last Update March 2011
114<br />
i=<br />
1<br />
1<br />
( K )<br />
−1 ⎡⎡⎡⎡ 1<br />
% ⎤⎤ 0 ............. 0<br />
⎤⎤⎡⎡y%<br />
⎤⎤<br />
⎢⎢⎢⎢⎣⎣ ⎥⎥⎦⎦ ⎥⎥⎢⎢ ⎥⎥<br />
1 ⎢⎢ .<br />
α ~ ...............................<br />
⎥⎥⎢⎢ ⎥⎥<br />
m ⎢⎢<br />
i<br />
.<br />
K%<br />
⎥⎥⎢⎢ ⎥⎥<br />
−1<br />
∏ ⎢⎢<br />
m<br />
0 .................. ⎡⎡<br />
1<br />
( K%<br />
⎤⎤⎥⎥⎢⎢ ⎥⎥<br />
) m<br />
i=<br />
⎢⎢<br />
⎣⎣<br />
⎢⎢⎣⎣<br />
⎥⎥⎦⎦<br />
⎥⎥⎢⎢ ⎦⎦⎣⎣y<br />
% ⎥⎥⎦⎦<br />
1<br />
−1<br />
l l l<br />
α = ⎡⎡K% ⎤⎤ y , l = 1... m<br />
m ⎣⎣ ⎦⎦<br />
%<br />
i<br />
K%<br />
∏<br />
(5.90)<br />
Where<br />
l<br />
l<br />
y% is composed of the output value associated to the datapoints X .<br />
For each cluster<br />
l<br />
l<br />
C , one can then compute the centroid { l l<br />
µ µ x , µ y }<br />
= of the cluster and a<br />
measure of the dispersion of the datapoints associated to this cluster around the centroid, given<br />
T<br />
{ }<br />
j l l l l<br />
by the covariance matrix<br />
xx E ( X µ x I)( X µ x I)<br />
Σ = − − of the matrix<br />
l<br />
X of datapoints<br />
l<br />
associated to the cluster. Further, for each set of datapoints X , one can use the associated set<br />
of output value<br />
T<br />
( )( ) .<br />
y% l<br />
T<br />
l l l l l<br />
nd compute the crosscovariance matrix Σ = ( %)<br />
−µ y −µ<br />
x<br />
yx<br />
y I X I<br />
If we further assume that each of local kernel Matrix is approximatively a measure of the<br />
−1 T<br />
−1<br />
l<br />
covariance, i.e. ~<br />
l l l l<br />
⎡⎡K % ⎤⎤ ⎡⎡( X −µ xI) ( X −µ<br />
xI)<br />
⎤⎤ and ( ) T<br />
l ( l l<br />
µ ) x<br />
⎣⎣ ⎦⎦ ⎢⎢⎣⎣<br />
⎥⎥⎦⎦<br />
Replacing in Equation (5.88) yields:<br />
k x*, X ~ X I x*<br />
T<br />
− .<br />
m<br />
1<br />
−1<br />
l l l<br />
f* =<br />
( *, )<br />
m ∑ ⎡⎡K% y k x X<br />
i<br />
⎣⎣<br />
⎤⎤ ⎦⎦<br />
%<br />
l=<br />
1<br />
K%<br />
∑<br />
i=<br />
1<br />
(5.91)<br />
Observe that our prediction is now a non-linear combination of m linear projections of the<br />
−1<br />
l l<br />
datapoints through % %. If the number of cluster m is composed of a single datapoint, we<br />
⎡⎡<br />
⎣⎣<br />
K ⎤⎤<br />
⎦⎦<br />
y<br />
obtain a degenerate Gaussian Mixture Model with a unitary covariance matrix for each Gaussian.<br />
Similarly when the clusters are disjoints, the prediction f * can be expressed as the product of<br />
the conditional on each cluster separately and the equivalence with GMM is immediate. In the<br />
more general case, when the clusters contain an arbitrary number of datapoints and are not<br />
disjoints, the full Gaussian Process takes into account influence from all datapoints. In a GMM the<br />
interactions across all datapoints are conveyed in part through the weighting of the effect of each<br />
Gaussian. Note also that the centers of the Gaussians are chosen so as to best balance the<br />
effect of the different datapoints through E-M.<br />
© A.G.Billard 2004 – Last Update March 2011
115<br />
5.9.3 Curse of dimensionality, choice of hyperparameters<br />
The above showed that when considering particular condition on the form of the kernel matrix for<br />
GP, GPR and GMR become equivalent. In its generic form, however, GP is not equivalent to<br />
GMM and offers a more powerful tool for inference.<br />
Unfortunately, this is done at the expense of being prohibitive in its computation steps. Indeed,<br />
Gaussian Process is a very expensive method as inference grows with the number of datapoints<br />
3<br />
with O( M )<br />
. Advances in the field investigate sparsifying techniques to decrease in a clever<br />
manner the number of training points. Unfortunately, most methods are based on some heuristics<br />
to determine which points are deemed better than others. As a result the gain of doing a full GP<br />
inference with heuristic-driven sparsification over GMM is no longer obvious.<br />
Another drawback lies in the choice of the kernel function and in particular of the kernel width.<br />
This is illustrated in Figure 5-18. Too small a kernel width may lead to poor generalization as it<br />
allows solely points very close to one another to influence inference. On the other hand too large<br />
a kernel width may smooth out local irregularities. In this respect, GMM is a more powerful tool to<br />
provide generalization outside areas not covered by the datapoints, while still encapsulating the<br />
local non-linearities. I<br />
Figure 5-18: Effect of the width of a gaussian kernel on a classification task (SVM, top) and regression<br />
(GPR, bottom). When the kernel width (gamma) is very small, the generalization becomes very poor (i.e. the<br />
system overfits the data and is unable to estimate correctly on samples that have never been seen).<br />
Choosing appropriate parameters for the kernel depends on the data and is one of the main challenges in<br />
kernel methods.<br />
[DEMOS\CLASSIFICATION\SVM-KERNEL-WIDTH.ML] [DEMOS\REGRESSION\GPR-KERNEL-WIDTH.ML]<br />
© A.G.Billard 2004 – Last Update March 2011
116<br />
5.10 Gaussian Process Classification<br />
Generative versus Discriminative Approaches<br />
To recall, there are two approaches to classification. One can either follow a so-called generative<br />
p X,<br />
Y that associates the set of<br />
approach whereby one first learns the joint distribution ( )<br />
datapoints X = { x 1 ,.... x<br />
M<br />
} to a set of labels { 1 ,..., M<br />
Y y y }<br />
= , where each class label denotes the<br />
associated class numbering. Using the joint distribution, one can then compute the conditional<br />
pY|<br />
X to predict the class label for each datapoint. Alternatively, one can follow a<br />
distribution ( )<br />
discriminative approach in which one estimates directly the conditional distribution ( | )<br />
pY X . In<br />
the previous section, we showed how to perform regression using a Gaussian Process, it seems<br />
hence intuitive to extend this to classification and to this end to take a discriminative approach.<br />
Given that there are the generative and discriminative approaches, which one<br />
should we prefer? This is perhaps the biggest question in classification, and we do<br />
not believe that there is a right answer, as both ways of writing the joint p(y, x) are<br />
correct. However, it is possible to identify some strengths and weaknesses of the<br />
two approaches. The discriminative approach is appealing in that it is directly<br />
modelling what we want, p(y|x). Also, density estimation for the class-conditional<br />
distributions is a hard problem, particularly when x is high dimensional, so if we are<br />
just interested in classification then the generative approach may mean that we are<br />
trying to solve a harder problem than we need to. However, to deal with missing<br />
input values, outliers and unlabelled data missing values points in a principled<br />
fashion it is very helpful to have access to p(x), and this can be obtained from<br />
p x = ∑ p y p x|<br />
y in the<br />
marginalizing out the class label y from the joint as ( ) ( ) ( )<br />
generative approach. A further factor in the choice of a generative or discriminative<br />
approach could also be which one is most conducive to the incorporation of any<br />
prior information which is available. (Quote from C. E. Rasmussen & C. K. I.<br />
Williams, Gaussian Processes for Machine Learning, the MIT Press, 2006.)<br />
y<br />
Linear Case<br />
As for all other kernel methods send in this class, we will first start with the linear case and then<br />
extend it to the non-linear case by exploiting the kernel trick.<br />
One problem when performing multi-class classification is to compare the predictions of each<br />
class. It would be easier if the output of the density could have a direct probabilistic interpretation.<br />
In the simply binary classification problem where the label y takes either value +1 or value -1, i.e.<br />
i i<br />
∈− [ 1; + 1 ], = 1... , a probabilistic readout of the the conditional ( | )<br />
i<br />
y i M<br />
easily by using, for instance, the logistic regressive model and compute:<br />
p y x can be obtained<br />
i<br />
i<br />
( 1| x )<br />
p y<br />
=+ =<br />
1+<br />
1<br />
i<br />
( x )<br />
By extension, the probability of the label -1 is p( y i 1| x i ) 1 p( y i 1| x<br />
i<br />
)<br />
e −<br />
T<br />
w<br />
=− = − =+ .<br />
(5.92)<br />
© A.G.Billard 2004 – Last Update March 2011
117<br />
The weight w determines the slope of the sigmoid function. This is an open parameter which<br />
should be chosen so as to ensure optimal classification, or conversely minimal penalty due<br />
misclassification. We now have all the tools to proceed to Gaussian Process classification.<br />
As in Gaussian Process Regression, we can start by putting a Gaussian prior on the distribution<br />
of the parameter w , i.e. w~ N( 0, Σ<br />
w ) and compute the log of the posterior distribution on the<br />
weight given our dataset X = { x 1 ,.... x<br />
M<br />
} with associated labels { 1 ,..., M<br />
Y y y }<br />
= :<br />
M<br />
1 T<br />
1<br />
log p( w| X, Y)<br />
=− w Σ<br />
ww+<br />
log<br />
i<br />
2<br />
i=<br />
1<br />
( x )<br />
1+<br />
e −<br />
∑ T<br />
(5.93)<br />
Unfortunately the posterior does not have an analytical solution, a contrario to the regression<br />
case. One can however observe that the posterior is concave and hence its maximum can be<br />
found using classical optimization method, such as Newton’s methods or conjugate gradient<br />
descent. Figure Figure 5-19 illustrates nicely how the original weight distribution is tilted as an<br />
effect of fitting the data.<br />
w<br />
Figure 5-19: a) Contours of the prior distribution p(w) = N(0, I). (b) dataset, with circles indicating class +1<br />
and crosses denoting class −1. (c) contours of the posterior distribution p(w|D). (d) contours of the predictive<br />
distribution p(y_=+1|x_), adapted from C. E. Rasmussen & C. K. I. Williams, Gaussian Processes for<br />
Machine Learning, the MIT Press, 2006.<br />
© A.G.Billard 2004 – Last Update March 2011
118<br />
Non-linear case<br />
The non-linear case of classification using Gaussian Process proceeds similarly to Gaussian<br />
Process Regression. Instead of putting a prior on the weight as in the linear case, we put a prior<br />
f x , such that we have<br />
on the latent function ( )<br />
1<br />
p( y =+ 1| x) = (5.94)<br />
f ( x)<br />
1 + e −<br />
This has for effect to ensure that the output is bounded between 0 and +1 and can hence be<br />
interpreted as a probability (as in the linear case), see Figure Figure 5-20<br />
Figure 5-20: Example of an arbitrary prior function f(x) (here composed of the superposition of two<br />
Gaussian). Applyinhg the sigmoid function on f(x) flattens the function, while normalizing between 0 and +1.<br />
One now can build an estimate of the class label<br />
*<br />
y for a query point<br />
*<br />
x by computing the<br />
posterior distribution of the function f ( x ) applied on our query point. If we make this a<br />
distribution that is a function of the training datapoints, we have ( )<br />
posterior distribution we want to compute is given by:<br />
( ) ( )<br />
( ) ( ( ) )<br />
p y * | x * , X, Y sigmoid f x * p f x * | x * , X,<br />
Y df<br />
*<br />
( | *<br />
, , )<br />
p f x x X Y and the<br />
= ∫<br />
(5.95)<br />
The integral on the righthandside compute all values on our prior on f ( )<br />
x . While in GPR there<br />
was an analytical solution, in the classification case, the integral is usually analytically intractable.<br />
To solve this, one must use either an analytic approximations of integrals, or solutions based on<br />
Monte Carlo sampling.<br />
© A.G.Billard 2004 – Last Update March 2011
119<br />
Figure 5-21: Example of successful classification with Gaussian Process classification, adapted from C. E.<br />
Rasmussen & C. K. I. Williams, Gaussian Processes for Machine Learning, the MIT Press, 2006.Panel a<br />
shows the location of the data points in the two-dimensional space [0, 1]. The two classes are labelled as<br />
open circles (+1) and closed circles (- 1). Panels (b)-(d) show contour plots of the predictive probability<br />
Eq[_(x_)|y] for signal variance f = 9 and length-scales ` of 0.1, 0.2 and 0.3 respectively. The decision<br />
boundaries between the two classes are shown by the thicker black lines. The maximum value attained is<br />
0.84, and the minimum is 0.19.<br />
© A.G.Billard 2004 – Last Update March 2011
120<br />
6 Artificial Neural Networks<br />
Artificial neural network (ANN) has become one of those buzzwords that is either popular or<br />
unpopular, but leaves no one indifferent. Unfortunately, for most people, the word relates only to<br />
one type of neural network, namely feed-forward neural networks. ANNs are, however, far more<br />
than this. We will see, in this chapter and the next one, different ANN architectures that greatly<br />
differ from one another, both in terms of computation they can perform as well as in their<br />
algorithms. We will see how the architecture and the learning rule determine the type of<br />
computation an ANN can perform.<br />
6.1 Applications of ANN<br />
ANNs can perform diverse types of computation. Here is a non-exhaustive list:<br />
Type of Computation<br />
Pattern recognition<br />
Associative memory<br />
PCA<br />
ICA<br />
Dimensionality Reduction<br />
Learning Time series<br />
ANNs<br />
Feed-forward ANN and Perceptron<br />
Hebbian Network, Willshaw Net, Hopfield Net<br />
Hebbian Network<br />
Anti-hebbian learning<br />
SOM, Kohonen<br />
TDNN, RNN<br />
ANNs are powerful tools that can deal with large, multidimensional, non-linear, datasets. They<br />
have found application in numerous domains, as statistical tools for data mining in finance and<br />
particle physics or as optimization tools in industrial control systems and robotics.<br />
There are two modes of functioning for an ANN:<br />
1. Activation transfer mode when activation is transmitted throughout the network.<br />
2. Learning mode when the network organizes itself, usually on the basis of the most<br />
recent activation transfer.<br />
6.2 Biological motivation<br />
ANNs were developed with the goal to mimic the highly parallel and distributed computation<br />
performed in the human brain.<br />
6.2.1 The Brain as an Information Processing System<br />
The human brain contains about 10 billion nerve cells, or neurons. On average, each neuron is<br />
connected to other neurons through about 10 000 synapses. (The actual figures vary greatly,<br />
depending on the local neuroanatomy.) The brain's network of neurons forms a massively parallel<br />
information processing system. This contrasts with conventional computers, in which a single<br />
processor executes a single series of instructions.<br />
Against this, consider the time taken for each elementary operation: neurons typically operate at<br />
a maximum rate of about 100 Hz, while a conventional CPU carries out several hundred million<br />
machine level operations per second. Despite of being built with very slow hardware, the brain<br />
has quite remarkable capabilities:<br />
© A.G.Billard 2004 – Last Update March 2011
121<br />
• its performance tends to degrade gracefully under partial damage. In contrast, most<br />
programs and engineered systems are brittle: if you remove some arbitrary parts, very<br />
likely the whole will cease to function.<br />
• it can learn (reorganize itself) from experience.<br />
• this means that partial recovery from damage is possible if healthy units can learn to take<br />
over the functions previously carried out by the damaged areas.<br />
• it performs massively parallel computations extremely efficiently. For example, complex<br />
visual perception occurs within less than 100 ms, that is, 10 processing steps!<br />
• it supports our intelligence and self-awareness. (Nobody knows yet how this occurs.)<br />
processing<br />
elements<br />
element<br />
size<br />
energy<br />
use<br />
processing<br />
speed<br />
style of<br />
computation<br />
fault<br />
tolerant<br />
learns<br />
10 14<br />
synapses<br />
10 -6 m 30 W 100 Hz<br />
parallel,<br />
distributed<br />
yes<br />
yes<br />
10 8<br />
transistors<br />
10 -6 m<br />
30 W<br />
(CPU)<br />
10 9 Hz<br />
serial,<br />
centralized<br />
no<br />
a little<br />
As a discipline of Artificial Intelligence, Neural Networks attempt to bring computers a little closer<br />
to the brain's capabilities by imitating certain aspects of information processing in the brain, in a<br />
highly simplified way.<br />
6.2.2 Neural Networks in the Brain<br />
The brain is not homogeneous. At the largest anatomical scale, we distinguish cortex, midbrain,<br />
brainstem, and cerebellum. Each of these can be hierarchically subdivided into many regions,<br />
and areas within each region, either according to the anatomical structure of the neural networks<br />
within it, or according to the function performed by them.<br />
The overall pattern of projections (bundles of neural connections) between areas is extremely<br />
complex, and only partially known. The best mapped (and largest) system in the human brain is<br />
© A.G.Billard 2004 – Last Update March 2011
122<br />
the visual system, where the first 10 or 11 processing stages have been identified. We distinguish<br />
feedforward projections that go from earlier processing stages (near the sensory input) to later<br />
ones (near the motor output), from feedback connections that go in the opposite direction.<br />
In addition to these long-range connections, neurons also link up with many thousands of their<br />
neighbours. In this way they form very dense, complex local networks.<br />
6.2.3 Neurons and Synapses<br />
The basic computational unit in the nervous system is<br />
the nerve cell, or neuron. A neuron has:<br />
• Dendrites (inputs)<br />
• Cell body<br />
• Axon (output)<br />
A neuron receives input from other neurons (typically<br />
many thousands). Once the input exceeds a critical<br />
level, the neuron discharges a spike - an electrical<br />
pulse that travels from the body, down the axon, to the<br />
next neuron(s) (or other receptors). This spiking event is also called depolarization, and is<br />
followed by a refractory period, during which the neuron is unable to fire.<br />
The axon endings (Output Zone) almost touch the dendrites or cell body of the next neuron.<br />
Transmission of an electrical signal from one neuron to the next is effected by<br />
neurotransmitters, chemicals which are released from the first neuron and which bind to<br />
receptors in the second. This link is called a synapse. The extent to which the signal from one<br />
neuron is passed on to the next depends on many factors, e.g. the amount of neurotransmittor<br />
available, the number and arrangement of receptors, amount of neurotransmittor reabsorbed, etc.<br />
6.2.4 Synaptic Learning<br />
Brains learn. From what we know of neuronal structures, one way brains learn is by altering the<br />
strengths of connections between neurons, and by adding or deleting connections between<br />
© A.G.Billard 2004 – Last Update March 2011
123<br />
neurons. Furthermore, they learn "on-line", based on experience, and typically without the benefit<br />
of a benevolent teacher.<br />
The efficacy of a synapse can change as a result of experience, providing both memory and<br />
learning through long-term potentiation. One way this happens is through release of more<br />
neurotransmitter. Many other changes may also be involved.<br />
Long-term Potentiation:<br />
An enduring (>1 hour) increase in synaptic efficacy that results from high-frequency stimulation of<br />
an afferent (input) pathway à Hebbian Learning, see Section 6.4.<br />
6.2.5 Summary<br />
The following properties of nervous systems are of particular interest in neurally-inspired models:<br />
• parallel, distributed information processing<br />
• high degree of connectivity among basic units<br />
• connections are modifiable based on experience<br />
• learning is a constant process, and usually unsupervised<br />
• learning is based only on local information<br />
• performance degrades gracefully if some units are removed<br />
© A.G.Billard 2004 – Last Update March 2011
124<br />
6.3 Perceptron<br />
The earliest neural network models go back to 1940 with the McCulloch & Pitts perceptron. The<br />
perceptron consists of a simple threshold unit taking binary inputs X = { x x }<br />
r<br />
1 ,..., n<br />
. Its output y is<br />
the product of its entries multiplied by a (1-dim) weight matrix W, modulated by a transfer function<br />
or an activity function f.<br />
n<br />
⎛⎛ ⎞⎞<br />
y= f ⎜⎜ w ⋅ x = f W⋅X<br />
⎝⎝ i=<br />
0 ⎠⎠<br />
∑ i i⎟⎟<br />
( )<br />
(6.1)<br />
where wxis the bias and is generally negative.<br />
0 0<br />
Figure 6-1: Perceptron with constant bias<br />
Classical transfer functions are:<br />
The linear function f( x)<br />
The step function<br />
= x<br />
⎧⎧1 if x ≥ 0<br />
f( x)<br />
= ⎨⎨<br />
⎩⎩0<br />
if x < 0<br />
© A.G.Billard 2004 – Last Update March 2011
125<br />
The sigmoid f x ( x)<br />
( ) = tanh ∈[ − 1,1]<br />
Or its positive form:<br />
1<br />
f( x) = ∈[0,1]<br />
Dx<br />
1+<br />
e − ⋅<br />
, where D defines the slope of the function<br />
2<br />
( )<br />
f( x)<br />
= e −ax<br />
Radial Basis Functions<br />
A radial basis function is simply a Gaussian.<br />
The sigmoid is probably the most popular activation function, as it is differentiable; this is very<br />
important once one attempts to prove the convergence of the system.<br />
Figure 6-2: The XOR problem is unsolvable using a perceptron and a sigmoid activation function (left).<br />
However, by chosing a Radial Basis Function (RBF) it is possible to obtain a working solution (right). Note<br />
that the parameter a of the RBF kernel needs to be suitably adapted to the size of the data.<br />
[DEMOS\CLASSIFICATION\MLP-XOR.ML]<br />
Exercise: Can you find suitable weights that would make the perceptron behave like an ANDgate,<br />
NOR-gate and NAND-gate?<br />
© A.G.Billard 2004 – Last Update March 2011
126<br />
6.3.1 Learning rule for the Perceptron<br />
Let<br />
{ 1<br />
,..., }<br />
( )<br />
( p) ( p<br />
p<br />
)<br />
= be the set of input patterns and<br />
X x x n<br />
set of values for the output.<br />
{ }<br />
( p) ( 1) ( P)<br />
= ,..., the associated<br />
yˆ yˆ yˆ<br />
Learning Algorithm:<br />
1. Initialize the weights to small random values w ( 0 ) ( 0 i n)<br />
and x<br />
0<br />
= 1.<br />
2. Present the next pattern<br />
n<br />
⎛⎛<br />
yt = f⎜⎜∑<br />
wi<br />
t⋅xi<br />
⎝⎝ i=<br />
0<br />
3. Calculate ( ) ( )<br />
{ 1<br />
,..., }<br />
( )<br />
( p) ( p<br />
p<br />
)<br />
X = x x n<br />
( p) 4. Adjust the weights following ( ) ( 1) η ˆ ( )<br />
( p)<br />
⎞⎞<br />
⎟⎟<br />
⎠⎠<br />
i<br />
≤ ≤ with<br />
0<br />
( p<br />
( )<br />
)<br />
( )<br />
i i i<br />
w fixed (the bias)<br />
w t = w t− + ⋅ y − y t ⋅ x t (6.2)<br />
The learning rate η modulates the speed at which the weight will vary.<br />
5. Move on to the next pattern and go back to 2.<br />
The process stops if all patterns have been learned. However, it is not clear that all patterns can<br />
be learned. The Perceptron acts as a classifier that separates data into two classes. Note that the<br />
dataset must be linearly separable for the learning to converge, see illustration in Figure 6-3.<br />
Figure 6-3: Learning in one neuron.<br />
Exercise: Which of the AND, OR and XOR gates satisfy the condition of linear separability?<br />
© A.G.Billard 2004 – Last Update March 2011
127<br />
6.3.2 Information Theory and the Neuron<br />
A good start to understand the properties of ANN is to look at those from the point of view of<br />
information theory. Linsker applied information theory to the analysis of the processing of a single<br />
neuron. He started by defining the infomax principle, which states that: the learning rule should be<br />
such that the joint information between the inputs and output of the neuron is maximal.<br />
As mentioned in the introduction, a fundamental principle of learning systems is their robustness<br />
to noise. In a single neuron model, one way to measure the neuron’s robustness to noise is to<br />
determine the joint information between its inputs and output.<br />
Let us consider a neuron with noise on the output:<br />
y ⎛⎛ ⎞⎞<br />
= ⎜⎜ w x + ν<br />
⎝⎝ ⎠⎠<br />
∑ j j⎟⎟<br />
(6.3)<br />
j<br />
Let us assume that the output, y, and the noise, ν follow a Gaussian distribution with zero-mean<br />
and variance σ and σ respectively. Let us further assume that the noise is uncorrelated with<br />
2<br />
y<br />
any of the inputs, i.e.<br />
2<br />
ν<br />
E( ν x i ) = 0 ∀ i<br />
(6.4)<br />
We can now compute the mutual information between the neuron’s input and output:<br />
( , ) ( ) ( | )<br />
where h( z ) is the entropy of z , see Section 9.3.1.<br />
I x y = h y − h y x<br />
(6.5)<br />
In other words, I(x,y) measures the information contained in the output about the input and is<br />
equal to the information in the output minus the uncertainty in the output, when knowing the value<br />
of the input.<br />
Since the neuron’s activation function is deterministic, the uncertainty on the output is solely due<br />
h y|<br />
x = h ν . Taking into account the Gaussian properties of<br />
to the noise. Hence, we have: ( ) ( )<br />
the output and the noise, we have;<br />
( , ) = ( ) − ( )<br />
I x y h y h ν<br />
=<br />
1 log<br />
2<br />
σ<br />
σ<br />
2<br />
y<br />
2<br />
v<br />
(6.6)<br />
σ<br />
σ<br />
2<br />
y<br />
2<br />
v<br />
stands for the signal/noise ratio of the neuron. Since the experimental set-up fixes the<br />
amount and variance of noise, one can modulate only the variance of the output. In order to<br />
improve the signal/noise ratio, and, thus, the amount of information, one can, thus, increase the<br />
© A.G.Billard 2004 – Last Update March 2011
128<br />
variance of the output, e.g. by increasing the weights. Note that, by doing this, you increase the<br />
unpredictability of the neuron’s output, which can have disastrous consequences in some<br />
applications.<br />
Noise on the Inputs<br />
In most applications, you will have to face noise in the input, with different type of noise<br />
depending on the input. In such a scenario, the output of a neuron would be described by the<br />
following:<br />
( )<br />
∑ j j j<br />
(6.7)<br />
j<br />
y = w x + ν<br />
One can show that the mutual information between input and output in this case becomes:<br />
2<br />
1 σ<br />
y<br />
I( x, y)<br />
= log<br />
2 ⎛⎛ ⎞⎞<br />
2<br />
σ<br />
v ⎜⎜∑<br />
wj⎟⎟<br />
⎝⎝ j ⎠⎠<br />
2<br />
(6.8)<br />
In this case, it is not sufficient to just increase the weights, since, by doing so, one will also<br />
increase the amount on the denominator. More sophisticated techniques must be used on a<br />
neuron-by-neuron basis.<br />
More than one output neuron<br />
Imagine a two input-output scenario in which the two outputs attempt to jointly convey as much<br />
information as possible on the two inputs. In this case, each output’s neuron’s activation is given<br />
by:<br />
( )<br />
∑ (6.9)<br />
y = w x + ν<br />
i ij j i<br />
j<br />
Similarly to the 1-output case, we can assume that the noise terms are uncorrelated and<br />
Gaussian and we can write:<br />
2<br />
( ν) = ( ν1, ν2) = ( ν1) + ( ν2) = 1+<br />
2log( 2πσ<br />
)<br />
h h h h<br />
ν<br />
Since the output neurons are both dependent on the same two inputs, they are correlated. One<br />
can calculate the correlation matrix R as:<br />
T<br />
⎛⎛y1 ⎞⎞ ⎛⎛r11 r12<br />
⎞⎞<br />
R= E( yy ) = ⎜⎜ ⎟⎟( y1 y2)<br />
= ⎜⎜ ⎟⎟<br />
y r r<br />
⎝⎝ 2⎠⎠ ⎝⎝ 21 22⎠⎠<br />
(6.10)<br />
One can show that the mutual information is equal to<br />
© A.G.Billard 2004 – Last Update March 2011
129<br />
( R)<br />
⎛⎛det<br />
⎞⎞<br />
I( x, y)<br />
= log⎜⎜ 2 ⎟⎟<br />
⎝⎝ σ ν ⎠⎠<br />
(6.11)<br />
2<br />
Again, the variance of the noise σ<br />
ν<br />
is fixed and, so, to maximize mutual information, we must<br />
maximize<br />
4 2 2 2 2 2 2<br />
( R) = r11r22 − r12r21 = σν + σν<br />
( σ1 + σ2 ) + σ1 σ2 ( − ρ12<br />
)<br />
det 2 1<br />
σ 2<br />
, i = 1,2<br />
1 is the variance of each output neuron in the absence of noise and 12<br />
correlation coefficient of the output signals also in absence of noise.<br />
One can thus consider the two following situations:<br />
ρ is the<br />
Large noise variance :<br />
If σ is large, one can ignore the 3 rd term of the equation. It remains, thus, to maximize the sum<br />
ν<br />
2 2<br />
( σ1 σ2)<br />
+ , which can be done by maximizing the variance of either neuron independently.<br />
Low noise variance:<br />
If, on the contrary, the variance is very small, the 3 rd term becomes more important than the two<br />
first ones. In that case, one must find a tradeoff between maximizing the variance on each output<br />
neuron while keeping the correlation factor sufficiently small.<br />
In other words, in a low noise situation, it is best to use a network in which each neuron’s output<br />
is de-correlated from one another, i.e. where each output neuron conveys a different information<br />
about the inputs; while in a high noise situation, it is best to have a high redundancy in the output.<br />
This way one gives more chances for the information conveyed in the input to be appropriately<br />
transferred to the output.<br />
6.4 The Backpropagation Learning Rule<br />
In Section 6.3.1, we have seen the perceptron learning rule. Here, we will see a general<br />
supervised learning rule for a multi-layer perceptron neural network, called Backpropagation.<br />
Backpropagation is part of objective functions, a class of functions that minimize an error as the<br />
criterion for optimization. Such functions are said to perform a gradient descent type of<br />
optimization, see Section 9.4.1.<br />
Error descent methods are usually associated with supervised learning methods, in which we<br />
must provide the network with a set of example data and the answer we expect the network to<br />
give is presented together with the data.<br />
© A.G.Billard 2004 – Last Update March 2011
130<br />
6.4.1 The Adaline<br />
The Adaline is a simple one-layer feed-forward neural network, composed of perceptron units.<br />
Figure 6-4: one-layer neural network<br />
p<br />
Let P input patterns X , p 1,..., P<br />
= be the patterns you want to train the network with.<br />
p<br />
real output of the network when presented with each X , and<br />
network. One can compute an error measure over all patterns:<br />
1<br />
E = E = z −y<br />
2<br />
p<br />
y is the<br />
p<br />
z the desired output for the<br />
P<br />
P<br />
p p p<br />
∑ ∑ ( ) 2<br />
(6.12)<br />
p= 1 p=<br />
1<br />
In order to minimize the error, one can determine the gradient of the error with respect to the<br />
weights and move the weights in opposite direction.<br />
E<br />
Δ wj<br />
=−γ ∂<br />
(6.13)<br />
∂ w<br />
j<br />
Figure 6-5: A schematic diagram showing the principle of error descent.<br />
If the gradient is positive, changing the weights in a positive direction would increase the error.<br />
Therefore, we change the weights in a negative direction. Conversely, if the gradient is negative,<br />
one must change the weight in a positive direction to decrease the error.<br />
© A.G.Billard 2004 – Last Update March 2011
131<br />
y= ∑ w x ) of<br />
Because of the linearity of the activation function of the Perceptron neuron (i.e.<br />
j j<br />
j<br />
the Adaline network, we have:<br />
∂E<br />
∂y<br />
∂y<br />
∂w<br />
p<br />
p<br />
p<br />
j<br />
= x<br />
p<br />
j<br />
p p<br />
( z y )<br />
=− −<br />
(6.14)<br />
(6.15)<br />
( )<br />
p p p<br />
Δ<br />
pwj<br />
= γ z −y ⋅ x<br />
(6.16)<br />
This has proven to be a most powerful rule and is at the core of almost all current supervised<br />
learning methods for ANN. But, it should be emphasized that nothing we have written guarantees<br />
that the method will cause the weight to converge. It can be proved that the method will give an<br />
optimal (in a least square error sense) approximation of the function being modeled. However,<br />
the method does not ensure convergence to a global optimum.<br />
6.4.2 The Backpropagation Network<br />
An example of multi-layered Perceptron, or feed-forward neural network, is shown in Figure 6-6<br />
Activity in the network is propagated forwards via a first set of weights from the input layer to the<br />
hidden layer, and, then, via a second set of weights from hidden layer to output layer. The error is<br />
calculated by Equation (6.12), similarly to what was done for the Adaline network. Now two sets<br />
of weights must be calculated.<br />
Here, however, one does not have access to the desired output of the hidden units. This is<br />
referred to, as the Credit assignment problem – in that we must assign how much effect each<br />
weight in the first layer of weights has on the final output of the network. In order to compute the<br />
weight change, we need to propagate backwards, to backpropagate, the error across the two<br />
layers. The algorithm is quite general and applies to any number of hidden layers.<br />
An example of multilayered perceptron is shown in<br />
Figure 6-6: Multi-layered feed-forward NN<br />
© A.G.Billard 2004 – Last Update March 2011
132<br />
Figure 6-7: A difficult classification problem using a multi-layered feed-forward NN with increasing numbers<br />
of neurons in the hidden layer. 3 neurons are sufficient to solve this problem.<br />
[DEMOS\CLASSIFICATION\MLP-NEURONS.ML]<br />
6.4.3 The Backpropagation Algorithm<br />
1. Initialize the weights to small random numbers<br />
p<br />
2. Present an input patter X to the network<br />
3. Compute<br />
⎛⎛ ⎞⎞<br />
p<br />
1<br />
ai = f ⎜⎜∑<br />
wijxj<br />
⎟⎟<br />
⎝⎝ j ⎠⎠<br />
and<br />
⎛⎛ ⎞⎞<br />
p<br />
2<br />
y = f ⎜⎜ wijaj<br />
⎟⎟<br />
⎝⎝ j ⎠⎠<br />
∑ the outputs of the<br />
hidden and output units respectively, where f is the activation function<br />
1 2<br />
(usually the sigmoid), and w ,<br />
ij<br />
w are the weights from 1 st layer, input to<br />
ij<br />
hidden units, and 2 nd layer, from hidden units to output units, respectively.<br />
4. Compute the error, according to (6.12)<br />
5. Compute the gradient of the error along each weight direction<br />
second layer.<br />
6. Compute the gradient of the error<br />
where<br />
s<br />
1 p<br />
i ij j<br />
j<br />
error to compute<br />
∂E<br />
∂E<br />
∂s<br />
∂w ∂s ∂w<br />
p p<br />
i<br />
=<br />
1 1<br />
ij i ij<br />
∂E<br />
∂w<br />
p<br />
2<br />
ij<br />
for the<br />
along the hidden units,<br />
= ∑ w x . In order to do this, you need to backpropagate the<br />
∂E<br />
∂s<br />
7. Update all weights according to (6.16)<br />
i<br />
p<br />
.<br />
8. Repeat all steps from 2 for all patterns and until the network has converged<br />
(reached a minimal error).<br />
Exercise: Show that a 1-layer feed-forward NN can be used to compute the XOR problem.<br />
© A.G.Billard 2004 – Last Update March 2011
133<br />
6.5 Willshaw net<br />
David Willshaw developed one of the simplest associative memory in 1967.<br />
Figure 6-8: The Willshaw Network - Learning phase<br />
The update rule follows:<br />
⎧⎧1 if h = 1<br />
Δ wij = δ( xi ⋅ yi<br />
) δ( h)<br />
=⎨⎨ (6.17)<br />
⎩⎩ 0 otherwise<br />
The retrieval rule follows:<br />
⎛⎛<br />
⎞⎞<br />
⎧⎧1 if h ≥ 0<br />
yj = ϑ⎜⎜<br />
wij ⋅xi<br />
− w w = h =⎨⎨<br />
⎝⎝ i ⎠⎠ ⎩⎩0 otherwise<br />
∑ 0⎟⎟<br />
0<br />
1 ϑ( )<br />
(6.18)<br />
Such a network suffers from two major drawbacks: the memory quickly fills up; the network<br />
cannot learn patterns with overlapping inputs.<br />
One can show that the total number of patterns that can be stored in such a network is:<br />
⎛⎛ MIN MOUT<br />
ρ = 1−⎜⎜1− ⋅<br />
⎝⎝ NIN<br />
NOUT<br />
⎞⎞<br />
⎟⎟<br />
⎠⎠<br />
(6.19)<br />
with N<br />
IN<br />
input lines , M<br />
IN<br />
the nm of input bits set to 1, NOUT<br />
output lines<br />
M the nm of output bits set to 1.<br />
OUT<br />
and<br />
A more generic learning rule for such associative net is the Hebbian rule, which we will see next.<br />
© A.G.Billard 2004 – Last Update March 2011
134<br />
6.6 Hebbian Learning<br />
Hebbian learning is the core of unsupervised learning techniques in neural networks. It takes its<br />
name from the original postulate of the neurobiologist Donald Hebb (Hebb, 1949) stating that:<br />
When an axon of cell A is near enough to excite a cell B and repeatedly or persistently takes<br />
part in firing it, some growth process or metabolic change takes place in one or both cells<br />
such that A’s efficiency, as one of the cells firing B, is increased.<br />
The Hebbian learning rule lets the weights across two units grow as a function of the coactivation<br />
of the input and output units. If we consider the classical perceptron with no noise:<br />
y<br />
( w x )<br />
= ∑ (6.20)<br />
i ij j<br />
j<br />
Then, the weights increase following:<br />
Δ w = α ⋅x ⋅ y<br />
(6.21)<br />
ji j i<br />
α is the learning rate and is usually comprised between [ 0,1 ]. It determines the speed at which<br />
the weights grow. If x and y are binary inputs, the weights increase only when both x and y are 1.<br />
Note that, in the discrete case, the co-activation must be simultaneous. This is often too strong a<br />
constraint in a real-time system which displays large variation in the temporality of concurrent<br />
events.<br />
A continuous time neural network would best represent such a system. In the continuous case,<br />
we would have:<br />
( ) α ( ) ( ) ( )<br />
∂ w t = t ⋅x t ⋅ y t<br />
ji j i<br />
t2<br />
( ) α ( ) ( ) ( )<br />
∫<br />
Δ w t = t ⋅x t ⋅y t dt<br />
ji<br />
t<br />
j i<br />
1<br />
which corresponds to the area of superposed coactivation of the two neurons in the time interval<br />
[t 1 t 2 ] .<br />
One can show that<br />
Δw<br />
ij<br />
= ∑ wxx and in the limit<br />
ik k j<br />
t 0<br />
Δt<br />
k<br />
d W t<br />
dt<br />
( ) C W ( t )<br />
Δ ⎯⎯⎯⎯→ is equivalent to<br />
∝ ⋅ (6.22)<br />
where C<br />
ij<br />
is the correlation coefficient calculated over all input patterns between the i th and j th<br />
term of the inputs and W(t) is the matrix of weights at time t.<br />
The major drawback of the Hebbian learning rule, as stated in Equation (6.21), is that weights<br />
grow continuously and without bounds. This can quickly get out of hand. If learning is to be<br />
continuous, the values taken by the weights can quickly go over the floating-point margin of your<br />
system. We will next review two major ways of limiting the growth of the weights.<br />
© A.G.Billard 2004 – Last Update March 2011
135<br />
6.6.1 Weights bounds<br />
One of the easiest way to bound weights is to fix a margin for the weights after which they are no<br />
longer incremented, see Figure 6-9. This has the effect of stopping the learning once the upper<br />
bound is reached. Another option is to renormalize the weights whenever they reach the upper<br />
bound, i.e.<br />
If<br />
wij<br />
= w , then w<br />
max<br />
ij<br />
wij<br />
= ∀ i,<br />
j<br />
w<br />
max<br />
Such a renormalization would give more importance to events occurring after the normalization,<br />
unless one rescales the increment factorα by the same amount, i.e.<br />
1<br />
w .<br />
max<br />
Figure 6-9: Weight clipping<br />
This, however, will quickly lead the network to reach the limit of its floating point encoding for α .<br />
Another option is to renormalize at each time step, while conserving the length of the complete<br />
weight vector. The algorithm is performed in two steps:<br />
w = w +Δw<br />
w<br />
j j j<br />
j<br />
=<br />
w<br />
w<br />
j<br />
j<br />
This has the advantage to preserve one of the directions along which the weight matrix codes.<br />
However, it makes the whole computation heavier. Moreover, it has a tendency of not conserving<br />
the relative importance across weight vectors.<br />
Figure 6-10: Weight renormalization<br />
© A.G.Billard 2004 – Last Update March 2011
136<br />
6.6.2 Weight decay<br />
A more interesting option is to prune weights that seem to have little influence on the network<br />
operation. This is an operation that requires global knowledge of all the weights in the network,<br />
and, thus, is less supported biologically. The idea is that no single weight should grow too large,<br />
while keeping the total weight connections into a particular output neuron fairly constant. One of<br />
the simplest rule for weight decay was developed by Grossberg in 1968 and was of the form:<br />
dw<br />
dt<br />
ij<br />
= α yx − w<br />
(6.23)<br />
i j ij<br />
dw ij<br />
It is clear that the weights will be stable when 0<br />
dt<br />
= at the points where wij = αE( xi yj<br />
)<br />
One can show that, at stability, we must have α Cw = w and, thus, that w must be an<br />
eigenvector of the correlation matrix C.<br />
We will next consider two more sophisticated learning equations, which use weight decay.<br />
The instar rule where the decay term is gated by the input term<br />
In the discrete case, we have:<br />
dw<br />
dt<br />
ij<br />
{ }<br />
i ij j<br />
x<br />
j<br />
:<br />
= α y − w x<br />
(6.24)<br />
Δ w = α⋅x ⋅y −γ<br />
⋅w ⋅ y<br />
(6.25)<br />
ij i j ij j<br />
( )<br />
α = γ ⇒ Δ w = α⋅y ⋅ x − w<br />
(6.26)<br />
ij i i ij<br />
( )<br />
y = 1 ⇒ Δ w = α ⋅ x −w<br />
i ij i ij<br />
( ) (1 α) ( 1) α ( )<br />
⇒ w t = − ⋅w t− + ⋅x t<br />
ij ij i<br />
(6.27)<br />
The weight moves in the direction of the input.<br />
© A.G.Billard 2004 – Last Update March 2011
137<br />
Figure 6-11: The weight vector moves toward the input vector<br />
The outstar rule, where the decay term is gated by the output term<br />
y<br />
i<br />
.<br />
dw<br />
dt<br />
ij<br />
{ }<br />
= α x − w y<br />
(6.28)<br />
j ij i<br />
In the discrete case, we have:<br />
( )<br />
Δ w = α ⋅x ⋅ y − w<br />
(6.29)<br />
ij i i ij<br />
( )<br />
y = 1 ⇒ Δ w = α ⋅ y −w<br />
i ij j ij<br />
( ) (1 α) ( 1)<br />
⇒ w t = − ⋅w t− + α⋅y<br />
ij ij j<br />
(6.30)<br />
In this case, the weight vector moves toward the output vector.<br />
6.6.3 Principal Components<br />
Let us consider again the activation function of the Perceptron and rewrite as follows:<br />
where<br />
i<br />
r r<br />
y = w x = w ⋅x<br />
∑<br />
i ij j<br />
i<br />
w r is the weight vector along i and x r the input vector. We have:<br />
whereθ is the angle across the two vector.<br />
r r r r<br />
w ⋅ x=<br />
w x cos θ<br />
i<br />
i<br />
This quantity is maximal when the angle θ is zero, i.e. when the two vectors are aligned. Thus, if<br />
the weight converge towards the principal components of the input space (i.e. w r is the 1 st<br />
1<br />
eigenvector, w r the second, etc), then the first output vector y<br />
2<br />
1<br />
will transmit maximally the input<br />
information along the direction with largest variance. In other words, if we define a learning rule,<br />
such that it projects the weights along the principal components of the input space, such a<br />
network would in effect produce a PCA analysis.<br />
i<br />
( )<br />
© A.G.Billard 2004 – Last Update March 2011
138<br />
There are two major advantages of using an ANN to process PCA as opposed to follow the<br />
algorithm given in Section 2.1.5. It allows on-line as well as long-life learning Classical PCA<br />
requires having at hand a sample of data point and runs in batch mode. ANNs can be run on-line.<br />
They will discover the PCA components as data are fed onto them. This provides more flexibility<br />
towards the data.<br />
Let us now show that the classical Hebbian rule converges to the principal components of the<br />
input vector:<br />
Recall that<br />
i i<br />
Δ w<br />
r =α yx<br />
r and that y = w rr T x. Thus, we have:<br />
i<br />
i<br />
Δ w r = α⋅y⋅ x r = α⋅ w r ⋅x r ⋅x<br />
r<br />
T<br />
( )<br />
(6.31)<br />
T<br />
Δ w r = α⋅ w r x r ⋅cos( θ)<br />
⋅x<br />
r<br />
where θ is the angle between the weight vector and the input vector.<br />
The weight vector moves proportionally to the distance across the weight vector and the input<br />
vector: the bigger the distance, the bigger the move. Hebbian learning will, thus, minimize the<br />
angle. If the data has zero mean, Hebbian learning will adjust the weight vector w r so as to<br />
maximize the variance in the output y . In other words, when projected onto this direction given<br />
by w r , the data will exhibit variance greater than in any other direction. This direction is, thus, the<br />
largest principal component of the data and corresponds to the eigenvector of the correlation<br />
matrix C with the largest corresponding eigenvalue.<br />
If we decompose the current w r in terms of the eigenvectors of C,<br />
expected weight update rule becomes:<br />
r r<br />
Δ w= α ⋅C⋅w<br />
= α ⋅ ⋅<br />
= α⋅<br />
C ae<br />
i i<br />
i<br />
∑<br />
i<br />
∑<br />
r<br />
aλe<br />
i i i<br />
r<br />
r<br />
w= ∑ae<br />
i i<br />
i<br />
, then the<br />
This will move the weight vector w r towards eigenvector e r i<br />
by a factor proportional to aiλ . Over<br />
i<br />
many updates, the eigenvector with the largest λi<br />
will drown out the contributions from the others.<br />
© A.G.Billard 2004 – Last Update March 2011
139<br />
6.6.4 Oja’s one Neuron Model<br />
In the 1980’s Oja proposed a model that extracts the largest principal components from the input<br />
data. The model uses a single output neuron with the classical activation rule:<br />
Oja’s variation of the Hebbian rule is as follows:<br />
y = ∑ wx<br />
(6.32)<br />
i<br />
i<br />
2<br />
( )<br />
i i i<br />
i<br />
Δ w = α x y− y w<br />
(6.33)<br />
2<br />
Note that this rule is defined by a multiplicative constraint of the form y γ ( w)<br />
= and so will<br />
converge to the principal eigenvector of the input covariance matrix. The weight decay term has<br />
the simultaneous effect of making ∑ ( w ) 2<br />
i<br />
tend towards 1, i.e. the weights are normalized.<br />
i<br />
This rule will allow the network to find only the first eigenvector. In order to determine the other<br />
principal components, one must let the neurons interact with one another.<br />
6.6.5 Convergence of the Weights Decay rule<br />
The Hebbian rule with decay solves the problem of large weights. It eliminates very small and<br />
irregular noise. However, it does so at a price. The environment must continuously present all<br />
stimuli that have associations. Without reinforcement, associations will decay away. Moreover, it<br />
takes longer to eliminate the effect of noise.<br />
As mentioned earlier on, an important and distinctive function of the Hebbian learning rule is its<br />
stability. Work by Miller & MacKay made an important contribution in showing the convergence of<br />
the Hebbian learning rule with weight decay.<br />
Let us consider the continuous time dependent learning rule with weight decay.<br />
© A.G.Billard 2004 – Last Update March 2011
140<br />
where g is an arbitrary function dependent on the weight w.<br />
One can consider two cases:<br />
1) Multiplicative constraints<br />
d wt ( ) = Cwt ( ) − g ( wt ( ))<br />
(6.34)<br />
dt<br />
( ( )) γ ( )<br />
( ) ( )<br />
g w t = w t ⋅ w t<br />
(6.35)<br />
where the decay term is multiplied by the weight. In this case, the decay term can<br />
be viewed as a feedback term, which limits the rate of growth of each weight.<br />
The bigger the weight, the bigger the decay.<br />
2) Substractive constraint<br />
d wt ( ) = Cwt ( ) − γ ( wt ( )) wt ( )<br />
(6.36)<br />
dt<br />
where the weight decay is proportional to the weight and multiplies the weight.<br />
6.7 Anti-Hebbian learning<br />
If inputs to a neural network are correlated, then each contains information about the other. In<br />
I x; y > 0.<br />
other words, there is redundancy in the information conveyed by the input and ( )<br />
Anti-Hebbian learning is designed to decorrelate inputs. The ultimate goal is to maximize the<br />
information that can be processed by the network. The less redundancy, the more information<br />
and the less number of output nodes required for transferring this information.<br />
Anti-Hebbian learning is also known as lateral inhibition, as the anti-learning occurs within<br />
members of the same layer. The basic model is defined by:<br />
Δ w =− α < y ⋅ y > (6.37)<br />
ij i j<br />
where the angle brackets indicate the ensemble average of values taken over all training<br />
patterns. Note that this is a tremendous limitation of the system, as it forces global and off-line<br />
learning.<br />
© A.G.Billard 2004 – Last Update March 2011
141<br />
If<br />
y<br />
i<br />
and<br />
y are highly correlated, then, the weights between them will grow to a large negative<br />
j<br />
value and each will tend to turn the other off. Indeed, we have:<br />
( Δwij →0 ) ⇒ ( < yi , yj<br />
> → 0)<br />
The weight change stops when the two outputs are decorrelated. At this stage, the algorithm<br />
converges. Note that there is no need for weight decay or renormalizing on anti-Hebbian weights,<br />
as they are automatically self-limiting.<br />
6.7.1 Foldiak’s models<br />
Foldiak has suggested several models combining anti-Hebbian learning and weight decay. Here,<br />
we will consider the first 2 models as examples of solely anti-Hebbian learning. The first model is<br />
shown in Figure 6-12 and has anti-Hebbian connections between the output neurons.<br />
Figure 6-12: Foldiak's 1st model<br />
The equations, which define its dynamical behavior, are<br />
with learning rule<br />
y x w y<br />
i i ij j<br />
j=<br />
1<br />
n<br />
= +∑ (6.38)<br />
Δ w =−α<br />
⋅y ⋅y for i≠ j<br />
(6.39)<br />
ij i j<br />
In matrix terms, we have<br />
And so,<br />
y= x+ W⋅y<br />
( ) −1<br />
y= I −W ⋅x<br />
(6.40)<br />
Therefore, we can view the system as a transformation, T, from the input vector x to the output<br />
y given by:<br />
( ) 1<br />
−<br />
y= T⋅ x= I−W ⋅ x<br />
(6.41)<br />
Now, the matrix W must be symmetric. It has only non-zero non-diagonal terms, i.e. if we<br />
consider only a two input, two output net as in the diagram.<br />
W<br />
⎛⎛0<br />
w⎞⎞<br />
= ⎜⎜ ⎟⎟<br />
⎝⎝ w 0⎠⎠<br />
© A.G.Billard 2004 – Last Update March 2011
142<br />
so that T is given by:<br />
−<br />
( ) 1 ⎛⎛1 - w⎞⎞ 1 ⎛⎛1<br />
w⎞⎞<br />
T = I − W = ⎜⎜ ⎟⎟=<br />
2 ⎜⎜ ⎟⎟<br />
⎝⎝- w 1 ⎠⎠ 1−<br />
w ⎝⎝w<br />
1 ⎠⎠<br />
(6.42)<br />
Now, let the two dimensional input vector have correlation matrix<br />
C xx<br />
2<br />
⎛⎛ σ1 ρσ1σ<br />
⎞⎞<br />
2<br />
= ⎜⎜<br />
⎜⎜<br />
⎟⎟<br />
2<br />
ρσ1σ<br />
2<br />
σ ⎟⎟<br />
⎝⎝<br />
2 ⎠⎠<br />
where ρ is the correlation coefficient and σ1,<br />
σ<br />
2<br />
the variance of the elements of x. Now the<br />
correlation matrix for y can be calculated. Since y= T⋅ x , we have:<br />
Then,<br />
yy<br />
T<br />
T<br />
{ } xx<br />
.<br />
T<br />
{ } ( )<br />
C = E yy = E T⋅x⋅ T⋅ x = T⋅C ⋅ T<br />
C<br />
yy<br />
=<br />
1<br />
2<br />
( w −1)<br />
⎛⎛<br />
⎜⎜<br />
⎜⎜<br />
⎝⎝<br />
( ) ( )<br />
2 2 2 2 2 2<br />
σ1 + 2 wρσσ 1 2<br />
+ wσ2 ρσσ<br />
1 2<br />
w + 1 + σ1 + σ2<br />
w⎞⎞<br />
⎟⎟<br />
( ) ( )<br />
⎟⎟<br />
⎠⎠<br />
2 2 2 2 2 2 2<br />
ρσ1σ 2<br />
w + 1 + σ1 + σ<br />
2<br />
w σ<br />
2<br />
+ 2wρσ1σ 2<br />
+ wσ1<br />
(6.43)<br />
The anti-Hebbs rule reaches equilibrium when the units are decorrelated and so the terms<br />
w<br />
12<br />
w21 0<br />
sove).<br />
= = . Notice that this gives us a quadratic equation in w (which naturally we can<br />
Let us consider the special case that the elements of x have the same variance so that<br />
= = . Then, the cross correlation terms become ( w 1) ( 2 )<br />
σ σ σ<br />
1 2<br />
we must solve the quadratic equation:<br />
ρw<br />
2<br />
ρσ 2 2 + + σ 2 w+ ρσ<br />
2 and so<br />
+ 2w+ ρ = 0<br />
(6.44)<br />
which has a zero at<br />
w f<br />
2<br />
− 1+<br />
1−ρ<br />
= (6.45)<br />
ρ<br />
One can further show that this is a stable point in the weight space.<br />
© A.G.Billard 2004 – Last Update March 2011
143<br />
Foldiak’s second model allows all neurons to receive their own outputs with weight 1.<br />
( 1 y y )<br />
Δ w = α − (6.46)<br />
ii i i<br />
which can be written in matrix form as<br />
T<br />
( )<br />
Δ W = α I− YY<br />
(6.47)<br />
where I is the identity matrix.<br />
This network will converge when the outputs are decorrelated (due to the off-diagonal anti-<br />
Hebbian learning) and when the expected variance of the outputs is equal to 1. i.e. this learning<br />
rule forces each network output to take responsibility for the same amount of information since<br />
the entropy of each output is the same.<br />
This is generalizable to<br />
( y y )<br />
Δ w = αθ− (6.48)<br />
ij ij i j<br />
Where<br />
θ<br />
ij<br />
= 0 for i ≠ j. The value of θ<br />
ii<br />
for all i , will determine the variance on that output<br />
and so we can manage the information output of each neuron.<br />
6.7.2 CCA Revisited<br />
Adapted from Peiling Lai and Colin Fyfe, Kernel and Nonlinear Canonical Correlation Analysis, Computing and<br />
Information Systems, 7 (2000) p. 43-49.<br />
The Canonical Correlation Network<br />
Figure 1 The CCA Network. By adjusting weights, w 1 and w 2 , we maximize correlation<br />
between y 1 and y 2 .<br />
Let us consider CCA in artificial neural network terms. The input data comprises two vectors x 1 and<br />
x 2 . Activation is fed forward from each input to the corresponding output through the respective<br />
weights, w 1 and w 2 (see Figure 1 and equations (1) and (2)) to give outputs y 1 and y 2 .<br />
One can derive an objective function for the maximization of this correlation under the constraint<br />
that the variance of y 1 and y 2 should be 1 as:<br />
© A.G.Billard 2004 – Last Update March 2011
144<br />
= 1 2 1<br />
2<br />
{( ) + (1 ) (1 )}<br />
1 2 1 1 2<br />
2λ<br />
− + 2λ<br />
− (6.49)<br />
2<br />
J E yy y y<br />
where the constraints have been implemented using Lagrange multipliers, λ 1 and λ 2 . Using gradient<br />
ascent with respect to w i and gradient descent with respect to λ i gives the learning rules:<br />
j( −λ<br />
)<br />
2<br />
( ( y ) )<br />
j( −λ<br />
)<br />
2<br />
( ( y ) )<br />
Δw ~ x y y<br />
1j<br />
1 2 1 1<br />
Δλ<br />
~ − 1−<br />
1 1<br />
Δw ~ x y y<br />
2j<br />
2 1 2 2<br />
Δλ<br />
~ − 1−<br />
2 2<br />
(6.50)<br />
where w 1j is the j th element of weight vector w 1 etc.<br />
However, just as a neural implementation of Principal Component Analysis (PCA) may be very<br />
interesting but not a generally useful method of finding Principal Components, so a neural<br />
implementation of CCA may be only a curiosity. It becomes interesting only in the light of performing<br />
nonlinear CCA, which is described next.<br />
6.7.2.1 Non-linear Canonical Correlation Analysis<br />
To determine whether a neural network as described in the previous section can extract nonlinear<br />
correlations between two data sets, x 1 and x 2 , and further to test whether such correlations are<br />
greater than the maximum linear correlations, one must introduce a nonlinearity term to the<br />
network. This takes the usual form of a tanh() function, which we also find in classical approach to<br />
non-linear ANN approximation (e.g. as in feedforward NN with backpropagation).<br />
The outputs y 1 and y 2 of the network become:<br />
y<br />
y<br />
∑<br />
( )<br />
= w tanh v x = w<br />
1 1j 1j 1j<br />
1 1<br />
j<br />
∑<br />
( )<br />
= w tanh v x = w<br />
2 2j 2j 2j<br />
2 2<br />
j<br />
To maximise the correlation between y 1 and y 2 , we again use the objective function<br />
whose derivatives give us<br />
1 2 1<br />
2<br />
= E{( yy) + (1 − y) + (1 − y)}<br />
2 2<br />
J λ λ<br />
1 1 2 1 1 2 2<br />
f<br />
f<br />
© A.G.Billard 2004 – Last Update March 2011
145<br />
∂<br />
∂<br />
J 1<br />
= fy −<br />
1 2 λ 1yf<br />
1 1<br />
w1<br />
f ( y 1y<br />
)<br />
1 2 λ 1<br />
J 1<br />
w y f x w f x y<br />
v1<br />
= −<br />
∂<br />
∂<br />
w<br />
2 2<br />
= ( 1− ) −λ<br />
( 1−<br />
)<br />
2<br />
( 1 f ) ( y y )<br />
1 x 2 λ 1<br />
1 2 1 1 1 1 1 1 1<br />
= − −<br />
1 1 1<br />
(6.51)<br />
where in this last equation, all the vector multiplications are to be understood as being on an<br />
element by element basis. Similarly with w 2 , v 2 , and λ 2 . This gives us a method for changing the<br />
weights and the Lagrange multipliers on an online basis. This leads to the joint learning rules:<br />
w<br />
v<br />
( )<br />
f y λ y<br />
Δ = η −<br />
1 1 2 1 1<br />
x w<br />
1i 1i 1i<br />
1<br />
2<br />
( y2 λ y1)( 1 f<br />
1)<br />
Δ = η − −<br />
(6.52)<br />
and similarly with the second set of weights.<br />
6.7.3 ICA Revisited<br />
An important aspect of anti-Hebbian learning is its ability to decorrelate inputs. As discussed in<br />
Chapter 2.1.5, decorrelating the dataset if often too soft a constraint, and, it is often more<br />
desirable to find independent components of the dataset, so as to reduce maximally its<br />
dimensionaly, and, in the case of ANN, so as to maximize the information transmitted by the<br />
network.<br />
Jutten and Herault proposed a neural network architecture, based on anti-Hebbian learning, that<br />
can perform Independent Component Analysis. The activation function is as follows:<br />
Which is equivalent to:<br />
i i ij j<br />
j=<br />
1<br />
n<br />
y x w y<br />
= −∑ (6.53)<br />
y= x− Wy<br />
(6.54)<br />
( ) 1<br />
−<br />
y= I+ W x<br />
(6.55)<br />
While this is similar to the Foldiak’s model, a crucial difference lies in the non-linearity of the<br />
learning rule, defined as follows:<br />
( ) ( ) for<br />
Δ w =−α<br />
f y g y i≠ j<br />
(6.56)<br />
ij i j<br />
© A.G.Billard 2004 – Last Update March 2011
146<br />
Notice that, if we use the identity function for f and g, we find again the classical Hebbian rule.<br />
Recall that, if the two variables are uncorrelated, we have { 1 2}<br />
independent we have E( f ( y ) f ( y )) E( f ( y )) E( f ( y ))<br />
1 2 1 2<br />
E y , y = 0, and that if they are<br />
= for any given function f. The<br />
network must, thus, converge to a solution that satisfies the later condition.<br />
Figure 6-13: ICA with anti-Hebbian learning applied to two images that have been mixed together. After a<br />
number of iterations the network converges to a correct separation of the two source images.<br />
[DEMOS\ICA\ICA_IMAGE_MIX.M]<br />
© A.G.Billard 2004 – Last Update March 2011
147<br />
6.8 The Self-Organizing Map (SOM)<br />
The SOM is an algorithm used to visualize and interpret large high-dimensional data sets. Typical<br />
applications are visualization of process states or financial results by representing the central<br />
dependencies within the data on the map. It is a way of reducing the dimensionality of a dataset,<br />
by producing a map of usually 1 or 2 dimensions, which plot the similarities of the data by<br />
grouping similar data items together.<br />
The map consists of a regular grid of processing units, "neurons". A model of some<br />
multidimensional observation, eventually a vector consisting of features, is associated with each<br />
unit. The map attempts to represent all the available observations with optimal accuracy using a<br />
restricted set of models. At the same time the models become ordered on the grid so that similar<br />
models are close to each other and dissimilar models far from each other.<br />
6.8.1 Kohonen Network<br />
Kohonen's SOM is called a topology-preserving map because there is a topological structure<br />
imposed on the nodes in the network. A topological map is simply a mapping that preserves<br />
neighborhood relations.<br />
In the networks we have considered so far, we have ignored the geometrical arrangements of<br />
output nodes. Each node in a given layer has been identical in that each is connected with all of<br />
the nodes in the upper and/or lower layer. We are now going to take into consideration that<br />
physical arrangement of these nodes. Nodes that are "close" together are going to interact<br />
differently than nodes that are "far" apart.<br />
What do we mean by "close" and "far"? We can think of organizing the output nodes in a line or in<br />
a planar configuration.<br />
The goal is to train the net so that nearby outputs correspond to nearby inputs. E.g. if x<br />
1<br />
and x<br />
2<br />
are two input vectors and z<br />
1<br />
and z<br />
2<br />
are the locations of the corresponding winning output nodes,<br />
then z<br />
1<br />
and z<br />
2<br />
should be close if x<br />
1<br />
and x<br />
2<br />
are similar. A network that performs this kind of<br />
mapping is called a feature map.<br />
In the brain, neurons tend to cluster in groups. The connections within the group are much<br />
greater than the connections with the neurons outside of the group. Kohonen's network tries to<br />
mimic this in a simple way.<br />
© A.G.Billard 2004 – Last Update March 2011
148<br />
6.8.1.1 Algorithm for Kohonen's Self Organizing Map<br />
Assume output nodes are connected in an array (usually 1 or 2 dimensional). Assume that the<br />
network is fully connected - all nodes in input layer are connected to all nodes in output layer.<br />
Use the competitive learning algorithm as follows:<br />
1. Initialize the weights – the initial weights may be random values or values<br />
assigned to cover the space of inputs.<br />
2. Present an input x r to the net<br />
3. For each output node j , calculate the distance between the input x r and its<br />
weight vector<br />
j<br />
w r , e.g. using the Euclidean distance<br />
n<br />
r r j r r j j<br />
, = − = ∑ i<br />
−<br />
i<br />
i=<br />
1<br />
( )<br />
d x w x w x w<br />
(6.57)<br />
4. Determine the "winning" output node i , for which d is minimal.<br />
r r r r<br />
i<br />
k<br />
w −x ≤ w −x ∀k<br />
(6.58)<br />
Note: the above equation is equivalent to w i x >= w k x only if the weights are<br />
normalized.<br />
5. Update the weights of the winner node and of nodes in a neighborhood using<br />
the rule:<br />
Δ r = ⋅ ⋅ r −<br />
r<br />
( )<br />
i<br />
( ) η ( ) ( ) ( )<br />
k<br />
w t t hki<br />
,<br />
t x w t<br />
where η ( t) ∈ [0,1] is a learning rate or gain and h ( t)<br />
ki ,<br />
r<br />
ki ,<br />
1<br />
( t)<br />
(6.59)<br />
= is the<br />
neighborhood function. It is equal to 1 when i = k and falls off with the distance<br />
r between output nodes i and k. Thus, the closer are the units to the winner,<br />
ki<br />
the larger the update. Note that both the learning rate and the neighborhood vary<br />
with time. It is here that the topological information is supplied. Nearby units<br />
receive similar updates and thus end up responding to nearby input patterns. The<br />
i<br />
above rule drags the weight vector w and the weights of nearby units towards<br />
the input x.<br />
Note that if the output nodes are 1, the Kohonen rule is equivalent to the Outstar<br />
rule, see Section 6.6.2.<br />
Δ w = α⋅x ⋅y −γ<br />
⋅ w<br />
(6.60)<br />
ij i j ij<br />
© A.G.Billard 2004 – Last Update March 2011
149<br />
6. Decrease the size of the neighborhood and the learning rate<br />
( −r<br />
( )<br />
2<br />
ki , t )<br />
2<br />
2σ<br />
h t = e where s 2 is the<br />
Example of neighborhood function could be ( )<br />
width parameter that can gradually be decreased over time.<br />
7. Unless the net is adequately trained (for example η has become very small),<br />
go back to step 2.<br />
ki ,<br />
6.8.1.2 Normalized weight vectors<br />
The weights in Kohonen net are often normalized to unit length. This allows a somewhat cheaper<br />
computation when determining the winning unit. In effect, the network tries to adjust the direction<br />
of the weight vectors to line up with that of the input. The basic idea is that the distance between<br />
the two vectors is minimal, when the two vectors are aligned. So, minimizing the Euclidean<br />
distance is equivalent to maximizing the vector dot product<br />
r r i .<br />
x⋅<br />
w<br />
6.8.1.3 Caveats for the Kohonen Net<br />
The use of Kohonen nets is not as straightforward as it might appear. Although the net does<br />
much of the work in sorting out the organization implicit in the input space, problems can arise.<br />
The first difficulty is in choosing the initial weights. These are often set at random, but if the<br />
distribution of the weights actually selected does not match well with the organization of the input<br />
space, the net will converge very slowly. One way round to this is to set the initial weights<br />
deliberately to reflect the structure of the input space if that is known. For example, thee unit<br />
weight vectors could be smoothly and uniformly distributed across the input space.<br />
A second problem is in deciding how to vary the neighborhood and learning rate to achieve the<br />
best organization. The answer really depends on the application. Note, though, that the standard<br />
Kohonen training algorithm assumes that the training and performance are separate: first you<br />
train the network and, when that is complete, then you use it to classify inputs. For some<br />
applications (for instance, in robot control) it is more appropriate that the net continue learning<br />
and that it generates classifications even though partially trained.<br />
A third problem concerns the presentation of inputs. The training procedure above presupposes<br />
that inputs are presented fairly and at random – in other words – there is no systematic bias in<br />
favor of one part of the input space against others. Without this condition, the net may not<br />
produce a topographic organization, but rather a single clump of units all organized around the<br />
over represented part of the input space. This problem too arises in robotic applications, where<br />
the world is experienced sequentially and consecutive inputs are not randomly chosen from the<br />
input space. Batching up inputs and presenting them randomly from those batches can solve the<br />
problem.<br />
© A.G.Billard 2004 – Last Update March 2011
150<br />
6.8.2 Bayesian self-organizing map<br />
Adapted from Yin, H.; Allinson, N.M. Self-organizing mixture networks for probability density<br />
estimation IEEE Transactions on Neural Networks, Volume 12, Issue 2, March 2001 Page(s):405<br />
– 411.<br />
The Bayesian self-organizing map (BSOM) is a method for estimating a probability distribution<br />
generating data points on the basis of a Bayesian stochastic model. BSOM can be used to<br />
estimate the parameters of Gaussian Mixture Models (GMM). In this case, BSOM estimates<br />
GMM parameters by minimizing the Kullback–Leibler information metric and as such provides an<br />
alternative to the classical Expectation-Maximization (EM) method for estimating the GMM<br />
parameters which performs better in terms of both convergence speed and escape of local<br />
minima. Since BSOM makes no assumption on the form of the distribution (thanks to the KL<br />
metric), it can be applied to estimate other mixture of distribution than purely Gaussian<br />
distribution.<br />
The term SOM in BSOM is due to the fact that the update rule uses a concept similar to the<br />
neighborhood of the update rule in self-organizing map (SOM) neural network. BSOM creates a<br />
set K probability density distribution (PDF). At the instar of EM that updates the parameters of the<br />
pdf globally so as to maximize the total probability that the mixture explains well the data, BSOM<br />
updates each pdf separately by using only a subset of the data located in a neightbourhood<br />
around the data point for which the pdf is maximal. The advantage is that the update and<br />
estimation steps are faster. However, the drawback is that like Kohonen network, the algorithm<br />
depends very much on the choice of the hyperparameters (nm of pdf, size of the neighbourhood,<br />
learning rate).<br />
6.8.2.1 Stochastic Model and Parameter Estimation<br />
BSOM proceeds as follows. Suppose that the distribution of data points is given by p( x ). BSOM<br />
will build an estimate ˆp( x ) by constructing a mixture distribution of K probability distribution<br />
functions (pdf) p ( x ) with associated parametersθ i , i = 1... K, on a d-dimensional input space<br />
i<br />
x. If P ,... 1<br />
P are the prior probabilities of each pdf, then the joint probability density for each data<br />
K<br />
sample is given by:<br />
K<br />
pˆ x p x|<br />
P<br />
( ) ( θ )<br />
= ∑ (6.61)<br />
i=<br />
1<br />
i i i<br />
BSOM will update incrementally the mixture so as to minimize the divergence between the two<br />
distributions measured by the Kullback-Leibler metric:<br />
I<br />
( )<br />
( )<br />
⎛⎛ ˆ<br />
log<br />
p x ⎞⎞<br />
=− p( x)<br />
dx<br />
⎜⎜<br />
p x ⎟⎟<br />
⎝⎝ ⎠⎠<br />
∫ (6.62)<br />
The update step (or M-step by analogy to EM) consists of re-estimating the parameters of each<br />
pdf by minimizing I via its partial derivatives over each parameter<br />
∂I<br />
∂θ<br />
ij<br />
under the constraint that<br />
© A.G.Billard 2004 – Last Update March 2011
151<br />
the resulting distribution is a valid probability, i.e.<br />
K<br />
∑<br />
i=<br />
1<br />
P = 1<br />
resolved through Lagrange and gives the following update step:<br />
i<br />
. Such an optimization problem can be<br />
( + 1 ) = ( ) − ( ) ( | ) − ( )<br />
Pi n Pi n α n ⎡⎡⎣⎣P i x Pi<br />
n ⎤⎤⎦⎦<br />
(6.63)<br />
where n is the update step and α is the learning rate.<br />
To speed up the computation, the updating of the above parameters is then limited to a small<br />
neighborhood around the “winning node”, i.e. the pdf i which has the largest posterior<br />
probability ( | )<br />
pi x . The distribution for a given point x is then approximated by a mixture of a<br />
small number of nodes at one time, i.e.<br />
with η a neighborhood around the winner.<br />
( ) ( θ )<br />
pˆ x ≈ ∑ p x|<br />
P<br />
(6.64)<br />
i∈η<br />
i i i<br />
Learning thus proceeds as in Kohonen. At each iteration step n, one picks a data point at<br />
random, selects the winning pdf for this data points and then update the parameters for all the pdf<br />
located in a neighborhood of the winning distribution (i.e. the pdf for which the maximum is<br />
located on a point in a neighborhood of the data point chosen here).<br />
6.9 Static Hopfield Network<br />
In his 1982 seminal paper, John J. Hopfield [Hopfield, 1982] presented a novel type of associative<br />
memory, consisting in a fully connected artificial neural network, later called the Hopfield Network.<br />
This work was one of the first demonstrations that models of physical systems, such as neural<br />
networks, could be used to solve computational problems. Later, follow-up on this research<br />
showed that such systems could be implemented in hardware by combining standard<br />
components such as capacitors and resistors.<br />
The original Hopfield network, which we will refer to as the static Hopfield Network, consists of a<br />
one-layer fully recurrent neural network. Subsequent development led Hopfield and coworkers to<br />
develop different extensions. The major ones are the Bolzmann Machine, in which a parameter<br />
(the temperature) can be varied so as to increase the capacity of the model, and the continuous<br />
time Hopfield, whose neurons dynamics is continuous over time. In this class, we will consider<br />
only the static and continuous time Hopfiel model. The interested reader can refer to [Barna &<br />
Kaski, 1989; Ackley et al, 1985] for an introduction to the Boltzmann Machine.<br />
The Hopfield network is created by supplying input data vectors, or pattern vectors,<br />
corresponding to the different classes. These patterns are called class patterns. In an n-<br />
dimensional data space the class patterns should have n binary components {1,-1}; that is, each<br />
class pattern corresponds to a corner of a cube in an n-dimensional space. The network is then<br />
used to classify distorted patterns into these classes. When a distorted pattern is presented to the<br />
network, then it is associated with another pattern. If the network works properly, this associated<br />
pattern is one of the class patterns. In some cases (when the different class patterns are<br />
© A.G.Billard 2004 – Last Update March 2011
152<br />
correlated), spurious minima can also appear. This means that some patterns are associated with<br />
patterns that are not among the pattern vectors.<br />
Hopfield networks are sometimes called associative networks since they associate a class<br />
pattern to each input pattern. The importance of the different Hopfield networks in practical<br />
application is limited due to theoretical limitations of the network structure (capacity sensitive to<br />
correlated data) but, in situations where data can be decorrelated, they may form interesting<br />
models. Hopfield networks are typically used for classification problems with binary pattern<br />
vectors.<br />
6.9.1 Hopfield Network Structure<br />
xi<br />
w<br />
ij<br />
= w<br />
ji<br />
x<br />
j<br />
The Hopfield network is composed of K neurons and K2 connection weights w , i, j 1,.., K<br />
ij<br />
= . It<br />
is fully connected through symmetric, bi-directional weights, i.e. wij = wji<br />
. It has no selfconnections,<br />
i.e. w<br />
ii<br />
= 0<br />
∀ i .<br />
In the Hopfield network, learning takes one time step and retrieval takes several time steps!<br />
6.9.2 Learning Phase<br />
The learning rule is intended to make a set of desired patterns<br />
1<br />
stable states of the Hopfield network’s activity rule.<br />
Initialization:<br />
0 = 0 = 0 i,<br />
j<br />
At time t=0, set all the weights to w ( ) w ( )<br />
Update:<br />
ij<br />
ji<br />
∀ .<br />
r<br />
x n = { x n ,..., x n }, n=<br />
1,..., N<br />
The network weights are updated only once to represent the correlations across all bits from all<br />
patterns, following:<br />
w<br />
= η∑ x x<br />
(6.65)<br />
n n<br />
ji i j<br />
n<br />
x ∈−<br />
n<br />
j<br />
{ 1,1}<br />
K<br />
© A.G.Billard 2004 – Last Update March 2011
153<br />
To simplify the description of the information retrieval, one, often, uses:<br />
1<br />
η = (6.66)<br />
K<br />
6.9.3 Retrieval Phase<br />
Each neuron updates its state as if it were a single neuron with the threshold activation function<br />
⎛⎛ ⎞⎞ ⎧⎧1 if z ≥ 0<br />
xj = θ⎜⎜<br />
wijxi<br />
⎟⎟, θ( z)<br />
=⎨⎨<br />
⎝⎝ i ⎠⎠ ⎩⎩-1 if z < 0<br />
∑ (6.67)<br />
x ∈−<br />
n<br />
j<br />
{ 1,1}<br />
The activity of the neurons can be updated either synchronously or asynchronously. The retrieval<br />
procedure is iterative and consists of the following:<br />
Initialization:<br />
r<br />
At time t=0, inject a pattern to the net x µ<br />
random pattern), i.e. set the state of all the network’s neuron to<br />
Update:<br />
Synchronous Update:<br />
(possibly a noisy version of a stored pattern or a<br />
( 0 ) ,..., ( 0)<br />
x = x x = x<br />
µ µ<br />
1 1 K K<br />
⎛⎛<br />
xj( t) = θ aj( t− ) ∀ aj t− = ⎜⎜ wijxi<br />
t−<br />
⎝⎝ i<br />
( 1 ) j ( 1) ( 1)<br />
⎞⎞<br />
⎟⎟<br />
⎠⎠<br />
∑ (6.68)<br />
All neurons compute their activation and update their state simultaneously following:<br />
Asynchronous Update:<br />
One neuron at a time computes its activations and updates its state. The sequence of<br />
selected neuron may be fixed or random:<br />
⎛⎛<br />
xj( t) = θ aj( t− ) aj t− = ⎜⎜ wijxi<br />
t−<br />
⎝⎝ i<br />
( 1 ) ( 1) ( 1)<br />
( ) x ( t )<br />
x t = −1 ∀ i≠<br />
j<br />
i<br />
i<br />
⎞⎞<br />
⎟⎟<br />
⎠⎠<br />
∑ (6.69)<br />
© A.G.Billard 2004 – Last Update March 2011
154<br />
If<br />
( ) = ( − )<br />
⎛⎛ ⎞⎞<br />
xi ( t+ 1 ) = θ ( ai ( t)<br />
) ai ( t) =⎜⎜∑<br />
wjixj<br />
( t)<br />
⎟⎟<br />
⎝⎝ j ⎠⎠<br />
x t+ 1 = x t ∀ j ≠i<br />
j<br />
( ) ( )<br />
j<br />
x t x t 1 for all units j, then the network has reached a stable<br />
j<br />
j<br />
state, otherwise we keep changing the state of the units until it converges.<br />
Note that the properties of the Hopfield network may be sensitive to the choice of synchronous<br />
versus asynchronous activation.<br />
Figure 6-14: Hopfield Network trained on 4 patterns (top row). (middle row) increasing amounts of noise are<br />
added to one of the patterns. (bottom row) Hopfield network after convergence from the noisy state. Notice<br />
how the network is able to retrieve the original pattern even when most of the image is noise. The rightmost<br />
image is pure random noise, the network converges to a spurious state due to a local minimum in the<br />
network energy. [DEMOS\HOPFIELD\HOPFIELD.EXE]<br />
6.9.4 Capacity of the static Hopfield Network<br />
One can show that the maximal number of patterns N that can be stored in a network of size K is:<br />
Nmax 0.138⋅<br />
K<br />
; (6.70)<br />
The capacity of the Hopfield network decreases importantly in the face of correlated patterns.<br />
One way of suppressing the effect of correlated patterns is to modify the learning rule in order to<br />
decorrelate the patterns. The learning rule becomes:<br />
1 N N<br />
ji i j<br />
K<br />
µν<br />
µ = 1ν=<br />
1<br />
µ −1<br />
ν<br />
= ∑∑ ( )<br />
(6.71)<br />
w x C x<br />
© A.G.Billard 2004 – Last Update March 2011
155<br />
C<br />
µν<br />
−1<br />
where ( )<br />
is the µν th element of the inverse matrix<br />
overlap of each pattern on each bit and is given by:<br />
( C)<br />
µν<br />
N<br />
i=<br />
1<br />
µ ν<br />
i i<br />
1<br />
C − . C measures the degree of<br />
= ∑ x x<br />
(6.72)<br />
The price paid for the improvement on the network capacity is that the learning rule becomes<br />
non-local, which makes the model less attractive from a biological point of view.<br />
6.9.5 Convergence of the Static Hopfield Network<br />
One can show that the Hopfield Network with an asynchronous update rule is bound to converge.<br />
The idea is that the dynamics of the system can be described by an Energy function:<br />
1<br />
E =− ∑ Wijss<br />
(6.73)<br />
i j<br />
2<br />
i,<br />
j<br />
It remains to show that E is a Lyapunov function; i.e., it is bound to converge to a stable fixed<br />
*<br />
point x . A Lyapunov function E is, by definition, a continuous differentiable, real value function<br />
with the following two properties:<br />
* *<br />
( ) ( )<br />
Positive Definite: E x > 0 ∀x≠ x and E x = 0<br />
(6.74)<br />
d *<br />
All trajectory flow downhill: E ( x ) < 0 ∀ x ≠ x<br />
(6.75)<br />
dx<br />
Hint: Once the network has converged, all units have reached a stable state, i.e.<br />
i<br />
( ) ( 1 )<br />
s t = s t+ ∀ i.<br />
i<br />
6.10 Continuous Time Hopfield Network and Leaky-Integrator Neurons<br />
As mentioned previously, the convergence and capacity of the Hopfield network can be majorly<br />
affected when changing from asynchronous update to synchronous update. It turns out that, once<br />
we move to a continuous-time version of the Hopfield network, this issue melts away.<br />
Let us assume that each neuron's activity<br />
x<br />
j<br />
is a continuous function of time xj<br />
( )<br />
t . The neuron's<br />
response to the activation of other neurons in the network is then given by a first-order differential<br />
equation:<br />
© A.G.Billard 2004 – Last Update March 2011
156<br />
dmi<br />
τ<br />
i<br />
=− mi + ∑ wij ⋅xj<br />
t<br />
dt<br />
j<br />
1<br />
x = +<br />
i −D⋅ ( mi<br />
+ b)<br />
1 e<br />
( )<br />
(6.76)<br />
where m is the membrane potential, x the firing rate, τ the time constant, b the bias and<br />
i i i<br />
D a scalar that defines the slope of the sigmoid function.<br />
Neurons following the activation given in (6.76) are called leaky-integrator neurons.<br />
⎛⎛<br />
f ⎜⎜∑<br />
wij<br />
⋅ xj<br />
t<br />
⎝⎝ j<br />
( )<br />
⎞⎞<br />
⎟⎟<br />
⎠⎠<br />
corresponds to the integrative term. As an effect of this term, the activity of the<br />
neuron increases over time due to the external activation of the other neurons to reach a plateau.<br />
The speed of convergence depends onτ , see<br />
Figure 6-15: Typical activity pattern of a leaky-integrator neuron in response to an incoming input (synaptic<br />
∑<br />
activity) S( t) = w ⋅x ( t)<br />
. Unpon receiving a steady input, the membrane potential m increases or<br />
ij j<br />
j<br />
decreases until it reaches the input value.<br />
For a given steady or null external activation, the activity of the neuron decays or leaks<br />
exponentially according to the time constant τ following:<br />
d x<br />
i t<br />
dt<br />
1<br />
τ<br />
( ) x ( t )<br />
=− (6.77)<br />
i<br />
It is important to notice that this term corresponds to adding a self-connection to each neuron,<br />
and, as such provides a memory of the neuron’s activity over time.<br />
Similarly to the static case, one can show that the network is bound to converge under some<br />
conditions. But, in most cases, the complexity of the dynamics that results from combining<br />
several neurons whose dynamics follows a first order differential equation, as given in (6.77),<br />
becomes quickly intractable analytically.<br />
© A.G.Billard 2004 – Last Update March 2011
157<br />
The continuous time Hopfield network is a powerful to tool to store sequences. It has been used<br />
in numerous applications in robotics, e.g. learning to recognize and reproduce complex patterns<br />
of motion. The strength of this modeling comes from the fact that the complexity of the pattern<br />
that emerges from mixing different first order differential equations as given in (6.76) becomes<br />
very rapidly untractable.<br />
Consider the case whereby the neuron received a single steady input S with no self-connection,<br />
i.e. with no decay term. The behavior of such a neuron is a linear differential equation that can be<br />
solved analytically and is given by:<br />
−t<br />
/ τ<br />
mt () = ( m0<br />
− S)<br />
e + S<br />
1<br />
(6.78)<br />
xt () =<br />
−D⋅ ( m( t) + b)<br />
1 + e<br />
The system grows until reaching a maximum as shown in Figure 6-16.<br />
Figure 6-16: Dynamics of a single Leaky-Integrator neuron with no self-connection<br />
The behavior of a single leaky-integrator neuron with a self-connection is much more complex. It<br />
follows a nonlinear differential equation that cannot be solved analytically. To study convergence<br />
of the neuron, one must then rely on finding the equilibrium points of the activation function of its<br />
membrane potential. This is given by:<br />
dm<br />
= 0 ⇒ m− w11σ<br />
( m+ b)<br />
= S<br />
dt<br />
(6.79)<br />
1<br />
where σ ( z) = is the sigmoid function<br />
−Dz<br />
1 + e<br />
© A.G.Billard 2004 – Last Update March 2011
158<br />
Figure 6-17: To determine the convergence of a leaky-integrator neuron with a self-connection, one must<br />
find numerically the value m* for which the derivative of the membrane potential m is zero. Here we have a<br />
*<br />
single stable point<br />
m = 10 for a steady input S=30 with a negative self-connection w 11<br />
=− 20 .<br />
The zeros of the derivative correspond to equilibrium points. These may however be stable or<br />
unstable. A stable point is such that if it slightly pushed away from the stable point, it will<br />
eventually come back to its equilibrium. In contrast, an unstable point is such that a small<br />
perturbation in the input may send the system away from its equilibrium. In Leak-Integrator<br />
Neurons, this is easily achieved and depends on the value of the different parameters, but<br />
especially that of the self-connection. Figure 6-17 and Figure 6-18 illustrate these two cases.<br />
Figure 6-18: Example of a leaky-integrator neuron for a steady input S=30 with a positive selfconnection<br />
w 11<br />
= 20. The system has three equilibrium points at m=0, m=-10 and m=10. m=0 is an<br />
unstable point, whereas m=-10 and m=10 are two stable points. This can be seen by observing that the<br />
slope of m(s) around m=0 is positive, whereas it is negative for m=-10 and m=10 (see left figure).<br />
Stability of the equilibrium points can be determined by looking at the direction of the slope of the<br />
derivative of the membrane potential around the equilibrium point, i.e.:<br />
dm 1<br />
f( m) = ( m S w11x)<br />
dt<br />
= τ<br />
− + + (6.80)<br />
© A.G.Billard 2004 – Last Update March 2011
159<br />
∂f If the slope is negative, i.e.<br />
( m)<br />
< 0 (note that here we are exploring the function in input space<br />
∂m<br />
and not in time), then the equilibrium point is stable. Intuitively, this is easy to see. The slope<br />
gives you the direction in which you are pulled. With a negative slope you are pulled back to<br />
where you were. With a positive slope you are pulled away from where you were, usually in the<br />
direction of another equilibrium point.<br />
Given that the dynamics of a single neuron can already become very complex, the dynamics of<br />
groups of such neurons becomes rapidly intractable. In a seminal paper, Randall Beer (Beer<br />
Adaptive Behavior, Vol 3 No 4, 1995) showed how the dynamics of a group of only two<br />
interconnected leaky-integrator neurons could lead to four complex dynamics. Figure 6-19 shows<br />
the possible trajectories of values taken by the outputs of the two neurons. Such a plot is called a<br />
phase plot.<br />
Figure 6-19: Possible dynamics that can be generated by a network composed of two leaky-integrator<br />
neurons (R. Beer, Adaptive Behavior, 1995).<br />
© A.G.Billard 2004 – Last Update March 2011
160<br />
7 Markov-Based Models<br />
Except for ICA, recurrent neural networks and continuous Hopfield network, these lectures notes<br />
have covered primarily methods to encode static datasets, i.e. data that do not vary in time. Being<br />
able to predict patterns that vary in time is fundamental to many applications. Such patterns are<br />
often referred to as time-series.<br />
In this chapter, we cover two models to encode time-series based on the hypothesis of a firstorder<br />
Markov Process, which we describe next.<br />
7.1 Markov Process<br />
A Markov Process is by definition discrete and assumes that the evolution of a system can be<br />
described by a finite set of states. If<br />
N particular values { s ,... 1<br />
s<br />
N}<br />
, i.e. x { s ,... 1<br />
sN}<br />
x is the state of the system at time, then x can take only<br />
t<br />
∈ .<br />
A first-order markov process is a process by which the future state of the system can be<br />
determined solely by knowing the current state of the system. In other words, if one has made T<br />
consecutive observation of the state x of the system: { t} t 1<br />
the system at the next time step<br />
T 1<br />
current state, i.e.:<br />
T<br />
X x =<br />
= , the probability that the state of<br />
x +<br />
take any of the N possible value is determined solely by the<br />
( t+ 1 j<br />
|<br />
t, t− 1,...., 0) ( t+<br />
1 j<br />
|<br />
t)<br />
p x = s x x x = p x = s x<br />
(7.1)<br />
When modeling time-series, to assume that a process description is first-order markov is<br />
advantageous in that it simplifies greatly computation. Instead of computing the complete<br />
x , x ,...., x<br />
conditional on all previously observed states , one must solely compute the<br />
t t−<br />
1 0<br />
conditional on the last state. We will see how this is exploited in two different techniques widely<br />
used in machine learning next.<br />
© A.G.Billard 2004 – Last Update March 2011
161<br />
7.2 Hidden Markov Models<br />
Hidden Markov Models (HMMs) are used to model the temporal evolution of a complex problem<br />
of which one can have only a partial description. The goal is to use this model to predict the<br />
evolution of the system in the future. One may be provided solely with the current state of the<br />
system or with several of the previous states of the system.<br />
Take for example the problem of predicting traffic jams. This seems to be a very intricate<br />
problem, especially as one can usually only observe part of the problem. One may have video<br />
cameras and other type of sensors monitoring the traffic at every single junction. However, one<br />
cannot know what individual path each car will follow. While one may suddenly measure an<br />
increase in traffic at all points and one may hence infer that there are good chances that a traffic<br />
jam may be created. It is very difficult to determine when and on which particular road the traffic<br />
jam will happen, if any. The underlying process leading to traffic jam is stochastic and highly<br />
complex. HMM-s aim at encapsulating such stochasticity and complexity in a partially observable<br />
problem.<br />
HMM are used widely in speech recognition and gesture recognition. In speech recognition, they<br />
are used to model the temporal evolution of speech pattern and to recognize either complete<br />
words or parts of the words, such as phonemes. In gesture recognition, HMM are used to<br />
recognize patterns of motions (from either video data or from recording joint motion through e.g.<br />
exoskeleton or motion sensors). One usually builds one HMM per gesture and one uses a<br />
measure of the likelihood that a new observed gesture was generated by a particular HMM to<br />
recognize this newspecific gesture (e.g. stop motion, waving motion, pointing motion, etc). These<br />
motions can either be computed from searching for body features in an image or through the use<br />
of an exoskeleton to measure directly displacement of each body segment.<br />
7.2.1 Formalism<br />
HMM extends the principle of first-order Markov Process and assumes that the observed time<br />
series was generated by an underlying hidden process. This hidden process is assumed to<br />
consist of stochastic finite state automata where the states sequence is not observed directly.<br />
Each state has an underlying probabilistic function describing the distribution of observable<br />
outputs. Two concurrent stochastic processes are involved, one modeling the sequential structure<br />
of the data, and one modeling the local properties of the data. A typical graphical representation<br />
of this process is given in Figure 7-1.<br />
T<br />
O o =<br />
= be the set of observations. These correspond to the set of values for all<br />
Let { t} t 1<br />
parameters describing the system which one recorded over a time period T. Each observation is<br />
usually multidimensional, e.g.<br />
q<br />
N<br />
ot<br />
∈ ° . The set S { s i }<br />
i= 1<br />
= of N hidden states is finite.<br />
© A.G.Billard 2004 – Last Update March 2011
162<br />
Figure 7-1: Schematic illustrating the concepts of a HMM. The process is assumed to be composed of 7<br />
hidden states. All transitions across all states are possible (fully connected). Note that for simplicity, we<br />
show only arrows across adjacent states. The schematic at the bottom shows a particular instance of<br />
transition across states over five time steps. Transitiosn across each state leads to an observation of a<br />
particular set of values for the system’s variables. As we see, the system rotates first across states 1 and 2<br />
and then stays for two time steps on state 3.<br />
Transitions across states are described as a stochastic finite automata process. The stochasticity<br />
of the process is represented by computing a set of transition probabilities that determine the<br />
likelihood to stay in a state or to jump to another state. Transition probabilities are encapsulated<br />
in a N N<br />
represent the probability of transiting from<br />
× matrix A , whose elements { } ij<br />
i , j=<br />
1...<br />
state i to state j , i.e. aij p( sj | si<br />
)<br />
a<br />
N<br />
= . The sum of all elements in each row of A equals 1. Each<br />
state is associated an initial probability π<br />
i, i= 1,.. Nthat represents the likelihood to be in that<br />
state at any given point in time. In addition, one assigns to each state i a density ( ) i<br />
b o , socalled<br />
the emission probability that determines the probability of the observation to take a<br />
particular value when in state S . Depending on whether the observables take discrete versus<br />
i<br />
continuous values, we talk about a discrete versus continuous HMM. When continuous, the<br />
density may be estimated through a Gaussian Mixture Model. In this case, one associates a<br />
GMM per state. HMM are used widely in speech processing. There, often, one uses very few<br />
hidden states (at maximum 3!). The complexity of the speech is then embedded in the GMM<br />
density modeling associated at each state.<br />
© A.G.Billard 2004 – Last Update March 2011
163<br />
Figure 7-2: Schematic illustrating the concept of emission probabilities associated to each state in a HMM.<br />
3<br />
o<br />
t is the observable at time t. It can take any value v∈° .<br />
7.2.2 Estimating a HMM<br />
Designing an HMM consists in determining the hidden process that explains at best the<br />
observations. The unkown variables in a HMM are the number of states, the transitions and initial<br />
probabilities and the emission probabilities. Since the matrix A is quite large, sometimes, often<br />
people chose a sparse matrix, i.e. they set to zero most of the probabilities hence allowing only<br />
some transitions across some states. The most popular model is the so-called left-right model<br />
that allows transitions solely from state 1, to state 2, and so forth until reaching the final state.<br />
Estimating the parameters of the HMM is done through a variant of Expectation-Maximization<br />
called the Baum-Welch procedure. For a fixed topology (i.e. number of states), one estimates the<br />
set of parameters λ = ( AB , , π)<br />
by maximizing the likelihood of the observations given the<br />
model:<br />
where q { q q }<br />
PO ( | λ) = ∑ PO ( | q, λ) Pq ( | λ)<br />
(7.2)<br />
q<br />
= ,...., is one particular set of expected state transitions during the T observation<br />
1 T<br />
steps. In the example of Figure 7-1, the set q is{ q = s, q = s , q = s, q = s , q = s }.<br />
1 1 2 2 3 1 4 3 5 3<br />
Computing all possible combinations of states in Equation (7.2) is prohibitive. To simplify<br />
computation, one uses dynamic programming through the so-called forward-backward<br />
computation. The principle is illustrated in Figure 7-3 left. It consists of propagating forward in<br />
time the estimate of the probability of being in a particular state given the set of observations. At<br />
each time step, the estimate of being in state i is given by:<br />
α () i = P( o... o, q = s | λ)<br />
(7.3)<br />
t 1 t t i<br />
© A.G.Billard 2004 – Last Update March 2011
164<br />
Figure 7-3: The Forward Procedure used in the Baum-Welch algorithm for estimating the HMM parameters<br />
The forward procedure is thus iterative with an initialization step, an induction step (typical of<br />
dynamic programming) and termination step, see Figure 7-3 right.<br />
It is easy to see that the same principle can be extended backwards and, thus, that one can infer<br />
the probability of being in a particular state by starting from the last state and building one’s way<br />
back in time. This is referred to as the backward procedure and is illustrated in Figure 7-4.<br />
Figure 7-4: The backward procedure in the Baum-Welch algorithm for estimating the HMM parameters<br />
While solving with Equation (7.2) would take on the order of 2T*N T computation steps, the<br />
forward or backward procedures reduce this computation greatly and take instead on the order of<br />
N 2 T computation steps each. One may wonder what the advantage would be to do the<br />
computation either forwards or backwards. There is no direct advantage to do either. These two<br />
procedures are however crucial to the estimation of the parameters of the HMM. It is easy to see<br />
that, if one can compute the probability to be in state i at time t with the forward procedure and<br />
the probability to be in state j at time t+1 with the backward procedure, then one can combine<br />
© A.G.Billard 2004 – Last Update March 2011
165<br />
these two quantities to compute the probability (, i j)<br />
illustrated in Figure 7-5.<br />
ξ of transiting from i to j at time t. This is<br />
t<br />
Figure 7-5: Combining the forward and backward procedure to estimate the transition probability across the<br />
arc joining state i and state j.<br />
The probability of being in the state i at time t can then be inferred by simply summing over all the<br />
transition probabilities and is given by:<br />
γ () i = ∑ ξ (, i j)<br />
(7.4)<br />
t<br />
j=<br />
1... N<br />
From the computation of both ξt<br />
(, i j)<br />
and γ<br />
t<br />
() i for each state, i.e. i, j = 1... N , one can now<br />
derive the update rule for all open parameters. HMM re-estimation of the parameter hence starts<br />
from an estimate of the parameters λ = ( AB , , π)<br />
and updates these iteratively acoording to:<br />
The initial probabilities follow immediately from the computation of the probability to be in any<br />
given state at time t=1:<br />
ˆ π = γ () i<br />
(7.5)<br />
i<br />
1<br />
t<br />
The transition probabilities are then given by computing the sum of probabilities of transiting to<br />
this particular state over the course of the whole sequence. This is normalized by the probability<br />
of being in any state (the reader will here recognize the Bayes rule, with aˆij<br />
being the conditional<br />
probability of being in j when being in j):<br />
aˆ<br />
ij<br />
T −1<br />
ξ (, i j)<br />
t=<br />
1 t<br />
T −1<br />
= ∑ ∑ =<br />
t 1<br />
γ () i<br />
t<br />
(7.6)<br />
© A.G.Billard 2004 – Last Update March 2011
166<br />
Finally, the emission probabilities in the discrete case are given by computing the expected<br />
number of times one will be in each particular state and that the observation took a particular<br />
value v k<br />
, i.e. ot<br />
= v :<br />
k<br />
bˆ v<br />
tot<br />
= k<br />
( )<br />
{: v }<br />
i k T<br />
= ∑ ∑ =<br />
t 1<br />
γ () i<br />
t<br />
γ () i<br />
t<br />
(7.7)<br />
In the continuous case, one builds a continuous estimate of the b ˆi , e.g. by building a GMM for<br />
each state.<br />
The ^ symbol in each of the above designates the new estimate of the values for each of the<br />
HMM parameter.<br />
7.2.3 Determining the number of states<br />
A crucial parameter to HMM (and similarly to GMM) is the number of states K. Increasing K<br />
increases the number of parameters and so computation. Of course, increasing the number of<br />
states allows a finer description of the density and hence increases the likelihood of the model<br />
given the data. This increase may however be negligeable in contrast to the increase in<br />
computation time due to the increase of parameters. One must then find a tradeoff between<br />
increasing the number of parameters and improving the likelihood of the model. This is<br />
encapsulated in the Aikaike Information Criterion (AIC):<br />
where L is the likelihood of the model.<br />
AIC= − 2ln L+ 2K<br />
(7.8)<br />
This criterion was however lately replaced by the Bayesian Information Criterion that also weights<br />
the fact that the estimate of the number of parameters depends on the number of data points.<br />
Sparsity in the data may require a lot of parameters to encapsulate non-linearities in these. As the<br />
number of datapoints M increases, so does the influence of the number of parameters.<br />
BIC =− 2lnL + K ln( M )<br />
(7.9)<br />
An alternative to the above two criteria is the Deviation Information Criterion (DIC)<br />
{ ( )} { }<br />
( ) ( ) ( )<br />
DIC = E D K - D E K with D K 2 ln p X | K<br />
=− (7.10)<br />
Again the smaller the DIC, the better the model fits the data. DIC favors a good fit, while<br />
penalizing models by measuring the effective number of parameters required for a similar level of<br />
fit.<br />
© A.G.Billard 2004 – Last Update March 2011
167<br />
7.2.4 Decoding an HMM<br />
There are two ways to use a HMM once built. It can be used either for classification or for<br />
prediction.<br />
Classification: assume that you have trained two different HMM-s on the basis of two classes of<br />
time series (say you trained a HMM to recognize a waving gesture and another HMM to<br />
recognize a pointing gesture on the basis of ten examples each). One can use these two HMM-s<br />
classify the observation of a new times series (a new movement) to determine whether it<br />
belonged more to the first or second type of time series (i.e. whether the person was waving or<br />
rather pointing). This can be done by computing the likelihood of the new times series given the<br />
model and determining simply which model is most likely to explain this time series. If the new<br />
times series is X’, the set of parameters of each model are λ 1 = ( A 1 , B<br />
1 , π 1 ), λ 2 = ( A 2 , B<br />
2 , π<br />
2 )<br />
respectively, then the likelihoods of X’ to have been generated by each of these two models<br />
1 2<br />
are p( X'| ), p( X'|<br />
)<br />
backward procedure.<br />
λ λ . These likelihoods can be computed using either the forward or<br />
One can then decide which of model 1 and 2 is most likely to have explained the time series by<br />
directly comparing the two likelihoods. That is, model 1 is more likely to have generated X’ if:<br />
( '| λ<br />
1 ) p( X'|<br />
λ<br />
2<br />
)<br />
p X<br />
> (7.11)<br />
Such a comparison is however difficult as the value of the likelihood is unbounded (recall that pdf<br />
are positive functions with no upper bound). It can take very large values just as an effect of one<br />
model having much more parameters than the other. Hence, in practice, one sometimes<br />
normalizes the likelihood by the number of parameters of each model. Since one only compares<br />
two values, one has no idea how well any of the two models actually explain the data. It could be<br />
that both likelihoods are very low and that hence the observed time series belongs to neither of<br />
these two models. In speech processing, people avoid this problem by creating a “garbage”<br />
model that ensures that, if a times series is not well represented by any of the meaningful model,<br />
then it will be automatically classified in the garbage model. Building a garbage model requires<br />
training the model on a large variety of things that cannot be the pattern one is looking for (e.g.<br />
noise from cars, doors shutting down, etc). Generating such a large set of non-class samples is<br />
not very practical. An alternative is to retain a value of the average likelihood obtained with the<br />
training examples for each model and use this to ensure that the likelihood of the new time series<br />
is at least as big as that seen during training (or within some bounds).<br />
Prediction: Once built a HMM can be used to make prediction about the evolution of a given time<br />
series if provided with part of the time series. Clearly the farther back in time one can go, the<br />
better the prediction.<br />
Say that you have built a HMM to represent the temporal evolution of the weather day after day<br />
taking into account the seasons and the particular geographical area, one can then use the model<br />
to predict the weather for the following couple of days. The farther in the future the prediction, the<br />
less reliable it may be.<br />
To perform prediction one uses the Viterbi algorithm. The viterbi algorithm aims at generating the<br />
most likely path. Given a HMM model with parameters λ = ( AB , , π)<br />
, one looks for the most<br />
likely state sequence { }<br />
Q= q , , 1<br />
… q T<br />
for T time steps in the future, i.e. one optimizes for:<br />
Q arg max P( Q' | O, λ)<br />
= (7.12)<br />
Q'<br />
© A.G.Billard 2004 – Last Update March 2011
168<br />
To do this, one proceeds iteratively and tries to find the optimal state at each time step. Such an<br />
iterative procedure is advantageous in that, if one is provided with part of the observations as in<br />
the above weather prediction example, one can use the observations { } 1 ,..., t<br />
first t time steps to guide the inference.<br />
o o made over the<br />
The optimal state at each time step is obtained by combining inferences made with the forward<br />
and backward procedures and is given by<br />
γ ( j)<br />
=<br />
t<br />
α<br />
N<br />
∑<br />
i=<br />
1<br />
The most likely sequence is then obtained by computing:<br />
j<br />
( t) β ( t)<br />
α<br />
i<br />
j<br />
( t) β ( t)<br />
( ) arg max( γ () i)<br />
qt<br />
1≤≤<br />
i N<br />
t<br />
i<br />
, see also Equation(7.4).<br />
= (7.13)<br />
The state sequence maximizing the probability of a path which accounts for the first t<br />
observations and ends in state j is given by:<br />
δ ( j) = max p( q... q , q = j, o... o)<br />
(7.14)<br />
t 1 1 1<br />
1...<br />
t −<br />
q q<br />
t t<br />
t−1<br />
Computing the above quantity requires taking into account the emission probabilities and the<br />
transition probabilites. Again one proceeds iteratively through induction. This forms the core of<br />
the Viterbi algorithm and is summarized in the table below:<br />
Hence, when inferring the weather over the next five days, given information on the weather for<br />
the last ten days, one would first compute the first 10 states sequence q1,.....<br />
q using (7.14) and<br />
10<br />
then one would use (7.13) to infer the next five states q 11<br />
,..... q 15<br />
. Given q 11<br />
,..... q 15<br />
, one would<br />
then draw from the associated emission probabilities to predict the particular weather (i.e. the<br />
particular observation one should make) for the next 15 time slots.<br />
:<br />
© A.G.Billard 2004 – Last Update March 2011
169<br />
7.2.5 Further Readings<br />
Rabiner, L.R. (1989) “A tutorial on hidden Markov models and selected applications in speech<br />
recognition”, Proceedings of the IEEE, 77:2<br />
Shai Fine, Yoram Singer and Naftali Tishby (1998), “The Hierarchical Hidden Markov Model”,<br />
Machine Learning, Volume 32, Number 1, 41-62.<br />
© A.G.Billard 2004 – Last Update March 2011
170<br />
7.3 Reinforcement Learning<br />
Adapted from [Sutton & Barto, 1998; Kaelbling, Littman & Moore, 1996].<br />
Reinforcement learning is the problem faced by an agent that must learn behavior through trialand-error<br />
interactions with a dynamic environment.<br />
Reinforcement learning is learning what to do--how to map situations to actions--so as to<br />
maximize a numerical reward signal. The learner is not told which actions to take, as in most<br />
forms of machine learning, but instead must discover which actions yield the most<br />
reward by trying them.<br />
In the most interesting and challenging cases, actions may affect not only the immediate reward<br />
but also the next situation and, through that, all subsequent rewards. These two characteristics--<br />
trial-and-error search and delayed reward--are the two most important distinguishing features of<br />
reinforcement learning.<br />
A good way to understand reinforcement learning is to consider some of the examples and<br />
possible applications that have guided its development.<br />
Consider a master chess player making a move. The choice is informed both by planning--<br />
anticipating possible replies and counter replies--and by immediate, intuitive judgments of the<br />
desirability of particular positions and moves. However, a chess player was not born with this<br />
knowledge. The player acquired it. A chess player becomes a master only after numerous<br />
defeats. It is through these unsuccessful games that the player manages, through a complex<br />
process of deduction, to determine which of the numerous steps were misguided and led to the<br />
ultimate defeat.<br />
Consider a baby managing her first steps. Before walking steadily, the baby is likely to have fallen<br />
down numerous times. It is as likely that none of the falls were similar to one another. Thus, a<br />
simple associative process would not be sufficient to infer the correct set of actions to undertake<br />
in order to achieve a steady walking pattern.<br />
In the first example, the reward is a binary value, the success of the game, while in the second;<br />
the reward is more continuous (duration of the walk before falling, complete fall versus sitting). A<br />
challenge in reinforcement learning is to define the reward. It is clear that the goal of the agent is<br />
to maximize the reward. However, how can the agent know when the maximum is reached?<br />
Reinforcement learning is different from supervised learning. Supervised learning is learning from<br />
examples provided by a knowledgeable external supervisor. This is an important kind of learning,<br />
but alone it is not adequate for learning from simply interacting with the world, as in the second<br />
example above. In interactive problems it is often impractical to obtain examples of desired<br />
behavior that are both correct and representative of all the situations in which the agent has to<br />
act. In uncharted territory--where one would expect learning to be most beneficial--an agent must<br />
be able to learn from its own experience.<br />
One of the challenges that arise in reinforcement learning and not in other kinds of learning is the<br />
trade-off between exploration and exploitation. To obtain a lot of reward, a reinforcement learning<br />
agent must prefer actions that it has tried in the past and found to be effective in producing<br />
reward. But to discover such actions, it has to try actions that it has not selected before. The<br />
agent has to exploit what it already knows in order to obtain reward, but it also has to explore in<br />
order to make better action selections in the future. The dilemma is that neither exploration nor<br />
exploitation can be pursued exclusively without failing at the task. The agent must try a variety of<br />
actions and progressively favor those that appear to be best. On a stochastic task, each action<br />
must be tried many times to gain a reliable estimate of its expected reward.<br />
© A.G.Billard 2004 – Last Update March 2011
171<br />
7.3.1 Principle<br />
In reinforcement learning, the purpose or goal of the agent is formalized in terms of a special<br />
reward signal passing from the environment to the agent. At each time step, the reward is a<br />
r ∈R. Informally, the agent's goal is to maximize the total amount of reward it<br />
simple number,<br />
t<br />
receives. This means maximizing not immediate reward, but cumulative reward in the long run.<br />
The reinforcement-learning problem is meant to be a straightforward framing of the problem of<br />
learning from interaction to achieve a goal. The learner and decision-maker is called the agent.<br />
The thing it interacts with, comprising everything outside the agent, is called the environment.<br />
These interact continually, the agent selecting actions and the environment responding to those<br />
actions and presenting new situations to the agent. The environment also gives rise to rewards,<br />
special numerical values that the agent tries to maximize over time. A complete specification of<br />
an environment defines a task, one instance of the reinforcement-learning problem.<br />
More specifically, the agent and environment interact at each of a sequence of discrete time<br />
. At each time step t , the agent receives some representation of the<br />
steps, t = 0,1, 2,3,...<br />
environment's state,<br />
action,<br />
at<br />
st<br />
∈ S<br />
∈ A, where ( )<br />
, where S is the set of possible states, and on that basis selects an<br />
As is the set of actions available in state s<br />
t<br />
. One time step later, in<br />
t<br />
part as a consequence of its action, the agent receives a numerical reward,<br />
t<br />
itself in a new state s<br />
t +<br />
. Figure 7-6 diagrams the agent-environment interaction.<br />
1<br />
r ∈R, and finds<br />
Figure 7-6: The agent-environment interaction in reinforcement learning.<br />
An intuitive way to understand the relation between the agent and its environment is with the<br />
following example dialogue.<br />
Environment: You are in state 65. You have 4 possible<br />
actions.<br />
Agent: I'll take action 2.<br />
Environment: You received a reinforcement of 7 units.<br />
You are now in state 15. You have 2<br />
possible actions.<br />
Agent: I'll take action 1.<br />
Environment: You received a reinforcement of -4 units.<br />
You are now in state 65. You have 4<br />
© A.G.Billard 2004 – Last Update March 2011
172<br />
possible actions.<br />
Agent: I'll take action 2.<br />
Environment: You received a reinforcement of 5 units.<br />
You are now in state 44. You have 5<br />
possible actions.<br />
7.3.2 Defining the Reward<br />
r , r , r ,...<br />
If the sequence of rewards received after time step t is denoted , then what<br />
t+ 1 t+ 2 t+ 3<br />
precise aspect of this sequence do we wish to maximize? In general, we seek to maximize the<br />
expected return, where the return, R , is defined as some specific function of the reward<br />
sequence. In the simplest case the return is the sum of the rewards:<br />
R= r + r + r + + r<br />
(7.15)<br />
t+ 1 t+ 2 t+<br />
3<br />
...<br />
T<br />
where T is a final time step. This approach makes sense in applications in which there is a natural<br />
notion of final time step, that is, when the agent-environment interaction breaks naturally into<br />
subsequences, i.e. episodes, such as plays of a game, trips through a maze, or any sort of<br />
repeated interactions. Each episode ends in a special state called the terminal state, followed by<br />
a reset to a standard starting state or to a sample from a standard distribution of starting states.<br />
Tasks with episodes of this kind are called episodic tasks.<br />
On the other hand, in many cases the agent-environment interaction does not break naturally into<br />
identifiable episodes, but goes on continually without limit. For example, this would be the natural<br />
way to formulate a continual process-control task, or an application to a robot with a long life<br />
span. We call these continuing tasks. The return formulation is problematic for continuing tasks<br />
because the final time step would be T =∞, and the return, which is what we are trying to<br />
maximize, could itself easily be infinite. (For example, suppose the agent receives a reward of +1<br />
at each time step.)<br />
The additional concept that we need is that of discounting. According to this approach, the agent<br />
tries to select actions so that the sum of the discounted rewards it receives over the future is<br />
maximized. In particular, it chooses a to maximize the expected discounted return:<br />
t<br />
where γ is a parameter, 0≤γ<br />
1<br />
∞<br />
2<br />
k<br />
t+ 1<br />
γ<br />
t+ 2<br />
γ<br />
t+ 3<br />
... γ<br />
t+ k+<br />
1<br />
k = 0<br />
R r r r r<br />
= + + + =∑ (7.16)<br />
≤ , called the discount rate.<br />
The discount rate determines the present value of future rewards: a reward received k time steps<br />
in the future is worth only<br />
k 1<br />
γ +<br />
times what it would be worth if it were received immediately. If<br />
γ < 1, the infinite sum has a finite value as long as the reward sequence { k }<br />
γ = 0<br />
r is bounded. If<br />
, the agent is "myopic" in being concerned only with maximizing immediate rewards: its<br />
objective in this case is to learn how to choose<br />
at<br />
so as to maximize only<br />
t 1<br />
r +<br />
. If each of the<br />
agent's actions happened to influence only the immediate reward, not future rewards as well,<br />
then a myopic agent could maximize by separately maximizing each immediate reward. But in<br />
© A.G.Billard 2004 – Last Update March 2011
173<br />
general, acting to maximize immediate reward can reduce access to future rewards so that the<br />
return may actually be reduced. As γ approaches 1, the objective takes future rewards into<br />
account more strongly: the agent becomes more farsighted. We can interpret γ in several ways.<br />
It can be seen as an interest rate, a probability of living another step, or as a mathematical trick to<br />
bound the infinite sum.<br />
Another optimality criterion is the average-reward model, in which the agent is supposed to take<br />
actions that optimize its long-run average reward:<br />
⎛⎛1<br />
lim E<br />
h→∞<br />
⎜⎜<br />
⎝⎝h<br />
h<br />
⎞⎞<br />
r ⎟⎟<br />
⎠⎠<br />
∑ (7.17)<br />
t<br />
t=<br />
0<br />
Such a policy is referred to as a gain optimal policy; it can be seen as the limiting case of the<br />
infinite-horizon discounted model as the discount factor approaches. One problem with this<br />
criterion is that there is no way to distinguish between two policies, one of which gains a large<br />
amount of reward in the initial phases and the other of which does not. Reward gained on any<br />
initial prefix of the agent's life is overshadowed by the long-run average performance. It is<br />
possible to generalize this model so that it takes into account both the long run average and the<br />
amount of initial reward than can be gained. In the generalized, bias optimal model, a policy is<br />
preferred if it maximizes the long-run average and ties are broken by the initial extra reward.<br />
7.3.3 Markov World<br />
A reinforcement-learning task is described as a Markov decision process, or MDP. If the state<br />
and action spaces are finite, then it is called a finite Markov decision process (finite MDP).<br />
A particular finite MDP is defined by its state and action sets and by the one-step dynamics of the<br />
environment. Given any state and action, s and a, the probability of each possible next state, s’, is<br />
{ }<br />
P = P s = s'| s = s,<br />
a = a<br />
(7.18)<br />
a<br />
ss' t+<br />
1 t t<br />
These quantities are called transition probabilities. Similarly, given any current state and action,<br />
s and a , together with any next state, s’, the expected value of the next reward is<br />
These quantities,<br />
P and<br />
a<br />
ss'<br />
{ | , , '}<br />
R = E r s = s a = a s = s (7.19)<br />
a<br />
ss' t+ 1 t t t+<br />
1<br />
R<br />
a<br />
ss'<br />
, completely specify the most important aspects of the dynamics of<br />
a finite MDP (only information about the distribution of rewards around the expected value is lost).<br />
Almost all reinforcement learning algorithms are based on estimating value functions--functions of<br />
states (or of state-action pairs) that estimate how good it is for the agent to be in a given state (or<br />
how good it is to perform a given action in a given state). The notion of "how good" here is<br />
© A.G.Billard 2004 – Last Update March 2011
174<br />
defined in terms of future rewards that can be expected, or, to be precise, in terms of expected<br />
return. Of course the rewards the agent can expect to receive in the future depend on what<br />
actions it will take. Accordingly, value functions are defined with respect to particular policies.<br />
A policy, π , is a mapping from each state, s∈ S , and action, a∈<br />
A( s)<br />
( sa , )<br />
π<br />
denoted V ( s)<br />
π<br />
we can define V ( s)<br />
, to the probability<br />
π of taking action a when in state s. Informally, the value of a state s under a policy π ,<br />
, is the expected return when starting in s and following π thereafter. For MDPs,<br />
formally as:<br />
∞<br />
π<br />
⎧⎧<br />
⎫⎫<br />
V ( s) = E { | } k<br />
π<br />
Rt st = s = Eπ ⎨⎨ γ rt+ k+<br />
1<br />
| st<br />
= s⎬⎬<br />
⎩⎩k=<br />
0<br />
⎭⎭<br />
∑ (7.20)<br />
where E π<br />
denotes the expected value given that the agent follows policy π , and t is any time<br />
step. Note that the value of the terminal state, if any, is always zero. We call the function V π the<br />
state-value function for policy π .<br />
π<br />
Similarly, we define the value of taking action a in state s under a policy π , denoted Q ( s,<br />
a)<br />
as the expected return starting from s, taking the action a, and thereafter following policy π :<br />
∞<br />
π<br />
⎧⎧<br />
⎫⎫<br />
Q ( s, a) = E { | , } t<br />
π<br />
Rt st = s at = a = Eπ ⎨⎨ γ rt+ k+<br />
1<br />
| st = s,<br />
at<br />
= a⎬⎬<br />
⎩⎩k=<br />
0<br />
⎭⎭<br />
∑ (7.21)<br />
,<br />
We call Q π the action-value function for policy π . The value functions V π and Q π can be<br />
estimated from experience.<br />
7.3.4 Estimating the policy<br />
We have defined optimal value functions and optimal policies. Clearly, an agent that learns an<br />
optimal policy has done very well, but in practice this rarely happens. For the kinds of tasks in<br />
which we are interested, optimal policies can be generated only with extreme computational cost.<br />
Even if we have a complete and accurate model of the environment's dynamics, it is usually not<br />
possible to simply compute an optimal policy. For example, board games such as chess are a<br />
tiny fraction of human experience, yet large, custom-designed computers still cannot compute the<br />
optimal moves. A critical aspect of the problem facing the agent is always the computational<br />
power available to it, in particular, the amount of computation it can perform in a single time step.<br />
The memory available is also an important constraint. A large amount of memory is often required<br />
to build up approximations of value functions, policies, and models. In tasks with small, finite state<br />
sets, it is possible to form these approximations using arrays or tables with one entry for each<br />
state (or state-action pair). This, we call the tabular case, and the corresponding methods we call<br />
tabular methods. In many cases of practical interest, however, there are far more states than<br />
could possibly be entries in a table. In these cases the functions must be approximated, using<br />
some sort of more compact parameterized function representation.<br />
One must, thus, turn towards approximation techniques. In approximating optimal behavior, there<br />
may be many states that the agent faces with such a low probability that selecting sub optimal<br />
actions for them has little impact on the amount of reward the agent receives. The on-line nature<br />
© A.G.Billard 2004 – Last Update March 2011
175<br />
of reinforcement learning makes it possible to approximate optimal policies in ways that put more<br />
effort into learning to make good decisions for frequently encountered states, at the expense of<br />
less effort for infrequently encountered states.<br />
There exist three main methods for estimating the optimal policy. These are: dynamic<br />
programming, Monte Carlo methods, and temporal-difference learning. Covering these methods<br />
in details goes beyond the scope of this class. A brief summary of the principles can be found in<br />
the slides of the class. The interested reader might refer to [Sutton & Barto, 1998]. Next is a quick<br />
summary of the key notion of RL, which should be retained from this very introductory course.<br />
7.3.5 Summary<br />
Reinforcement learning is about learning from interaction how to behave in order to achieve a<br />
goal. The reinforcement learning agent and its environment interact over a sequence of discrete<br />
time steps. The specification of their interface defines a particular task: the actions are the<br />
choices made by the agent; the states are the basis for making the choices; and the rewards are<br />
the basis for evaluating the choices. Everything inside the agent is completely known and<br />
controllable by the agent; everything outside is incompletely controllable but may or may not be<br />
completely known. A policy is a stochastic rule by which the agent selects actions as a function of<br />
states. The agent's objective is to maximize the amount of reward it receives over time.<br />
The return is the function of future rewards that the agent seeks to maximize. It has several<br />
different definitions depending upon the nature of the task and whether one wishes to discount<br />
delayed reward. The undiscounted formulation is appropriate for episodic tasks, in which the<br />
agent-environment interaction breaks naturally into episodes; the discounted formulation is<br />
appropriate for continuing tasks, in which the interaction does not naturally break into episodes<br />
but continues without limit.<br />
A policy's value functions assign to each state, or state-action pair, the expected return from that<br />
state, or state-action pair, given that the agent uses the policy. The optimal value functions assign<br />
to each state, or state-action pair, the largest expected return achievable by any policy. A policy<br />
whose value functions are optimal is an optimal policy. Whereas the optimal value functions for<br />
states and state-action pairs are unique for a given MDP, there can be many optimal policies. Any<br />
policy that is greedy with respect to the optimal value functions must be an optimal policy. The<br />
Bellman optimality equations are special consistency condition that the optimal value functions<br />
must satisfy and that can, in principle, be solved for the optimal value functions, from which an<br />
optimal policy can be determined with relative ease.<br />
A reinforcement-learning problem can be posed in a variety of different ways depending on<br />
assumptions about the level of knowledge initially available to the agent. In problems of complete<br />
knowledge, the agent has a complete and accurate model of the environment's dynamics. If the<br />
environment is an MDP, then such a model consists of the one-step transition probabilities and<br />
expected rewards for all states and their allowable actions. In problems of incomplete knowledge,<br />
a complete and perfect model of the environment is not available.<br />
Even if the agent has a complete and accurate environment model, the agent is typically unable<br />
to perform enough computation per time step to fully use it. The memory available is also an<br />
important constraint. Memory may be required to build up accurate approximations of value<br />
functions, policies, and models. In most cases of practical interest there are far more states than<br />
could possibly be entries in a table, and approximations must be made.<br />
A well-defined notion of optimality organizes the approach to learning we describe in this book<br />
and provides a way to understand the theoretical properties of various learning algorithms, but it<br />
is an ideal that reinforcement learning agents can only approximate to varying degrees. In<br />
© A.G.Billard 2004 – Last Update March 2011
176<br />
reinforcement learning we are very much concerned with cases in which optimal solutions cannot<br />
be found but must be approximated in some way.<br />
Policy<br />
Rewar<br />
d<br />
Value<br />
Figure 7-7: Reinforcement learning is characterized by:<br />
❐ Policy: what to do<br />
❐ Reward: what is good<br />
❐ Value function: what is good because it predicts reward<br />
❐ Model: what follows what<br />
Model<br />
environmen of<br />
t<br />
© A.G.Billard 2004 – Last Update March 2011
177<br />
8 Genetic Algorithms<br />
We conclude these Lecture Notes by covering Genetic Algorithms, a form of stochastic<br />
optimization that can be used to learn parameters of several of the methods seen previously in<br />
these notes. This introduction to Genetic Algorithms is very brief and serves only as a brief<br />
overview of the main concepts.<br />
The term genetic algorithm refers to a model introduced by John Holland in 1975 [Holland, 1975].<br />
Genetic Algorithms are a family of computational models inspired by Darwin’s principle of<br />
selective evolution. The algorithms encode a potential solution to a specific problem on a simple<br />
chromosome-like data structure and apply recombination operators to these structures so as to<br />
preserve critical information.<br />
An implementation of a genetic algorithm begins with a population of typically random<br />
chromosomes. One, then, evaluates these structures and allocates reproductive opportunities in<br />
such a way that those chromosomes, which represent a better solution to the target problem, are<br />
given more chances to reproduce than those chromosomes, which are poorer solutions. The<br />
“goodness” of a solution is typically defined with respect to the current population.<br />
Genetic algorithms are often viewed as optimization tool, although the range of problems to which<br />
genetic algorithms have been applied is quite broad and goes beyond simple function<br />
optimization. They are used to find solutions to complex systems in domains such as:<br />
• Finances: Market predictors, risk evaluators<br />
• Business: Scheduling, time and storage optimization<br />
• Engineering: Dynamics of particles, fluids, etc.<br />
© A.G.Billard 2004 – Last Update March 2011
178<br />
• Biological Sciences: Dynamics of groups<br />
In Robotics, GA have been used successfully to optimize parameters of controllers in order to<br />
evolve the Artificial Neural Networks Controllers. The GA is used to determine the weights or the<br />
topology of the network.<br />
8.1 Principle<br />
Genetic Algorithms provide a form of simulated evolution. The basic idea goes along the following<br />
steps:<br />
• Start from a basic random population of parents<br />
• Apply a process of selection<br />
• Breed pairs of parents<br />
• Produce pairs of children with only the good properties of the parents<br />
• Reject bad children<br />
The process leads to the evolution of a population of children that are better than the parents.<br />
8.2 Encoding<br />
To use a genetic algorithm, you must encode solutions to your problem in a structure that can be<br />
stored in the computer. This object is a genome (or chromosome). Thus, the first step before<br />
using a GA consists in a) defining a representation of the problem (this is often the most difficult<br />
step, as it requires some a priori knowledge on where the important features of the problem lie);<br />
b) defining the parameters to optimize (e.g. the weights in a neural networks); c) encoding the<br />
parameters into a chromosome; and d) creating a whole population, i.e. generate several random<br />
chromosomes.<br />
You can use any representation for the individual genomes in the genetic algorithm. Holland<br />
worked primarily with strings of bits, but you can use arrays, trees, lists, or any other object.<br />
© A.G.Billard 2004 – Last Update March 2011
179<br />
However, you must define genetic operators (initialization, mutation, crossover, comparison) for<br />
any representation that you decide to use<br />
Each chromosome must represent a complete solution to the problem you are trying to<br />
optimize.<br />
8.3 Breeding and Selection<br />
In order to evaluate the goodness of each solution, you must define a selection criterion. This<br />
criterion is often referred to as the fitness function. The rest of the algorithm will breed the<br />
chromosomes, so as to maximize the fitness function. Applying iteratively crossover and<br />
mutation to the chromosomes in the population to generate new solutions does this.<br />
Figure 8-1: Crossover: Given 2 selected chromosomes; genetic material is swapped between them around<br />
a selected point.<br />
Typically crossover is defined so that two individuals (the parents) combine to produce two more<br />
individuals (the children). But you can define asexual crossover or single-child crossover as well.<br />
The primary purpose of the crossover operator is to get genetic material from the previous<br />
generation to the subsequent generation.<br />
© A.G.Billard 2004 – Last Update March 2011
180<br />
Figure 8-2: Mutation: Each location is mutated with a very small probability. When using a binary encoding,<br />
mutation let the bit go from 0 to 1 or vice-versa. In real number encoding, mutation adds or substracts a<br />
small random number.<br />
The mutation operator introduces a certain amount of randomness to the search. It can help the<br />
search find solutions that crossover alone might not encounter.<br />
Subsequently, GA uses various selection criteria so as to pick the best individuals for mating (and<br />
subsequent crossover), based on the value returned by the fitness function. For instance, parents<br />
can be chosen with some probability depending on:<br />
• their fitness (Roulette-wheel selection)<br />
• their rank according to the fitness (Rank-based selection)<br />
The selection method determines how individuals are chosen for mating. If you use a selection<br />
method that picks only the best individual, then the population will quickly converge to that<br />
individual. So the selector should be biased toward better individuals, but should also pick some<br />
that are not quite as good (but hopefully have some good genetic material in them).<br />
Some of the more common methods include roulette wheel selection (the likelihood of picking an<br />
individual is proportional to the individual's score), tournament selection (a number of individuals<br />
are picked using roulette wheel selection, then the best of these is (are) chosen for mating), and<br />
rank selection (pick the best individual every time). Threshold selection can also be effective.<br />
© A.G.Billard 2004 – Last Update March 2011
181<br />
Often the crossover operator and selection method are too effective and they end up driving the<br />
genetic algorithm to create a population of individuals that are almost exactly the same. When the<br />
population consists of similar individuals, the likelihood of finding new solutions typically<br />
decreases.<br />
On one hand, you want the genetic algorithm to find good individuals, but on the other you want it<br />
to maintain diversity. A common problem in optimization (not just genetic algorithms) is how to<br />
define an objective function that accurately (and consistently) captures the effects of multiple<br />
objectives.<br />
In general, genetic algorithms are better than gradient search methods if your search space has<br />
many local optima. Since the genetic algorithm traverses the search space using the genotype<br />
rather than the phenotype, it is less likely to get stuck on a local high or low.<br />
8.4 The Algorithm<br />
In summary, the Genetic Algorithm goes as follows:<br />
1. Define a basic population of chromosomes.<br />
2. Evaluate the fitness of each chromosome.<br />
3. Select parents with a probability (rank-based, roulette-wheel)<br />
4. Breed pairs of parents (cross-over).<br />
5. Apply mutation on children.<br />
6. Evaluate fitness of children.<br />
7. Population size is kept constant through a rejection process. Throw away the worst solutions of<br />
the old population or of the old population + the new children.<br />
8. Start again at point 3.<br />
9. The GA stops when either satisfactory level of fitness is attained, or when the population is<br />
uniform (local minima).<br />
8.5 Convergence<br />
There is, to this day, no theoretical proof that a GA will eventually converge, nor that it will<br />
converge to the global optimum of the fitness function. There are, however, a number of “rules of<br />
thumb” that one might follow to ensure good performance of the algorithm.<br />
Convergence of a GA depends on choosing correctly the parameters. One should keep in mind<br />
the following:<br />
• If the mutation is too small (not frequent enough and making small steps), there will not be<br />
enough exploration. Hence, the algorithm might get stuck in some local optimum.<br />
• If, conversely, the mutation is too strong (too frequent and too important steps), the algorithm<br />
will be very slow to converge.<br />
• Cross-over can slow down convergence, by destroying good solutions.<br />
• Convergence depends importantly on the encoding and on the location of the genes on the<br />
chromosomes.<br />
• The number of “children” produced at each generation determines the speed at which one<br />
explores the environment.<br />
© A.G.Billard 2004 – Last Update March 2011
182<br />
9 Annexes<br />
9.1 Brief recall of basic transformations from linear algebra<br />
9.1.1 Eigenvalue Decomposition<br />
The decomposition of a square matrix A into eigenvalues and eigenvectors is known as eigen<br />
decomposition. The fact that this decomposition is always possible as long as the matrix<br />
consisting of the eigenvectors of A is square is known as the eigen decomposition theorem.<br />
r n<br />
Let A be a linear transformation represented by a matrix A . If there is a vector x ∈ ≠0<br />
that<br />
r r<br />
Ax = λx<br />
° such<br />
(8.1)<br />
for some scalar λ , then λ is called the eigenvalue of A with corresponding (right) eigenvector<br />
x r .<br />
Letting A be a k× k square matrix:<br />
⎡⎡a a ... a<br />
⎢⎢<br />
⎢⎢<br />
a a ... a<br />
⎢⎢...<br />
⎢⎢<br />
⎣⎣a a ... a<br />
11 12 1k<br />
21 22 2k<br />
k1 k2<br />
kk<br />
⎤⎤<br />
⎥⎥<br />
⎥⎥<br />
⎥⎥<br />
⎥⎥<br />
⎦⎦<br />
(8.2)<br />
with eigenvalue λ , then the corresponding eigenvectors satisfy<br />
⎡⎡a11 a12 ... a1 k ⎤⎤⎡⎡x1⎤⎤ ⎡⎡x1⎤⎤<br />
⎢⎢<br />
a21 a22 ... a<br />
⎥⎥⎢⎢<br />
2k<br />
x<br />
⎥⎥ ⎢⎢<br />
2<br />
x<br />
⎥⎥<br />
⎢⎢ ⎥⎥⎢⎢ ⎥⎥ 2<br />
= λ ⎢⎢ ⎥⎥<br />
⎢⎢...<br />
⎥⎥⎢⎢... ⎥⎥ ⎢⎢...<br />
⎥⎥<br />
⎢⎢ ⎥⎥⎢⎢ ⎥⎥ ⎢⎢ ⎥⎥<br />
a a ... a x x<br />
⎣⎣ k1 k2<br />
kk⎦⎦⎣⎣ k⎦⎦ ⎣⎣ k⎦⎦<br />
(8.3)<br />
which is equivalent to the homogeneous system<br />
⎡⎡a11- λ a12 ... a1 k ⎤⎤⎡⎡x1<br />
⎤⎤ ⎡⎡0<br />
⎤⎤<br />
⎢⎢<br />
a21 a22- λ ... a<br />
⎥⎥⎢⎢<br />
2k<br />
x<br />
⎥⎥ ⎢⎢<br />
2<br />
0<br />
⎥⎥<br />
⎢⎢ ⎥⎥⎢⎢ ⎥⎥=<br />
⎢⎢ ⎥⎥<br />
⎢⎢...<br />
⎥⎥⎢⎢...<br />
⎥⎥ ⎢⎢...<br />
⎥⎥<br />
⎢⎢ ⎥⎥⎢⎢ ⎥⎥ ⎢⎢ ⎥⎥<br />
a a ... a -λ<br />
x ⎣⎣0<br />
⎦⎦<br />
⎣⎣ k1 k2<br />
kk ⎦⎦⎣⎣ k ⎦⎦<br />
(8.4)<br />
Equation (8.4) can be written compactly as<br />
© A.G.Billard 2004 – Last Update March 2011
183<br />
( A λI) x 0<br />
− = (8.5)<br />
where I is the identity matrix. As shown in Cramer's rule, a linear system of equations has<br />
nontrivial solutions iff the determinant vanishes, so the solutions of equation (8.5) are given by<br />
( A λI)<br />
det − = 0<br />
(8.6)<br />
This equation is known as the characteristic equation of A , and the left-hand side is known as the<br />
characteristic polynomial.<br />
For example, for a 2× 2 matrix, the eigenvalues are<br />
1<br />
λ ( ) ( ) 2<br />
±<br />
=<br />
⎡⎡<br />
a11 + a22 ± 4a12a21 + a11 −a<br />
⎤⎤<br />
22<br />
2 ⎢⎢⎣⎣<br />
⎥⎥⎦⎦<br />
(8.7)<br />
which arises as the solutions of the characteristic equation.<br />
( ) ( )<br />
2<br />
x x a11 a22 a11a22 a12a21 0<br />
− + + − = (8.8)<br />
If all k eigenvalues are different, then plugging these back in gives k − 1 independent equations<br />
for the k components of each corresponding eigenvector, and the system is said to be<br />
nondegenerate. If the eigenvalues are n-fold degenerate, then the system is said to be<br />
degenerate and the eigenvectors are not linearly independent. In such cases, the additional<br />
constraint that the eigenvectors be orthogonal,<br />
XX<br />
i j<br />
= Xi X<br />
j<br />
δij<br />
(8.9)<br />
where δij<br />
is the Kronecker delta, can be applied to yield n additional constraints, thus allowing<br />
solution for the eigenvectors.<br />
If all the eigenvectors are linearly independent, then the eigenvalue decomposition<br />
A= XΛ X −1<br />
(8.10)<br />
Where the columns of X are composed of the eigenvectors of A and Λ is a diagonal matrix<br />
composed of the associated eigenvalues.<br />
© A.G.Billard 2004 – Last Update March 2011
184<br />
9.1.2 Singular Value Decomposition (SVD)<br />
When the eigenvectors are not linearly independent, then X does not have an inverse (it is thus<br />
singular) and such decomposition does not exist. The eigenvalue decomposition consists then in<br />
finding a similarity transformation such that:<br />
A= UΛ V<br />
(8.11)<br />
With UV , two orthogonal (if real) or unitary (if complex) matrices and Λ a diagonal matrix. Such<br />
decomposition is called singular value decomposition (SVD). SVD are useful in sofar that A<br />
represents the mapping of a n-dimensional space onto itself, where n is the dimension of A.<br />
#<br />
An alternative to SVD is to compute the Moore-Penrose Pseudoinverse A of the non invertible<br />
#<br />
matrix A and then exploit the fact that, for a pair of vectors z and c, z = A c is the shortest length<br />
least-square solution to the problem Az = c . Methods such as PCA that find the optimal (in a<br />
least-square sense) projection of a dataset can be approximated using the pseudoinverse when<br />
the transformation matrix is singular.<br />
9.1.3 Frobenius Norm<br />
The Frobenius norm of an m× nmatrix A is given by:<br />
A<br />
F<br />
m<br />
n<br />
i= 1 j=<br />
1<br />
ij<br />
2<br />
= ∑∑ a<br />
(8.12)<br />
9.2 Recall of basic notions of statistics and probabilities<br />
9.2.1 Probabilities<br />
Consider two variables x and y taking discrete values over the intervals [x 1 ,…, x M ] and [y 1 ,…, y N ]<br />
respectively, then P( x=<br />
x i ) is the probability that the variable x takes value x i<br />
, with:<br />
i) 0 ≤ P( x= x ) ≤1, ∀ i=<br />
1,..., M,<br />
M<br />
∑<br />
i=<br />
1<br />
( x )<br />
ii) P x= = 1.<br />
i<br />
i<br />
( j )<br />
The same two above properties applies to the probabilities P y= y , ∀ j=<br />
1,... N.<br />
Some properties follow from the above:<br />
Let P( x= a)<br />
be the probability that the variable x will take the value a. If P( x a) 1<br />
= = , x is a<br />
constant with value a. If x is an integer and can take any value a between [1, N]<br />
∈• with equal<br />
1<br />
probability, then the probability that x takes value a is Px ( = a)<br />
=<br />
N<br />
© A.G.Billard 2004 – Last Update March 2011
185<br />
Joint probability:<br />
The joint probability that the two events A (variable x takes value a) and B (variable y takes value<br />
b) occur is expressed as:<br />
( )<br />
( , ) ( ) ( ) ( )<br />
P A B = P A∩ B = P x= a ∩ y= b<br />
(8.13)<br />
Conditional probability:<br />
P(A | B) is the conditional probability that event A will take place if event B already took place<br />
( | )<br />
P A B<br />
( ∩ B)<br />
P( B)<br />
P A<br />
= (8.14)<br />
It follows that:<br />
( ) ( | ) ( )<br />
P A∩ B = P A B P B<br />
(8.15)<br />
By the same reasoning, we have:<br />
( ) ( | ) ( )<br />
P A∩ B = P B A P A<br />
(8.16)<br />
Hence,<br />
( | ) ( ) P( B|<br />
A) P( A)<br />
P A B P B<br />
= (8.17)<br />
Bayes' theorem:<br />
( | )<br />
P A B<br />
( | ) ( )<br />
P( B)<br />
P B A P A<br />
= (8.18)<br />
Marginal Probability:<br />
The so-called marginal probability that variable x will take value x i is given by:<br />
N<br />
∑ (8.19)<br />
P( x= x) = P( x= x, y=<br />
y )<br />
x i i j<br />
j=<br />
1<br />
To compute the marginal, one needs to know the joint distribution of variables x and y. Often, one<br />
does not know it and one can only estimate it. Note that if x is a multidimensional variate, then the<br />
marginal is a joint distribution over the variate spanned by x.<br />
The joint distribution is far richer than the marginals. The marginals of N variables taking K values<br />
corresponds to N(K-1) probabilities, while their joint distribution corresponds to K N-1 probabilities.<br />
© A.G.Billard 2004 – Last Update March 2011
186<br />
9.2.2 Probability Distributions, Probability Density Function<br />
p(x) a continuous function is the probability density function or probability distribution function<br />
(PDF) (sometimes also called probability distribution or simply density) of variable x. p(x) must be<br />
Lebesgue integrable and :<br />
f(x) is the probability distribution (also called the probability density function or the probability<br />
distribution function) of variable x. f is a non-negative and normalized function:<br />
px ( ) ≥0,<br />
∫<br />
∞<br />
−∞<br />
∀x<br />
p( x) dx = 1<br />
9.2.3 Distribution Function or Cumulative Distribution Function<br />
* *<br />
The distribution function D( x ) P( x x )<br />
= ≤ also called the cumulative distribution function<br />
(CDF) describes the probability that a variate X takes on value less than or equal to a number x. If<br />
p(x) is the probability density function of x then:<br />
d<br />
P x p x dx p x P x<br />
dx<br />
( ) = ( ) ⇒ ( ) = ( )<br />
∫<br />
(8.20)<br />
p(x) dx ~ probability of x to fall within an infinitesimal interval [x, x + dx].<br />
The probability that the variable x takes a value in the subinterval [a,b] is equal to:<br />
Pa ( ≤ x≤ b) =∫ f( xdx )<br />
b<br />
a<br />
The expectation of x, E(x), is the mean µ of its distribution:<br />
µ = Ex () = ∫ x⋅ f()<br />
x⋅dx<br />
(8.21)<br />
If x follows a discrete distribution, then:<br />
The variance<br />
mean:<br />
µ = Ex ( ) =∑ xf( x)<br />
(8.22)<br />
i<br />
i<br />
2<br />
σ of a distribution measures the amount of spread of the distribution around its<br />
2<br />
(( ) ) ( ) ( ) 2<br />
2 2<br />
σ Var( x)<br />
E x µ E x ⎡⎡E x ⎤⎤<br />
i<br />
= = − = − ⎣⎣ ⎦⎦<br />
(8.23)<br />
σ is the standard deviation of x.<br />
© A.G.Billard 2004 – Last Update March 2011
187<br />
The two most classical distribution probabilities are:<br />
• The Uniform distribution. The simplest forms is when x is a constant p( x) = a, ∀ x<br />
It can also be represented by a step function.<br />
• The Gaussian or Normal distribution p( x)<br />
1<br />
= e<br />
σ 2π<br />
⎛⎛<br />
⎜⎜−<br />
⎜⎜<br />
⎝⎝<br />
( x−µ<br />
) 2<br />
To emphasize that the pdf depends on the definition of the mean and covariance, one<br />
sometimes writes p( x µσ )<br />
| , .<br />
• The multi-dimensional Gaussian or Normal distribution has a pdf given by:<br />
2σ<br />
2<br />
⎞⎞<br />
⎟⎟<br />
⎟⎟<br />
⎠⎠<br />
( | µ , )<br />
p x<br />
∑ =<br />
( 2π<br />
)<br />
1<br />
N 1<br />
2 2<br />
T −<br />
( −( x−µ ) ∑ 1 ( x−µ<br />
))<br />
if x is N-dimensional, then<br />
µ is a N − dimensional mean vector<br />
∑ is a N×<br />
N covariance matrix<br />
∑<br />
e<br />
Figure 9-1: A 2-dimensional Gaussian distribution. The 2D oval-shape representation (left) is done by<br />
projecting the density onto the 2D axes of the variate X. The color code represent surface of 1 standard<br />
deviation (std) in red, 2 std in light blue, 3 std in darker blue, etc.<br />
9.2.4 Marginal Probability Distribution or Marginal Density<br />
Consider two random variables x and y with joint distribution p(x,y), then the marginal density of x<br />
is givenby:<br />
( ) ( , )<br />
px<br />
x = ∫ p x y dy<br />
© A.G.Billard 2004 – Last Update March 2011
188<br />
Figure 9-2: How the Joint, Marginal, and Conditional distributions are related in a bi-dimensional Gaussian<br />
T −<br />
−( z−µ ) ∑ 1 ( z−µ<br />
)<br />
1<br />
p( z = x, y | µ , ∑ ) = e<br />
N 1<br />
2 ∑ 2<br />
distribution { }<br />
( 2π<br />
)<br />
( )<br />
9.2.5 Likelihood<br />
( µσ x) = p( x µσ)<br />
( )<br />
For a parametrized density p x| µσ , , with parameters µσ , ,<br />
the Likelihood Function is the likelihood of the data given the parameters:<br />
L , | | , .<br />
If The likelihood function (short – likelihood) of the model parameters is given by:<br />
9.2.6 Probabilistic Independence<br />
Two events A and B are statistically independent iff the conditional probability of A given B<br />
( | ) = P( A)<br />
P A B<br />
in which case the probability of A and B is just<br />
P( A∩ B) = P( A) ⋅ P( B)<br />
(8.24)<br />
© A.G.Billard 2004 – Last Update March 2011
189<br />
9.2.7 Statistical Independence<br />
If y 1 and y 2 are two variables, generated by a random distribution p i (y i ) with zero-mean, then y 1<br />
and y 2 are said to be mutually independent, if their joint density p(y 1 , y 2 ) is equal to the product of<br />
their density functions:<br />
pyy ( ) = py ( ) py ( )<br />
(8.25)<br />
1, 2 1 2<br />
9.2.8 Uncorrelatedness<br />
y 1 and y 2 are said to be uncorrelated, if their covariance is zero ( y y )<br />
cov , 0<br />
1 2<br />
= . If the variables<br />
are generated by a distribution with zero means, then uncorrelatedness is equal to product of<br />
their separate expectations:<br />
( ) ( ) ( )<br />
cov( yy) = E yy − E y E y = 0<br />
(8.26)<br />
1, 2 1, 2 1 2<br />
E( y y ) E( y ) E( y )<br />
= (8.27)<br />
1, 2 1 2<br />
Independence is in general a much stronger requirement than uncorrelatedness. Indeed, if the y i<br />
are independent, one has<br />
E( f y f y ) = E( f y ) E( f y )<br />
(8.28)<br />
( ) ( ) ( ) ( )<br />
1 2 1 2<br />
for any functions f 1 and f 2 .<br />
Independence and uncorrelatedness are equivalent when y 1 and y 2 have a joint Gaussian<br />
distribution. The notion of independence depends, thus, on the definition of the probability<br />
distribution of any given variables.<br />
9.3 Information Theory<br />
The mathematical formalism for measuring the information content, I, of an arbitrary<br />
measurement I is due largely to a seminal 1948 paper by Claude E. Shannon. Within the context<br />
of sending and receiving messages in a communication system, Shannon was interested in<br />
finding a measure of the information content of a received message. Shannon’s measure of<br />
information aimed at conveying the impression that an unlikely event contains more information<br />
than a likely event. The information content of an outcome x is defined to be:<br />
where P(x) is the probability of x.<br />
( )<br />
I x<br />
1<br />
= log2 =− log2<br />
P( x)<br />
(8.29)<br />
P x<br />
( )<br />
© A.G.Billard 2004 – Last Update March 2011
190<br />
Shannon’s information measure is binary coded. To get an intuitive feeling of this concept,<br />
consider the case where the probability of x is uniform over the interval [1, 2]∈• . Then, the<br />
information conveyed in the observed event x=1 is equal to:<br />
1<br />
I( x= 1) =− log2 = log22=<br />
1<br />
2<br />
If, on the other hand, x is uniformly distributed over the interval [1,8]∈• , making each of the<br />
occurrences of x 3 times less likely. Then, the information conveyed in observing x=1, is 3 times<br />
more important:<br />
( )<br />
3<br />
I x= 1 = log 8= log 2 = 3<br />
2 2<br />
9.3.1 Entropy<br />
The notion of information is tightly linked to the physics notion of entropy. The entropy of the<br />
information on x is a measure of the uncertainty or of the information content of a set of N<br />
observations of x:<br />
N<br />
=−∑ (8.30)<br />
( ) ( ) log ( )<br />
H x P x P x<br />
i=<br />
1<br />
If we take again our earlier example, the entropy of x, when x is uniform over the interval [1,2] is<br />
equal to<br />
( )<br />
H x<br />
2<br />
1 1<br />
=− ∑ log2<br />
= 1<br />
2 2<br />
i=<br />
1<br />
. If now, we choose a non uniform distribution of probability for x, wher<br />
H x<br />
⎛⎛1 1 3 3⎞⎞<br />
=− ⎜⎜ log + log ⎟⎟=<br />
0.8<br />
⎝⎝4 4 4 4⎠⎠<br />
e P(x=1)=1/4 and P(x=2)=3/4, then ( ) 2 2<br />
Thus, there is more uncertainty in a situation where every outcome is equally probable.<br />
.<br />
In the continuous case, one defines the differential entropy of a distribution f of a random variable<br />
x as:<br />
h x =−∫ f x log f x dx<br />
(8.31)<br />
( ) ( ) ( )<br />
S<br />
where S is the support set of x. For instance, consider the case where x is uniformly distribution<br />
between [0,a], so that its density function is<br />
Then, its differential entropy is:<br />
f<br />
( x)<br />
⎧⎧1<br />
if 0 ≤ x≤a<br />
⎪⎪a<br />
= ⎨⎨<br />
⎪⎪ 1<br />
if a < x≤ a+<br />
b<br />
⎪⎪⎩⎩ b<br />
,<br />
© A.G.Billard 2004 – Last Update March 2011
191<br />
1 1 1 1<br />
h x ∫ a b a b<br />
0<br />
a a<br />
∫ a<br />
b b<br />
a<br />
a+<br />
b<br />
( ) =− log − log = log + log = log ( ⋅ )<br />
This definition is appealing, as, if a or b have a large value, the spread of the distribution will be<br />
large.<br />
One can show that the Gaussian distribution is the distribution with maximal entropy for a given<br />
variance. In other words, this means that the gaussian distribution is the ``most random'' or the<br />
least structured of all distributions. Entropy is small for distributions that are clearly concentrated<br />
on certain values, i.e., when the variable is clearly clustered, or has a probability distribution<br />
function that is very ``spiky''.<br />
9.3.2 Joint and conditional entropy<br />
If x and y are two random variables taking values between [0, I] ∈• and [0, J]<br />
∈•<br />
respectively, and pi (, j ) the joint probability that x takes value I and y takes value j, then the<br />
entropy of the joint distribution is equal to:<br />
=−∑ (8.32)<br />
H( x, y) P( i, j)log P( i, j)<br />
i,<br />
j<br />
We can then derive the equation for the conditional entropy.<br />
∑<br />
H( x| y) =− P( j) H( x| y = j)<br />
j<br />
∑<br />
= − P( j) P( i| j)log P( i| j)<br />
j<br />
∑<br />
= − Pi ( , j)log Pi ( | j)<br />
i,<br />
j<br />
∑<br />
i<br />
Finally, conditional and joint entropy can be related as follows:<br />
( ) ( )<br />
Hxy (, ) = H x+ H yx |<br />
(8.33)<br />
Moreover, if the two variables are independent, then the entropy is additive:<br />
H( x, y) = H( x) + H( y) iff P( x, y) = P( x) P( y)<br />
9.3.3 Mutual Information<br />
The mutual information between two random variables x and y is denoted by<br />
© A.G.Billard 2004 – Last Update March 2011
192<br />
( ) ( )<br />
( ) H( x|<br />
y)<br />
( ) ( ) ( , )<br />
I( x, y) = H x −H y|<br />
x<br />
= H y −<br />
= H x + H y −H x y<br />
(8.34)<br />
Mutual information is a natural measure of the dependence between random variables. If the<br />
variables are independent, they provide no information on each other. An important property<br />
of mutual information is that one can define an invertible linear transformation<br />
y= Wx, s.t. I( y) = H( y) −H( x) − log detW<br />
9.3.4 Relation to mutual information<br />
Mutual information can be related to the notion of correlation through canonical correlation<br />
analysis. Since information is additive for statistically independent variables and since canonical<br />
variates are uncorrelated, the mutual information between two independent variate x and y is the<br />
sum of mutual information between all the canonical variates xi<br />
and y (i.e. the canonical<br />
i<br />
projections of x and y). For Gaussian variables this means:<br />
⎛⎛ ⎞⎞<br />
1 ⎜⎜ 1 ⎟⎟ 1 ⎛⎛ 1 ⎞⎞<br />
I( x; y)<br />
= log log<br />
2 2<br />
2<br />
⎜⎜<br />
( 1 ρ<br />
⎟⎟=<br />
∑ ⎜⎜ ⎟⎟<br />
⎜⎜∏<br />
− ) 2<br />
i ⎟⎟<br />
i ⎜⎜( 1−ρi<br />
) ⎟⎟<br />
⎝⎝<br />
⎝⎝ ⎠⎠<br />
i ⎠⎠<br />
(8.35)<br />
9.3.5 Kullback-Leibler Distance<br />
The most common method to measure the difference between two probability distributions p and<br />
q is to us the Kullback-Leibler distance (DKL), sometimes known as relative entropy:<br />
DKL is always positive ( )<br />
( )<br />
( )<br />
( )<br />
( )<br />
pi ⎛⎛ pi⎞⎞<br />
D( p|| q) = p( i)<br />
log = E<br />
log<br />
i qi ⎜⎜<br />
qi ⎟⎟<br />
⎝⎝ ⎠⎠<br />
D p|| q ≥ 0<br />
∑ (8.36)<br />
. It is zero if and only if p=q, i.e. if the variables are<br />
statistically independent. Note that in general the relative entropy or DKL is not symmetric under<br />
interchange of the distributions p and q: in general D( p|| q) ≠ D( q||<br />
p)<br />
. Hence, DKL is not<br />
strictly a distance. The measure of relative entropy is very important in pattern recognition and<br />
neural networks, as well as in information theory, as will be shown in other parts of this class.<br />
© A.G.Billard 2004 – Last Update March 2011
193<br />
9.4 Estimators<br />
9.4.1 Gradient descent<br />
(from Mathworld)<br />
Gradient descent is an incremental hill-climbing algorithm that approaches a minimum or<br />
maximum of a function by taking steps proportional to the gradient at the current point.<br />
An algorithm for finding the nearest local minimum of a function, which presupposes that the<br />
gradient of the function can be computed. The method of steepest descent, also called the<br />
gradient descent method, starts at a point P<br />
i +<br />
and, as many times as needed, moves from P<br />
1<br />
i<br />
to<br />
−∇ the local downhill gradient.<br />
P +<br />
by minimizing along the line extending from ( )<br />
i 1<br />
f P i<br />
When applied to a 1-dimensional function f(x), the method takes the form of iterating<br />
( )<br />
x = x − ε f x<br />
(8.37)<br />
i i−1 i−1<br />
from a starting point<br />
0<br />
x for small ε > 0<br />
above for the functions ( )<br />
3 2<br />
until a fixed point is reached. The results are illustrated<br />
f x = x − 2x<br />
+ 2 with ε = 0.1and starting point x<br />
0<br />
= 2 and 0.01,<br />
respectively.<br />
This method has the severe drawback of requiring a great many iterations for functions, which<br />
have long, narrow valley structures. In such cases, a conjugate gradient method is preferable.<br />
© A.G.Billard 2004 – Last Update March 2011
194<br />
9.4.2 Conjugate Gradient descent<br />
The conjugate gradient method is an algorithm for finding the nearest local minimum of a function<br />
of n variables, which presupposes that the gradient of the function can be computed. It uses<br />
conjugate directions instead of the local gradient for going downhill. If the vicinity of the minimum<br />
has the shape of a long, narrow valley, the minimum is reached in far fewer steps than would be<br />
the case using the method of steepest descent.<br />
The conjugate gradient method is an effective method for symmetric positive definite systems. It<br />
is the oldest and best-known non-stationary method. The method proceeds by generating vector<br />
sequences of iterates (i.e., successive approximations to the solution), residuals corresponding to<br />
the iterates, and searches directions used in updating the iterates and residuals. Although the<br />
length of these sequences can become large, only a small number of vectors need to be kept in<br />
memory. At each iteration step of the method, two inner products are performed in order to<br />
compute update scalars that are defined to make the sequences satisfy specific orthogonality<br />
conditions. On a symmetric positive definite linear system these conditions imply that the distance<br />
to the true solution is minimized in some norm.<br />
© A.G.Billard 2004 – Last Update March 2011
195<br />
9.4.2.1 Maximum Likelihood<br />
Machine learning techniques often assume that the form of the distribution function is known and<br />
that sole its parameters must be optimized to fit at best a set of observed datapoints. It then<br />
proceeds to determine these parameters through maximum likelihood optimization.<br />
The principle of maximum likelihood consists of finding the optimal parameters of a given<br />
distribution by maximizing the likelihood function of these parameters, equivalently by maximizing<br />
the probability of the data given the model and its parameters, e.g.:<br />
The method of maximum likelihood is a method of point estimation that uses as an estimate of<br />
an unobservable population parameter the member of the parameter space that maximizes the<br />
likelihood function. If y is the unobserved parameter and X the observed instance of this<br />
parameter, the probability of an observed outcome X=x given the underlying distribution µ is:<br />
( ) ( | )<br />
L y P X x µ<br />
X= x<br />
= = (8.38)<br />
the value of y that maximizes L ( µ ) is the maximum-likelihood estimate of µ . In order to find<br />
∂ L =<br />
∂µ<br />
the maximum, one will compute the derivative of L: 0 . However, it is often much simpler to<br />
compute the derivative of the logarithm of the likelihood function, the log-likelihood.<br />
Let X = { x1, x2,..., x N<br />
} be the dataset of observed instance of the variable X generated by a<br />
distribution parameterized by the unknown µ , i.e., p( x | µ ). µ can be estimated by Maximum-<br />
Likelihood:<br />
( ) p( x )<br />
ˆ µ arg max[ p X | µ | µ<br />
N<br />
= =∏ (8.39)<br />
µ<br />
In most problems, it is not possible to find an analytical expression for ˆµ . One, then, has to<br />
proceed to an estimation of the parameter through an iterative procedure called EM.<br />
i=<br />
1<br />
i<br />
9.4.2.2 EM-Algorithm<br />
EM is an algorithm for finding maximum likelihood estimates of parameters in probabilistic<br />
models, where the model depends on unobserved latent variables. EM alternates between<br />
performing an expectation (E) step, which computes the expected value of the latent variables,<br />
and a maximization (M) step, which computes the maximum likelihood estimates of the<br />
parameters given the data and setting the latent variables to their expectation.<br />
A basic intuition of the EM-algorithm goes as follows:<br />
• Guess an initial ˆµ . (Initialization)<br />
• Using current ˆµ , obtain an expectation of the complete data likelihood L ( µ ). (E-step)<br />
• Find (and update) ˆµ to maximize the expectation (M-step).<br />
© A.G.Billard 2004 – Last Update March 2011
196<br />
EM is a description of a class of related algorithm, not of a particular algorithm. EM is a recipe or<br />
meta-algorithm, which is used to devise particular algorithms. The Baum-Welch algorithm is an<br />
example of an EM algorithm applied to Hidden Markov Models. Another example is the K-means<br />
clustering algorithm. It can be shown that an EM iteration does not decrease the observed data<br />
likelihood function, and that the only stationary points of the iteration are the stationary points of<br />
the observed data likelihood function. In practice, this means that an EM algorithm will converge<br />
to a local maximum of the observed data likelihood function.<br />
EM proceeds thus iteratively and is particularly suited for parameter estimation under incomplete<br />
data or missing data situations. By using the EM procedure, the so-called marginal (or<br />
incomplete-data) likelihood is obtained by computing the average or expectation of the<br />
complete-data likelihood with respect to the missing data using the current parameter estimates<br />
(E-step), then the new parameter estimates are obtained by maximizing the marginal likelihood<br />
(M-step).<br />
© A.G.Billard 2004 – Last Update March 2011
197<br />
10 References<br />
• Machine Learning, Tom Mitchell, McGraw Hill, 1997.<br />
• Pattern Classification Richard O. Duda, Peter E. Hart, David G. Stork,<br />
• Information Theory, Inference and Learning Algorithms, David J.C Mackay,<br />
Cambridge University Press, 2003.<br />
• Independent Component Analysis, A. Hyvarinen, J. Karhunen and E. Oja, Wiley Inter-<br />
Sciences. 2001.<br />
• Artificial Neural Networks and Information Theory, Colin Fyfe, Tech. Report, Dept. of<br />
Computing and Infortion Science, The University of Paisley, 2000.<br />
• Neural Networks, Simon Haykin, Prentice Hall International Editions, 1994.<br />
• Self-Organizing Maps, Teuvo Kohonen, Springer Series in Information Sciences, 30,<br />
Springer. 2001.<br />
• Learning with Kernels, B. Scholkopf and A. Smola, MIT Press 2002<br />
• Reinforcement Learning: An Introduction,. R. Sutton & A. Barto, A Bradford Book. MIT<br />
Press, 1998.<br />
• Neural Networks for Pattern Recognition, Bishop, C.M. 1996. New York: Oxford<br />
University Press.<br />
10.1 Other Recommended Textbooks<br />
• Elements of Machine Learning, Pat Langley, Morgan Kaufmann, 1996.<br />
• Applied Nonlinear Control, J-J. Slotine, Slotine, J.J.E., and Li, W., Prentice-Hall, 1991.<br />
• Neural Networks, Simon Haykin, Prentice Hall International Editions, 1994.<br />
• Cluster Analysis, Copyright StatSoft, Inc., 1984-2004<br />
© A.G.Billard 2004 – Last Update March 2011
198<br />
10.2 Other Recommended Readings<br />
Kernel Machines<br />
• A Tutorial on Support Vector Machines for Pattern Recognition, C.J.C. Burges, Data<br />
Mining and Knowledge Discovery, 2, 121167 (1998).<br />
Original Hopfield Network:<br />
J.J. Hopfield, "Neural networks as physical systems with emergent collective<br />
computational abilities", Proc. National Academy of Sciences of USA, vol.72, pp.2554-<br />
2558, 1982.<br />
J.J. Hopfield. Pattern recognition computation using action potential timing for stimulus<br />
representation. Nature, 376:33--36, 1995<br />
Boltzmann Machine:<br />
G Barna and K Kaski 1989 Variations on the Boltzmann machine J. Phys. A: Math. Gen.<br />
22 5143-5151<br />
Ackley D H, Hinton G E and Sejnowski T J 1985 Cognitive Sci. 9 147.<br />
Genetic Algorithms:<br />
Holland_ J (1975) Adaptation In Natural and Articial Systems. University of Michigan<br />
Press.<br />
Reinforcement Learning:<br />
Leslie Pack Kaelbling & Michael L. Littman and Andrew W. Moore, Reinforcement<br />
Learning: A Survey, Journal of Artificial Intelligence Research, Volume 4, 1996., 1996.<br />
State-of-the-art<br />
State-of-the-art research in Machine Learning can be found in the proceedings of the<br />
International Conference in Machine Learning (ICML) and the Neural Information Processing<br />
Symposium (NIPS), but also in publications in major journals such as the Machine Learning<br />
Journal, the IEEE Transactions on Signal processing, IEEE Transactions on Pattern Analysis,<br />
IEEE Transactions on Pattern Recognition, the Journal of Machine Learning Research.<br />
State-of-the-art research in Neural Networks can be found in the proceedings of the International<br />
Conference on Artificial Neural Networks (ICANN), the Internation Joint Conference on Neural<br />
Networks (IJCNN), the European Conference on Artificial Neural Networks (ECANN) and in major<br />
journals such as Neural Networks, Neural Computation, IEEE transactions on Neural Networks,<br />
Neurocomputing.<br />
© A.G.Billard 2004 – Last Update March 2011