- Page 1 and 2:
Wambo Coal Pty Limited ANNUAL ENVIR
- Page 3 and 4:
Name of Mine: Titles/Mining Lease:
- Page 5 and 6:
2011-2012 AEMR 2.8 Water Management
- Page 7 and 8:
2011-2012 AEMR 3.13.1 Aboriginal He
- Page 9 and 10:
2011-2012 AEMR List of Figures Figu
- Page 11 and 12:
2011-2012 AEMR List of Appendices A
- Page 13 and 14:
2011-2012 AEMR 1.0 Introduction 1.1
- Page 15 and 16:
2011-2012 AEMR Table 1.0 - Annual R
- Page 17 and 18:
SUMP SUMP N NEW Muswellbrook LOCALI
- Page 19 and 20:
2011-2012 AEMR Table 1.2 - WCPL Min
- Page 21 and 22:
2011-2012 AEMR 1.3.3 Environmental
- Page 23 and 24:
SUMP SUMP 5 UNITED COLLIERY GOLDEN
- Page 25 and 26:
2010-2011 AEMR 1.3.7 Subsidence Man
- Page 27 and 28:
2010-2011 AEMR 1.5 Review of 2011-2
- Page 29 and 30:
2010-2011 AEMR No DP&I Issue DP&I A
- Page 31 and 32:
2011-2012 AEMR Figure 2.2 - Vegetat
- Page 33 and 34:
2011-2012 AEMR Table 2.1 - Producti
- Page 35 and 36:
2011-2012 AEMR The exposed coal is
- Page 37 and 38:
2011-2012 AEMR Figure 2.3 - Coal Ha
- Page 39 and 40:
2011-2012 AEMR January 2009, the wa
- Page 41 and 42:
2011-2012 AEMR Table 2.3 - Stored W
- Page 43 and 44:
2011-2012 AEMR Table 2.4 - WCPL Was
- Page 45 and 46:
2011-2012 AEMR reference creeks for
- Page 47 and 48:
2011-2012 AEMR The purpose of the e
- Page 49 and 50:
SUMP SUMP N19 SW46 SW45 Hunter Rive
- Page 51 and 52:
2011-2012 AEMR Figure 3.4 - 2010-20
- Page 53 and 54:
2011-2012 AEMR 3.2.1.2 Penalty Infr
- Page 55 and 56:
2011-2012 AEMR 3.2.2.3 PM 10 Four r
- Page 57 and 58:
2011-2012 AEMR Particulate Matter A
- Page 59 and 60:
2011-2012 AEMR Assessment criterion
- Page 61 and 62:
2011-2012 AEMR 3.4 Surface Water 3.
- Page 63 and 64:
2011-2012 AEMR Variations in TSS ob
- Page 65 and 66:
2011-2012 AEMR replacement program
- Page 67 and 68:
2011-2012 AEMR Table 3.2 - Groundwa
- Page 69 and 70:
2011-2012 AEMR Figure 3.13a - Groun
- Page 71 and 72:
2011-2012 AEMR 3.6 Contaminated Lan
- Page 73 and 74:
2011-2012 AEMR prior to undermining
- Page 75 and 76:
SUMP SUMP V10-A2 NORTH WAMBO CREEK
- Page 77 and 78:
2011-2012 AEMR 3.8 Weeds 3.8.1 Envi
- Page 79 and 80:
2011-2012 AEMR WCPL’s development
- Page 81 and 82:
2011-2012 AEMR Day L Aeq(15 minute)
- Page 83 and 84:
2011-2012 AEMR Disturbance (L A1,1m
- Page 85 and 86:
2011-2012 AEMR Stakeholders (WACS)
- Page 87 and 88:
2011-2012 AEMR 3.13.2 European Heri
- Page 89 and 90:
2011-2012 AEMR 3.15 Bushfire Manage
- Page 91 and 92:
2011-2012 AEMR non-sensitive enviro
- Page 93 and 94:
2011-2012 AEMR Table 4.1 - WCPL Emp
- Page 95 and 96:
2011-2012 AEMR 4.3 Community Liaiso
- Page 97 and 98:
2011-2012 AEMR 5.0 Rehabilitation T
- Page 99 and 100:
2011-2012 AEMR 5.1.1.1 Rehabilitati
- Page 101 and 102:
2011-2012 AEMR 5.1.3 NWC Diversion
- Page 103 and 104:
2011-2012 AEMR Riparian EFA Riparia
- Page 105 and 106:
Appendix 1 Rail Haulage Records
- Page 107 and 108:
Wambo Coal Pty Ltd AEMR 2011-2012 R
- Page 109 and 110: Wambo Coal Pty Ltd AEMR 2011-2012 R
- Page 111 and 112: Wambo Coal Pty Ltd AEMR 2011-2012 R
- Page 113 and 114: Wambo Coal Pty Ltd AEMR 2011-2012 R
- Page 115 and 116: Wambo Coal Pty Ltd AEMR 2011-2012 R
- Page 117 and 118: Wambo Coal Pty Ltd AEMR 2011-2012 R
- Page 119 and 120: Wambo Coal Pty Ltd AEMR 2011-2012 R
- Page 121 and 122: Wambo Coal Pty Ltd AEMR 2011-2012 R
- Page 123 and 124: Appendix 2A Meteorological Data
- Page 125 and 126: Wambo Coal Pty Ltd AEMR 2011-2012 W
- Page 127 and 128: Appendix 2B Air Monitoring Data
- Page 129 and 130: Wambo Coal Pty Ltd AEMR 2011-2012 D
- Page 131 and 132: Wambo Coal Pty Ltd AEMR 2011-2012 W
- Page 133 and 134: Wambo Coal Pty Ltd AEMR 2011-2012 W
- Page 135 and 136: Wambo Coal Pty Ltd AEMR 2011-2012 W
- Page 137 and 138: Wambo Coal Pty Ltd AEMR 2011-2012 D
- Page 139 and 140: Appendix 2C Surface Water Monitorin
- Page 141 and 142: Annual Environmental Management Rep
- Page 143 and 144: Annual Environmental Management Rep
- Page 145 and 146: Annual Environmental Management Rep
- Page 147 and 148: Annual Environmental Management Rep
- Page 149 and 150: Annual Environmental Management Rep
- Page 151 and 152: Annual Environmental Management Rep
- Page 153 and 154: Annual Environmental Management Rep
- Page 155 and 156: Releases to the Hunter River via th
- Page 157 and 158: Wambo Coal Pty Ltd AEMR 2011‐2012
- Page 159: Wambo Coal Pty Ltd AEMR 2011-2012 M
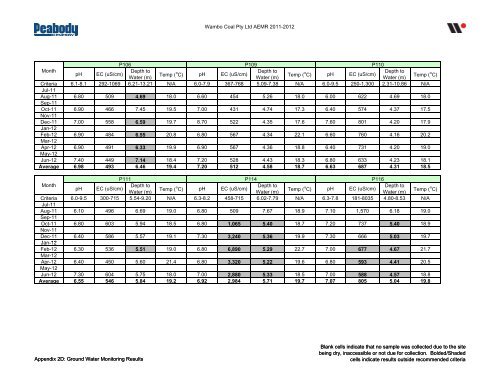
- Page 163 and 164: Wambo Coal Pty Ltd AEMR 2011-2012 G
- Page 165 and 166: Wambo Coal Pty Ltd AEMR 2011-2012 M
- Page 167 and 168: Wambo Coal Pty Ltd AEMR 2011-2012 M
- Page 169 and 170: Wambo Coal Pty Ltd AEMR 2011-2012 G
- Page 171 and 172: Wambo Coal Pty Ltd AEMR 2011-2012 P
- Page 173 and 174: Wambo Coal Pty Ltd AEMR 2011-2012 H
- Page 176 and 177: WAMBO HOMESTEAD 1 B L A S T V I B R
- Page 178 and 179: • individual wall panels — 20 H
- Page 180 and 181: 5 Figure 5: Setup for recording in
- Page 182 and 183: • spectrograms were constructed u
- Page 184 and 185: APPENDIX A Waveforms and spectrogra
- Page 186: East - west ground monitor (“tran
- Page 189 and 190: Channel 1: Channel 2: Channel 3:
- Page 191 and 192: Appendix 2F Noise Monitoring Result
- Page 193 and 194: Wambo Coal Mine Annual Report 2011/
- Page 195 and 196: Table of Contents 1 INTRODUCTION...
- Page 197 and 198: The survey purpose is to quantify a
- Page 199 and 200: 1.3 Terminology Some definitions of
- Page 201 and 202: 1.5 Wambo Coal Rail Spur Developmen
- Page 203 and 204: 2 METHODOLOGY 2.1 Assessment Method
- Page 205 and 206: Table 3.2 L A1(1 minute) dB GENERAT
- Page 207 and 208: Table 3.4 L A1(1 minute) dB GENERAT
- Page 209 and 210: Table 3.6 L A1(1 minute) dB GENERAT
- Page 211 and 212:
Table 3.8 L A1(1 minute) dB GENERAT
- Page 213 and 214:
Table 3.10L A1(1 minute) dB GENERAT
- Page 215 and 216:
Table 3.12 L A1(1 minute) dB GENERA
- Page 217 and 218:
Table 3.14 L A1(1 minute) dB GENERA
- Page 219 and 220:
Table 3.16 L A1(1 minute) dB GENERA
- Page 221 and 222:
A P P E N D I X A . D EVELOPMENT CO
- Page 223 and 224:
Land Acquisition Criteria 7. If the
- Page 225 and 226:
Table 1: Noise Impact Assessment Cr
- Page 227 and 228:
27 July 2012 Wambo Coal Pty Ltd GPO
- Page 229 and 230:
Appendix 2G Flora & Fauna Monitorin
- Page 231 and 232:
Results The onsite population of A.
- Page 233 and 234:
We trust this report proves useful
- Page 235 and 236:
Document Status Review Format Issue
- Page 237 and 238:
ellied Glider (P. australis) and Sq
- Page 239 and 240:
3.3.4 Spotlighting 26 3.3.5 Herpeto
- Page 241:
1 Introduction RPS Australia East (
- Page 244 and 245:
2 Flora 2.1 Methods In 2011, a tota
- Page 246 and 247:
WARNING No part of this plan should
- Page 248 and 249:
similar to the results obtained in
- Page 250 and 251:
Figure 2-3: Percentage of Native Di
- Page 252 and 253:
2.3 Discussion 2.3.1 Species Divers
- Page 254 and 255:
» Due to the low density of Scarle
- Page 256 and 257:
WARNING No part of this plan should
- Page 258 and 259:
3.1.6 Bat Surveys Nocturnal bat sur
- Page 260 and 261:
WARNING No part of this plan should
- Page 262 and 263:
Figure 3-3: Number of Sites per Spe
- Page 264 and 265:
An additional species, namely the W
- Page 266 and 267:
3.3.3 Owl Call Playback No threaten
- Page 268 and 269:
3.4 Conclusion While no Swift Parro
- Page 270 and 271:
• Ground cover characteristics;
- Page 273 and 274:
4.2.1 South Wambo Creek South Wambo
- Page 275 and 276:
Sections Stoney Creek sections scor
- Page 277 and 278:
5 References Braun-Blanquet, J. (19
- Page 279 and 280:
Appendix A Flora Diversity Results
- Page 281 and 282:
Table 2: Number of Flora Species Re
- Page 283 and 284:
Table 4: Percentage Change in Intro
- Page 285 and 286:
Plot: V1-A1 Flora Species Braun Bla
- Page 287 and 288:
Plot: V1-B1 Flora Species Braun Bla
- Page 289 and 290:
Plot: V1-B3 Flora Species Braun Bla
- Page 291 and 292:
Plot: V2-B1 Flora Species Braun Bla
- Page 293 and 294:
Plot: V3-B1 Flora Species Braun Bla
- Page 295 and 296:
Plot: V5-B2 Flora Species Braun Bla
- Page 297 and 298:
Plot: V5-B4 Flora Species Braun Bla
- Page 299 and 300:
Plot: V6-A3 Flora Species Braun Bla
- Page 301 and 302:
Plot: V6-B1c Flora Species Braun Bl
- Page 303 and 304:
Plot: V6-B2c Flora Species Braun Bl
- Page 305 and 306:
Plot: V6-B4 Flora Species Braun Bla
- Page 307 and 308:
Plot: V9-B1 Flora Species Braun Bla
- Page 309 and 310:
Plot: V1--A1 Flora Species Braun Bl
- Page 311 and 312:
Plot: V1--B1 Flora Species Braun Bl
- Page 313 and 314:
Plot: V11-B1 Flora Species Braun Bl
- Page 315 and 316:
Plot: V13-B1 Flora Species Braun Bl
- Page 317 and 318:
Plot: V14-A1 Flora Species Braun Bl
- Page 319 and 320:
Plot: V14-B2 Flora Species Braun Bl
- Page 321 and 322:
Table 1: Introduced Species Frequen
- Page 323 and 324:
Appendix D Fauna Species List 2011
- Page 325 and 326:
Family Scientific Name Common Name
- Page 327 and 328:
Family Scientific Name Common Name
- Page 329 and 330:
Appendix E Riparian Condition Asses
- Page 331 and 332:
Understorey (shrub layer) (Score) C
- Page 333 and 334:
Surface Stability (Score) Comments
- Page 335 and 336:
Appendix F Riparian Condition Score
- Page 337 and 338:
Overstorey Understorey Ground Cover
- Page 339 and 340:
Overstorey Understorey Ground Cover
- Page 341 and 342:
Table 5-4: 2011 Stoney Creek Ripari
- Page 343 and 344:
Transect Left Bank 1 Upstream 2 Rig
- Page 345 and 346:
Transect Left Bank 1 Upstream 2 Rig
- Page 347 and 348:
Table 5-6: 2011 North Wambo Riparia
- Page 349 and 350:
Transect Left Bank 1 Upstream 2 Rig
- Page 351 and 352:
Transect Left Bank 1 Upstream 2 Rig
- Page 353 and 354:
Transect Left Bank 1 Upstream 2 Rig
- Page 355 and 356:
Appendix H Staff Qualifications 201
- Page 357 and 358:
Curriculum Vitae - CONTINUED - proj
- Page 359 and 360:
Curriculum Vitae ROB SANSOM Botanis
- Page 361 and 362:
Curriculum Vitae ANDREW SMITH Field
- Page 363 and 364:
Appendix 3 Summary of Environmental
- Page 365 and 366:
Wambo Coal Pty Limited AEMR 2011-20
- Page 367 and 368:
Wambo Coal Pty Limited AEMR 2011-20
- Page 369 and 370:
Wambo Coal Pty Ltd AEMR 2011-2012 N
- Page 371 and 372:
Wambo Coal Pty Ltd AEMR 2011-2012 1
- Page 373 and 374:
Wambo Coal Pty Ltd AEMR 2011-2012 3
- Page 375 and 376:
Number Date (d/m/yr) Complainant ID
- Page 377 and 378:
Wambo Coal Pty Ltd AEMR 2011-2012 7
- Page 379 and 380:
Appendix 5 Rehabilitation Plan