Wambo Coal AEMR 2011-2012 - Peabody Energy
Wambo Coal AEMR 2011-2012 - Peabody Energy Wambo Coal AEMR 2011-2012 - Peabody Energy
Wambo Coal Pty Ltd AEMR 2011-2012 D01 D03 D07 D26 Month Insoluble Solids (g/m 2 /month) Ash Residue (g/m 2 /month) IS/AR Ratio Insoluble Solids (g/m 2 /month) Ash Residue (g/m 2 /month) IS/AR Ratio Insoluble Solids (g/m 2 /month) Ash Residue (g/m 2 /month) IS/AR Ratio Insoluble Solids (g/m 2 /month) Ash Residue (g/m 2 /month) IS/AR Ratio Jul 11 6.4c 5.0c 78 3.1 1.8 58 7.6c 6.2c 82 0.3 0.3 100 Aug 11 86.1c 82.5c 96 3.8 2.6 68 6.2c 3.6c 58 1.0 0.7 70 Sep 11 3.7 2.3 62 2.3 1.4 61 3.5 2.5 71 1.2 0.9 75 Oct 11 12.5 5.7 46 2.2 1.7 77 5.1 3.3 65 1.1 0.8 73 Nov 11 10.1c 4.9c 49 5.9c 3.0c 51 10.0c 4.1c 41 0.5 0.3 60 Dec 11 4.3c 2.0c 47 4.5c 1.3c 29 Missing Dust Gauge Bottle & Funnel 1.9 1.0 53 Jan 12 11.9c 6.4c 54 2.7 2.2 81 4.8c 3.4c 71 1.3 1.2 92 Feb 12 29.8c 16.9c 57 2.0 1.7 85 7.4c 5.1c 69 2.3 1.7 74 Mar 12 9.1 1.0c 11 1.4 1.0 71 6.5c 4.7c 72 1.8 1.2 67 Apr 12 25.9 16.3 63 2.8 1.9 68 5.3 3.5 66 1.4 1.1 79 May 12 39.2 25.3 65 1.9 1.4 74 4.5 3.4 76 1.1 0.9 82 Jun 12 10.0c 7.6c 76 1.5 1.0 67 4.5c 2.0c 44 0.4c 0.4c 100 Average (incl. Cont.) Average (excl.cont) 20.8 14.7 58 2.8 1.8 66 5.9 3.8 65 1.2 0.9 73 18.1 12.4 58 2.4 1.7 66 4.6 3.2 65 1.3 0.9 73 D09 D11 D12 D14 Month Insoluble Solids (g/m 2 /month) Ash Residue (g/m 2 /month) IS/AR Ratio Insoluble Solids (g/m 2 /month) Ash Residue (g/m 2 /month) IS/AR Ratio Insoluble Solids (g/m 2 /month) Ash Residue (g/m 2 /month) IS/AR Ratio Insoluble Solids (g/m 2 /month) Ash Residue (g/m 2 /month) IS/AR Ratio Jul 11 7.7c 3.6c 47 0.8 0.6 75 2.3 1.3 57 13.1c 4.5c 34 Aug 11 2.3 1.6 70 1.6 1.0 63 1.6 1.1 69 Sep 11 36 3.6 23 2.3 64 20 2.0 13 1.3 65 33 3.3 21 2.1 64 Oct 11 3.3 2.1 64 3.3 2.0 61 3.7 2.7 73 Nov 11 4.8c 2.0c 42 3.4 1.8 53 Dust Gauge Bottle Broken Dec 11 3.3 1.2 36 2.4 1.3 54 2.7 1.8 67 Jan 12 2.3 1.6 70 1.5 1.4 93 3.7 2.6 70 Feb 12 4.0c 2.6c 65 2.4 1.5 63 3.3 2.5 76 Mar 12 6.8c 3.1c 46 3.4 1.9 56 3.9 2.4 62 Apr 12 4.2 2.3 55 1.9 1.2 63 3.1 2.4 77 May 12 6.9 3.8 55 2.8 1.8 64 2.1 1.6 76 Jun 12 5.0c 3.5c 70 1.1 0.8 73 1.9c 1.3c 68 Average (incl. Cont.) Average (excl.cont) 4.5 2.5 57 2.2 1.4 62 2.9 2.0 69 13.1 4.5 34 3.7 2.1 57 2.2 1.4 62 3.0 2.1 69 13.1 4.5 34 Appendix 2B: Air Monitoring Results 'c' indicates that the sample was contaminated Shaded cells indicate that the result was above 4g/m 2 /month
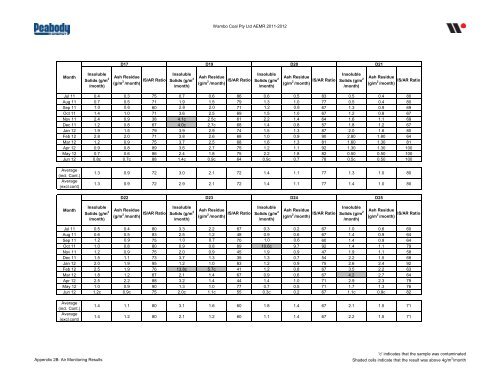
Wambo Coal Pty Ltd AEMR 2011-2012 D17 D19 D20 D21 Month Insoluble Solids (g/m 2 /month) Ash Residue (g/m 2 /month) IS/AR Ratio Insoluble Solids (g/m 2 /month) Ash Residue (g/m 2 /month) IS/AR Ratio Insoluble Solids (g/m 2 /month) Ash Residue (g/m 2 /month) IS/AR Ratio Insoluble Solids (g/m 2 /month) Ash Residue (g/m 2 /month) IS/AR Ratio Jul 11 0.4 0.3 75 0.7 0.6 86 0.6 0.5 83 0.5 0.4 80 Aug 11 0.7 0.5 71 1.9 1.5 79 1.3 1.0 77 0.5 0.4 80 Sep 11 1.0 0.6 60 2.8 2.0 71 1.2 0.8 67 1.3 0.9 69 Oct 11 1.4 1.0 71 3.6 2.5 69 1.5 1.0 67 1.2 0.8 67 Nov 11 2.4 0.9 38 4.1c 2.5c 61 2.2 1.4 64 1.6 1.1 69 Dec 11 1.2 0.8 67 4.0c 2.7c 68 1.4 0.8 57 1.8 1.2 67 Jan 12 1.9 1.5 79 3.9 2.9 74 1.5 1.3 87 2.0 1.6 80 Feb 12 2.8 2.0 71 3.8 2.6 68 1.0 0.9 90 2.80 1.80 64 Mar 12 1.2 0.9 75 3.7 2.5 68 1.6 1.3 81 1.60 1.30 81 Apr 12 0.9 0.8 89 3.6 2.7 75 1.2 1.1 92 1.30 1.30 100 May 12 0.7 0.6 86 2.4 1.8 75 2.2 1.8 82 0.50 0.50 100 Jun 12 0.8c 0.7c 88 1.4c 0.9c 64 0.9c 0.7 78 0.5c 0.50 100 Average (incl. Cont.) Average (excl.cont) 1.3 0.9 72 3.0 2.1 72 1.4 1.1 77 1.3 1.0 80 1.3 0.9 72 2.9 2.1 72 1.4 1.1 77 1.4 1.0 80 D22 D23 D24 D25 Month Insoluble Solids (g/m 2 /month) Ash Residue (g/m 2 /month) IS/AR Ratio Insoluble Solids (g/m 2 /month) Ash Residue (g/m 2 /month) IS/AR Ratio Insoluble Solids (g/m 2 /month) Ash Residue (g/m 2 /month) IS/AR Ratio Insoluble Solids (g/m 2 /month) Ash Residue (g/m 2 /month) IS/AR Ratio Jul 11 0.5 0.4 80 3.3 2.2 67 0.3 0.2 67 1.0 0.6 60 Aug 11 0.6 0.5 83 2.5 1.2 48 0.9 0.6 67 1.4 0.9 64 Sep 11 1.2 0.9 09 75 1.0 0.7 70 1.0 0.6 06 60 1.4 0.9 64 Oct 11 1.0 0.8 80 0.9 0.8 89 10.6c 9.7 92 1.4 1.1 79 Nov 11 1.2 0.9 75 2.0 0.9 45 1.9 0.9 47 1.9 1.1 58 Dec 11 1.5 1.1 73 3.7 1.3 35 1.3 0.7 54 2.2 1.5 68 Jan 12 2.0 1.9 95 1.2 1.0 83 1.2 0.9 75 2.6 2.4 92 Feb 12 2.5 1.9 76 13.8c 5.7c 41 1.2 0.8 67 3.5 2.2 63 Mar 12 1.8 1.2 67 2.1 1.4 67 0.9 0.6 67 4.2 2.7 64 Apr 12 2.5 2.2 88 3.2 1.4 44 1.4 1.0 71 2.9 2.3 79 May 12 1.0 0.9 90 1.3 1.0 77 0.7 0.5 71 1.7 1.3 76 Jun 12 1.2c 0.9c 75 2.0c 1.1c 55 0.3c 0.2 67 1.1c 0.9c 82 Average (incl. Cont.) Average (excl.cont) 1.4 1.1 80 3.1 1.6 60 1.8 1.4 67 2.1 1.5 71 1.4 1.2 80 2.1 1.2 60 1.1 1.4 67 2.2 1.5 71 Appendix 2B: Air Monitoring Results 'c' indicates that the sample was contaminated Shaded cells indicate that the result was above 4g/m 2 /month
- Page 77 and 78: 2011-2012 AEMR 3.8 Weeds 3.8.1 Envi
- Page 79 and 80: 2011-2012 AEMR WCPL’s development
- Page 81 and 82: 2011-2012 AEMR Day L Aeq(15 minute)
- Page 83 and 84: 2011-2012 AEMR Disturbance (L A1,1m
- Page 85 and 86: 2011-2012 AEMR Stakeholders (WACS)
- Page 87 and 88: 2011-2012 AEMR 3.13.2 European Heri
- Page 89 and 90: 2011-2012 AEMR 3.15 Bushfire Manage
- Page 91 and 92: 2011-2012 AEMR non-sensitive enviro
- Page 93 and 94: 2011-2012 AEMR Table 4.1 - WCPL Emp
- Page 95 and 96: 2011-2012 AEMR 4.3 Community Liaiso
- Page 97 and 98: 2011-2012 AEMR 5.0 Rehabilitation T
- Page 99 and 100: 2011-2012 AEMR 5.1.1.1 Rehabilitati
- Page 101 and 102: 2011-2012 AEMR 5.1.3 NWC Diversion
- Page 103 and 104: 2011-2012 AEMR Riparian EFA Riparia
- Page 105 and 106: Appendix 1 Rail Haulage Records
- Page 107 and 108: Wambo Coal Pty Ltd AEMR 2011-2012 R
- Page 109 and 110: Wambo Coal Pty Ltd AEMR 2011-2012 R
- Page 111 and 112: Wambo Coal Pty Ltd AEMR 2011-2012 R
- Page 113 and 114: Wambo Coal Pty Ltd AEMR 2011-2012 R
- Page 115 and 116: Wambo Coal Pty Ltd AEMR 2011-2012 R
- Page 117 and 118: Wambo Coal Pty Ltd AEMR 2011-2012 R
- Page 119 and 120: Wambo Coal Pty Ltd AEMR 2011-2012 R
- Page 121 and 122: Wambo Coal Pty Ltd AEMR 2011-2012 R
- Page 123 and 124: Appendix 2A Meteorological Data
- Page 125 and 126: Wambo Coal Pty Ltd AEMR 2011-2012 W
- Page 127: Appendix 2B Air Monitoring Data
- Page 131 and 132: Wambo Coal Pty Ltd AEMR 2011-2012 W
- Page 133 and 134: Wambo Coal Pty Ltd AEMR 2011-2012 W
- Page 135 and 136: Wambo Coal Pty Ltd AEMR 2011-2012 W
- Page 137 and 138: Wambo Coal Pty Ltd AEMR 2011-2012 D
- Page 139 and 140: Appendix 2C Surface Water Monitorin
- Page 141 and 142: Annual Environmental Management Rep
- Page 143 and 144: Annual Environmental Management Rep
- Page 145 and 146: Annual Environmental Management Rep
- Page 147 and 148: Annual Environmental Management Rep
- Page 149 and 150: Annual Environmental Management Rep
- Page 151 and 152: Annual Environmental Management Rep
- Page 153 and 154: Annual Environmental Management Rep
- Page 155 and 156: Releases to the Hunter River via th
- Page 157 and 158: Wambo Coal Pty Ltd AEMR 2011‐2012
- Page 159 and 160: Wambo Coal Pty Ltd AEMR 2011-2012 M
- Page 161 and 162: Wambo Coal Pty Ltd AEMR 2011-2012 P
- Page 163 and 164: Wambo Coal Pty Ltd AEMR 2011-2012 G
- Page 165 and 166: Wambo Coal Pty Ltd AEMR 2011-2012 M
- Page 167 and 168: Wambo Coal Pty Ltd AEMR 2011-2012 M
- Page 169 and 170: Wambo Coal Pty Ltd AEMR 2011-2012 G
- Page 171 and 172: Wambo Coal Pty Ltd AEMR 2011-2012 P
- Page 173 and 174: Wambo Coal Pty Ltd AEMR 2011-2012 H
- Page 176 and 177: WAMBO HOMESTEAD 1 B L A S T V I B R
<strong>Wambo</strong> <strong>Coal</strong> Pty Ltd <strong>AEMR</strong> <strong>2011</strong>-<strong>2012</strong><br />
D17<br />
D19 D20 D21<br />
Month<br />
Insoluble<br />
Solids (g/m 2<br />
/month)<br />
Ash Residue<br />
(g/m 2 /month)<br />
IS/AR Ratio<br />
Insoluble<br />
Solids (g/m 2<br />
/month)<br />
Ash Residue<br />
(g/m 2 /month)<br />
IS/AR Ratio<br />
Insoluble<br />
Solids (g/m 2<br />
/month)<br />
Ash Residue<br />
(g/m 2 /month)<br />
IS/AR Ratio<br />
Insoluble<br />
Solids (g/m 2<br />
/month)<br />
Ash Residue<br />
(g/m 2 /month)<br />
IS/AR Ratio<br />
Jul 11 0.4 0.3 75 0.7 0.6 86 0.6 0.5 83 0.5 0.4 80<br />
Aug 11 0.7 0.5 71 1.9 1.5 79 1.3 1.0 77 0.5 0.4 80<br />
Sep 11 1.0 0.6 60 2.8 2.0 71 1.2 0.8 67 1.3 0.9 69<br />
Oct 11 1.4 1.0 71 3.6 2.5 69 1.5 1.0 67 1.2 0.8 67<br />
Nov 11 2.4 0.9 38 4.1c 2.5c 61 2.2 1.4 64 1.6 1.1 69<br />
Dec 11 1.2 0.8 67 4.0c 2.7c 68 1.4 0.8 57 1.8 1.2 67<br />
Jan 12 1.9 1.5 79 3.9 2.9 74 1.5 1.3 87 2.0 1.6 80<br />
Feb 12 2.8 2.0 71 3.8 2.6 68 1.0 0.9 90 2.80 1.80 64<br />
Mar 12 1.2 0.9 75 3.7 2.5 68 1.6 1.3 81 1.60 1.30 81<br />
Apr 12 0.9 0.8 89 3.6 2.7 75 1.2 1.1 92 1.30 1.30 100<br />
May 12 0.7 0.6 86 2.4 1.8 75 2.2 1.8 82 0.50 0.50 100<br />
Jun 12 0.8c 0.7c 88 1.4c 0.9c 64 0.9c 0.7 78 0.5c 0.50 100<br />
Average<br />
(incl. Cont.)<br />
Average<br />
(excl.cont)<br />
1.3 0.9 72 3.0 2.1 72 1.4 1.1 77 1.3 1.0 80<br />
1.3 0.9 72 2.9 2.1 72 1.4 1.1 77 1.4 1.0 80<br />
D22<br />
D23<br />
D24<br />
D25<br />
Month<br />
Insoluble<br />
Solids (g/m 2<br />
/month)<br />
Ash Residue<br />
(g/m 2 /month)<br />
IS/AR Ratio<br />
Insoluble<br />
Solids (g/m 2<br />
/month)<br />
Ash Residue<br />
(g/m 2 /month)<br />
IS/AR Ratio<br />
Insoluble<br />
Solids (g/m 2<br />
/month)<br />
Ash Residue<br />
(g/m 2 /month)<br />
IS/AR Ratio<br />
Insoluble<br />
Solids (g/m 2<br />
/month)<br />
Ash Residue<br />
(g/m 2 /month)<br />
IS/AR Ratio<br />
Jul 11 0.5 0.4 80 3.3 2.2 67 0.3 0.2 67 1.0 0.6 60<br />
Aug 11 0.6 0.5 83 2.5 1.2 48 0.9 0.6 67 1.4 0.9 64<br />
Sep 11 1.2 0.9 09 75 1.0 0.7 70 1.0 0.6 06 60 1.4 0.9 64<br />
Oct 11 1.0 0.8 80 0.9 0.8 89 10.6c 9.7 92 1.4 1.1 79<br />
Nov 11 1.2 0.9 75 2.0 0.9 45 1.9 0.9 47 1.9 1.1 58<br />
Dec 11 1.5 1.1 73 3.7 1.3 35 1.3 0.7 54 2.2 1.5 68<br />
Jan 12 2.0 1.9 95 1.2 1.0 83 1.2 0.9 75 2.6 2.4 92<br />
Feb 12 2.5 1.9 76 13.8c 5.7c 41 1.2 0.8 67 3.5 2.2 63<br />
Mar 12 1.8 1.2 67 2.1 1.4 67 0.9 0.6 67 4.2 2.7 64<br />
Apr 12 2.5 2.2 88 3.2 1.4 44 1.4 1.0 71 2.9 2.3 79<br />
May 12 1.0 0.9 90 1.3 1.0 77 0.7 0.5 71 1.7 1.3 76<br />
Jun 12 1.2c 0.9c 75 2.0c 1.1c 55 0.3c 0.2 67 1.1c 0.9c 82<br />
Average<br />
(incl. Cont.)<br />
Average<br />
(excl.cont)<br />
1.4 1.1 80 3.1 1.6 60 1.8 1.4 67 2.1 1.5 71<br />
1.4 1.2 80 2.1 1.2 60 1.1 1.4 67 2.2 1.5 71<br />
Appendix 2B: Air Monitoring Results<br />
'c' indicates that the sample was contaminated<br />
Shaded cells indicate that the result was above 4g/m 2 /month


