Wambo Coal AEMR 2011-2012 - Peabody Energy
Wambo Coal AEMR 2011-2012 - Peabody Energy
Wambo Coal AEMR 2011-2012 - Peabody Energy

You also want an ePaper? Increase the reach of your titles
YUMPU automatically turns print PDFs into web optimized ePapers that Google loves.
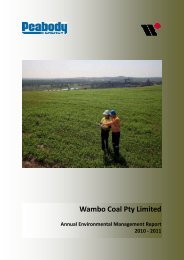
<strong>Wambo</strong> <strong>Coal</strong> Pty Limited<br />
ANNUAL ENVIRONMENTAL MANAGEMENT REPORT <strong>2011</strong>- <strong>2012</strong><br />
WAMBO COAL<br />
<strong>Peabody</strong> <strong>Energy</strong> Australia Pty Ltd<br />
Jerrys Plains Road, Warkworth, NSW 2330<br />
PMB 1, Singleton NSW 2330<br />
www.peabodyenergy.com.au
WAMBO COAL<br />
ANNUAL ENVIRONMENTAL<br />
MANAGEMENT REPORT<br />
JULY <strong>2011</strong> TO JUNE <strong>2012</strong>
Name of Mine:<br />
Titles/Mining Lease:<br />
Open Cut MOP Commencement Date:<br />
Open Cut MOP Completion Date:<br />
Underground MOP Commencement Date:<br />
Underground MOP Completion Date:<br />
<strong>AEMR</strong> Commencement Date:<br />
<strong>AEMR</strong> Completion Date:<br />
Name of Leaseholder:<br />
Reporting Officer:<br />
Title:<br />
<strong>Wambo</strong> <strong>Coal</strong><br />
CL365, CL374, CL397, CCL743, ML1402,<br />
ML1572, ML1594, A444, EL7211<br />
01/07/2010<br />
30/06/2016<br />
01/11/2005<br />
01/11/<strong>2012</strong><br />
01/07/<strong>2011</strong><br />
30/06/<strong>2012</strong><br />
<strong>Wambo</strong> <strong>Coal</strong> Pty Limited<br />
Troy Favell<br />
Environment & Community Manager<br />
Signature:<br />
Date: 27 August <strong>2012</strong><br />
Distribution<br />
Department of Trade & Investment<br />
Department of Planning & Infrastructure<br />
Office of Environment & Heritage<br />
Office of Water<br />
Department of Sustainability, Environment, Water, Population and Communities<br />
Singleton Shire Council<br />
Community Consultative Committee Members<br />
<strong>Wambo</strong> Mine Officials
Table of Contents<br />
<strong>2011</strong>-<strong>2012</strong> <strong>AEMR</strong><br />
1.0 INTRODUCTION ............................................................................................................ 1<br />
1.1 Scope ............................................................................................................................. 1<br />
1.2 Background .................................................................................................................... 1<br />
1.3 Consents, Leases and Licences .................................................................................... 2<br />
1.3.1 Development Consents ................................................................................... 2<br />
1.3.2 Mining Leases and Authorisations ................................................................... 2<br />
1.3.3 Environmental Protection Licence ................................................................... 9<br />
1.3.4 NPW Act Approvals ......................................................................................... 9<br />
1.3.5 Water Licences ................................................................................................ 9<br />
1.3.6 Mining Operations Plan ................................................................................... 9<br />
1.3.7 Subsidence Management Plan ...................................................................... 13<br />
1.3.8 Emplacement Area Approvals ....................................................................... 13<br />
1.3.9 EPBC Approval .............................................................................................. 13<br />
1.4 Mine Contacts .............................................................................................................. 13<br />
1.5 Review of <strong>2011</strong>-<strong>2012</strong> Objectives and Targets ............................................................. 15<br />
1.6 Actions from 2010-<strong>2011</strong> <strong>AEMR</strong> Review ....................................................................... 15<br />
2.0 OPERATIONS DURING THE REPORTING PERIOD ................................................. 18<br />
2.1 Exploration ................................................................................................................... 18<br />
2.2 Land Preparation .......................................................................................................... 18<br />
2.3 Construction ................................................................................................................. 18<br />
2.4 Mining ........................................................................................................................... 20<br />
2.4.1 Production and Waste Summary ................................................................... 20<br />
2.4.2 Estimated Mine Life ....................................................................................... 20<br />
2.4.3 Underground Operations ............................................................................... 22<br />
2.4.4 Open Cut Operations ..................................................................................... 22<br />
2.5 <strong>Coal</strong> Handling and Preparation .................................................................................... 23<br />
2.5.1 Reject Management....................................................................................... 26<br />
2.5.1.1 Chemical and Physical Characteristics of Reject ....................................... 26<br />
2.5.1.2 Handling and Disposal Procedures ............................................................ 26<br />
2.5.1.3 Tailing Management Strategy .................................................................... 26<br />
2.6 Waste Management ..................................................................................................... 26<br />
2.6.1 Sewage Treatment and Disposal ................................................................... 27<br />
2.6.2 Rubbish Disposal ........................................................................................... 27<br />
2.6.3 Oily Waste Disposal....................................................................................... 27<br />
2.7 ROM and Product <strong>Coal</strong> Stockpiles ............................................................................... 27<br />
Page i
<strong>2011</strong>-<strong>2012</strong> <strong>AEMR</strong><br />
2.8 Water Management ...................................................................................................... 27<br />
2.8.1 Water Supply and Use ................................................................................... 32<br />
2.8.2 Surface Water Management .......................................................................... 32<br />
2.8.2.1 Water Balance & Modeling ........................................................................ 32<br />
2.8.2.2 NWC Discharge Report ............................................................................. 32<br />
2.8.3 Water Discharge ............................................................................................ 34<br />
2.9 Hazardous Material Management ................................................................................ 34<br />
2.9.1 Hydrocarbon Containment ............................................................................. 34<br />
2.9.2 Explosive Management ................................................................................. 35<br />
2.9.3 Material Safety Data Sheets .......................................................................... 35<br />
3.0 ENVIRONMENTAL MANAGEMENT AND PERFORMANCE ..................................... 36<br />
3.1 Meteorological Monitoring ............................................................................................ 36<br />
3.1.1 Environmental Management .......................................................................... 36<br />
3.1.2 Environmental Performance .......................................................................... 36<br />
3.1.3 Rainfall and Evaporation................................................................................ 36<br />
3.1.4 Temperature .................................................................................................. 36<br />
3.1.5 Wind Speed and Direction ............................................................................. 36<br />
3.2 Air Quality ..................................................................................................................... 40<br />
3.2.1 Environmental Management .......................................................................... 40<br />
3.2.1.1 Site Specific Particulate Matter Control: Best Practice Assessment .......... 40<br />
3.2.1.2 Penalty Infringement Notice ....................................................................... 41<br />
3.2.1.3 Dust Suppression Trials ............................................................................. 41<br />
3.2.2 Environmental Performance .......................................................................... 41<br />
3.2.2.1 Air Quality EIS Predictions ......................................................................... 41<br />
3.2.2.2 High Volume Air Sampling ......................................................................... 42<br />
3.2.2.3 PM 10 .......................................................................................................... 43<br />
3.2.2.4 Dust Deposition ......................................................................................... 46<br />
3.3 Erosion & Sediment Control ......................................................................................... 48<br />
3.3.1 Environmental Management .......................................................................... 48<br />
3.3.2 Environmental Performance .......................................................................... 48<br />
3.4 Surface Water .............................................................................................................. 49<br />
3.4.1 Environmental Management .......................................................................... 49<br />
3.4.2 Environmental Performance .......................................................................... 49<br />
3.4.2.1 Water Quality ............................................................................................. 49<br />
3.4.2.2 pH Analysis ............................................................................................... 50<br />
3.4.2.3 Total Suspended Solids ............................................................................. 50<br />
3.4.2.4 Electrical Conductivity and Total Dissolved Solids ..................................... 52<br />
Page ii
<strong>2011</strong>-<strong>2012</strong> <strong>AEMR</strong><br />
3.4.2.5 Oil and Grease .......................................................................................... 52<br />
3.4.2.6 Flow Monitoring ......................................................................................... 52<br />
3.5 Groundwater Management ........................................................................................... 53<br />
3.5.1 Environmental Management .......................................................................... 53<br />
3.5.2 Environmental Performance .......................................................................... 53<br />
3.5.2.1 Depth to Water .......................................................................................... 54<br />
3.5.2.2 pH .............................................................................................................. 58<br />
3.5.2.3 Electrical Conductivity ............................................................................... 58<br />
3.6 Contaminated Land ...................................................................................................... 59<br />
3.6.1 Environmental Performance .......................................................................... 59<br />
3.7 Threatened Flora and Fauna ........................................................................................ 59<br />
3.7.1 Environmental Management .......................................................................... 59<br />
3.7.2 Environmental Performance .......................................................................... 60<br />
3.7.2.1 Pre-Clearance Surveys.............................................................................. 60<br />
3.7.2.2 Acacia Species .......................................................................................... 60<br />
3.7.2.3 Remnant Woodland Enhancement Program ............................................. 61<br />
3.8 Weeds .......................................................................................................................... 65<br />
3.8.1 Environmental Management .......................................................................... 65<br />
3.8.2 Environmental Performance .......................................................................... 65<br />
3.8.2.1 Remnant Woodland Enhancement Areas .................................................. 65<br />
3.8.2.2 North <strong>Wambo</strong>, South <strong>Wambo</strong> and Stoney Creeks ..................................... 65<br />
3.8.2.3 Open Cut Rehabilitation............................................................................. 65<br />
3.9 Feral Animal Control ..................................................................................................... 65<br />
3.9.1 Environmental Management .......................................................................... 65<br />
3.9.2 Environmental Performance .......................................................................... 65<br />
3.9.3 Remnant Woodland Enhancement Program ................................................. 66<br />
3.10 Blasting and Vibration .................................................................................................. 66<br />
3.10.1 Environmental Management .......................................................................... 66<br />
3.10.2 Environmental Performance .......................................................................... 66<br />
3.10.2.1 Blast Monitoring ....................................................................................... 66<br />
3.10.2.2 <strong>Wambo</strong> Rail Development Vibration Monitoring ...................................... 68<br />
3.11 Operational Noise ......................................................................................................... 68<br />
3.11.1 Environmental Management .......................................................................... 68<br />
3.11.2 Environmental Performance .......................................................................... 70<br />
3.12 Visual Stray Light ......................................................................................................... 71<br />
3.12.1.1 Environmental Performance .................................................................... 71<br />
3.13 Cultural and Natural Heritage Conservation ................................................................. 72<br />
Page iii
<strong>2011</strong>-<strong>2012</strong> <strong>AEMR</strong><br />
3.13.1 Aboriginal Heritage ........................................................................................ 72<br />
3.13.1.1 Environmental Management .................................................................... 72<br />
3.13.1.2 Environmental Performance .................................................................... 72<br />
3.13.1.3 Aboriginal Cultural Heritage Conservation Agreement – Remnant<br />
Woodland Enhancement Area (A)............................................................................ 73<br />
3.13.2 European Heritage ........................................................................................ 75<br />
3.13.2.1 Environmental Management .................................................................... 75<br />
3.14 Spontaneous Combustion ............................................................................................ 76<br />
3.14.1 Underground .................................................................................................. 76<br />
3.14.2 Open Cut ....................................................................................................... 76<br />
3.14.3 CHPP ............................................................................................................. 76<br />
3.15 Bushfire Management .................................................................................................. 77<br />
3.15.1 Environmental Management .......................................................................... 77<br />
3.15.2 Environmental Performance .......................................................................... 77<br />
3.16 Mine Subsidence .......................................................................................................... 77<br />
3.16.1.1 Subsidence Response Strategy............................................................... 77<br />
3.17 Hydrocarbon Contamination ......................................................................................... 77<br />
3.18 Methane Drainage/ Ventilation ..................................................................................... 78<br />
3.18.1 Greenhouse Gas ........................................................................................... 78<br />
3.19 Public Safety ................................................................................................................ 78<br />
3.19.1 United Colliery Activities ................................................................................ 78<br />
3.20 Reportable Environmental Incidents ............................................................................ 78<br />
3.20.1 Environmental Management .......................................................................... 78<br />
Minor (Category 1) ....................................................................................................... 78<br />
Serious (Category 2) .................................................................................................... 78<br />
Major (Category 3) ....................................................................................................... 79<br />
3.20.2 Environmental Performance .......................................................................... 79<br />
3.21 Independent Audit ........................................................................................................ 80<br />
4.0 COMMUNITY RELATIONS ......................................................................................... 80<br />
4.1 Employment Status ...................................................................................................... 80<br />
4.2 Environmental Complaints ........................................................................................... 80<br />
4.3 Community Liaison ....................................................................................................... 83<br />
4.3.1 Community Consultation................................................................................ 83<br />
4.3.2 Information Sessions ..................................................................................... 83<br />
4.3.3 Community Contributions .............................................................................. 83<br />
4.3.4 Community Programs .................................................................................... 83<br />
5.0 REHABILITATION ....................................................................................................... 85<br />
Page iv
<strong>2011</strong>-<strong>2012</strong> <strong>AEMR</strong><br />
5.1 Rehabilitation of Disturbed Land .................................................................................. 86<br />
5.1.1 Open Cut ....................................................................................................... 86<br />
5.1.1.1 Rehabilitation Performance ....................................................................... 87<br />
5.1.1.2 North East Tailings Dam ............................................................................ 87<br />
5.1.2 Rail Line ......................................................................................................... 88<br />
5.1.3 NWC Diversion .............................................................................................. 89<br />
5.2 Rehabilitation Trials and Research .............................................................................. 89<br />
5.3 Rehabilitation Monitoring .............................................................................................. 89<br />
5.3.1.1 Ecosystem Function Analysis Summary .................................................... 89<br />
6.0 ACTIVITIES PROPOSED FOR THE NEXT <strong>AEMR</strong> PERIOD....................................... 92<br />
6.1 <strong>Wambo</strong>’s Key Activities for <strong>2012</strong>-2013 ......................................................................... 92<br />
6.2 Objectives and Targets for <strong>2011</strong>-<strong>2012</strong> Reporting Period ............................................. 92<br />
List of Tables<br />
Table 1.1 – WCPL Development Consents ............................................................................... 6<br />
Table 1.2 – WCPL Mining Leases and Authorisations ............................................................... 7<br />
Table 1.3 – Water Licence Summary ....................................................................................... 10<br />
Table 1.4 – Emplacement Area Approvals ............................................................................... 13<br />
Table 1.5 – Contact Details of Relevant Mine Officials ............................................................ 14<br />
Table 1.6 – Review of Objectives and Targets ........................................................................ 15<br />
Table 1.7 – Actions from 2010-<strong>2011</strong> Annual Environmental Management Report Review ..... 16<br />
Table 2.1 – Production and Waste Summary .......................................................................... 21<br />
Table 2.2 – Annual Open Cut ROM Production Levels ............................................................ 23<br />
Table 2.3 – Stored Water Summary ......................................................................................... 29<br />
Table 3.1 – Surface Water Quality Criteria .............................................................................. 49<br />
Table 3.2 – Groundwater Quality Criteria ................................................................................. 55<br />
Table 3.3 – Noise Criteria for WCPL from November 2005 ..................................................... 69<br />
Table 4.1 – WCPL Employment Status (end of June <strong>2012</strong>) .................................................... 81<br />
Table 4.2 – WCPL Historical Complaints ................................................................................. 81<br />
Page v
<strong>2011</strong>-<strong>2012</strong> <strong>AEMR</strong><br />
List of Figures<br />
Figure 1.1 – Site Location Plan .................................................................................................. 3<br />
Figure 1.2 – Mining Leases ........................................................................................................ 6<br />
Figure 1.3 – Water Licences and Permits .................................................................................. 9<br />
Figure 1.4 – Current Emplacement Areas ................................................................................ 10<br />
Figure 2.2 – Extent of Mining Operations 30 June <strong>2012</strong> .......................................................... 21<br />
Figure 2.3 – <strong>Coal</strong> Handling and Preparation Plant Process ..................................................... 22<br />
Figure 2.4 – Water Storage and Catchment Areas .................................................................. 28<br />
Figure 2.5 – Water Reticulation Diagram ................................................................................. 29<br />
Figure 3.1 – Environmental Monitoring Locations .................................................................... 34<br />
Figure 3.2 – <strong>2011</strong>-<strong>2012</strong> Rainfall and Evaporation Summary ................................................... 38<br />
Figure 3.3 – <strong>2011</strong>-<strong>2012</strong> Maximum and Minimum Temperatures ............................................. 38<br />
Figure 3.4 – <strong>2011</strong>-<strong>2012</strong> Annual Wind Rose ............................................................................. 39<br />
Figure 3.6 – <strong>2011</strong>-<strong>2012</strong> Summer Wind Rose ........................................................................... 39<br />
Figure 3.9 a – Results for TSP at HV01 ................................................................................... 44<br />
Figure 3.9 b – Results for TSP at HV02 ................................................................................... 44<br />
Figure 3.9 c – Results for TSP at HV03 ................................................................................... 44<br />
Figure 3.9 d – Results for TSP at HV04 ................................................................................... 44<br />
Figure 3.10a – PM 10 Results Recorded at AQ01 ...................................................................... 45<br />
Figure 3.10b – PM 10 Results Recorded at AQ02 ...................................................................... 45<br />
Figure 3.10c – PM 10 Results Recorded at AQ03 ...................................................................... 45<br />
Figure 3.10d – PM 10 Results Recorded at AQ04 ...................................................................... 45<br />
Figure 3.11 – <strong>2011</strong>-<strong>2012</strong> Depositional Dust Gauges Annual Averages ................................... 47<br />
Figure 3.12 – Ground Wa ter Monitoring Location ................................................................... 50<br />
Figure 3.13a – Ground Water (Brosi Wells) Depth to Water .................................................... 57<br />
Figure 3.13b – Ground Water (<strong>Wambo</strong> Wells) Depth to Water ................................................ 57<br />
Figure 3.14 – Ground Water (100 Series) Depth to Water ....................................................... 57<br />
Figure 3.15 – Ground Water (200 Series) Depth to Water ....................................................... 57<br />
Figure 3.16 – Ground Water (300 Series) Depth to Water ....................................................... 57<br />
Figure 3.17 – Ground Water (United) Depth to Water ............................................................. 57<br />
Page vi
<strong>2011</strong>-<strong>2012</strong> <strong>AEMR</strong><br />
Figure 3.18 – Remnant Woodland Enhancement Program Monitoring .................................. 63<br />
Figure 3.19 – <strong>2011</strong>-<strong>2012</strong> Weed Control ................................................................................... 64<br />
Figure 3.20 – <strong>2011</strong>-<strong>2012</strong> Blast Monitoring Results .................................................................. 68<br />
Figure 3.21 – Aboriginal and European Heritage Sites ............................................................ 64<br />
Figure 4.1 – <strong>2011</strong>-<strong>2012</strong> Breakdown of Community Complaints by Issue ................................ 82<br />
Page vii
<strong>2011</strong>-<strong>2012</strong> <strong>AEMR</strong><br />
List of Appendices<br />
Appendix 1<br />
Appendix 2<br />
Appendix 2A<br />
Appendix 2B<br />
Appendix 2C<br />
Appendix 2D<br />
Appendix 2E<br />
Appendix 2F<br />
Appendix 2G<br />
Appendix 3<br />
Appendix 4<br />
Appendix 5<br />
Appendix 6<br />
Rail Transport Records<br />
Environmental Monitoring Program Results<br />
Meteorological Data<br />
Air Monitoring Results<br />
Surface Water Monitoring Results<br />
Ground Water Monitoring Results<br />
Blast and Vibration Monitoring Results<br />
Noise Monitoring Results<br />
Flora & Fauna Monitoring<br />
Summary of Environmental Incidents<br />
Register of Community Complaints<br />
Rehabilitation Plan<br />
Independent Audit Response<br />
Page viii
<strong>2011</strong>-<strong>2012</strong> <strong>AEMR</strong><br />
EXCUTIVE SUMMARY<br />
<strong>Wambo</strong> <strong>Coal</strong> Pty Limited (WCPL) continued to operate in accordance with its Mining Operations Plans (MOP),<br />
Development Consents, Environmental Protection Licence (EPL) and all other approvals during the <strong>2011</strong>-<strong>2012</strong><br />
reporting period.<br />
WCPL reported four notifiable environmental incidents during the reporting period in relation to blasting, dam<br />
overflow, dam seepage and elevated dust results.<br />
All environmental monitoring undertaken during the reporting period was in accordance with DA 305-7-2003, DA<br />
17-8-2004, Environmental Protection Licence (EPL) No.529 and approved management plans.<br />
WCPL completed no final rehabilitation in the open cut during the reporting period, however approximately 40ha of<br />
final landform at RL160 was completed and in readiness for topsoil application and seeding early in the next<br />
reporting period. Remedial rehabilitation works of North East Tailings Dam (NETD) continued, during the reporting<br />
period. Construction of Stage 3 of the North <strong>Wambo</strong> Creek Diversion was nearing completion at the end of the<br />
reporting period.<br />
The WCPL Open Cut moved a total of 34,223,764 bank cubic metres (bcm) of prime overburden to allow the<br />
extraction of 3.949 million tonnes (Mt) of run of mine (ROM) coal during <strong>2011</strong>-<strong>2012</strong>.<br />
The WCPL Underground operation extracted a total 4.797 Mt of ROM coal during the <strong>2011</strong>-<strong>2012</strong> reporting period.<br />
A total of 5.698 Mt of product coal was produced by WCPL during the <strong>2011</strong>-<strong>2012</strong> reporting period.<br />
All coal produced from WCPL was railed via the WCPL rail spur and rail line to the Port of Newcastle for export.<br />
There was no change in production methods during this reporting period.<br />
At the current rates of production and assuming no further mining approvals, the Open Cut and Underground mine<br />
has a remaining life of approximately 5 years and 4 years respectively.<br />
WCPL received a total of eighty two community complaints during the reporting period.<br />
Page ix
<strong>2011</strong>-<strong>2012</strong> <strong>AEMR</strong><br />
1.0 Introduction<br />
1.1 Scope<br />
This Annual Environmental Management Report<br />
(<strong>AEMR</strong>) details the environmental performance of<br />
<strong>Wambo</strong> <strong>Coal</strong> Pty Limited (WCPL) mining,<br />
exploration, construction and rail activities for the<br />
period from 1 July <strong>2011</strong> to 30 June <strong>2012</strong>. WCPL is<br />
required to prepare and submit an <strong>AEMR</strong> in<br />
accordance with the NSW Trade & Investment –<br />
Division of Resources and <strong>Energy</strong> (DRE),<br />
Guidelines to the Mining, Rehabilitation and<br />
Environmental Management Process (Guidelines<br />
No. EDG03).<br />
The preparation of this <strong>AEMR</strong>, also satisfy’s the<br />
Annual Review requirements under Development<br />
Applications (DA) 305-7-2003 and 177-8-2004. The<br />
<strong>AEMR</strong> also satisfy’s the reporting requirements for<br />
Environment Protection Licence 529, approval<br />
under the Environment Protection and Biodiversity<br />
Conservation Act 1999 (EPBC 2003/1138) and the<br />
approved Subsidence Management Plan (SMP) for<br />
Longwalls (LW) 1-6. Table 1.0 display WCPL’s<br />
annual reporting requirements and where the<br />
requirements are addressed within the <strong>AEMR</strong>.<br />
A recent aerial photo and locality plan of WCPL is<br />
shown in Figure 1.1.<br />
1.2 Background<br />
WCPL is owned by <strong>Peabody</strong> <strong>Energy</strong> Australia Pty<br />
Limited (75%) and Sumiseki Materials Co, Ltd (25%<br />
- Net profit B class shares). WCPL is an Open Cut<br />
and Underground mining operation located<br />
approximately 15 kilometres (km) west of Singleton<br />
near the locality of Warkworth. It is bounded by<br />
Wollombi Brook to the east, coal mining operations<br />
to the north, grazing land to the south and north<br />
west and the Wollemi National Park to the west and<br />
south west.<br />
WCPL was granted development consent by Patrick<br />
Plains Shire Council in 1969 with Open Cut and<br />
Underground mining commencing shortly after.<br />
Subsequent development consents issued in 1972,<br />
1974 and 1977 covered a range of early Open Cut<br />
and Underground operations. Singleton Shire<br />
Council (SSC) approved extensions to mining<br />
operations, construction activities and modifications<br />
to road haulage rates in the period between 1980<br />
and 1991.<br />
In July 1991, a Development Application (DA) was<br />
lodged with SSC seeking approval for the expansion<br />
of Open Cut and Underground mining activities and<br />
the consolidation of earlier development consents.<br />
Development consent was granted in February<br />
1992.<br />
The Homestead Underground Mine commenced in<br />
1979 and operated until 1999. In 2003 the mine<br />
entries were sealed.<br />
The Wollemi Underground Mine commenced<br />
production in 1997 and was placed under care and<br />
maintenance in October 2002 after the available<br />
longwall reserves were exhausted.<br />
Open Cut operations were suspended between<br />
March 1999 and August 2001. Following the<br />
closure of the Wollemi Underground Mine, Open<br />
Cut operations were expanded to maintain an<br />
overall production rate of 3 million tonnes per<br />
annum (Mtpa) of product coal. Development of the<br />
North <strong>Wambo</strong> Underground Mine (the Underground)<br />
commenced in November 2005, with longwall<br />
operations commencing in October 2007.<br />
<strong>Coal</strong> from the Open Cut and the Underground<br />
operations is washed at the <strong>Coal</strong> Handling and<br />
Preparation Plant (CHPP). Until June 2006 product<br />
coal was transported by highway rated trucks via<br />
the Golden Highway to the Mount Thorley <strong>Coal</strong><br />
Loader for rail transport to the Port of Newcastle.<br />
The construction and commissioning of the WCPL<br />
Rail Development (WRD) in May 2006, which<br />
includes the rail line from Mount Thorley and WCPL<br />
rail spur and coal terminal, allows the direct rail<br />
transportation of all product coal from WCPL to the<br />
Port of Newcastle.<br />
United Colliery (United), owned by Xstrata <strong>Coal</strong><br />
NSW, ceased longwall underground mining in the<br />
Arrowfield Seam during the 2009-2010 reporting<br />
period. United underground mining previously<br />
occurred beneath sections of WCPL’s Open Cut<br />
and Underground operations. The last of United’s<br />
coal was loaded by rail on 27 May 2010. United are<br />
currently under care and maintenance, whilst<br />
undertaking further exploration activities within<br />
A444.<br />
Page 1
<strong>2011</strong>-<strong>2012</strong> <strong>AEMR</strong><br />
1.3 Consents, Leases and<br />
Licences<br />
1.3.1 Development Consents<br />
Mining and rail activities at WCPL operate under<br />
various development consents granted by the NSW<br />
Department of Planning & Infrastructure (DP&I),<br />
formally the Department of Planning (DoP), and<br />
SSC. The continued development of open cut and<br />
underground mining activities commenced under<br />
DA 305-7-2003 in November 2004. The construction<br />
of the rail spur, rail loop and train loadout area<br />
commenced under DA 177-8-2004 in January 2005.<br />
Table 1.0 outlines the annual reporting<br />
requirements from DA305-7-2003 and DA177-8-<br />
2004 and where the requirement is addressed in the<br />
<strong>AEMR</strong>. Table 1.1 provides a historical summary of<br />
development approvals and active development<br />
consents applicable to WCPL.<br />
During April <strong>2011</strong>, an application to modify DA177-<br />
8-2004 in accordance with Section 75(W) of the<br />
EP&A Act was lodged by WCPL for the<br />
establishment of a small locomotive refuelling<br />
station adjacent to the WCPL rail loadout facility. At<br />
the time of preparing the 2010-<strong>2011</strong> <strong>AEMR</strong>, no<br />
decision had been made by the DP&I regarding this<br />
modification. On 17 February <strong>2012</strong> an approval was<br />
granted for the refueling facility.<br />
All other development consents, except DA 108/91<br />
granted by SSC, were surrendered by WCPL in<br />
November 2005.<br />
1.3.2 Mining Leases and<br />
Authorisations<br />
WCPL’s current mining leases and authorisations<br />
are listed below in Table 1.2 and shown in Figure<br />
1.2<br />
Page 2
<strong>2011</strong>-<strong>2012</strong> <strong>AEMR</strong><br />
Table 1.0 – Annual Review Reporting Requirements<br />
Annual Review Reporting Requirements<br />
Schedule 4 - DA 305-7-2003<br />
Site Water Balance<br />
25. Each year, the Applicant shall:<br />
(a) review the site water balance for the development against the predictions in the EIS;<br />
(b) re-calculate the site water balance for the development;<br />
(c) assess current and forecast compliance with the rules of the Hunter River Salinity Trading<br />
Scheme; and<br />
(d) report the results in the Annual Review.<br />
Monitoring<br />
79. The Applicant shall:<br />
(a) keep records of the<br />
amount of coal transported from the site each year; and<br />
number of coal haulage truck movements generated each day by the development; and<br />
(b) include these records in the Annual Review.<br />
Greenhouse Gas<br />
87. For the life of the development, the Applicant shall:<br />
(a) monitor the greenhouse emissions generated by the development;<br />
(b) investigate ways to reduce greenhouse emissions generated by the development; and<br />
(c) report on greenhouse gas monitoring and abatement measures in the Annual Review, to<br />
the satisfaction of the Director-General<br />
Waste Minimisation<br />
88. For the life of the development, the Applicant shall:<br />
(a) monitor the amount of waste generated by the development;<br />
(b) investigate ways to minimise waste generated by the development;<br />
(c) implement reasonable and feasible measures to minimise waste generated by the<br />
development; and<br />
(d) report on waste management and minimisation in the Annual Review, to the satisfaction of<br />
the Director-General.<br />
Schedule 6 - DA 305-7-2003<br />
Annual Review<br />
5. The Applicant shall submit an annual review of the environmental performance of the<br />
development to the satisfaction of the Director-General. This review must:<br />
(a) describe the development (including any rehabilitation) that was carried out in the past<br />
year, and the development that is proposed to be carried out over the next year;<br />
(b) include a comprehensive review of the monitoring results and complaints records of the<br />
development over the past year, which includes a comparison of these results against:<br />
the relevant statutory requirements, limits or performance measures/criteria;<br />
the monitoring results of previous years; and<br />
the relevant predictions in the EIS;<br />
(c) identify any non-compliance over the past year, and describe what actions were (or are<br />
being) taken to ensure compliance;<br />
(d) identify any trends in the monitoring data over the life of the development;<br />
(e) identify any discrepancies between the predicted and actual impacts of the development,<br />
and analyse the potential cause of any significant discrepancies; and<br />
(f) describe what measures will be implemented<br />
Note: Violet represents January 2007 Modification<br />
Brown represents June 2009 Modification<br />
Blue represents February <strong>2011</strong> Modification<br />
Section<br />
Section 2.8.2.1<br />
Section 2.8.3<br />
Appendix 1<br />
Section 2.5<br />
Section 3.18.1<br />
Section 2.6<br />
Section<br />
This Document<br />
Section 2.0<br />
Section 5.1<br />
Section 3.0<br />
Page 3
<strong>2011</strong>-<strong>2012</strong> <strong>AEMR</strong><br />
Table 1.0 – Annual Review Reporting Requirements cont.<br />
Annual Review Reporting Requirements<br />
Schedule 4 - DA 177-8-2004<br />
Operating Conditions<br />
15. The Applicant shall:<br />
(a) ensure any visible air pollution generated by the development is assessed regularly, and<br />
that operations are modified, and/or stopped as required to minimise air quality impacts on<br />
privately owned land;<br />
(b) implement all practicable measures to minimise air pollutant emissions from the<br />
development; and<br />
(c) report on the effectiveness of these measures in the <strong>AEMR</strong>,<br />
to the satisfaction of the Director-General.<br />
Monitoring of <strong>Coal</strong> Transport<br />
18. The Applicant shall:<br />
(a) keep records of the:<br />
amount of coal loaded at the development each year; and<br />
number of coal haulage train movements generated by the development (on a daily<br />
basis); and<br />
(b) include these records in the <strong>AEMR</strong>.<br />
Schedule 6 - DA 177-8-2004<br />
Annual Reporting<br />
4. Within 1 year of the date of this consent, and annually thereafter, the Applicant shall submit<br />
an <strong>AEMR</strong> on the development to the Director-General and relevant agencies. This report must:<br />
(a) identify the standards and performance measures that apply to the development;<br />
(b) include a summary of the complaints received during the last year, and compare this to the<br />
complaints received in previous years;<br />
(c) include a summary of the monitoring results on the development during the last year;<br />
(d) include an accurate record of the amount of product coal transported on the development<br />
over the last year on a weekly basis;<br />
(e) include an analysis of these monitoring results against the relevant:<br />
impact assessment criteria;<br />
monitoring results from previous years; and<br />
predictions in the SEE;<br />
(f) identify any trends in the monitoring over the life of the development;<br />
(g) identify any non-compliance during the last year; and, if necessary,<br />
(h) describe what actions were, or are being taken, to ensure compliance.<br />
SMP Approval LW1-6<br />
A summary of results of the monitoring programmes discussed in Section 6 will be reported in<br />
the Annual Environmental Management Report (<strong>AEMR</strong>). Any remediation works undertaken<br />
will also be reported in the <strong>AEMR</strong>. Members of the <strong>Wambo</strong> CCC receive a copy of the <strong>AEMR</strong>.<br />
EPBC 2003/1138<br />
Section<br />
Section 3.0<br />
Appendix 1<br />
Section 2.5<br />
Section<br />
This Document<br />
Section 3.0<br />
Section 4.0<br />
Section 3.0<br />
Appendix 1 &<br />
Section 2.5<br />
Section 3.0<br />
Section<br />
Section 1.3.7<br />
Section 3.16<br />
Section<br />
3(d) a process to review and report annually on this plan 1 . Section 3.7<br />
1 WCMP have prepared to the satisfaction of the Minster for Department of Sustainability, Environment, Water, Population and<br />
Communities a Flora and Fauna Management Plan<br />
Page 4
SUMP<br />
SUMP<br />
N<br />
NEW<br />
Muswellbrook<br />
LOCALITY PLAN<br />
HIGHWAY<br />
ENGLAND<br />
Singleton<br />
HIGHWAY<br />
PACIFIC<br />
Maitland<br />
WAMBO<br />
MINE<br />
Broke<br />
NEWCASTLE<br />
Morriset<br />
SYDNEY -<br />
NEWCASTLE<br />
FREEWAY<br />
NEWCASTLE -<br />
SYDNEY (150km)<br />
SYDNEY<br />
JERRYS PLAINS 15km<br />
COAL & ALLIED<br />
RIVERVIEW PIT<br />
GOLDEN<br />
HIGHWAY<br />
WAMBO OPEN CUT<br />
UNITED COLLIERY<br />
NORTH WAMBO<br />
CREEK DIVERSION<br />
WARKWORTH<br />
VILLAGE<br />
WAMBO RAIL<br />
LOADOUT<br />
STAGE 3 CREEK<br />
DIVERSION<br />
WAMBO CHPP<br />
NORTH WAMBO<br />
UNDERGROUND<br />
WAMBO ADMIN<br />
SINGLETON<br />
20km<br />
NORTH<br />
WAMBO CREEK<br />
BROOK<br />
WOLLOMBI<br />
STONY<br />
SOUTH<br />
WAMBO<br />
CREEK<br />
CREEK<br />
Legend<br />
Colliery Holding Boundary<br />
DA Approved Open Cut Limits<br />
MOP Open Cut Limits<br />
<strong>Wambo</strong> Owned Land<br />
Open Cut Mining at 30th June <strong>2012</strong><br />
North <strong>Wambo</strong> Underground Workings (Existing)<br />
North <strong>Wambo</strong> Underground Workings (Proposed)<br />
Prepared by Pegasus Technical CAD FILE: 08667A<br />
WAMBO COAL<br />
SITE LOCATION PLAN<br />
FIGURE 1.1
<strong>2011</strong>-<strong>2012</strong> <strong>AEMR</strong><br />
Table 1.1 – WCPL Development Consents<br />
Approval Name Number Approval<br />
Authority<br />
WCPL Mining Operations<br />
Date<br />
Granted<br />
Expiry Date<br />
Original consolidated consent for mine<br />
operations<br />
Modification to include Wollemi Box Cut and<br />
mine<br />
Modification to include Brambles <strong>Coal</strong><br />
Transport System<br />
DA 108/91 SSC 17/02/1992<br />
DA 108/91 SSC 16/10/1996<br />
DA 108/91 SSC 21/12/1998<br />
21 years from issue<br />
of coal lease<br />
21 years from issue<br />
of coal lease<br />
21 years from issue<br />
of coal lease<br />
Expansion of open cut and underground<br />
mining operations<br />
(MOD 1 ) Modification to allow DA No.<br />
108/91 to remain active<br />
(MOD 2 ) Re-orientation of the <strong>Wambo</strong><br />
seam underground mine longwall panels<br />
(MOD 3 ) Upgrade of open cut workshop<br />
and underground surface facilities<br />
(MOD 4 ) Extraction of the Wollemi<br />
remnants<br />
(MOD 5 ) Construction of a temporary bypass<br />
of North <strong>Wambo</strong> Creek<br />
(MOD 6 ) Construction of the North <strong>Wambo</strong><br />
Creek Diversion, gas and dewatering wells<br />
(MOD 7) Construction of internal water<br />
storage dam<br />
(MOD 8) Construction of internal water<br />
storage dam<br />
(MOD 9 ) Preparation of an Extraction Plan<br />
rather than a Subsidence Management Plan<br />
DA 305-7-2003 DP&I 04/02/2004 Nov 2026<br />
DA 305-7-2003 DP&I 2004 Nov 2026<br />
DA 305-7-2003 DP&I 04/05/2005 Nov 2026<br />
DA 305-7-2003 DP&I 10/01/2006 Nov 2026<br />
DA 305-7-2003 DP&I 19/04/2006 Nov 2026<br />
DA 305-7-2003 DP&I 20/10/2006 Nov 2026<br />
DA 305-7-2003 DP&I 25/01/2007 Nov 2026<br />
DA 305-7-2003 DP&I 22/06/2009 Nov 2026<br />
DA 305-7-2003 DP&I 27/08/2009 Nov 2026<br />
DA 305-7-2003 DP&I 28/02/<strong>2011</strong> Nov 2026<br />
(MOD 10) Montrose Water Storage Dam DA 305-7-2003 DP&I Pending<br />
WCPL Rail Development<br />
Jerry’s Plains Rail Line DA 235/97 SSC 16/07/1998 Perpetuity<br />
Modification to DA235/97 to correct<br />
residents list and allow the preparation of<br />
management plans in a staged manner<br />
DA 235/97 SSC 01/05/2003 Perpetuity<br />
Altered alignment of Jerry’s Plains Rail Line DA 235/97.3 SSC 03/12/2004 Perpetuity<br />
WCPL rail and coal loading infrastructure DA 306-7-2003 DP&I 01/06/2004 01/06/2025<br />
WCPL rail and coal loading infrastructure<br />
(altered alignment of rail loop)<br />
(MOD 1) Upgrade of Wallaby Scrub Road /<br />
Golden Hwy Intersection<br />
(MOD 2) Establishment of a locomotive<br />
provisioning facility adjacent to the WCPL<br />
Rail Loadout Facility<br />
DA 117-8-2004 DP&I 16/12/2004 16/12/2025<br />
DA 117-8-2004 DP&I 15/12/2006 16/12/2025<br />
DA 117-8-2004 DP&I 12/02/<strong>2012</strong> 16/12/2025<br />
Page 6
<strong>2011</strong>-<strong>2012</strong> <strong>AEMR</strong><br />
Table 1.2 – WCPL Mining Leases and Authorisations<br />
Lease Reference Area (ha) Date Granted Expiry Date<br />
<strong>Coal</strong> Lease 365 (<strong>Coal</strong> Mining Act 1973) 530 19/09/1990 19/09/<strong>2011</strong><br />
<strong>Coal</strong> Lease 374 (<strong>Coal</strong> Mining Act 1973) 382 06/12/1991 21/03/2026<br />
<strong>Coal</strong> Lease 397 (<strong>Coal</strong> Mining Act 1973) 1,480 04/06/1992 04/06/2013<br />
Consolidated <strong>Coal</strong> Lease 743 (<strong>Coal</strong> Mining Act 1973) 3,000 09/03/1990 14/08/2022<br />
Mining Lease 1402 (<strong>Coal</strong> Mining Act 1973) 352 23/09/1996 14/08/2022<br />
Mining Lease 1572 (<strong>Coal</strong> Mining Act 1973) 1,012 21/12/2005 21/12/2026<br />
Mining Lease 1594 (Mining Act 1992) 263 01/05/2007 30/04/2028<br />
Exploration Licence A444 3,060 04/10/2007 16/05/<strong>2011</strong>*<br />
Exploration Licence EL7211 967 29/09/2008 29/09/<strong>2011</strong>**<br />
Notes: - United has a strata title lease to the Arrowfield seam in the northern 1.5 km of CCL743 and CL397.<br />
- Mining Lease 1402 covered surface rights to enable development of the Wollemi Mine.<br />
- A444 is an Authority to Prospect granted under <strong>Coal</strong> Mining Act 1973.<br />
- * An Exploration Licence Renewal Application was submitted into DTIRIS for A444 <strong>2011</strong>, pending approval.<br />
- ** An Exploration Licence Renewal Application was submitted into DTIRIS for EL7211 <strong>2011</strong>, pending approval.<br />
Page 7
ROAD<br />
597726<br />
857021<br />
ROAD<br />
753792<br />
837165<br />
544091<br />
794836<br />
753792<br />
837165<br />
729048<br />
617852<br />
723283<br />
821127<br />
753792<br />
111381<br />
114966<br />
753792<br />
70046<br />
90727<br />
753792<br />
752481<br />
659810<br />
729984<br />
659810<br />
857021<br />
729984<br />
635392<br />
635392<br />
247239<br />
729985<br />
247239<br />
247239<br />
247239<br />
65744<br />
Ph. of Wollombi<br />
147<br />
753792<br />
ROAD<br />
566275<br />
733895<br />
733895<br />
783484<br />
58745<br />
783484<br />
729048<br />
HUNTER RIVER<br />
723283<br />
HUNTER RIVER<br />
752468<br />
729048<br />
114966<br />
823767<br />
823767<br />
HUNTER RIVER<br />
659810<br />
729048<br />
752468<br />
HUNTER RIVER<br />
HUNTER RIVER<br />
UNIDENTIFIED<br />
UNIDENTIFIED<br />
111381<br />
729960<br />
111381<br />
HUNTER RIVER<br />
111381<br />
111381<br />
111381<br />
737880<br />
821123<br />
111381<br />
249327<br />
729963<br />
753792<br />
111381<br />
249327<br />
729985<br />
ROAD<br />
821123<br />
729961<br />
857021<br />
857021<br />
729984<br />
723249<br />
ROAD<br />
857021<br />
857021<br />
COUNTY OF HUNTER<br />
ROAD<br />
ROAD<br />
GOLDEN HWY<br />
CONSOLIDATED COAL LEASE No.743(CL175/315)<br />
Embraces the surface and land below to<br />
unlimited depth.<br />
CONSOLIDATED COAL LEASE No.743<br />
Embraces the mines , beds , veins &<br />
seams of coal only.<br />
CONSOLIDATED COAL LEASE No.743(CL175)<br />
Excepts the surface and land below<br />
to a depth of 15.0 metres.<br />
COAL LEASE No.365<br />
Embraces the mines , beds , veins &<br />
seams of coal only.<br />
MINING LEASE ML 1402<br />
Embraces the surface and land below to<br />
unlimited depth. Excepts the mines,beds,<br />
veins & seams of coal.<br />
COAL LEASE No.257 ( UNITED Lease)<br />
The surface and land to the base of the<br />
Whynot Seam is excluded from the CL 374 area<br />
COAL LEASE No.373 ( UNITED Lease)<br />
15m. above the roof to 15m. below the floor<br />
of the Arrowfield Seam is excluded from CL. 743<br />
COAL LEASE No.385 ( UNITED Lease)<br />
15m. above the roof to 15m. below the floor<br />
of the Arrowfield Seam is excluded from CL. 397<br />
COAL LEASE No. 397<br />
Excludes the surface and land below<br />
to depth of 15m.<br />
ROAD<br />
ROAD<br />
PARISH OF WHYBROW<br />
COUNTY OF HUNTER<br />
COAL LEASE No. 397<br />
Includes the surface and land below<br />
to unlimited depth.<br />
WAMBO RD<br />
ROAD<br />
COAL LEASE No. 374<br />
Embraces the surface and land below<br />
to the base of the Whynot seam<br />
MINE LEASE No. 1572<br />
Embraces the surface and soil below<br />
there of to a depth of 5m below the floor<br />
of the seam known a in the Whynot<br />
AUTHORISATION No. 444<br />
NATIONAL PARK<br />
APPROVED MINING LEASE No. 1594<br />
WOLLEMI<br />
EXPLORATION LICENCE No. 7211<br />
WAMBO RD<br />
COLLIERY HOLDING BOUNDARY<br />
Legend<br />
WAMBO COAL<br />
MINING LEASES<br />
FIGURE 1.2<br />
Prepared by Pegasus Technical CAD FILE: 08668A
<strong>2011</strong>-<strong>2012</strong> <strong>AEMR</strong><br />
1.3.3 Environmental Protection<br />
Licence<br />
WCPL operates under Environmental Protection<br />
Licence 529 (EPL 529), issued by the NSW Office<br />
of Environment & Heritage (OEH), formerly the<br />
Department of Environment, Climate Change and<br />
Water (DECCW), under the authority of the<br />
Protection of the Environment Operations Act 1997.<br />
EPL 529 also covers WCPL’s activities at the mine<br />
and rail spur.<br />
During the reporting period, the OEH varied EPL<br />
529 on several occasions to incorporate an<br />
additional Pollution Reduction Program (PRP). The<br />
new PRP involves providing the OEH with a report<br />
by the 29 June <strong>2012</strong> that documents WCPL’s Best<br />
Management Practice (BMP) to identify the most<br />
practicable means to reduce particle emissions. For<br />
more information about the BMP report please see<br />
Section 3.2.2.<br />
1.3.4 NPW Act Approvals<br />
WCPL holds a permit under the National Parks and<br />
Wildlife Act 1974 (NPW Act), for the salvage and<br />
impact on Aboriginal heritage sites prior to ground<br />
disturbance. Consent number #2222 was issued<br />
under Section 87 and Section 90 of the NPW Act on<br />
the 20 June 2005. In consultation with the OEH and<br />
local Aboriginal groups, the OEH granted approval<br />
to extend the permit for an additional 5 years,<br />
expiring on the 19 June 2015.<br />
Consent number #2085 was issued under Section<br />
90 of the NPW Act on 14 December 2004 for the<br />
salvage of Aboriginal artefacts along the <strong>Wambo</strong><br />
Rail Development. Salvage works for the <strong>Wambo</strong><br />
Rail Development were completed and reported in<br />
the 2005-2006 reporting period. There have been<br />
no further salvage works under consent number<br />
#2085. Consent #2085 expired in January 2007.<br />
For further information regarding Aboriginal Heritage<br />
and salvage works undertaken during this reporting<br />
period, please refer to Section 3.13.1.<br />
For further details regarding Permit #3130 for Care<br />
and Control of Aboriginal Objects, previously<br />
salvaged under Section 87/90 permits, please refer<br />
to Section 3.13. 1.<br />
1.3.5 Water Licences<br />
Details of the current water licenses for WCPL are<br />
presented in Table 1.3. The location of these<br />
licensed facilities is shown in Figure 1.3.<br />
1.3.6 Mining Operations Plan<br />
In accordance with the Mining Act 1992, WCPL<br />
have prepared and submitted two Mining<br />
Operations Plans (MOP’s) for the open cut and<br />
underground operations.<br />
All open cut mining activities were carried out<br />
generally in accordance with the approved Open<br />
Cut MOP. All underground mining activities at North<br />
<strong>Wambo</strong> Underground (Underground) were carried<br />
out generally in accordance with the approved<br />
Underground MOP.<br />
The Open Cut MOP was approved by the DTIRIS,<br />
formerly the Industry & Investment NSW (I&I NSW)<br />
on the 29 June 2010. The Open Cut MOP was<br />
prepared in accordance with the DTIRIS Guidelines<br />
and Format for Preparation of Mining Operations<br />
Plan Version 3, January 2006. WCPL consulted with<br />
the DTIRIS and provided information to the<br />
community through WCPL’s Community<br />
Consultation Committee (CCC) throughout the<br />
development of the Open Cut MOP. The MOP<br />
covers all aspects of the Open Cut operation<br />
including mining, rehabilitation and tailings<br />
management, until June 2016.<br />
WCPL sought an interim modification to the Open<br />
Cut MOP to raise a larger area of the Wombat dump<br />
to RL160. The request to raise dump levels is<br />
consistent with commitments made in the 2003 EIS.<br />
The DTIRIS approved the modification on the 20<br />
December 2010. WCPL are planning to seek a<br />
modification to the Open Cut MOP during the next<br />
reporting period, to address proposed operational<br />
changes.<br />
The MOP for the Underground was approved by the<br />
DTIRIS in November 2005 for the period November<br />
2005 to November <strong>2012</strong>. The Underground MOP<br />
applies to all underground mining operations and<br />
refers to the Open Cut MOP where applicable. No<br />
modifications to the Underground MOP were sought<br />
by WCPL during the reporting period. WCPL are<br />
currently preparing a new MOP for the<br />
Underground. The new Underground MOP will be<br />
submitted to DRE for approval in the next reporting<br />
period.<br />
WCPL currently holds water licences for a number<br />
of bores, wells and pumps located across the mine<br />
site. There were four new water licenses and one<br />
renewal licensed issued by the NSW Office of Water<br />
(NOW) during the reporting period.<br />
Page 9
<strong>2011</strong>-<strong>2012</strong> <strong>AEMR</strong><br />
Licence<br />
Number<br />
Table 1.3 – Water Licence Summary<br />
Description Facility Valid To Extraction Limits<br />
20BL132753 Old Well No. 1 Well 28/07/2013 243ML/year<br />
20BL166910 Dewatering (Bore No. 1) Bore 25/10/2013 450ML/ year 2<br />
20BL167737 Well No. 2 Well 08/01/<strong>2011</strong>* 70ML/year<br />
20SL033872 Wollombi Brook Pump Pump 06/07/<strong>2011</strong>* 750ML/year<br />
20BL167810 Well – Domestic, Stock Well Perpetuity 11ML/year<br />
20AL200631 Hunter River Pump Pump Perpetuity 1,000ML/year<br />
20WA200632 Hunter River Pump Pump 30/06/2017 6ML/year<br />
20BL168017 Dewatering (Bore No. 2) Bore 21/05/<strong>2012</strong>* 750ML/year<br />
20BL168643 Dewatering Bore Bore 7/08/2013 300ML/year<br />
20BL166438 Well - Stock Bore Perpetuity 5ML/year<br />
20BL167738 Dewatering Bore Bore 11/09/2015 300ML/year<br />
20BL168997 Piezometer Test Bore Perpetuity Groundwater monitoring<br />
20BL168998 Piezometer Test Bore Perpetuity Groundwater monitoring<br />
20BL168999 Piezometer Test Bore Perpetuity Groundwater monitoring<br />
20BL169000 Piezometer Test Bore Perpetuity Groundwater monitoring<br />
20BL170638 Piezometer Test Bore Perpetuity Groundwater monitoring<br />
20BL166906 Spearpoints Irrigation Perpetuity 19ML/year<br />
20BL172061 Dewatering (Bore No.2a) Bore 22/03/2014 750ML/year<br />
20BL172156 Dewatering Excavation 3/05/2014 98ML/year<br />
20BL171155 Dewatering Excavation 25/09/<strong>2012</strong> 243ML/year<br />
20BL172237 GW14, GW18, GW21 Monitoring Bore Perpetuity Groundwater monitoring<br />
20BL172238 GW12 Monitoring Bore Perpetuity Groundwater monitoring<br />
20BL172240 GW15 Monitoring Bore Perpetuity Groundwater monitoring<br />
20BL172242 GW16, GW17 Monitoring Bore Perpetuity Groundwater monitoring<br />
20BL172244 GW20 Monitoring Bore Perpetuity Groundwater monitoring<br />
20BL172255 GW22 Monitoring Bore Perpetuity Groundwater monitoring<br />
20BL172256 GW13 Monitoring Bore Perpetuity Groundwater monitoring<br />
20BL172256 GW19 Monitoring Bore Perpetuity Groundwater monitoring<br />
20BL173032 Dewatering Bore Bore 30/11/2016 450ML/ year 2<br />
20BL173033 Dewatering Bore Bore 30/11/2016 450ML/ year 2<br />
20BL173034 Dewatering Bore Bore 30/11/2016 450ML/year 2<br />
20BL173035 Dewatering Bore Bore 30/11/2016 450ML/year 2<br />
Note: *Renewal licences pending<br />
2 The volume of groundwater extracted from the works authorised by licenses 20BL173032, 20BL173033, 20BL173034, 20BL173035 and<br />
20BL166910 shall not exceed 450 megalitres in any 12 month period commencing 1 st July.<br />
Page 10
SUMP<br />
SUMP<br />
5<br />
UNITED COLLIERY<br />
GOLDEN<br />
GW16<br />
GW17<br />
WOMBAT DUMP<br />
HIGHWAY<br />
MONTROSE PIT<br />
WAMBO OPEN CUT<br />
HUNTER PIT TAILINGS DAM<br />
NORTH WAMBO CREEK<br />
DIVERSION<br />
GW19<br />
SOUTH BATES PIT<br />
STAGE 3 CREEK<br />
DIVERSION<br />
GW20<br />
7<br />
WOLLEMI BOXCUT<br />
HOMESTEAD<br />
PIT<br />
GW21<br />
WAMBO CHPP<br />
GW18<br />
WAMBO ADMIN<br />
NORTH WAMBO UNDERGROUND<br />
2<br />
12<br />
NORTH<br />
9<br />
13<br />
3<br />
8<br />
WAMBO<br />
CREEK<br />
1<br />
WOLLOMBI<br />
4<br />
BROOK<br />
GW14<br />
GW15<br />
STONY<br />
GW12<br />
11<br />
CREEK<br />
10<br />
SOUTH<br />
6<br />
WAMBO<br />
CREEK<br />
GW22<br />
GW13<br />
Legend<br />
Colliery Holding Boundary<br />
DA Approved Open Cut Limits<br />
MOP Open Cut Limits<br />
<strong>Wambo</strong> Owned Land<br />
Pump/well/bore Locations<br />
8<br />
Dams<br />
Creeks<br />
Prepared by Pegasus Technical CAD FILE: 08669A<br />
Licence Number Description Reference<br />
Number<br />
20BL 132753 Old Well No. 1 1<br />
20BL 166910 No.1 Dewatering Bore 2<br />
20BL 167737 Well No. 2 3<br />
20SL 033872 Wollombi Brook Pump 4<br />
20AL200631<br />
20WA200632<br />
Hunter River Pump 5<br />
Hunter River Pump<br />
20BL 168017 No.2 Dewatering Bore 6<br />
20BL 172061 No.2a Dewatering Bore 6a<br />
20BL 168643 Dewatering Bore 7<br />
20BL 167738 Dewatering Bore<br />
8<br />
20BL 168997 Piezometer 9<br />
20BL 168998 Piezometer<br />
10<br />
20BL 168999 Piezometer<br />
11<br />
5<br />
Extraction Limits<br />
243 ML/year limit<br />
450 ML/year limit<br />
70 ML/year limit<br />
750ML/year limit.<br />
1000ML/year limit.<br />
6ML/year limit.<br />
750ML/year limit.<br />
750ML/year limit.<br />
300ML/year limit.<br />
300ML/year limit.<br />
Groundwater monitoring<br />
Groundwater monitoring<br />
Groundwater monitoring<br />
Licence Number Description Reference<br />
Number<br />
20BL 169000 Piezometer<br />
12<br />
20BL 170638 Piezometer<br />
13<br />
20BL 172237<br />
20BL 172238<br />
20BL 172240<br />
20BL 172242<br />
20BL 172244<br />
20BL 172255<br />
20BL 172256<br />
20BL 172256<br />
Piezometer<br />
Piezometer<br />
Piezometer<br />
Piezometer<br />
Piezometer<br />
Piezometer<br />
Piezometer<br />
Piezometer<br />
GW14<br />
GW18<br />
GW22<br />
GW12<br />
GW15<br />
GW16<br />
GW17<br />
GW20<br />
GW22<br />
GW13<br />
GW19<br />
WAMBO COAL<br />
WATER LICENSES AND PERMITS<br />
FIGURE 1.3<br />
Extraction Limits<br />
Groundwater monitoring<br />
5ML/year limit.<br />
Groundwater Monitoring<br />
Groundwater Monitoring<br />
Groundwater Monitoring<br />
Groundwater Monitoring<br />
Groundwater Monitoring<br />
Groundwater Monitoring<br />
Groundwater Monitoring<br />
Groundwater Monitoring<br />
Groundwater Monitoring<br />
Groundwater Monitoring<br />
Groundwater Monitoring
SUMP<br />
SUMP<br />
NORTH WAMBO<br />
UNITED COLLIERY<br />
WOMBAT PIT DUMP<br />
MONTROSE PIT<br />
WAMBO OPEN CUT<br />
HUNTER PIT TAILINGS DAM<br />
SOUTH BATES PIT<br />
NORTH EAST CUT<br />
TAILINGS DAM<br />
WOLLEMI BOXCUT<br />
HOMESTEAD<br />
PIT<br />
NORTH WAMBO CREEK<br />
DIVERSION<br />
WAMBO CHPP<br />
STAGE 3 CREEK<br />
DIVERSION<br />
WAMBO ADMIN<br />
NORTH WAMBO UNDERGROUND<br />
BROOK<br />
CREEK<br />
WOLLOMBI<br />
STONY<br />
CREEK<br />
SOUTH<br />
WAMBO<br />
CREEK<br />
Legend<br />
Colliery Holding Boundary<br />
DA Approved Open Cut Limits<br />
MOP Open Cut Limits<br />
<strong>Wambo</strong> Owned Land<br />
Active Emplacement<br />
Rehabilitation<br />
North <strong>Wambo</strong> Underground Workings (Existing)<br />
North <strong>Wambo</strong> Underground Workings (Proposed)<br />
WAMBO COAL<br />
CURRENT EMPLACEMENT AREAS<br />
FIGURE 1.4<br />
Prepared by Pegasus Technical CAD FILE: 08670A
2010-<strong>2011</strong> <strong>AEMR</strong><br />
1.3.7 Subsidence Management Plan<br />
WCPL’s Underground operates under an approved<br />
Subsidence Management Plan (SMP). The SMP for<br />
First Workings was approved by the DTIRIS in<br />
October 2005 with mining commencing in<br />
November 2005. The SMP for Second Workings<br />
was lodged in March 2006 and was approved by the<br />
DTIRIS on the 11 December 2006. This SMP<br />
covers underground mining activities until 1/11/2013<br />
which includes longwall panels 1 through to 6 (LW<br />
1-6). The SMP also includes the management of<br />
environmental impacts associated with subsidence.<br />
Mine subsidence is discussed further in Section<br />
3.16.<br />
1.3.8 Emplacement Area Approvals<br />
Table 1.4 outlines previous emplacement approvals<br />
issued under Section 126 Approvals for<br />
Emplacement Areas (Dams). These emplacement<br />
areas can be seen in Figure 1.4. The Hunter Pit<br />
emplacement is the only current operational area.<br />
Rehabilitation of past emplacement areas continued<br />
this reporting period with these activities outlined in<br />
Section 2.5.1.3.<br />
DTIRIS a Section 101 amendment, replacing the<br />
original Section 127.<br />
A Section 100 Application for raising the tailings<br />
level in the Hunter Pit Dam was submitted to the<br />
NSW Department of Trade and Investment at the<br />
end of the <strong>2011</strong>-<strong>2012</strong> reporting period. The raising<br />
of this wall is part of the WCPL life of mine tailings<br />
strategy which will extend the tailings facility life<br />
through to 2014.<br />
1.3.9 EPBC Approval<br />
WCPL was granted approval (EPBC 2003/1138) in<br />
accordance with Environment Protection and<br />
Biodiversity Conservation Act, 1999 (EPBC Act) for<br />
the expansion of the mine on the 23 November<br />
2004. In accordance with the approval, WCPL have<br />
prepared a Flora and Fauna Management Plan to<br />
address the conditions set out in EPBC 2003/1138.<br />
1.4 Mine Contacts<br />
Table 1.5 outlines the contact details for site<br />
personnel responsible for mining, coal preparation,<br />
rehabilitation and environmental management at<br />
WCPL.<br />
A Section 127 Approval to Discontinue<br />
Emplacement Areas was granted on the 8<br />
September 2004 for the North East Tailings Dam<br />
(NETD). In July 2009 WCPL submitted to the<br />
Table 1.4 – Emplacement Area Approvals<br />
Date<br />
Granted<br />
Area Details Current Status<br />
Area No. 1 Whynot (South) Area Rehabilitated.<br />
28/08/1991<br />
Area No. 2 Ridge Open Cut and Cut 11N areas Capping complete.<br />
Area No. 3<br />
Ridge Portal/Western Open Cut<br />
Ridge Portal rehabilitated.<br />
Western Cut temporary<br />
rehabilitated.<br />
Area No. 4<br />
This comprised sub areas A and B as below:<br />
02/12/1993<br />
Area A<br />
A south east extension of the North<br />
East Open Cut<br />
Now called Charlies Hole. This<br />
area was rehabilitated during the<br />
reporting period<br />
Area B Original slurry drying pond area Rehabilitated.<br />
North Whynot Void - Rehabilitated.<br />
08/05/1995<br />
Area ‘C’ Open cut approval area number 8/8A<br />
Used as mine water storage. Not<br />
planned to be used for tailings.<br />
Hunter Pit Commenced filling in 29/03/2004 Current disposal area.<br />
23/01/2004 Area No. 1 Whynot (South) Area Rehabilitated.<br />
Page 13
2010-<strong>2011</strong> <strong>AEMR</strong><br />
Table 1.5 – Contact Details of Relevant Mine Officials<br />
Title Name Office Phone<br />
General Manager Peter Baker 02 6570 2216<br />
Open Cut Manager Geoff Moore 02 6570 2308<br />
Underground Manager Andrew Boyling 02 6570 2314<br />
<strong>Coal</strong> Handling and Preparation Plant Manager Glen Pitt 02 6570 2381<br />
Environment and Community Manager Lachlan Crawford 02 6570 2206<br />
Senior Environmental Advisor Troy Favell 02 6570 2209<br />
Environment and Community Coordinator David Rankin 02 6570 2217<br />
Blasting Hotline 02 8250 5205<br />
Community Inquiry Line & Environment Hotline 02 6570 2245<br />
Page 14
2010-<strong>2011</strong> <strong>AEMR</strong><br />
1.5 Review of <strong>2011</strong>-<strong>2012</strong><br />
Objectives and Targets<br />
The objectives and targets for the <strong>2011</strong>-<strong>2012</strong><br />
reporting period were identified in the 2010-<strong>2011</strong><br />
<strong>AEMR</strong>. These are presented below in Table 1.6,<br />
including an assessment of whether or not the<br />
objectives and targets have been met.<br />
1.6 Actions from 2010-<strong>2011</strong><br />
<strong>AEMR</strong> Review<br />
The DTIRIS found that the 2010-<strong>2011</strong> <strong>AEMR</strong> was<br />
informative, well presented and acceptable for the<br />
reporting period. The DP&I also found the 2010-<br />
<strong>2011</strong> <strong>AEMR</strong> satisfied the requirements under<br />
Condition 5, Schedule 6 of DA 305-7-2003 and<br />
Condition 4, Schedule 6 of DA 177-8-2004.<br />
However both DTIRI and DP&I identified a number<br />
of actions for WCPL to address during the next<br />
reporting period. Actions from the <strong>AEMR</strong> site<br />
inspection on the 25 January <strong>2012</strong> are listed in<br />
Table 1.7.<br />
A review of the 2010-<strong>2011</strong> <strong>AEMR</strong> was undertaken<br />
by DTIRIS and DP&I. The review by both<br />
government departments included a site inspection<br />
on 25 January <strong>2012</strong> by DTIRIS and DP&I.<br />
Table 1.6 – Review of Objectives and Targets<br />
Objective<br />
Target<br />
<strong>2011</strong> – <strong>2012</strong><br />
Status<br />
<strong>2011</strong> – <strong>2012</strong><br />
Target<br />
<strong>2012</strong> - 2013<br />
Land rehabilitated (hectares) 76.2 40 3 40<br />
Land disturbed (hectares) 68.4 36.5 74.9<br />
Number of significant<br />
environmental incidents<br />
Number of regulatory<br />
penalties<br />
Annual Average % Waste<br />
Recycled<br />
Number of environmental<br />
newsletters distributed<br />
0 0 0<br />
0 1 0<br />
70 75 75<br />
4 2 3<br />
3 At the end of the <strong>2011</strong>-<strong>2012</strong> reporting period, WCPL have shaped approximately 40ha at RL160 in preparation for final rehabilitation<br />
planned for September <strong>2012</strong>.<br />
Page 15
2010-<strong>2011</strong> <strong>AEMR</strong><br />
Table 1.7 – Actions from 2010-<strong>2011</strong> Annual Environmental Management Report Review<br />
No DRE Issue DRE Action Description Summary Due Comments<br />
1 No bioremediation site Details <strong>Wambo</strong> <strong>Coal</strong>’s spill management<br />
documentation<br />
30 April <strong>2012</strong> A new location was selected for the bioremediation area. For<br />
further details please refer to Section 3.6.<br />
2 Contractor laydown areas not<br />
formalised<br />
Develop formal laydown areas Next <strong>AEMR</strong> WCPL currently investigating options to centralise a contractor<br />
laydown area and the outcomes provided in the next <strong>AEMR</strong>.<br />
3 Lack of progressive rehabilitation<br />
undertaken in reporting period<br />
Immediate address of temporary<br />
stabilisation cover of disturbed areas<br />
1 March <strong>2012</strong> Please refer to Section 5.0 of the <strong>AEMR</strong>.<br />
Need to catch up and redress the shortfall in<br />
progressive rehabilitation in the <strong>Wambo</strong><br />
<strong>Coal</strong> MOP commitments<br />
Throughout<br />
<strong>2012</strong> by next<br />
<strong>AEMR</strong><br />
Please refer to Section 5.0 of the <strong>AEMR</strong>.<br />
4 North East Tailings Dam<br />
Rehabilitation 4 Progress reports for the tailings dam<br />
rehabilitation to be provided to DII’s<br />
Environmental Sustainability Unit as well as<br />
Mine Safety Department.<br />
Report progress<br />
in next <strong>AEMR</strong>.<br />
<strong>Wambo</strong> commenced monthly reporting of the NETD<br />
rehabilitation status to the DII (Mine Safety) and the NSW Dam<br />
Safety Committee in October 2009. See Section 5.0 of the<br />
<strong>AEMR</strong> for further details.<br />
No DP&I Issue DP&I Action Description Summary Due Comments<br />
1 Rehabilitation No rehabilitation work was completed and<br />
the rehabilitation target was not achieved for<br />
the 2010-11 reporting period. The DP&I<br />
note in a letter dated 23 January <strong>2012</strong> that<br />
the mine was committed to rehabilitate<br />
approximately 40ha of the RL160<br />
overburden dump surface by June <strong>2012</strong>.<br />
30 June <strong>2012</strong> Please refer to Section 5.0 of the <strong>AEMR</strong>.<br />
2 Homestead Complex The Department is satisfied with the<br />
continuing work on the Homestead<br />
Complex, which appears to be progressing<br />
generally in accordance with the interim<br />
Conservation Management Plan dated 15<br />
August <strong>2011</strong><br />
Completed Please refer to Section 3.13.2 of the <strong>AEMR</strong><br />
4<br />
Carry over action form 2009/2010 <strong>AEMR</strong><br />
Page 16
2010-<strong>2011</strong> <strong>AEMR</strong><br />
No DP&I Issue DP&I Action Description Summary Due Comments<br />
3 Water Management Structures Provide a timetable for the upgrade of the<br />
Open cut workshop area, including for the<br />
drain to the Box Cut Dam<br />
Completed in<br />
May <strong>2012</strong><br />
The upgrades and de-silting of the drain and the installation of<br />
sediment traps around the Open Cut Workshop were completed<br />
in May <strong>2012</strong><br />
The de-silting of the Eagles Nest Dam has<br />
not been carried out. Please submit a<br />
timetable for the completion of this activity<br />
August <strong>2012</strong> De-silting of Eagles Nest Dam commenced late during the<br />
<strong>2011</strong>-<strong>2012</strong> reporting period. Works expected to be complete by<br />
August <strong>2012</strong>. See Section 3.6 of the <strong>AEMR</strong>.<br />
Continue to monitor the water leaking from<br />
Hunter Tailing Pit into the C11 Dam and<br />
advise of any changes to water quality in<br />
this area.<br />
Ongoing Monthly inspections continue to monitor. V-notched weir and<br />
sediment catchment structure has been installed to capture and<br />
accumulate sediment. Water from Hunter Tailings Pit is<br />
contained within C11 dam.<br />
Page 17
<strong>2011</strong>-<strong>2012</strong> <strong>AEMR</strong><br />
2.0 Operations During the<br />
Reporting Period<br />
2.1 Exploration<br />
Surface exploration throughout the reporting period<br />
consisted of a total of 147 boreholes at<br />
approximately 34,150 meters drilled. Exploration<br />
drilling occurred in the following<br />
areas;<br />
23 x boreholes within A444 with a total of<br />
3,350 m drilled;<br />
61 x boreholes within CCL743 with a total of<br />
19,500 m drilled;<br />
63 x boreholes within CL397 with a total of<br />
11,300 m drilled; and<br />
Drilling is required to further define coal reserves,<br />
coal quantity and gas content of the Whybrow,<br />
Redbank Creek, <strong>Wambo</strong>, Whynot, Arrowfield and<br />
Bowfield coal seams. All exploration boreholes were<br />
fully grouted upon completion.<br />
It is expected that exploration activities over the<br />
coming twelve months will continue within A444,<br />
CL397, CCL743 and EL7211. WCPL is anticipating<br />
drilling approximately 360 boreholes (approximately<br />
28,700 m) during the next reporting period. A444<br />
and EL7211 are both pending confirmation of<br />
renewal.<br />
2.2 Land Preparation<br />
In accordance with the Open Cut MOP and DA 305-<br />
2003, all land clearing at WCPL is carried out under<br />
approved management plans and procedures. One<br />
such approved management plan is the Flora and<br />
Fauna Management Plan (FFMP), which includes a<br />
Vegetation Clearance Protocol (Figure 2.1). In<br />
accordance with the FFMP, a Surface Disturbance<br />
Permit (SDP) procedure and checklist has been<br />
developed. The SDP requires the approval of<br />
WCPL’s environmental department prior to any<br />
clearing activities taking place. The SDP aims to<br />
identify any environmental issues such as Cultural<br />
Heritage sites, flora and fauna communities, surface<br />
drainage, threatened species, and the identification<br />
of any seed or timber resources that can be<br />
salvaged.<br />
In addition to the FFMP, WCPL have developed a<br />
Timber Management Plan (TMP). The TMP has<br />
identified a number of options regarding the<br />
management and salvage of timber resources,<br />
dependent on the characteristics of the vegetation<br />
to be cleared, and is determined on a case by case<br />
basis.<br />
Nominally, a minimum of 100 millimetres (mm) of<br />
topsoil is recovered from the surface prior to mining<br />
an area. The actual volume of topsoil recovered is<br />
dependent on the depth of insitu soil conditions (e.g.<br />
deeper in alluvial areas and shallower on ridge<br />
lines), and the quality of the material.<br />
Where possible, direct placement of stripped topsoil<br />
onto re-profiled areas is preferred to stockpiling, in<br />
order to avoid rehandling and reduce the potential<br />
for further topsoil degradation or loss. However, due<br />
to lack of available area, this was not possible<br />
during this reporting period. If a re-profiled surface is<br />
not available, the topsoil is stockpiled. The<br />
treatment of the topsoil stockpiles is dependent on<br />
the planned timeframe between construction and<br />
use. If these stockpiles are to be left for longer than<br />
three months, they are generally shaped into<br />
elongated mounds and seeded with pasture to keep<br />
the soil fertile, stop weeds from growing and to<br />
reduce soil loss.<br />
Due to a change in dump plan for the RL 160 dump,<br />
approximately 14.2ha of previously rehabilitated<br />
land was re-disturbed during the reporting period.<br />
The topsoil and established pasture vegetation was<br />
recovered from the re-disturbed area prior to<br />
dumping.<br />
2.3 Construction<br />
During the reporting period there were a number of<br />
major projects completed or commenced across<br />
WCPL operations, these included:<br />
Maingate 8 High Wall Stabilisation: The project<br />
included meshing and rock bolting of the high wall<br />
above the new portal entries in the former<br />
Homestead Pit. The project also completed<br />
stabilising the wall behind the main Homestead<br />
Ventilation Fan. The box culvert portal entries in the<br />
former Homestead Pit have now been placed into<br />
final position on the established hardstand pad.<br />
Ground shaping for internal drainage above the<br />
Homestead Pit at the entry to Maingate 8 has been<br />
completed, with drain overpass design to be<br />
completed during the next reporting period.<br />
Finalised plans of adjacent infrastructure areas<br />
including the electrical enclosures are due to be<br />
finalised in July <strong>2012</strong>.<br />
North <strong>Wambo</strong> Creek Diversion (Stage 3):<br />
Construction works were nearing completion on the<br />
final stage (i.e. Stage 3) of the North <strong>Wambo</strong> Creek<br />
Diversion program. At the end of the reporting<br />
period approximately 800,000 m 3 of excavation had<br />
been carried out to construct the permanent creek<br />
line around the old Wollemi Underground Portal<br />
area, in conjunction with revegetation works.<br />
Page 18
<strong>2011</strong>-<strong>2012</strong> <strong>AEMR</strong><br />
Figure 2.2 – Vegetation Clearance Protocol<br />
Page 19
<strong>2011</strong>-<strong>2012</strong> <strong>AEMR</strong><br />
The construction of this diversion will allow the open<br />
cut to progress mining the Bates South area and<br />
provide future access to the proposed South Bates<br />
underground longwall panels.<br />
2.4 Mining<br />
2.4.1 Production and Waste Summary<br />
Table 2.1 provides a summary of coal production for<br />
the <strong>2011</strong>-<strong>2012</strong> reporting period. During the<br />
reporting period, a combined total of 8.746 (Mt) of<br />
ROM coal was mined, representing a 0.18%<br />
increase compared with the 2010-<strong>2011</strong> reporting<br />
period.<br />
Stage 3 North <strong>Wambo</strong> Creek Diversion<br />
QR Refuelling: Construction works are nearing<br />
completion on this project which will allow the onsite<br />
refuelling of the Queensland Rail (QR) locomotive<br />
engines utilising the <strong>Wambo</strong> coal loading terminal.<br />
The new refuelling facility includes a Transtank for<br />
diesel storage, sanding tanks, structural steel<br />
platforms at rail level, drainage works and oily water<br />
management system. It is anticipated the remaining<br />
installation works will be finished by August <strong>2012</strong><br />
with commissioning completed by September <strong>2012</strong>.<br />
Location of the locomotive refuelling station (WES <strong>2011</strong>)<br />
Homestead Backfill Project: The Backfill Project<br />
involves the placement of a grouted paste into the<br />
old Homestead underground mine workings. These<br />
workings are in the Whybrow seam some 40 metres<br />
below the surface. In order to fill the old<br />
underground roadways approximately 300<br />
boreholes are planned. The boreholes are drilled<br />
down to intersect the old workings and a paste<br />
mixer is then used to produce a grouting mix that is<br />
gravity fed into the boreholes until the void and<br />
boreholes are filled.<br />
Open cut operations in the reporting period were<br />
undertaken generally in accordance with the Open<br />
Cut MOP, however the provisional mine production<br />
schedule in the Open Cut MOP for the <strong>2011</strong>-<strong>2012</strong><br />
reporting period was not achieved. The provisional<br />
mine production in the MOP for Financial Year <strong>2012</strong><br />
estimated 8.9Mt ROM from the open cut. During the<br />
reporting period the actual ROM for the open cut<br />
was 3.949Mt. Market conditions and WCPL not<br />
implementing the production increases with the<br />
Contractor for the open cut has resulted in lower<br />
production tonnages and lower volumes of waste<br />
rock handling and topsoil removal.<br />
During the reporting period, approximately<br />
180,678m 3 of topsoil was recovered, whilst no<br />
topsoil was used for rehabilitation purposes during<br />
this reporting period. However WCPL planned to<br />
spread approximately 273,660m 3 in the next<br />
reporting period. Approximately 34,223,764bcm of<br />
overburden material was removed during the<br />
reporting period, almost 53% of the nominated<br />
target of 63.7Mcm for FY12 as provided in the Open<br />
Cut MOP.<br />
Underground operations in the reporting period<br />
were generally in accordance with the Underground<br />
MOP. The provisional mine production schedule in<br />
the Underground MOP for the <strong>2011</strong>-<strong>2012</strong> reporting<br />
period allowed for approximately 2.872Mt ROM coal<br />
mined. However the actual ROM coal for reporting<br />
period was 4.797Mt, approximately 1.7% increase<br />
on FY11.<br />
2.4.2 Estimated Mine Life<br />
<strong>Coal</strong> resources in the Colliery Holding and A444<br />
exploration area are approximately 648 Mt with<br />
greater than 64.3% (416.7 Mt) of the resource at<br />
measured status. WCPL has approval to mine up to<br />
14.7 Mt per annum of ROM coal for 21 years from<br />
2004 within the Colliery Holding. This mining will<br />
take place through the existing Open Cut operations<br />
in the Whybrow, Redbank Creek, <strong>Wambo</strong> and<br />
Whynot seams and Underground mining in the<br />
<strong>Wambo</strong> seam.<br />
Page 20
<strong>2011</strong>-<strong>2012</strong> <strong>AEMR</strong><br />
Table 2.1 – Production and Waste Summary<br />
Cumulative Production<br />
Unit<br />
2010-<strong>2011</strong><br />
Reporting<br />
Period<br />
<strong>2011</strong>-<strong>2012</strong><br />
Reporting<br />
Period<br />
<strong>2012</strong>-2013<br />
Reporting<br />
Period<br />
(Prediction)<br />
Topsoil Stripped m 3 194,750.5 180,678 28,507<br />
Topsoil<br />
Used/Spread<br />
Overburden<br />
Moved<br />
Processing<br />
Waste<br />
m 3 9,800 0 273,660<br />
bcm 27,583,359 34,223,764 28,071,879<br />
Mt 3.036 3.246 2.834<br />
ROM <strong>Coal</strong> Mined Mt 8.730 8.746 8.288<br />
- Open Cut Mt 4.015 3.949 3.833<br />
- Underground Mt 4.715 4.797 4.455<br />
Product Mt 5.680 5.698 5.478<br />
Page 21
<strong>2011</strong>-<strong>2012</strong> <strong>AEMR</strong><br />
2.4.3 Underground Operations<br />
WCPL’s North <strong>Wambo</strong> Underground (NWU) mines<br />
the <strong>Wambo</strong> seam using continuous miners and<br />
longwall mining methods. The first of eight longwall<br />
blocks (LW1) was completed in February 2009 and<br />
production commenced in the second longwall block<br />
(LW2) in March 2009. In December 2010, extraction<br />
of Longwall Panel 3 (LW3) was completed, with<br />
production of Longwall Panel 4 (LW4) commencing<br />
in January <strong>2011</strong>. During November <strong>2011</strong> LW4 was<br />
completed. Extraction of Longwall Panel 5 (LW5)<br />
commenced during December <strong>2011</strong>. At the end of<br />
the reporting period LW5 had retreated<br />
approximately 2,858m. The completion of LW5 is<br />
expected during August <strong>2012</strong>. The NWU continues<br />
to operate seven days a week.<br />
In total 8 x 250m wide Longwall panels,<br />
approximately 3.8 km to 4 km in length will be<br />
developed with the Longwall panels orientated<br />
south-west to north-east. Longwall panels one to<br />
five will be developed off main headings driven from<br />
the existing Bates North Open Cut highwall. The<br />
remaining three panels will be developed by punch<br />
mining directly off the Homestead Pit Open Cut<br />
highwall.<br />
WCPL primarily use Joy Mining Longwall<br />
equipment, including the Longwall operating<br />
system. The Longwall panels are formed by driving<br />
two sets of gateroads (the tailgate and maingate<br />
roads). Each gateroad requires two roadways<br />
(headings) to be driven parallel to each other (31 m<br />
apart). One of the roadways is used for personnel<br />
and materials access and fresh air intake ventilation<br />
while the other is used for coal clearance and return<br />
air ventilation. The roadways are developed using<br />
two Joy 12CM30 continuous miners. Approximately<br />
77,382m of development has occurred since the<br />
commencement of North <strong>Wambo</strong> Underground, with<br />
a total of 17,695m of Longwall retreat.<br />
The headings are connected every 100m by driving<br />
a cut through from one heading to another. This<br />
forms pillars of coal along the length of the<br />
gateroad. The tailgate and maingate roads are<br />
separated by the 250 m wide Longwall panel. The<br />
maingate roads and tailgate roads are then linked<br />
together by driving an installation road and bleeder<br />
road at the inbye end of the longwall panels.<br />
As the continuous miners develop the roadways,<br />
Run of Mine (ROM) coal is conveyed to a stockpile<br />
with an approximate 70,000 tonne capacity. When<br />
a sufficient stockpile is present, coal is loaded onto<br />
trucks for transport to the CHPP. During the <strong>2011</strong>-<br />
<strong>2012</strong> reporting period, approximately 4.79 Mt of<br />
ROM coal was produced by NWU.<br />
At the end of the reporting period the following<br />
equipment was available for mining activities at the<br />
Underground, including:<br />
<br />
<br />
<br />
<br />
2 x Joy 12CM29 Continuous miners;<br />
1 x Joy 12CM30 Continuous miner<br />
3 x electric shuttle cars with a 15 t payload;<br />
8 x Load Haul Dump (LHD) machines;<br />
9 x personnel transporters Specialised<br />
Mining Vehicles (SMV’s);<br />
<br />
<br />
<br />
<br />
<br />
<br />
<br />
Associated longwall equipment;<br />
146 Joy Roof Supports;<br />
2 x Joy 7LS2a Shearers;<br />
2 x BSL and AFC systems;<br />
2 x Monorail system;<br />
2 x Pump sled; and<br />
2 x 5MVA Transformer<br />
The old Wollemi Underground Mine was on care<br />
and maintenance throughout the reporting period<br />
with no coal being produced from this mine. The old<br />
Wollemi workshop, bathhouse and store facilities<br />
previously used by the WCPL’s Underground<br />
operations were decommissioned during October<br />
2008 due to the completion of the new<br />
administration and bathhouse facilities. The sealing<br />
of the old Wollemi Mine was completed during the<br />
reporting period on 25 May <strong>2012</strong>.<br />
2.4.4 Open Cut Operations<br />
Downer EDI Mining are contracted to undertake<br />
Open Cut mining operations at WCPL. Open cut<br />
mining is divided into pits known as the Bates Pit,<br />
Bates South Pit, Montrose Pit and the Homestead<br />
Pit. The Bates Pit, Bates South Pit and the<br />
Montrose Pit are adjoining and linked via a mining<br />
corridor. The Homestead Pit is a separate mining<br />
area. Operations during the reporting period<br />
occurred in the Bates Pit, Bates South Pit, Montrose<br />
Pit and the Homestead Pit. The current Open Cut<br />
workings are presented in Figure 2.2.<br />
Mining of the Open Cut commences with the<br />
removal of vegetation and topsoil as described in<br />
Section 2.2. Following land preparation,<br />
excavators and trucks remove any weathered<br />
material as a “free dig” operation. The weathered<br />
material that can be free dug ranges from one metre<br />
to ten metres in thickness. The remaining<br />
overburden is drilled, blasted and removed utilising<br />
the excavators and rear dump haul trucks to<br />
uncover the coal.<br />
Page 22
<strong>2011</strong>-<strong>2012</strong> <strong>AEMR</strong><br />
The exposed coal is mined using excavators and<br />
loaded into haul trucks. The intervening clay bands,<br />
when thick enough, are excavated and loaded out<br />
separately for disposal in pit to avoid complications<br />
in the coal washing process. The coal is mined<br />
without blasting. The majority of ROM coal is<br />
delivered directly from the Open Cut to the ROM<br />
dump hopper using haul trucks, with the balance<br />
temporarily stockpiled on the ROM coal stockpile<br />
pad. Mining is based on a shift roster of two 12.5<br />
hour shifts per day. Table 2.2 shows annual ROM<br />
production levels from Open Cut mining at WCPL<br />
for the past 15 years.<br />
Table 2.2 – Annual Open Cut ROM Production Levels<br />
Year<br />
<strong>Coal</strong><br />
(ROM<br />
tonnes)<br />
Overburden<br />
(Bank Cubic<br />
Metres)<br />
Ratio<br />
1997-1998 1,232,658 7,322,227 6.2:1<br />
1998-1999 482,002 1,684,484 3.5:1<br />
1999-2000 13,700 41,800 3.0:1<br />
2000-2001 0 0 -<br />
2001-2002 922,613 8,025,081 8.7:1*<br />
2002-2003 3,671,000 22,550,000 6.1:1<br />
2003-2004 4,220,000 23,530,000 5.6:1<br />
2004-2005 4,186,000 23,240,000 5.6:1<br />
2005-2006 5,424,000 30,620,000 5.6:1<br />
2006-2007 5,790,000 35,150,783 6.1:1<br />
2007-2008 4,245,395 27,854,967 6.6:1<br />
2008-2009 3,386,614 23,886,024 7.1:1<br />
2009-2010 2,751,000 19,866,651 7.2:1<br />
2010-<strong>2011</strong> 4,015,000 27,583,359 6.9:1<br />
<strong>2011</strong>-<strong>2012</strong> 3,949,250 34,223,764 8.7:1<br />
* Anomalously high ratio due to reopening and expansion.<br />
During the reporting period, Open Cut coal was<br />
primarily mined from the Whybrow, Redbank Creek,<br />
<strong>Wambo</strong> and Whynot seams. Backfilling of the<br />
Wombat Pit and Bates Pit continued, reducing the<br />
need for out of pit dump space.<br />
At the end of the reporting period the following<br />
equipment was utilised to undertake Open Cut<br />
mining activities:<br />
2 x Cat 16H Grader<br />
1 x Cat 16M Grader<br />
1 x Cat 24H Grader<br />
2 x Cat 773 Service Truck<br />
1 x Cat 773D Water Cart<br />
1 x Cat 775D Water Cart<br />
2 x Cat 777C Water Cart<br />
7 x Cat 785B Dump Truck<br />
9 x Cat 785C Dump Truck<br />
6 x Cat 789C Dump Truck<br />
6 x Hitachi EH3500 Dump Trucks<br />
2 x Komatsu 830E Dump Truck<br />
11 x Komatsu 930E Dump Truck<br />
6 x Komatsu HD785 Dump Truck<br />
4 x Cat 793B Dump Truck<br />
2 x Cat 793C Dump Truck<br />
1 x Cat 972H Loader<br />
1 x Cat 992D Loader<br />
1 x Cat 992G Wheel Loader<br />
1 x Cat 994 Wheel Loader<br />
1 x Cat D10R Dozer<br />
3 x Cat D10T Dozer<br />
1 x Cat D11N Dozer<br />
7 x Cat D11R Dozer<br />
1 x Hitachi EX2500 Excavator<br />
1 x Hitachi EX3600 Excavator<br />
3 x Komatsu PC5500 Excavator<br />
1 x Komatsu PC250-6 Excavator<br />
1 x Liebherr R994B Excavator<br />
1 x Liebherr R996 Excavator<br />
2.5 <strong>Coal</strong> Handling and<br />
Preparation<br />
The coal handling process is illustrated in Figure<br />
2.3. <strong>Coal</strong> from the Open Cut and Underground<br />
operations is transferred to the CHPP via haul<br />
trucks on internal haul roads. <strong>Coal</strong> is tipped directly<br />
into the 400 tonne ROM bin or stockpiled adjacent<br />
to the ROM bin and subsequently loaded into the<br />
ROM crusher using a front-end loader, as required.<br />
Three stages are used to crush the ROM coal. The<br />
crushed coal passes into the CHPP, then into two<br />
separate Modules which contain dense medium<br />
cyclone coarse coal circuits. These operate in<br />
parallel with a teetered bed separator for the<br />
beneficiation of fine material in Module 2, and<br />
spirals in Module 1.<br />
All clean coal is conveyed to the clean coal<br />
stockpile. Four underground reclaim points feed<br />
coal from the clean coal stockpile onto the reclaim<br />
conveyor (The fourth reclaim point was previously<br />
used to feed the clean coal from United.) The<br />
reclaim conveyor transfers coal onto the load-out<br />
conveyor, which conveys to the train load-out bin.<br />
The WCPL train loading system is designed to load<br />
trains at a rate of 4,500 tonnes per hour (tph).<br />
Details of the amount of coal transported by rail<br />
from the rail load facility are presented in Appendix<br />
1. All coal produced by WCPL was transported by<br />
rail during the reporting period. During the reporting<br />
period the CHPP processed a total of 8.730 Mt<br />
ROM coal. The average coal recovery was 65%.<br />
Page 23
SUMP<br />
SUMP<br />
UNITED COLLIERY<br />
GOLDEN<br />
HIGHWAY<br />
WOMBAT DUMP<br />
MONTROSE PIT<br />
WAMBO OPEN CUT<br />
HUNTER PIT TAILINGS DAM<br />
SOUTH BATES PIT<br />
NORTH WAMBO CREEK<br />
DIVERSION<br />
WOLLEMI BOXCUT<br />
STAGE 3 CREEK<br />
DIVERSION<br />
NORTH WAMBO UNDERGROUND<br />
HOMESTEAD<br />
PIT<br />
WAMBO ADMIN<br />
WAMBO CHPP<br />
NORTH WAMBO<br />
BROOK<br />
CREEK<br />
WOLLOMBI<br />
STONY<br />
CREEK<br />
SOUTH<br />
WAMBO<br />
CREEK<br />
Legend<br />
Colliery Holding Boundary<br />
DA Approved Open Cut Limits<br />
MOP Open Cut Limits<br />
<strong>Wambo</strong> Owned Land<br />
North <strong>Wambo</strong> Underground Workings (Existing)<br />
North <strong>Wambo</strong> Underground Workings (Proposed)<br />
Open Cut Mining at 30th June <strong>2012</strong><br />
Dams<br />
Creeks<br />
Prepared by Pegasus Technical CAD FILE: 08671A<br />
WAMBO COAL<br />
EXTENT OF MINING OPERATIONS<br />
FIGURE 2.2
<strong>2011</strong>-<strong>2012</strong> <strong>AEMR</strong><br />
Figure 2.3 – <strong>Coal</strong> Handling and Preparation Plant Process<br />
Page 25
<strong>2011</strong>-<strong>2012</strong> <strong>AEMR</strong><br />
2.5.1 Reject Management<br />
2.5.1.1 Chemical and Physical<br />
Characteristics of Reject<br />
The CHPP beneficiates ROM coal to produce both a<br />
high energy steaming coal and a pulverised coal<br />
injection product, the by-product being reject made<br />
up of carbonaceous shale and waste rock material.<br />
The rejects represent approximately 30-35% of the<br />
ROM coal processed in the plant and are classified<br />
as either coarse or fine<br />
Coarse reject typically represent two-thirds of this<br />
material and is made up of
<strong>2011</strong>-<strong>2012</strong> <strong>AEMR</strong><br />
January 2009, the waste from the Open Cut<br />
workshop is now managed as part of the TWMS.<br />
<br />
<br />
Underground portal area, and<br />
Open Cut workshop and wash down area.<br />
The TWMS was reviewed during the reporting<br />
period and a revised contract with the preferred<br />
licensed waste contractor commenced in December<br />
<strong>2011</strong>.<br />
2.6.1 Sewage Treatment and<br />
Disposal<br />
Sewage from the various areas of mining operation<br />
is treated in four onsite treatment systems as<br />
follows:<br />
<br />
<br />
<br />
<br />
CHPP Bathhouse – septic tank system which<br />
feeds to a transpiration area;<br />
CHPP Control Room – biocycle system;<br />
Administration Buildings – effluent system<br />
pumps to a transpiration dam located to the<br />
west of the complex; and<br />
North <strong>Wambo</strong> Underground Portal – effluent<br />
collection tank.<br />
The Wollemi Bathhouse and Facilities are no longer<br />
in use. The effluent treatment system is not<br />
operational and these facilities have now been<br />
decommissioned.<br />
Effluent treatment systems are inspected and<br />
maintained on a periodic basis to ensure effective<br />
operation. All effluent collected from the<br />
Underground portal is disposed of by a licensed<br />
contractor and records are maintained on site.<br />
2.6.2 Rubbish Disposal<br />
Bulk garbage bins for each waste stream are<br />
located around site. These bins are collected and<br />
managed on a regular basis by a licensed waste<br />
contractor. For details of waste disposed and<br />
recycled during the reporting period please refer to<br />
Table 2.4.<br />
2.6.3 Oily Waste Disposal<br />
Waste oils from the site are collected, stored and<br />
are removed by a licensed waste contractor on a<br />
periodic basis for reprocessing and reuse. For<br />
details of waste oil disposal during the reporting<br />
period please refer to Table 2.4.<br />
A mix of passive and active oily water separator<br />
systems for the separation of hydrocarbons from<br />
oily water runoff, are located across the site<br />
including:<br />
the rail load out,<br />
Licensed waste contractors remove collected waste<br />
oil from the separators on a regular basis. Routine<br />
inspections are carried out on all systems to ensure<br />
that there are no blockages or overflows. Records of<br />
all waste disposals are kept on site.<br />
2.7 ROM and Product <strong>Coal</strong><br />
Stockpiles<br />
A 70,000 tonne ROM coal stockpile for underground<br />
coal is located near the Underground portal level,<br />
just east of the Underground entrance.<br />
Underground coal is conveyed to the Underground<br />
ROM stockpile from the portal entrance by<br />
Conveyor CV01.<br />
<strong>Coal</strong> is transported from the Open Cut and<br />
Underground ROM Stockpile via truck and either<br />
tipped directly into the 400 tonne ROM hopper or<br />
stockpiled adjacent to the ROM bin. The ROM<br />
stockpile area is approximately 200m x 200m with a<br />
ROM coal storage capacity of approximately<br />
250,000 tonnes.<br />
The capacity of WCPL clean coal stockpile is<br />
approximately 500,000 tonnes.<br />
2.8 Water Management<br />
The water management system at WCPL comprises<br />
clean water (imported water from the Hunter River<br />
or Wollombi Brook), mine water (collected run-off<br />
from disturbed catchments or recycled water from<br />
the CHPP) and fresh water (either imported from the<br />
town supply or collected rainwater). The water<br />
management system is illustrated in Figures 2.4<br />
and 2.5 and major storages are presented in Table<br />
2.3.<br />
A network of storages and drains has been<br />
established to capture runoff from mine water<br />
catchment areas. Runoff from areas disturbed by<br />
mining (including the CHPP and associated<br />
industrial areas) is collected in Open Cut voids and<br />
other mine water storages. These storages are<br />
used as priority water sources for the CHPP and<br />
dust suppression. Runoff from haul roads is treated<br />
in sediment dams or diverted to mine water<br />
storages.<br />
CHPP tailings are discharged to the Hunter Pit<br />
tailings dam. Water that is liberated from the settled<br />
tailings filters through spoil at the southern end of<br />
the dam and reports to the North Homestead Pit.<br />
Water is reticulated from this pit back to the CHPP.<br />
Page 27
<strong>2011</strong>-<strong>2012</strong> <strong>AEMR</strong><br />
Runoff from rehabilitated and establishing<br />
revegetated mine areas is directed to sediment<br />
dams. These are either allowed to drain to local<br />
drainages or directed to mine water storages,<br />
depending upon the water quality.<br />
An extensive reticulation system has been<br />
developed to:<br />
transfer water between Open Cut and<br />
Underground operations and mine water<br />
storages;<br />
<br />
<br />
<br />
source water from Wollombi Brook and the<br />
Hunter River;<br />
facilitate controlled releases to Wollombi Brook;<br />
and<br />
(until the end of 2009) provided water to the<br />
adjacent United Collieries operation.<br />
<br />
such as upgrades to pump-out lines from the<br />
Bates Pit area and movement towards an<br />
integrated water management system; and<br />
automation of major pump installations across<br />
the site was maintained and refined;<br />
Maintenance of pumping infrastructure<br />
continued.<br />
The available water sources and underground<br />
storage capacity for mine water have provided<br />
WCPL with flexibility to manage its water system.<br />
During the reporting period the main water<br />
management related activities included:<br />
<br />
<br />
<br />
<br />
<br />
<br />
<br />
<br />
<br />
<br />
<br />
reviewing the site water balance for the short<br />
and medium term, taking into account the new<br />
MOP and water availability;<br />
dewatering of the Open Cut from Bates South<br />
and Montrose pits;<br />
Controlling water levels in the Underground<br />
workings;<br />
maintaining water supply to the Open Cut truck<br />
fill water tanks to provide water for dust<br />
suppression;<br />
maintenance and testing of the Hunter River<br />
Salinity Trading Scheme (HRSTS) discharge<br />
system;<br />
continued decanting of water from the Hunter<br />
Pit (emplacement area) Tailings to the<br />
Homestead Pit for reuse;<br />
maintenance of the fire water reticulation<br />
system to the <strong>Wambo</strong> Homestead complex;<br />
continued installation and refining of telemetry<br />
for site water management and control;<br />
continued dewatering from the No.2 and No.1<br />
boreholes and installed bores 1A, 1B, 1C, 1D<br />
and 4C;<br />
Dewatering of the Homestead Pit void;<br />
planning and execution of modifications to<br />
water management systems in the Open Cut<br />
Page 28
<strong>2011</strong>-<strong>2012</strong> <strong>AEMR</strong><br />
Table 2.3 – Stored Water Summary<br />
Volume Held ML<br />
Start of<br />
Reporting<br />
Period<br />
End of<br />
Reporting<br />
Period<br />
Storage<br />
Capacity<br />
Clean Water<br />
Admin Box Cut 285 258 258<br />
Wollemi Box Cut (alluvial)
Legend<br />
Colliery Holding Boundary<br />
Inpit Catchments<br />
Dump Catchments<br />
Dams<br />
Creeks<br />
WAMBO COAL<br />
WATER STORAGE CATCHMENT AREAS<br />
FIGURE 2.4<br />
Prepared by Pegasus Technical CAD FILE: 08672A
<strong>2011</strong>-<strong>2012</strong> <strong>AEMR</strong><br />
Table 2.4 – WCPL Waste Statistics<br />
<strong>Wambo</strong> <strong>Coal</strong> Jul-11 Aug-11 Sep-11 Oct-11 Nov-11 Dec-11 Jan-12 Feb-12 Mar-12 Apr-12 May-12 Jun-12 YTD<br />
Chemical Anchors 3018 739 1409 1747 3410 10,323<br />
Medical Waste 0<br />
Oily Rags 482 521 454 643 669 597 923 790 832 963 889 7,763<br />
Miscellaneous Chemical disposal 0<br />
Hazardous Disposal 482 3,539 454 1,382 2,078 2,344 923 790 4,242 963 889 0 18,086<br />
General Waste Bulk 40,940 68,520 45,120 40,300 51,460 53,800 28,980 76,820 45,640 43,764 34,340 529,684<br />
General Waste Front Lift 9,885 12,549 8,620 10,560 11,265 13,130 10,040 15,320 11,919 13,640 14,010 130,938<br />
Pallets/Timber Recycling 2,400 2,880 2,420 1,440 9,140<br />
Non-Hazardous Disposal 50,825 81,069 53,740 50,860 62,725 66,930 39,020 94,540 60,439 59,824 49,790 0 669,762<br />
Total Disposal 51,307 84,608 54,194 52,242 64,803 69,274 39,943 95,330 64,681 60,787 50,679 0 687,848<br />
% 28.39% 34.30% 20.82% 16.74% 25.51% 22.73% 20.71% 29.33% 21.53% 24.15% 20.55% #DIV/0! #DIV/0!<br />
Contaminated Grease 584 2,158 210 42 37 1,786 32 79 4,928<br />
Empty Oil Drums 881 3,468 2,683 2,197 1,509 986 695 1,134 1,266 1,818 1,185 17,822<br />
Fluorescent Tubes 0<br />
Hydraulic Hose 1,539 2,158 1,445 475 1,175 981 932 2,861 1,948 2,319 1,153 16,986<br />
Oil Filters 1,413 40 1,345 2,798<br />
Oily Water 0 15,610 15,610<br />
Parts Washer 35 0 120 155 0 0 240 550<br />
Hazardous Recycle / Reuse 2,420 7,658 6,286 2,922 2,846 2,159 1,627 5,781 3,214 21,124 2,657 0 58,694<br />
Confidential Documents 93 129 97 86 53 74 103 202 837<br />
Comingled Recycling 2,550 1,910 1,740 2,339 2,182 1,710 1,550 4,496 1,440 1,690 2,130 23,737<br />
Non-Hazardous Recycle / Reuse 2,643 2,039 1,740 2,436 2,268 1,763 1,550 4,570 1,543 1,690 2,332 0 24,574<br />
E-Waste 70,000 114,000 130,500 90,500 97,500 502,500<br />
Effluent 78,500 51,750 72,500 166,250 121,500 119,200 609,700<br />
Recycle cartridges Planet Ark 13 13<br />
Coolant 4,700 4,700<br />
Timber Recycling 4,860 2,240 2,520 2,220 3,320 429 15,589<br />
Scrap Steel 2,680 46,340 77,240 35,860 22,900 51,750 31,540 51,560 43,960 41,480 34,460 439,770<br />
Tyre Recycling 0<br />
Waste Batteries 54 54<br />
Waste Oil 38,300 47,000 40,300 40,200 39,700 57,300 43,500 53,800 44,000 35,000 58,500 497,600<br />
Washbay 5,000 5,500 10,000 12,455 1,100 34,055<br />
Other Recycle / Reuse 124,353 152,384 198,060 254,530 184,100 231,570 149,740 219,360 230,915 168,080 190,889 0 2,103,981<br />
Total Recycle / Reuse 129,416 162,081 206,086 259,888 189,214 235,492 152,917 229,711 235,672 190,894 195,878 0 2,187,249<br />
% 71.61% 65.70% 79.18% 83.26% 74.49% 77.27% 79.29% 70.67% 78.47% 75.85% 79.45% #DIV/0! #DIV/0!<br />
Figure 2.5 Water Reticulation Diagram<br />
Page 31
<strong>2011</strong>-<strong>2012</strong> <strong>AEMR</strong><br />
2.8.1 Water Supply and Use<br />
Continuity of water supply to the CHPP, Open Cut<br />
and Underground is important for the processing of<br />
coal and the operation of the mine. During this<br />
reporting period the site water balance for the<br />
mining activities was recalculated. This water<br />
balance is presented in Table 2.5.<br />
WCPL manages its water supply through a number<br />
of site water storage dams. The mine routinely<br />
obtains water from the Hunter River Licence<br />
(Number 20AL200631), Wollombi Brook Licence<br />
(Number 20SL033872), the Wollemi and<br />
Homestead goaf areas and from rainfall runoff.<br />
WCPL’s annual water catchment generally matches<br />
operational water requirements for CHPP and Open<br />
Cut usage. In 2010-<strong>2011</strong>, minimal water was<br />
extracted from the Hunter River catchment via the<br />
Wollombi Brook pumps. Water extracted from<br />
Wollombi Brook (and the Hunter River) is used to<br />
supply the fire suppression system, underground<br />
operations and open cut workshop.<br />
2.8.2 Surface Water Management<br />
To minimise the potential for water quality impacts<br />
from mining operations, a network of water storages<br />
has been established to separate the clean water<br />
(runoff from undisturbed areas) and dirty water<br />
(runoff from disturbed areas). Rainfall runoff from<br />
undisturbed areas is diverted away from mining<br />
areas. Runoff from areas disturbed by mining is<br />
diverted into the onsite dams for use across the site.<br />
West Cut Dam and Area C Dam have now been<br />
dewatered and are only sumps.<br />
South <strong>Wambo</strong> Dam, Chitter Dam, Homestead Pit<br />
(North) decant dam and sumps across site are<br />
pumped to the CHPP’s supply dam (Eagle’s Nest)<br />
and to tank fill points in the Open Cut to allow water<br />
carts to fill and assist in dust suppression.<br />
The wash down and runoff water from the CHPP<br />
and adjacent stockpiles is accumulated in<br />
sedimentation ponds which feed into the Gordon<br />
Below Franklin Dam network. The Gordon Below<br />
Franklin Dam network is designed to slow the flow<br />
of the water and encourage the precipitation of fine<br />
sediment to drop out. The sediment ponds are<br />
cleaned out on a regular basis using a variety of<br />
methods including dredging and truck and<br />
excavator. Water from these dams is returned to the<br />
Eagles Nest Dam. A new dredging program was<br />
carried out during the period to remove excess<br />
sediment from the CHPP dam network.<br />
Water stored in Eagles Nest Dam is used in the coal<br />
washing process and for dust suppression at the<br />
CHPP.<br />
2.8.2.1 Water Balance & Modeling<br />
In March 2010, WCPL completed a detailed review<br />
of the operations water balance. The water balance<br />
is based on monitoring data from numerous water<br />
flow meters on site and information provided by<br />
WCPL technical personnel.<br />
In addition, a comprehensive predictive site water<br />
and salt model was finalised in February <strong>2011</strong>, in<br />
accordance with recent development consent<br />
requirements. The completed water model includes<br />
a predictive accounting system for water and salt<br />
budgets.<br />
2.8.2.2 NWC Discharge Report<br />
In April 2008, the North <strong>Wambo</strong> Creek (NWC)<br />
Diversion Plan was approved by DP&I, DTIRIS and<br />
NOW, subject to a number of approval conditions. In<br />
accordance with the approval conditions for the<br />
NWC Diversion Plan, WCPL must prepare and<br />
submit a flow assessment report after each flow<br />
event down the diversion.<br />
Construction of Stage 2 of the North <strong>Wambo</strong> Creek<br />
Diversion was completed in September 2008. The<br />
original design was modified to incorporate a<br />
temporary outlet from the proposed take-off point for<br />
the Stage 3 diversion channel to North <strong>Wambo</strong><br />
Creek. The design profile near the downstream end<br />
of the permanent diversion channel was also<br />
modified from the design to incorporate a large hard<br />
rock-outcrop exposed during the excavation of this<br />
area. The rock outcrop was partially excavated to<br />
form a local rock-bar.<br />
Construction of Stage 3 of the diversion<br />
commenced in late <strong>2011</strong> and remains scheduled for<br />
completion in September <strong>2012</strong>.<br />
Since the Stage 2 diversion was commissioned a<br />
series of small and medium intensity rainfall events<br />
have been experienced over the upstream and<br />
adjacent catchment areas, several of which<br />
produced a measurable flow in the diversion<br />
channel.<br />
An initial review 5 and survey of the diversion<br />
condition was undertaken in mid July 2009 following<br />
moderate flood flows recorded in February and early<br />
April 2009.<br />
Inspections were also conducted along the upper<br />
reaches of South <strong>Wambo</strong> Creek and the mid<br />
reaches of Apple tree Creek which were selected as<br />
5 Gilbert & Associates Pty Ltd “Review of North <strong>Wambo</strong> Creek<br />
Diversion (Stage 2)”, September 2009<br />
Page 32
<strong>2011</strong>-<strong>2012</strong> <strong>AEMR</strong><br />
reference creeks for use in assessing the relative<br />
performance of the diversion.<br />
Recommendations were made for remedial works in<br />
areas where it was considered that intervention was<br />
necessary to limit continued erosion and instability<br />
at unnaturally high rates and to reduce the potential<br />
for the erosional features from expanding into<br />
adjacent, stable areas. Recommendations were<br />
also made for ongoing revegetation and<br />
maintenance works to enhance the longer term<br />
integrity of the diversion as a whole.<br />
Subsequent remediation works were implemented<br />
by <strong>Wambo</strong> <strong>Coal</strong> in <strong>2011</strong> in response to the review.<br />
A second review 6 and survey of the diversion was<br />
conducted in mid-February <strong>2012</strong> following additional<br />
flow events experienced in late January early<br />
February <strong>2012</strong>.<br />
North <strong>Wambo</strong> Creek Diversion - View looking<br />
upstream from the third bend (15th February <strong>2012</strong>)<br />
The review involved inspections and survey of the<br />
condition of the diversion and repeat inspections of<br />
the reference creeks. This report has been compiled<br />
to document the finding of this second review. The<br />
focus of the second review has been on the<br />
changes that have occurred in the diversion<br />
between July 2009 and February <strong>2012</strong> surveys.<br />
Recommendations are made for remedial works in<br />
areas where it is considered that intervention is<br />
necessary to limit continued erosion and instability<br />
at un-naturally high rates and to reduce the potential<br />
for the current erosion from expanding into adjacent,<br />
stable areas. Recommendations are also made for<br />
ongoing revegetation and maintenance works to<br />
enhance the longer term integrity of the diversion as<br />
a whole.<br />
North <strong>Wambo</strong> Creek Diversion – View of Bend 8 with<br />
rip-rap on outside bank and plantings on inside bank<br />
(14th July 2009)<br />
North <strong>Wambo</strong> Creek Diversion - View looking<br />
upstream from the third bend (14th July 2009)<br />
North <strong>Wambo</strong> Creek Diversion – View of Bend 8 with<br />
rip-rap on outside bank and planting on inside bank<br />
(16th February <strong>2012</strong>)<br />
For further information regarding any remedial<br />
recommendations within the NWC Diversion, please<br />
refer to Section 5.1.4.<br />
6 Gilbert & Associates Pty Ltd “Review of North <strong>Wambo</strong> Creek<br />
Diversion (Stage 2)”, April <strong>2012</strong><br />
Page 33
<strong>2011</strong>-<strong>2012</strong> <strong>AEMR</strong><br />
2.8.3 Water Discharge<br />
WCPL’s water management system is currently<br />
balanced by the adjustment of flow from the various<br />
water sources and storages. However, where<br />
excess water is generated, WCPL has facilities to<br />
discharge water. This is done in accordance with<br />
EPL529, DA 305-7-2003, the Hunter River Salinity<br />
Trading Scheme (HRSTS), and Managed Envelope<br />
of Residuals Flood (MERF) Scheme.<br />
EPL 529 approves discharge into Wollombi Brook<br />
when the flow is greater than 500 ML/day at the<br />
Bulga gauging station, provided other conditions of<br />
the HRSTS and MERF are satisfied.<br />
During the reporting period under the HRSTS there<br />
were 19 water discharge days under HRSTS or<br />
MERF, totalling approximately 344ML discharge.<br />
Table 2.5 – <strong>2011</strong>-<strong>2012</strong> Water Balance<br />
Water Sources (ML)<br />
Hunter River 0<br />
Wollombi Brook 232<br />
United 271<br />
Rainfall/run off 3906<br />
Underground Seepage 1237<br />
Open Cut Seepage 421<br />
Wollemi Sump 5<br />
Site Wells 0<br />
Total Water Input 6072<br />
Water Usage (ML)<br />
Dust Suppression<br />
CHPP Consumption<br />
Underground<br />
United<br />
Domestic Usage<br />
621<br />
998<br />
329<br />
Total Water Usage 1950<br />
Water Loss (ML)<br />
Evaporation – Mine Water<br />
& Tailings Dams<br />
0<br />
2<br />
2893<br />
HRSTS/MERF Discharge 344<br />
Water Balance 599<br />
2.9 Hazardous Material<br />
Management<br />
WCPL has systems in place to ensure active and<br />
efficient management of hazardous material within<br />
its operations. There are several locations on site<br />
where hazardous material is stored. WCPL has<br />
storage areas at the Open Cut workshop,<br />
Underground and the CHPP. The Open Cut mining<br />
contractor and other on-site contractors are<br />
responsible for the maintenance and operation of<br />
their facilities.<br />
An audit of the storage and handling of hazardous<br />
substances and dangerous goods for the Open Cut<br />
was carried out in November 2010. The audit was<br />
intended to be a high level audit to determine and<br />
report on the level of compliance with the<br />
requirements of relevant key legislation and<br />
Australian Standards. Good practices were<br />
observed with several improvements regarding<br />
storage and handling recommended.<br />
At WCPL, dangerous goods and explosives are<br />
managed separately under their respective<br />
legislation i.e. to comply with the updated<br />
Dangerous Goods Act 2005 and Explosive Act 2003<br />
respectively.<br />
2.9.1 Hydrocarbon Containment<br />
Diesel fuel for the Open Cut is stored above ground<br />
within specifically designed concrete bunding. Oil<br />
and grease storages on site are contained within<br />
impervious bunds and purpose built hydrocarbon<br />
storage units. Diesel for the Underground is stored<br />
within a portable, self bunded (double walled)<br />
Transtank located at the portal area.<br />
There is one decommissioned underground<br />
unleaded fuel storage tank adjacent to the light<br />
vehicle car park that will be removed during the next<br />
reporting period. During this reporting period WCPL<br />
engaged an independent environmental consultancy<br />
to validate compliance of the old underground tank<br />
against The Protection of the Environment<br />
Operations (Underground Petroleum Storage<br />
Systems) Regulation 2008.<br />
Consulting Earth Scientists Pty Ltd (CES) was<br />
engaged by WCPL to provide environmental<br />
consultancy services during the removal of a 10,000<br />
L Underground Storage Tank (UST) and associated<br />
infrastructure and provide validation (excavations<br />
and excavated material). The UST was located in<br />
the north-eastern corner of the Underground Go-<br />
Line as shown.<br />
Page 34
<strong>2011</strong>-<strong>2012</strong> <strong>AEMR</strong><br />
The purpose of the environmental consultancy<br />
services is to validate the soil in the walls and base<br />
of the tank pit excavation and to classify the<br />
excavated soil for offsite disposal in accordance<br />
with the Department of Environment and Climate<br />
Change NSW guidelines (Waste Classification<br />
Guidelines, Part 1: Classifying Waste, NSW DECC,<br />
2008).<br />
Validation of the UST excavation and waste<br />
classification sampling of the stockpiled material<br />
was undertaken on 5 July <strong>2011</strong>. All concentrations<br />
of the soil samples collected from the pit walls and<br />
base as well as from underneath the bowser and<br />
the fuel line were below the SAC for TPH, BTEX,<br />
PAH and Lead. Therefore, the tank pit excavation is<br />
deemed suitable to remain on a site for continued<br />
commercial/industrial land use in accordance with<br />
the NSW EPA “Contaminated Sites: Guidelines for<br />
Assessing Service Station Sites” (1994).<br />
upgraded last reporting period to conform with the<br />
Explosive Act 2003. The focus has been on<br />
increased security.<br />
2.9.3 Material Safety Data Sheets<br />
All materials stored on site have appropriate<br />
Material Safety Data Sheets (MSDS). No chemical<br />
or hazardous material is permitted on site unless the<br />
mine has a copy of the appropriate MSDS or, in the<br />
case of a new product; it is accompanied by a<br />
MSDS. ChemAlert is used to maintain an electronic<br />
register of chemicals on site. The Open Cut<br />
contractor and other on site contractors are<br />
responsible for the maintenance of a MSDS register<br />
for their areas.<br />
All concentrations of the soil samples collected from<br />
the excavated material stockpile were below the<br />
SAC for TPH, BTEX, PAH and Lead. Therefore, the<br />
stockpiled material was classified as “General Solid”<br />
waste in accordance with the NSW DECC (2008)<br />
waste classification guidelines.<br />
Former location of underground storage tank<br />
All bulk fuel, oil and grease storage areas are<br />
regularly inspected as part of the internal monthly<br />
environmental inspection schedule.<br />
As discussed there are a number of oily water<br />
separator systems located across the site. For more<br />
information please refer to Section 2.6.3.<br />
2.9.2 Explosive Management<br />
In addition to priming and initiating explosives, up<br />
to 120 tonnes of ammonium nitrate prill is stored in<br />
tippers on site as well as 50 tonnes of Ammonium<br />
Nitrate Emulsion (ANE) for the Open Cut<br />
operations. The ammonium nitrate is loaded<br />
into mobile processing units (MPU) at a reload<br />
facility situated in the mine. The MPU is then driven<br />
onto bench where all the ingredients are mixed<br />
entering into a blast holes. The ammonium nitrate<br />
storage area and the magazine areas were<br />
Page 35
<strong>2011</strong>-<strong>2012</strong> <strong>AEMR</strong><br />
3.0 Environmental<br />
Management and<br />
Performance<br />
3.1 Meteorological Monitoring<br />
3.1.1 Environmental Management<br />
The WCPL maintains a weather station in<br />
accordance with the Australian Standard AS2923 –<br />
1987. The weather station is located approximately<br />
350m east of the WCPL administration building (see<br />
Figure 3.1). The meteorological station was<br />
approved for relocation to its current position (see<br />
Figure 3.1) by the OEH in December 2007. As<br />
required under Schedule 4, Condition 10(a) of<br />
Development Consent DA 305-7-2003, the<br />
meteorological station records the following<br />
parameters:<br />
<br />
<br />
<br />
<br />
<br />
<br />
<br />
temperature (at 2 m and 10 m);<br />
lapse rate;<br />
wind speed;<br />
wind direction;<br />
solar radiation;<br />
humidity; and<br />
sigma theta.<br />
Evaporation is calculated from this information, for<br />
use in reports such as the site water balance.<br />
Meteorological information collected at the weather<br />
station is used on a daily basis for general mining<br />
activities including the location of operating plant<br />
and equipment, and to minimise blasting impacts on<br />
the neighbouring residences.<br />
3.1.2 Environmental Performance<br />
During the reporting period the meteorological<br />
station maintained a high percentage capture rate<br />
for data. The malfunctioning solar radiation sensor<br />
reported in the previous <strong>AEMR</strong>, was replaced and<br />
recalibrated in accordance with relevant Australian<br />
Standards at the beginning of this reporting period.<br />
In June <strong>2012</strong>, WCPL’s environmental monitoring<br />
specialist completed a comprehensive maintenance<br />
and calibration program at the meteorological<br />
station. A summary of weather data recorded during<br />
the reporting period is provided below and in<br />
Appendix 2A.<br />
3.1.3 Rainfall and Evaporation<br />
The monthly and cumulative rainfall and evaporation<br />
data for the <strong>2011</strong>-<strong>2012</strong> reporting period is provided<br />
in Figure 3.2 below. The long term annual average<br />
rainfall is from the Bureau of Meteorology Jerry’s<br />
Plains Post Office weather station, which has<br />
recorded weather data since 1884, is provided in<br />
Appendix 2A.<br />
A total of 729.8mm of rainfall was recorded at<br />
WCPL during the reporting period, approximately<br />
84.7mm above the long term average recorded at<br />
Jerrys Plains Post Office. The highest monthly<br />
rainfall of 124.1 mm was recorded in February <strong>2012</strong>.<br />
The long-term average rainfall (1884 – <strong>2012</strong>)<br />
recorded at the Jerrys Plains Post Office weather<br />
station is 645.1mm. Rainfall recorded during the<br />
previous reporting period (2010-<strong>2011</strong>) was<br />
741.0mm.<br />
3.1.4 Temperature<br />
The maximum and minimum temperatures recorded<br />
during the <strong>2011</strong>-<strong>2012</strong> reporting period are shown in<br />
Figure 3.3 below. The maximum temperature of<br />
37.5 0 C was recorded in January <strong>2012</strong>, which was<br />
below the maximum 42.5 0 C recorded in January<br />
<strong>2011</strong>. The lowest temperature of -1.8 0 C which was<br />
above the minimum of -5.7 0 C recorded in July 2010.<br />
The seasonal average temperatures recorded<br />
during the reporting period were as follows: 11.4 0 C<br />
in winter; 18.0 0 C in spring; 21.1 0 C in summer; and<br />
16.8 0 C in autumn. These results are typical of<br />
temperature variations in this region.<br />
3.1.5 Wind Speed and Direction<br />
The dominant winds recorded during the <strong>2011</strong>-<strong>2012</strong><br />
reporting period were from the northwest (NW) and<br />
south east directions with the strongest wind<br />
strength from the NW. The maximum wind speed of<br />
4.9 m/s was recorded in September <strong>2011</strong>. The<br />
mean monthly wind speed varied between 1.6 m/s<br />
to 2.1 m/s, with the yearly average being 1.8 m/s.<br />
The annual and seasonal wind roses for the<br />
reporting period are shown in Figures 3.4 to 3.8.<br />
Page 36
SUMP<br />
SUMP<br />
N19<br />
SW46<br />
SW45<br />
Hunter<br />
River<br />
Golden<br />
Doctors<br />
D17<br />
N18<br />
Creek<br />
Highway<br />
N16<br />
BM05<br />
AQ04<br />
Warkworth Mine Owned<br />
Dyson<br />
Putty Road<br />
N20<br />
AQ03<br />
SW39<br />
GOLDEN HIGHWAY<br />
SW41<br />
FM1<br />
D14<br />
D026<br />
NORTH WAMBO CREEK<br />
DIVERSION<br />
STAGE 3 CREEK<br />
DIVERSION<br />
FM8<br />
FM2<br />
SW47<br />
SW08<br />
WAMBO<br />
FM3<br />
FM7<br />
STONY<br />
SW06<br />
D09<br />
CREEK<br />
SW48<br />
SW32<br />
CREEK<br />
FM9<br />
WAMBO<br />
HOMESTEAD<br />
SW03<br />
D01<br />
FM4<br />
MW17<br />
N21<br />
SW07<br />
FM6<br />
BM03<br />
D23<br />
SW05<br />
OFFICE<br />
WOLLOMBI<br />
*<br />
FM5<br />
SW40<br />
AQ02<br />
MW16<br />
BROOK<br />
C.H.P.P.<br />
D03<br />
N03<br />
AQ01<br />
MW15<br />
D07<br />
FM10<br />
SW02<br />
WARKWORTH<br />
BM02<br />
D12<br />
HAYNES<br />
N22<br />
WALLABY<br />
SCRUB ROAD<br />
SOUTH<br />
D11<br />
N01<br />
FM11<br />
SW01<br />
Legend<br />
Colliery Holding Boundary<br />
DA Approved Open Cut Limits<br />
MOP Open Cut Limits<br />
<strong>Wambo</strong> Owned Land<br />
Former Underground Workings<br />
Air Quality Monitoring Site<br />
Dust Depostion Monitoring Site<br />
Noise Monitoring Site<br />
Mine Water Monitoring Site<br />
*<br />
Surface Water Monitoring Site<br />
Blast Monitoring Site<br />
Surface Water Flow Site<br />
Meteorological Station<br />
North <strong>Wambo</strong> Underground<br />
Workings (Existing)<br />
North <strong>Wambo</strong> Underground<br />
Workings (Proposed)<br />
Dams<br />
WAMBO COAL<br />
ENVIRONMENTAL MONITORING LOCATIONS<br />
FIGURE 3.1<br />
Prepared by Pegasus Technical CAD FILE: 08673A
<strong>2011</strong>-<strong>2012</strong> <strong>AEMR</strong><br />
<strong>Wambo</strong> <strong>Coal</strong> Weather Station<br />
Rainfall vs Evaporation - July <strong>2011</strong> to June <strong>2012</strong><br />
600<br />
4000<br />
500<br />
3500<br />
Monthly Rain<br />
Monthly (mm)<br />
400<br />
300<br />
200<br />
3000<br />
2500<br />
2000<br />
1500<br />
Cumulative (mm)<br />
Monthly<br />
Evaporation<br />
Cumulative<br />
Rainfall<br />
1000<br />
100<br />
500<br />
Cumulative<br />
Evaporation<br />
0<br />
0<br />
Jul 11<br />
Aug 11<br />
Sep 11<br />
Oct 11<br />
Nov 11<br />
Dec 11<br />
Jan 12<br />
Feb 12<br />
Mar 12<br />
Apr 12<br />
May 12<br />
Jun 12<br />
Figure 3.2 – <strong>2011</strong>-<strong>2012</strong> Rainfall and Evaporation Summary<br />
45<br />
<strong>Wambo</strong> <strong>Coal</strong> Weather Station<br />
Temperature (2m) - July <strong>2011</strong> to June <strong>2012</strong><br />
40<br />
Temperature ( o C)<br />
35<br />
30<br />
25<br />
20<br />
15<br />
10<br />
5<br />
Maximum<br />
Temperatu<br />
Average<br />
Temperatu<br />
Minimum<br />
Temperatu<br />
0<br />
-5<br />
Jul 11<br />
Aug 11<br />
Sep 11<br />
Oct 11<br />
Nov 11<br />
Dec 11<br />
Jan 12<br />
Feb 12<br />
Mar 12<br />
Apr 12<br />
May 12<br />
Jun 12<br />
Figure 3.3 – <strong>2011</strong>-<strong>2012</strong> Maximum and Minimum Temperatures<br />
Page 38
<strong>2011</strong>-<strong>2012</strong> <strong>AEMR</strong><br />
Figure 3.4 – 2010-<strong>2011</strong> Annual Wind Rose<br />
Figure 3.5 – 2010-<strong>2011</strong> Winter Wind Rose<br />
Figure 3.6 – 2010-<strong>2011</strong> Spring Wind Rose<br />
Figure 3.7 – 2010-<strong>2011</strong> Summer Wind Rose<br />
Figure 3.8 – 2010-<strong>2011</strong> Autumn Wind Rose<br />
Page 39
<strong>2011</strong>-<strong>2012</strong> <strong>AEMR</strong><br />
3.2 Air Quality<br />
<br />
Fitting dust suppression systems at transfer<br />
points where necessary.<br />
3.2.1 Environmental Management<br />
Dust generation is primarily managed by road<br />
maintenance and consolidation, and utilising water<br />
carts to apply recycled mine water onto internal<br />
roads and other disturbed areas. Other dust control<br />
measures during the reporting period included:<br />
<br />
Induction training to all employees highlighting<br />
their responsibility to limit the level of dust<br />
produced;<br />
Rehabilitation of disturbed land on a<br />
progressive basis to reduce total disturbed<br />
area;<br />
<br />
Keeping disturbance areas to a minimum by<br />
minimising the disturbance in advance of<br />
mining operations until mining is due to<br />
commence in the area and clearly defining<br />
roads;<br />
Modifying mining operations during<br />
unfavourable weather conditions to reduce dust<br />
generation;<br />
<br />
<br />
<br />
<br />
<br />
<br />
<br />
<br />
<br />
<br />
<br />
Dust suppression equipment is fitted and<br />
operated on drills;<br />
Regular servicing of water carts for effective<br />
road watering and continual operation;<br />
Revegetating topsoil stockpiles which are not<br />
planned to be used for over three months;<br />
Designing blast holes with stemming to provide<br />
optimum confinement of the blast charge;<br />
Constraints on blasting operations to reduce<br />
impact of immediate neighbours (e.g. rescheduling<br />
blasts when wind blowing towards<br />
immediate neighbours);<br />
Use of additional contractor water trucks to<br />
water frequently used roads around the CHPP<br />
as required;<br />
Operation of two water truck fill points during<br />
the reporting period to reduce the time between<br />
road watering;<br />
Operation of water sprays during raw coal<br />
unloading at the ROM dump hopper;<br />
Regular use of a road sweeper on the main<br />
access road into WCPL;<br />
Implementing speed limits on roadways;<br />
Cleaning up coal spillage around the CHPP to<br />
prevent dust; and<br />
WCPL operate under an approved Air Quality<br />
Monitoring Program (AQMP), a requirement of<br />
Consent Condition 5, Schedule 4 of DA305-7-2003.<br />
The AQMP was revised to address operational<br />
changes and re-submitted to the DP&I in June<br />
2008.<br />
In accordance with Consent Condition 4, Schedule<br />
4, DA305-7-2003 and the AQMP, WCPL maintained<br />
four air quality monitoring stations AQ01, AQ02,<br />
AQ03 and AQ04 (see Figure 3.1). Each air quality<br />
monitoring station consists of a Tapered Element<br />
Oscillating Microbalance (TEOM) unit monitoring<br />
PM 10, a High Volume Air Sampler (HVAS) unit<br />
monitoring Total Suspended Particulates (TSP) and<br />
a dust depositional gauge.<br />
In accordance with the AQMP, WCPL has<br />
maintained and operated the following air quality<br />
monitoring equipment, throughout the reporting<br />
period:<br />
<br />
Four HVAS units measuring TSP;<br />
Four real time TEOM units measuring<br />
particulate matter of 10 microns in diameter<br />
(PM 10) on a continuous basis; and<br />
<br />
Sixteen depositional dust gauges.<br />
3.2.1.1 Site Specific Particulate Matter<br />
Control: Best Practice Assessment<br />
In <strong>2011</strong>, the NSW Environmental Protection<br />
Authority (EPA) required, through a Pollution<br />
Reduction Program, that WCPL provide a report<br />
which examines in detail the potential measures<br />
which could be employed to further reduce<br />
particulate emissions from the mine. This is part of<br />
a larger program which aims to reduce particulate<br />
emissions from the coal mining industry as a whole<br />
in NSW.<br />
SLR Consulting Australia Pty Ltd (SLR Consulting)<br />
was commissioned by WCPL, to perform this<br />
assessment, which has included a site inspection,<br />
emissions estimation and the identification,<br />
quantification and justification of existing and<br />
proposed control measures for the site. The study<br />
was performed in accordance with the <strong>Coal</strong> Mine<br />
Particulate Matter Control – Best Practice: Site<br />
Specific Determination Guideline issued by the New<br />
South Wales (NSW) Environmental Protection<br />
Authority (EPA) in November <strong>2011</strong>.<br />
The findings of this assessment will be summarised<br />
in the next <strong>AEMR</strong> as the report was no yet finalised<br />
at the end of the <strong>2011</strong>-<strong>2012</strong> reporting period.<br />
Page 40
<strong>2011</strong>-<strong>2012</strong> <strong>AEMR</strong><br />
3.2.1.2 Penalty Infringement Notice<br />
WCPL received a Penalty Infringement Notice (PIN)<br />
on the 12 June <strong>2012</strong> as a result from a site<br />
inspection on the 4 May <strong>2012</strong> by the DP&I. The PIN<br />
was in relation to excessive wheel generated dust<br />
witnessed during the site inspection. For further<br />
details regarding this matter please refer to Section<br />
3.20.2.<br />
3.2.1.3 Dust Suppression Trials<br />
During the reporting period WCPL commenced<br />
trailing a dust suppressant on internal haul roads, a<br />
control recommendation identified in the best<br />
practice assessment for particulate matter control.<br />
The name of the dust suppressant is called<br />
Petrotac.<br />
Petrotac application on haul road at <strong>Wambo</strong><br />
Petrotac is an emulsion that is sprayed on semi<br />
permanent roads to reduce dust. It works by<br />
soaking through the surface of the road and bonding<br />
the aggregate particles together. WCPL<br />
commenced a trial of Petrotac dust suppression<br />
product on a portion of our main haul road during<br />
April <strong>2012</strong>.<br />
The trial showed signifcant reduction in dust<br />
emissions and improved road stability in wet and dry<br />
weather conditions. Plans are in place to roll the out<br />
Petrotac product to a greater area of the main haul<br />
road. Some of the advantages identified during the<br />
tial include:<br />
<br />
It is stable and environmentally safe;<br />
Requires only occassional maintenance<br />
following the initial application; and<br />
3.2.2 Environmental Performance<br />
All air quality monitoring conducted at WCPL during<br />
the <strong>2011</strong>-<strong>2012</strong> reporting period was measured and<br />
monitored against the impact assessment criteria<br />
stipulated in Consent Condition 2, Schedule 4 of DA<br />
305-7-2003 and in accordance with EPL 529, which<br />
apply at any privately owned residences as follows:<br />
<br />
Total suspended particulates (TSP) Annual<br />
Average Impact Assessment criteria less than<br />
90 µg/m 3 ;<br />
Particulate matter less than 10µm in size (PM 10)<br />
annual average assessment criteria less than<br />
30 µg/m 3 ;<br />
<br />
<br />
<br />
PM 10 24 hour assessment criteria of less than<br />
50 µg/m 3 ;<br />
Deposited dust annual average assessment<br />
criteria less than 4 g/m2/month; and<br />
Deposited dust maximum increase in deposited<br />
dust level of less than 2 g/m2/month.<br />
In accordance with Condition 5(b), Schedule 6 of<br />
DA 305-7-2003, a comparison of the air quality<br />
results for the reporting period at any privately<br />
owned land were compared against the modelled<br />
predictions in the 2003 Environmental Impact<br />
Statement (2003 EIS) (see Section 3.2.2.1).<br />
3.2.2.1 Air Quality EIS Predictions<br />
Table 3.0 provides a summary of predicted<br />
concentrations from the 2003 EIS for Year 7 of the<br />
project. Considering the variability regarding the<br />
conceptual mine plans used in the 2003 EIS air<br />
quality model, the location of receptors in the model<br />
versus the actual location of WCPL air quality<br />
monitoring stations, the results from <strong>2011</strong>-<strong>2012</strong><br />
monitoring are generally comparable with exception.<br />
The annual average PM 10 results are below the<br />
concentrations predicted in the EIS, however the<br />
annual average for TSP are higher. The annual<br />
average results for dust deposition are also<br />
marginally higher.<br />
Table 3.0 EIS Predicted Dust Concentrations<br />
Air Quality<br />
Station*<br />
Receptor<br />
ID No.<br />
24-hour<br />
PM10<br />
ug/m 3<br />
Annual<br />
PM10<br />
ug/m 3 .<br />
Annual<br />
TSP<br />
ug/m 3 .<br />
Annual dust<br />
deposition<br />
g/m 2 /month<br />
AQ3 37 38.4 18.5 20.2 0.38<br />
AQ4 40 46.7 29.1 32.8 0.73<br />
Note: * Nearest to receptor location from model<br />
Will be used in conjunction with other<br />
management practices to reduce dust<br />
generation on site.<br />
Page 41
<strong>2011</strong>-<strong>2012</strong> <strong>AEMR</strong><br />
3.2.2.2 High Volume Air Sampling<br />
Monitoring of TSP occurred at four locations during<br />
the reporting period;<br />
1. HV01 – Coralie<br />
2. HV02 – <strong>Wambo</strong> Road<br />
3. HV03 – Thelander<br />
4. HV04 – Muller<br />
WCPL annual average impact assessment criteria<br />
for TSP is less than 90 µg/m 3 (see Table 3.1) on<br />
privately owned land.<br />
Pollutant<br />
Total suspended particulates<br />
(TSP) matter<br />
Table 3.1 TSP Criteria<br />
Averaging<br />
Period<br />
Criterion<br />
Annual 90 µg/m 3<br />
All four HVAS continued to operate on a six day<br />
cycle (in line with the OEH cycle) during the<br />
reporting period, in accordance with AS 2724.3 –<br />
1984 – Determination of total suspended<br />
particulates (TSP) – High volume sampler<br />
gravimetric method. The locations of the HVAS are<br />
illustrated in Figure 3.1. Both HV01 and HV02 are<br />
located on WCPL owned land. HV03 and HV04 are<br />
located on privately owned land.<br />
Both HV01 and HV02 had a capture rate of 100%<br />
during the <strong>2011</strong>-<strong>2012</strong> reporting period, however<br />
HV03 and HV04 had a capture rate of 98% and<br />
95% respectively. A land access issue at HV03 on<br />
the 14 th February <strong>2012</strong> and intermittent power<br />
failures during March <strong>2012</strong> at HV04 were the<br />
primary causes of the lower capture rate<br />
percentages. To supplement HV04 data for March<br />
<strong>2012</strong>, several ‘make up’ runs were completed by<br />
WCPL environmental monitoring specialist.<br />
The TSP results recorded at each of the HVAS sites<br />
are illustrated in Figures 3.9a-d below and provided<br />
in Appendix 2B. The annual average TSP<br />
concentration at all four monitoring locations did not<br />
exceed the long term impact annual average criteria<br />
of 90g/m 3 on any privately owned land. The annual<br />
average TSP results (at privately owned residences)<br />
for HV03 recorded a decrease of 23g/m 3 when<br />
compared to the annual average reported in the<br />
2010-<strong>2011</strong> <strong>AEMR</strong>.<br />
Table 3.2 TSP Recent Annual Averages<br />
2009-2010<br />
Annual Ave.<br />
2010-<strong>2011</strong><br />
Annual Ave.<br />
<strong>2011</strong>-<strong>2012</strong><br />
Annual Ave.<br />
HV01 55g/m 3 60g/m 3 53g/m 3<br />
HV02 56g/m 3 48g/m 3 50g/m 3<br />
HV03 44g/m 3 55g/m 3 32g/m 3<br />
HV04 44g/m 3 37g/m 3 46g/m 3<br />
The highest daily TSP result for HV03 of 89.0g/m 3<br />
was recorded on the 03/01/<strong>2012</strong>. A review of<br />
meteorological conditions indicated that prevailing<br />
winds tended from the East South East, while<br />
conditions were warm and dry. HV03 and HV04<br />
both recorded elevated results on the 3 rd of January<br />
<strong>2012</strong> (89.0g/m 3 and 117g/m 3 respectively).<br />
HV03 and HV04 are located north west of the mine<br />
and therefore under these metrological conditions<br />
may be considered within the influence of WCPL<br />
mining and neighbouring coal mine operations<br />
activities. However, HV02 also recorded elevated<br />
TSP for the same day of 122g/m 3 which suggests a<br />
regional dust event was occurring on that day. HV02<br />
is located to the south of WCPL operations on<br />
WCPL owned land.<br />
The highest daily TSP result for HV04 of<br />
122.0g/m 3 was recorded on the 14/04/<strong>2012</strong>,<br />
however the recorded TSP at HV03 for the<br />
14/04/<strong>2012</strong> of 23.6g/m 3 was significantly lower. A<br />
review of meteorological conditions indicated that<br />
prevailing winds tended from the North West may<br />
have influenced the sampling period to 14 th of April<br />
<strong>2012</strong>. HV03 and HV04 are located north west of the<br />
mine and therefore under these metrological<br />
conditions is considered outside the influence of<br />
WCPL activities. The low result recorded by HV03<br />
on the same day suggest HV04 was under different<br />
localised influences.<br />
The highest daily TSP result of 115g/m 3 was<br />
recorded at HV01, which was above the annual<br />
average criteria of 90g/m 3 . HV01 is located<br />
adjacent to the mine entry road on WCPL owned<br />
land. The higher annual TSP result can be attributed<br />
to an increase of mining related traffic utilising this<br />
area as a temporary hard stand area to<br />
accommodate a number of contractors.<br />
The annual average TSP results for HV04 recorded<br />
an increase of 9g/m 3 when compared to the annual<br />
average reported in the 2010-<strong>2011</strong> <strong>AEMR</strong>. For a<br />
summary of recent TSP annual averages please<br />
refer to Table 3.2.<br />
Page 42
<strong>2011</strong>-<strong>2012</strong> <strong>AEMR</strong><br />
3.2.2.3 PM 10<br />
Four real-time TEOM PM 10 units were in operation<br />
during the reporting period as part of the air quality<br />
monitoring program:<br />
1. AQ01 – Coralie<br />
2. AQ02 – <strong>Wambo</strong> Road<br />
3. AQ03 – Thelander<br />
4. AQ04 – Muller<br />
WCPL annual average and daily impact assessment<br />
criteria for PM 10 is less than 90 µg/m 3 and 50 µg/m 3<br />
respectively (see Table 3.3) on privately owned<br />
land.<br />
Pollutant<br />
Table 3.3 PM 10 Criteria<br />
Averaging<br />
Period<br />
Criterion<br />
Particular matter < 10µm (PM 10) 24hour 50 µg/m 3<br />
Particular matter < 10µm (PM 10) Annual 30 µg/m 3<br />
Each TEOM PM 10 unit records the PM 10 particulates<br />
every 15 minutes and calculates the 24 hour<br />
average, which is compared to the relevant criteria<br />
mentioned above. These units operated and<br />
sampled in accordance with AS 3580.9.8 - 2002,<br />
Method for Sampling and Analysis of Ambient Air -<br />
Determination of Suspended Particulate Matter -<br />
PM 10 Continuous Direct Mass Method using a<br />
Tapered Element Oscillating Microbalance<br />
Analyser.<br />
average PM 10 results (at privately owned<br />
residences) for HV04 recorded a slight increase of<br />
0.25g/m 3 when compared to the annual average<br />
reported in the 2010-<strong>2011</strong> <strong>AEMR</strong>. For a summary of<br />
recent PM 10 annual averages please refer to Table<br />
3.4.<br />
Table 3.4 PM 10 Recent Annual Averages<br />
2009-2010<br />
Annual Ave.<br />
2010-<strong>2011</strong><br />
Annual Ave.<br />
<strong>2011</strong>-<strong>2012</strong><br />
Annual Ave.<br />
AQ01 20.29g/m 3 15.84g/m 3 17.60g/m 3<br />
AQ02 20.40g/m 3 15.72g/m 3 17.36g/m 3<br />
AQ03 18.08g/m 3 16.49g/m 3 14.56g/m 3<br />
AQ04 18.88g/m 3 15.68g/m 3 15.93g/m 3<br />
There were no exceedances of the daily 50g/m 3<br />
limit on privately owned land during the <strong>2011</strong>-<strong>2012</strong><br />
reporting period. This is in contrast to a total of two<br />
exceedances of the daily 50g/m 3 limit during 2010-<br />
<strong>2011</strong> and a total of seven exceedences recorded<br />
during the 2009-2010 reporting period.<br />
The highest recorded daily PM 10 results on privately<br />
owned land for HV03 and HV04 were 43.2g/m 3<br />
and 41.9g/m 3 respectively.<br />
The highest daily PM 10 result of 82.5g/m 3 on<br />
WCPL owned land was recorded at AQ01. AQ01 is<br />
located adjacent to the mine entry road on WCPL<br />
owned land. Please refer to Section 3.20.2 for<br />
further details.<br />
Results recorded from the PM 10 units are illustrated<br />
in Figure 3.10a-d below and tabled in Appendix<br />
2B.<br />
Units AQ01, AQ02, AQ03 and AQ04 had a capture<br />
rate of 99%, 93%, 99% and 99% per unit<br />
respectively an overall improvement on the 2010-<br />
<strong>2011</strong> <strong>AEMR</strong> period. Intermittent power failures and<br />
instrument malfunctions were identified as the<br />
primary cause of equipment failure. A software<br />
related failure for AQ02 was the primary cause of<br />
the unit malfunctioning. All TEOM PM 10 units have<br />
power surge protection devices fitted to protect<br />
against power surges. The locations of these TEOM<br />
PM 10 units are shown in Figure 3.1.<br />
The PM 10 annual average concentration at all four<br />
monitoring locations did not exceed the annual<br />
average criteria of 30 g/m 3 limit on privately owned<br />
land during the reporting period. The annual<br />
average PM 10 results (at privately owned<br />
residences) for HV03 recorded a decrease of<br />
1.93g/m 3 when compared to the annual average<br />
reported in the 2010-<strong>2011</strong> <strong>AEMR</strong>. The annual<br />
Page 43
<strong>2011</strong>-<strong>2012</strong> <strong>AEMR</strong><br />
High Volume Air Sampling<br />
HV01 - Coralie<br />
High Volume Air Sampling<br />
HV02 - Caban<br />
180<br />
140<br />
Total Suspended Particulates (ug/m 3 )<br />
160<br />
140<br />
120<br />
100<br />
80<br />
60<br />
40<br />
20<br />
0<br />
01/07/11<br />
15/07/11<br />
29/07/11<br />
12/08/11<br />
26/08/11<br />
09/09/11<br />
23/09/11<br />
07/10/11<br />
21/10/11<br />
04/11/11<br />
18/11/11<br />
02/12/11<br />
16/12/11<br />
30/12/11<br />
13/01/12<br />
27/01/12<br />
10/02/12<br />
24/02/12<br />
09/03/12<br />
23/03/12<br />
06/04/12<br />
20/04/12<br />
04/05/12<br />
18/05/12<br />
01/06/12<br />
15/06/12<br />
TSP<br />
Results<br />
Yearly<br />
Average<br />
Annual<br />
Limit<br />
Total Suspended Particulates (ug/m 3 )<br />
120<br />
100<br />
80<br />
60<br />
40<br />
20<br />
0<br />
01/07/11<br />
15/07/11<br />
29/07/11<br />
12/08/11<br />
26/08/11<br />
09/09/11<br />
23/09/11<br />
07/10/11<br />
21/10/11<br />
04/11/11<br />
18/11/11<br />
02/12/11<br />
16/12/11<br />
30/12/11<br />
13/01/12<br />
27/01/12<br />
10/02/12<br />
24/02/12<br />
09/03/12<br />
23/03/12<br />
06/04/12<br />
20/04/12<br />
04/05/12<br />
18/05/12<br />
01/06/12<br />
15/06/12<br />
TSP<br />
Results<br />
Yearly<br />
Average<br />
Annual<br />
Limit<br />
Figure 3.9 a – Results for TSP at HV01<br />
(Coralie Unit)<br />
Figure 3.9 b – Results for TSP at HV02<br />
(<strong>Wambo</strong> Road Unit)<br />
High Volume Air Sampling<br />
HV03 - Thelander<br />
High Volume Air Sampling<br />
HV04 - Muller<br />
100<br />
180<br />
Total Suspended Particulates (ug/m 3 )<br />
90<br />
80<br />
70<br />
60<br />
50<br />
40<br />
30<br />
20<br />
10<br />
0<br />
01/07/11<br />
15/07/11<br />
29/07/11<br />
12/08/11<br />
26/08/11<br />
09/09/11<br />
23/09/11<br />
07/10/11<br />
21/10/11<br />
04/11/11<br />
18/11/11<br />
02/12/11<br />
16/12/11<br />
30/12/11<br />
13/01/12<br />
27/01/12<br />
10/02/12<br />
24/02/12<br />
09/03/12<br />
23/03/12<br />
06/04/12<br />
20/04/12<br />
04/05/12<br />
18/05/12<br />
01/06/12<br />
15/06/12<br />
TSP<br />
Results<br />
Yearly<br />
Average<br />
Annual<br />
Limit<br />
Total Suspended Particulates (ug/m 3 )<br />
160<br />
140<br />
120<br />
100<br />
80<br />
60<br />
40<br />
20<br />
0<br />
01/07/11<br />
15/07/11<br />
29/07/11<br />
12/08/11<br />
26/08/11<br />
09/09/11<br />
23/09/11<br />
07/10/11<br />
21/10/11<br />
04/11/11<br />
18/11/11<br />
02/12/11<br />
16/12/11<br />
30/12/11<br />
13/01/12<br />
27/01/12<br />
10/02/12<br />
24/02/12<br />
09/03/12<br />
23/03/12<br />
06/04/12<br />
20/04/12<br />
04/05/12<br />
18/05/12<br />
01/06/12<br />
15/06/12<br />
TSP<br />
Results<br />
Yearly<br />
Average<br />
Annual<br />
Limit<br />
Figure 3.9 c – Results for TSP at HV03<br />
(Thelander Unit)<br />
Figure 3.9 d – Results for TSP at HV04<br />
(Muller Unit)<br />
Page 44
<strong>2011</strong>-<strong>2012</strong> <strong>AEMR</strong><br />
Particulate Matter<br />
AQ01 (Coralie - <strong>Wambo</strong> <strong>Coal</strong> site enterance road)<br />
Particulate Matter<br />
AQ02 (<strong>Wambo</strong> Road)<br />
100<br />
100<br />
Particulate Matter (10 micron) (ug/m 3 )<br />
90<br />
80<br />
70<br />
60<br />
50<br />
40<br />
30<br />
20<br />
10<br />
PM10<br />
Results<br />
Yearly<br />
Average<br />
Annual Limit<br />
Daily Limit<br />
Particulate Matter (10 micron) (ug/m 3 )<br />
90<br />
80<br />
70<br />
60<br />
50<br />
40<br />
30<br />
20<br />
10<br />
0<br />
PM10<br />
Results<br />
Yearly<br />
Average<br />
Annual Limit<br />
Daily Limit<br />
0<br />
07/11<br />
08/11<br />
09/11<br />
10/11<br />
11/11<br />
12/11<br />
01/12<br />
02/12<br />
03/12<br />
04/12<br />
05/12<br />
06/12<br />
01/07/11<br />
01/08/11<br />
01/09/11<br />
01/10/11<br />
01/11/11<br />
01/12/11<br />
01/01/12<br />
01/02/12<br />
01/03/12<br />
01/04/12<br />
01/05/12<br />
01/06/12<br />
Figure 3.10a – PM 10 Results Recorded at AQ01<br />
(Coralie – <strong>Wambo</strong> <strong>Coal</strong> Entry Road)<br />
Figure 3.10b – PM 10 Results Recorded at AQ02<br />
(<strong>Wambo</strong> Road)<br />
100<br />
Particulate Matter<br />
AQ03 (Thelander)<br />
100<br />
Particulate Matter<br />
AQ04 (Muller)<br />
Particulate Matter (10 micron) (ug/m 3 )<br />
90<br />
80<br />
70<br />
60<br />
50<br />
40<br />
30<br />
20<br />
10<br />
0<br />
02/07/11<br />
02/08/11<br />
02/09/11<br />
02/10/11<br />
02/11/11<br />
02/12/11<br />
02/01/12<br />
02/02/12<br />
02/03/12<br />
02/04/12<br />
02/05/12<br />
02/06/12<br />
PM10<br />
Results<br />
Yearly<br />
Average<br />
Annual Limit<br />
Daily Limit<br />
Particulate Matter (10 micron) (ug/m 3 )<br />
90<br />
80<br />
70<br />
60<br />
50<br />
40<br />
30<br />
20<br />
10<br />
0<br />
07/11<br />
08/11<br />
09/11<br />
10/11<br />
11/11<br />
12/11<br />
01/12<br />
02/12<br />
03/12<br />
04/12<br />
05/12<br />
06/12<br />
PM10<br />
Results<br />
Yearly<br />
Average<br />
Annual Limit<br />
Daily Limit<br />
Figure 3.10c – PM 10 Results Recorded at AQ03<br />
(Thelander)<br />
Figure 3.10d – PM 10 Results Recorded at AQ04<br />
(Muller)<br />
Page 45
<strong>2011</strong>-<strong>2012</strong> <strong>AEMR</strong><br />
3.2.2.4 Dust Deposition<br />
WCPL maintains a network of 15 dust deposition<br />
gauges, the location of each dust deposition gauge<br />
is shown in Figure 3.1.<br />
All depositional dust gauges were sampled and<br />
analysed for insoluble solids and ash residue, in<br />
accordance with AS3580.10.1:2003 Methods for<br />
Sampling and Analysis of Ambient Air and National<br />
Association of Testing Authorities (NATA)<br />
requirements.<br />
WCPL annual average impact assessment criteria<br />
for depositional dust is 4g/m 2 /month (see Table 3.5)<br />
on privately owned land.<br />
Table 3.5 Impact Assessment Criteria for Dust<br />
Pollutant<br />
Deposited<br />
Dust<br />
Averaging<br />
Period<br />
Max increase<br />
in deposited<br />
dust levels<br />
Max total<br />
deposited 7<br />
dust levels<br />
Annual 2 g/m 2 /month 4 g/m 2 /month<br />
A summary of the annual averages for the 15 dust<br />
gauges is provided in Figure 3.11 below and a full<br />
summary of the monthly results provided in<br />
Appendix 2B. There was a capture and analysis<br />
rate of 100% for all dust gauges expect for D07 and<br />
D12. Results were not obtainable for D07 during the<br />
December <strong>2011</strong> exposure period due to the glass<br />
bottle and funnel missing at the time of collection.<br />
Results were not obtainable for D12 for the<br />
November <strong>2011</strong> exposure period as the glass bottle<br />
was broken at the time of collection. Throughout the<br />
reporting period it was noted some of the dust<br />
gauges contained various sources of foreign<br />
material including bird droppings, insects, sticks and<br />
other organic matter when analysed.<br />
Contamination was assessed based on field<br />
observations, laboratory observations, historical<br />
data and wind patterns. All monthly dust results<br />
deemed to be contaminated were excluded from the<br />
annual average.<br />
Table 3.6 compares the annual dust averages for<br />
insoluble solids, exclusive of results deemed<br />
contaminated, against previous reporting periods.<br />
There were no depositional dust gauges that<br />
exceeded the annual average criteria for insoluble<br />
solids of 4 g/m 2 /month on privately owned land (see<br />
Figure 3.11). On two occasions where the monthly<br />
result exceeded the 4g/m 2 /month criteria at D24 and<br />
D25. The monthly result exceeded the 4g/m 2 /month<br />
criteria at D24 for the October <strong>2011</strong> exposure<br />
period, however the sample was deemed<br />
contaminated. The monthly result exceeded the<br />
4g/m 2 /month criteria at D25 for the March <strong>2012</strong><br />
exposure period. The slightly elevated monthly<br />
result may have been influenced from south to<br />
south east winds during March <strong>2012</strong>.<br />
Dust gauges D01 and D07 exceeded the average<br />
criteria of 4 g/m 2 /month, however these dust gauges<br />
are situated on WCPL owned land and therefore the<br />
annual average criteria of 4 g/m 2 /month does not<br />
apply. D01 is located near an internal unsealed<br />
road, used regularly during the reporting period.<br />
D01 was also located in close proximity to a number<br />
of major construction works including the<br />
Homestead Backfill Project. D07 is located near an<br />
internal unsealed road, used regularly during the<br />
reporting period.<br />
D14 was located directly west of the advancing<br />
open cut and within the footprint of the disturbance<br />
area. After the July <strong>2011</strong> exposure period, D14 was<br />
removed to allow land preparation activities to<br />
continue in accordance with the open cut mining<br />
operations plan. The removal of D14 has brought<br />
the total number of dust gauges in the dust<br />
monitoring network to 15.<br />
Table 3.6 Dust Recent Annual Averages<br />
(Insoluble Solids)<br />
2009-2010<br />
Annual Ave.<br />
g/m 2 /moth<br />
2010-<strong>2011</strong><br />
Annual Ave.<br />
g/m 2 /moth<br />
<strong>2011</strong>-<strong>2012</strong><br />
Annual Ave.<br />
g/m 2 /moth<br />
D01 10.4 3.6 18.1<br />
D03 2.8 3.0 2.4<br />
D07 5.2 6.2 4.6<br />
D09 2.7 4.4 3.7<br />
D11 3.3 1.8 2.2<br />
D12 4.6 3.8 3.0<br />
D14* 8.5 9.3 -<br />
D17 1.8 1.3 1.3<br />
D19 3.3 2.6 2.9<br />
D20 1.9 1.4 1.4<br />
D21 1.5 1.1 1.4<br />
D22 1.6 1.2 1.4<br />
D23 3.7 2.1 2.1<br />
D24 1.6 1.6 1.1<br />
D25 2.3 1.7 2.2<br />
D26 1.8 1.3 1.3<br />
Note: Bold indicates dust gauges at privately owned residences.<br />
*D14 was removed from the dust monitoring program during the<br />
reporting period after July <strong>2011</strong> due to open cut activities, hence no<br />
annual average.<br />
7 Deposited dust is assed as insoluble solids as defined by<br />
Standards Australia, 1991, AS 3580.10.1-1991: Methods for<br />
Sampling and Analysis of Ambient Air<br />
Page 46
<strong>2011</strong>-<strong>2012</strong> <strong>AEMR</strong><br />
Assessment criterion of a maximum increase of<br />
2g/m 2 /month annual average for deposited dust was<br />
compared with annual average deposited dust<br />
results from the previous reporting period (see<br />
Figure 3.11a). There was one exceedance of the<br />
2g/m 2 /month annual average increase criterion<br />
when compared with dust results from the<br />
2010/<strong>2011</strong> reporting period. As discussed the<br />
elevated results from D01 during the reporting<br />
period were primarily contributed to major<br />
construction works occurring close to D01 and<br />
completely within WCPL operational area. The<br />
intention of this criterion is to distinguish dust<br />
contribution by WCPL from other sources. However<br />
the speciation of WCPL dust and other sources is<br />
outside the methodology of depositional monitoring<br />
in accordance with AS3580.10.1:2003.<br />
Monthly Dust Despositional Monitoring<br />
Annaul Averages <strong>2011</strong>-<strong>2012</strong><br />
Annual Average (g/m 2 /month)<br />
19<br />
18<br />
17<br />
16<br />
15<br />
14<br />
13<br />
12<br />
11<br />
10<br />
9<br />
8<br />
7<br />
6<br />
5<br />
4<br />
3<br />
2<br />
1<br />
0<br />
D01<br />
D03<br />
D07<br />
D09<br />
D11<br />
D12<br />
D14<br />
D17<br />
D19<br />
D20<br />
D21<br />
D22<br />
D23<br />
D24<br />
D25<br />
D26<br />
Insoluble Solids Ash Residue Project Criteria<br />
Note: D01 & D07 are located WCPL land and therefore the annual average criteria of 4 g/m 2 /month does not apply.<br />
Figure 3.11 – <strong>2011</strong>-<strong>2012</strong> Depositional Dust Gauges Annual Averages<br />
Figure 3.11a – Maximum Increase in Depositional Dust between 2010/<strong>2011</strong> to <strong>2011</strong>/<strong>2012</strong><br />
Page 47
<strong>2011</strong>-<strong>2012</strong> <strong>AEMR</strong><br />
3.3 Erosion & Sediment<br />
Control<br />
3.3.1 Environmental Management<br />
Erosion and sedimentation is managed in<br />
accordance with WCPL Erosion and Sediment<br />
Control Plan (ESCP), a requirement of Consent<br />
Condition 32, Schedule 4 of DA305-7-2003. The<br />
ESCP is a component of WCPL’s Site Water<br />
Management Plan as required under Condition 30,<br />
Schedule 4 of DA305-7-2003. The main principles<br />
of the ESCP include:<br />
Separation of runoff from disturbed and<br />
undisturbed areas where practicable;<br />
Construction of sediment structures or<br />
utilisation of existing mine water storages to<br />
capture runoff up to a specified design criterion;<br />
<br />
<br />
Construction of surface drains to facilitate the<br />
efficient transport of surface runoff. Drains are<br />
designed using trapezoidal or parabolic crosssections;<br />
and<br />
Progressive rehabilitation stabilisation of mine<br />
infrastructure areas.<br />
These principles take into account the general<br />
recommendations for site drainage works presented<br />
in “Managing Urban Stormwater – Soils and<br />
Construction Volume 1” (Landcom 2004).<br />
<br />
<br />
<br />
<br />
The use of a street sweeper to remove dirt and<br />
mud from mine access roads;<br />
Monthly monitoring of all sediment control<br />
structures and maintenance when required;<br />
Limiting clearance and disturbance of the<br />
natural environment; and<br />
Progressive rehabilitation across site.<br />
3.3.2 Environmental Performance<br />
Monthly inspections of sediment control structures<br />
as well as inspections following rainfall events of 20<br />
mm or more in a 24 hour period are conducted<br />
across the mine by WCPL personnel and<br />
contractors. During these inspections, sediment<br />
control structures are inspected for capacity,<br />
structural integrity and effectiveness.<br />
The routine removal of sediment from a number of<br />
the sediment control structures, including Hales<br />
Crossing Sediment Dam was undertaken during the<br />
reporting period. As discussed in the last <strong>AEMR</strong>, a<br />
plan of works to remove coal sediment from a series<br />
of purpose built sediment dams around the CHPP<br />
and product stockpile areas was scheduled for<br />
<strong>2011</strong>. Dredging to remove coal fines and increase<br />
the dam capacity within the Gordon Below Franklin<br />
Dam commenced in June <strong>2011</strong>. The recovered coal<br />
fines were reprocessed through the CHPP.<br />
A number of strategies are used on site for erosion<br />
and sediment control including:<br />
<br />
The establishment of diversion banks on the<br />
upstream side of the site to divert clean water<br />
around the site and into natural drainage lines;<br />
The establishment of catch drains in<br />
accordance with relevant criteria (outlined in the<br />
ESCP) to direct sediment-laden water into<br />
sediment control structures;<br />
The strategic placement and design of<br />
sediment control structures on site to treat<br />
sediment laden water before it leaves site;<br />
<br />
<br />
<br />
The placement of hay bales along catch drains<br />
to control the velocity of flow and prevent<br />
scouring;<br />
The establishment of sediment ponds or<br />
utilisation of existing mine water structures to<br />
treat sediment laden water;<br />
The establishment of sediment fencing as<br />
required on the down-slope side of soil<br />
stockpiles;<br />
Dredging Eagles Nest Dam in June <strong>2012</strong><br />
During the reporting period WCPL commenced<br />
rehabilitation program within the NWC Diversion<br />
Stage 3. Please refer to Section 5.1.4 for further<br />
details about the NWC Diversion rehabilitation<br />
works.<br />
Page 48
<strong>2011</strong>-<strong>2012</strong> <strong>AEMR</strong><br />
3.4 Surface Water<br />
3.4.1 Environmental Management<br />
Surface water monitoring is undertaken in<br />
accordance with WCPL’s Surface Water Monitoring<br />
Program (SWMP), a requirement of Consent<br />
Condition 33, Schedule 4 of DA305/7/2003. The<br />
SWMP is a component of WCPL’s Site Water<br />
Management Plan as required under Condition 30,<br />
Schedule 4 of DA305-7-2003. In addition, the<br />
SWMP has also been prepared to fulfil WCPL’s EPL<br />
529 license conditions.<br />
The SWMP has previously been prepared to the<br />
satisfaction of DP&I and SSC and in consultation<br />
with DTIRIS and NOW. The SWMP was approved<br />
by the DP&I in October 2005. WCPL revised the<br />
SWMP in October 2008 and November 2009 and<br />
re-submitted the surface water monitoring program<br />
to the relevant government departments to<br />
accommodate operational changes and<br />
development consent modification requirements.<br />
WCPL received official notification from the DTIRIS<br />
during April 2010 accepting the changes to the<br />
SWMP.<br />
At the time of writing the <strong>2011</strong>-<strong>2012</strong> <strong>AEMR</strong>, WCPL<br />
were finalising another revision of the SWMP for<br />
submitting to the DP&I and NOW. The revision of<br />
the SWMP was in response to an action item in the<br />
<strong>2011</strong> Environmental Independent Audit.<br />
The results in Section 3.4.2 of the <strong>2011</strong>-<strong>2012</strong><br />
<strong>AEMR</strong> for surface water are for those surface water<br />
monitoring sites required for monitoring in<br />
accordance with approved in the 2005 SWMP.<br />
In accordance with SWMP, WCPL maintained<br />
surface water monitoring sites, located within:<br />
Local waterways including Wollombi Brook,<br />
Doctors Creek, Longford Creek, North <strong>Wambo</strong><br />
Creek, South <strong>Wambo</strong> Creek and Stony Creek;<br />
and<br />
Mine water storage dams including Eagles Nest<br />
Dam, Chitter Dam and South Dam.<br />
WCPL participates in the HRSTS which allows<br />
water to be discharged into the Wollombi Brook<br />
from the licensed discharge point SW15 (Eagles<br />
Nest Dam) as listed in EPL 529. For further details<br />
of water discharges refer to Section 2.8.3.<br />
3.4.2 Environmental Performance<br />
3.4.2.1 Water Quality<br />
Surface water quality criteria for pH, Electrical<br />
Conductivity (EC) and Total Suspended Solids<br />
(TSS) for the monitoring locations at WCPL are<br />
provided in Table 3.1. The surface water quality<br />
criteria for pH and TSS were adopted from the<br />
discharge criteria (i.e. Schedule 4, Consent<br />
Condition 24 of DA 305-7-2003, and Condition L3.3<br />
of EPL 529) and the HRSTS.<br />
Table 3.1 – Surface Water Quality Criteria<br />
Stream System<br />
pH Criteria<br />
EC Criteria<br />
(µS/cm)<br />
TSS Criteria<br />
(mg/L)<br />
WCPL Mine Site<br />
Wollombi Brook 6.5 - 9.0 3,106 120<br />
North <strong>Wambo</strong> Creek 6.5 - 9.0 2,093 120<br />
Eagles Nest Dam 6.5 - 9.5 N/A * 120<br />
South <strong>Wambo</strong> Creek 6.5 - 9.0 492 120<br />
Stony Creek 6.5 - 9.0 492 120<br />
<strong>Wambo</strong> Rail Development<br />
Wollombi Brook<br />
Longford Creek<br />
Doctors Creek<br />
Less than 20% more<br />
than upstream<br />
concentration<br />
Less than 20% more<br />
than upstream<br />
concentration<br />
Less than 20% more<br />
than upstream<br />
concentration<br />
Note: * Under Schedule 4, Condition 24 of DA 305-7-2003 and condition L3.3 of EPL 529 the<br />
Eagles Nest Dam discharge point is not required to be monitored for EC.<br />
^ ANZECC Guidelines for Fresh and Marine Water Quality (2000)<br />
Page 49
<strong>2011</strong>-<strong>2012</strong> <strong>AEMR</strong><br />
Trigger levels for EC however have been derived<br />
from historical monitoring data (using a minimum of<br />
24 data points), where available, in accordance with<br />
the Australia and New Zealand Environment and<br />
Conservation Council Guidelines for Fresh and<br />
Marine Water Quality (ANZECC Guidelines)<br />
(ANZECC, 2000).<br />
Additional surface water monitoring in natural<br />
waterways (except Hunter River) is also undertaken<br />
after rainfall events of more than 20 mm rain in 24<br />
hours (12 am to 12 am). Mine water dams including<br />
Eagles Nest Dam are also included in the surface<br />
water monitoring program. The monthly surface<br />
water quality results for the reporting period are<br />
discussed below.<br />
For the complete monthly surface water quality and<br />
rainfall event sampling results during the reporting<br />
period, please see Appendix 2C.<br />
All surface water samples are monitored for pH and<br />
Electrical Conductivity (EC) on a monthly basis.<br />
Surface water samples from natural waterways<br />
(except Hunter River) and mine water dams<br />
including Eagles Nest Dam, South Dam and Chitter<br />
Dam are also analysed for total dissolved solids<br />
(TDS) and Total Suspended Solid (TSS). In<br />
addition, monitoring of oil and grease concentrations<br />
is also undertaken. Although monitoring of<br />
additional mine water dam sites are not required<br />
under the SWMP, mine water quality is undertaken<br />
by WCPL for salt budgeting and for operational<br />
purposes.<br />
EC and pH are measured in the field while samples<br />
are collected and analysed in the laboratory for<br />
TDS, TSS, oil and grease. Surface water samples<br />
are collected in accordance with AS/NZS<br />
5667.4:1998 – Guidance on sampling from lakes,<br />
natural and man-made and AS/NZS 5667.6:1998 –<br />
Guidance on sampling of rivers and streams.<br />
A number of surface water monitoring sites within<br />
North <strong>Wambo</strong> Creek, South <strong>Wambo</strong> Creek and<br />
Stony Creek were dry during the monthly sampling<br />
regime and therefore no water samples could be<br />
obtained.<br />
Surface water monitoring undertaken in accordance<br />
with SWMP indicated that WCPL’s mining<br />
operations had minimal influence on the water<br />
quality of the surrounding natural water courses<br />
during the reporting period.<br />
3.4.2.2 pH Analysis<br />
The recorded pH values from the surface water<br />
monitoring program during the reporting period are<br />
presented graphically and tabulated in Appendix<br />
2C.<br />
The pH levels for the Eagles Nest Dam during the<br />
2010-<strong>2011</strong> reporting period were within the pH<br />
criteria and ranged from 8.50 to 9.20. In general,<br />
mine water quality within Eagles Nest Dam is<br />
typically more alkaline than pH values of the<br />
surrounding natural creeks and streams.<br />
The recorded pH for the creeks and streams<br />
surrounding the operation varied depending on<br />
rainfall and volumetric flow.<br />
Wollombi Brook recorded average pH values of<br />
7.54, 7.73, 7.53 and 7.64 at surface water<br />
monitoring sites SW01, SW02, SW03 and SW40<br />
respectively. All monthly recorded pH values were<br />
within the SWMP surface water quality criteria and<br />
consistent with average pH result from the previous<br />
reporting period.<br />
South <strong>Wambo</strong> Creek and Stony Creek recorded<br />
average pH values of 7.43, 7.63 and 6.88 at surface<br />
water monitoring sites SW06, SW07 and SW08<br />
respectively. All monthly recorded pH values were<br />
within the SWMP surface water quality criteria and<br />
consistent with average pH result from the previous<br />
reporting period.<br />
North <strong>Wambo</strong> Creek recorded pH average pH<br />
values of 7.53 and 7.67 at surface water monitoring<br />
sites SW05 and SW27 respectively. There were no<br />
results obtainable at SW32 and only one result at<br />
SW04 due to dry conditions within the creek at each<br />
time of sampling during the reporting period. The<br />
one sample obtained at SW04 returned a pH value<br />
pH 8.00 and is within the SWMP surface water<br />
quality criteria.<br />
The recorded pH values monitored at SW39 and the<br />
WRD surface water sites SW43 to SW46 (i.e.<br />
Doctors and Longford Creeks) were within the<br />
surface water quality criteria and consistent with<br />
average pH result from the previous reporting<br />
period.<br />
3.4.2.3 Total Suspended Solids<br />
The recorded TSS values from the surface water<br />
monitoring program during the <strong>2011</strong>-<strong>2012</strong> reporting<br />
period are graphically presented and tabulated in<br />
Appendix 2C.<br />
Variations in TSS for the Eagles Nest Dam during<br />
the <strong>2011</strong>-<strong>2012</strong> reporting period were within surface<br />
water quality criteria limits and ranged from
<strong>2011</strong>-<strong>2012</strong> <strong>AEMR</strong><br />
Variations in TSS observed throughout the year<br />
within the surrounding natural creeks and streams<br />
were attributable to significant recent rainfall events.<br />
The monthly recorded TSS concentrations within<br />
the natural waterways surrounding the operations<br />
generally remained below the criteria of 120 mg/L,<br />
with the exception of several results as discussed<br />
below.<br />
Wollombi Brook recorded average TSS<br />
concentrations of 8mg/L, 17mg/L, 11mg/L and<br />
23mg/L at surface water monitoring sites SW01,<br />
SW03, SW02 and SW40 respectively. All monthly<br />
recorded TSS concentrations were within the<br />
SWMP surface water quality criteria. All annual<br />
average TSS concentrations for Wollombi Brook<br />
during the <strong>2011</strong>-<strong>2012</strong> <strong>AEMR</strong> reporting period were<br />
consistent with the average TSS concentrations<br />
recorded in the previous 2010-<strong>2011</strong> <strong>AEMR</strong>.<br />
South <strong>Wambo</strong> Creek and Stony Creek recorded<br />
average TSS concentrations of 15 mg/L, 24 mg/L<br />
and
<strong>2011</strong>-<strong>2012</strong> <strong>AEMR</strong><br />
3.4.2.4 Electrical Conductivity and Total<br />
Dissolved Solids<br />
Monitoring of EC and TDS during the reporting<br />
period of the natural creek water systems varied<br />
depending on the volumetric flows within these<br />
creek systems. This relationship between EC<br />
concentrations and flow can been seen from<br />
monitoring data at both gauging stations within the<br />
Wollombi Brook 8 (Appendix 2C).<br />
The EC and TDS concentrations within the mine<br />
water system typically depends on the quality of the<br />
fresh water added to the system and the mine water<br />
pumped around site. EC and TDS results recorded<br />
during the <strong>2011</strong>-<strong>2012</strong> reporting period are<br />
graphically presented and tabulated in Appendix<br />
2C.<br />
Wollombi Brook recorded average EC values of<br />
408S/cm, 458S/cm, 425S/cm and 450S/cm at<br />
surface water monitoring sites SW01, SW02, SW03<br />
and SW40 respectively. The annual average EC<br />
concentrations for Wollombi Brook during the <strong>2011</strong>-<br />
<strong>2012</strong> <strong>AEMR</strong> reporting period were lower compared<br />
to the average EC concentrations recorded in the<br />
previous 2010-<strong>2011</strong> <strong>AEMR</strong>. The relationship<br />
between the lower EC concentrations and water<br />
flows in Wollombi brook is displayed in Appendix<br />
2C.<br />
All monthly recorded EC values during <strong>2011</strong>-<strong>2012</strong><br />
were within the SWMP surface water quality criteria,<br />
in contrast with the results from SW03 during the<br />
2009-2010 <strong>AEMR</strong>. During the 2009-2010 reporting<br />
period there were five occasions at SW05 where the<br />
EC criteria was not achieved due to low flows in the<br />
brook. However, the Wollombi Brook sustained<br />
good flows during this reporting period, resulting in<br />
lower EC concentrations.<br />
South <strong>Wambo</strong> Creek and Stony Creek recorded<br />
average EC values of 439S/cm, 547S/cm and<br />
346mg/L at surface water monitoring sites SW06,<br />
SW07 and SW08 respectively. All annual average<br />
EC concentrations for South <strong>Wambo</strong> Creek and<br />
Stony Creek during the <strong>2011</strong>-<strong>2012</strong> <strong>AEMR</strong> reporting<br />
period were comparable to the average EC<br />
concentrations recorded in the previous 2010-<strong>2011</strong><br />
<strong>AEMR</strong>.<br />
All monthly recorded EC values during <strong>2011</strong>-<strong>2012</strong><br />
were within the SWMP surface water quality criteria<br />
for SW06, SW07 and SW08. During the previous<br />
2010-<strong>2011</strong> reporting period the monthly EC criterion<br />
was not achieved on several occasions at SW06<br />
and SW07. Both SW06 and SW07 are upstream of<br />
8 Data supplied by the NSW Office of Water<br />
WCPL mining operation and therefore considered<br />
outside the influence of mining.<br />
North <strong>Wambo</strong> Creek average EC values of<br />
430S/cm, 1627S/cm and 280mg/L at surface<br />
water monitoring sites SW27, SW05 and SW04<br />
respectively. Monthly EC concentrations for North<br />
<strong>Wambo</strong> Creek at SW27, SW05 and SW04 during<br />
the <strong>2011</strong>-<strong>2012</strong> <strong>AEMR</strong> reporting achieved the criteria<br />
for EC. On comparisons to the previous reporting<br />
period EC results at SW05 did not meet the EC<br />
criteria of 2140S/cm for August 2010 and<br />
September 2010.<br />
EC concentrations at SW39 achieved the water<br />
quality criteria of 492mg/L during the reporting<br />
period. On comparisons to the previous reporting<br />
period EC results at SW39 did not meet the EC<br />
criteria on several occasions. SW39 is to the north<br />
west of the operations where grazing activities occur<br />
on WCPL land under a private lease arrangement<br />
and therefore considered outside the influences<br />
from mining.<br />
Results from the WRD water monitoring program<br />
show that EC in the Wollombi Brook achieved the<br />
EC criteria.<br />
As discussed above, surface water sites at Longford<br />
Creek (SW43 and SW44) are adjacent to the<br />
Golden Highway and considered outside the<br />
influence of any WCPL activities. Additionally<br />
surface water sites at Doctors Creek (SW46 and<br />
SW45) are immediately downstream from non<br />
WCPL agricultural and mining activities, including<br />
cattle grazing and coal stockpiling.<br />
Doctors Creek also provides for the passage of<br />
mine water discharged from a neighbouring mine to<br />
the Hunter River. During the reporting period there<br />
were a number of visual confirmations that several<br />
discharges to Doctors Creek were being<br />
undertaken. The high EC periodically recorded at<br />
Doctors Creek is consistent with these events.<br />
3.4.2.5 Oil and Grease<br />
Oil and grease results recorded during the reporting<br />
period concluded that oil and grease concentrations<br />
in the surrounding waters were generally in<br />
compliance with the criteria set out in the WRD<br />
SWMP. Oil and grease results recorded during the<br />
2010-<strong>2011</strong> reporting period are tabulated in<br />
Appendix 2C.<br />
3.4.2.6 Flow Monitoring<br />
In consultation with NOW, WCPL completed a<br />
program to re-install all nine surface water flow sites<br />
destroyed during the June 2007 floods. The<br />
Page 52
<strong>2011</strong>-<strong>2012</strong> <strong>AEMR</strong><br />
replacement program involved the installation of<br />
hydrographic stations in North <strong>Wambo</strong> Creek, South<br />
<strong>Wambo</strong> Creek and Stony Creek, the locations of<br />
each flow monitoring site are illustrated in Figure<br />
3.1.<br />
monitoring sites approved in the 2005 GWMP.<br />
Appendix 2D contains all groundwater monitoring<br />
results from the expanded network of groundwater<br />
monitoring sites undertaken during the reporting<br />
period.<br />
The overall objectives of the GWMP are to establish<br />
baseline groundwater quality and water level data<br />
and to implement a programme of data collection<br />
that can be utilised to assess potential impacts of<br />
mining activities on the groundwater resources of<br />
the area.<br />
NWC Flow monitor site FM1 – April 2009<br />
The results of the flow monitoring program within<br />
North <strong>Wambo</strong> Creek, South <strong>Wambo</strong> Creek and<br />
Stony Creek were not able to be finalised due to<br />
software and technical difficulties. WCPL were<br />
progressing to resolve the matter at the end of the<br />
reporting period. The flow monitoring data for the<br />
<strong>2011</strong>-<strong>2012</strong> period will be presented in the next<br />
<strong>AEMR</strong>.<br />
Flow monitoring in Wollombi Brook is undertaken at<br />
Bulga and Warkworth, the results are obtained from<br />
the NOW website and are presented in Appendix<br />
2C.<br />
3.5 Groundwater Management<br />
3.5.1 Environmental Management<br />
WCPL operates in accordance with the<br />
Groundwater Monitoring Program (GWMP). The<br />
GWMP was approved by the DP&I in October 2005.<br />
WCPL revised the GWMP in July 2008 and January<br />
2010, re-submitting the GWMP to the relevant<br />
government departments to accommodate<br />
operational changes, report recommendations and<br />
development consent modification requirements.<br />
WCPL received official notification from the DTIRIS<br />
during April 2010 accepting the changes to the<br />
revised GWMP, however WCPL were still awaiting a<br />
response from DP&I.<br />
At the time of writing the <strong>2011</strong>-<strong>2012</strong> <strong>AEMR</strong>, WCPL<br />
were finalising another revision of the GWMP for<br />
submitting to the DP&I and NOW. The revision of<br />
the GWMP was in response to an action item in the<br />
<strong>2011</strong> Environmental Independent Audit.<br />
The results in Section 3.5.2 of the <strong>2011</strong>-<strong>2012</strong><br />
<strong>AEMR</strong> for groundwater are for those groundwater<br />
From a hydrogeological perspective, the <strong>Wambo</strong><br />
area is relatively complex due to the occurrence of<br />
alluvium, it’s proximity to Wollemi National Park and<br />
a number of historical and proposed mining<br />
developments. Due consideration must also be paid<br />
to constraints imposed by the existing and proposed<br />
mining operations.<br />
Groundwater data is collected on-site on a<br />
bimonthly basis and records from 1994 are available<br />
for some sites. During the 2008-2009 reporting<br />
period, WCPL initiated an independent review of the<br />
current groundwater monitoring network,<br />
undertaken by a specialist groundwater hydrologist.<br />
The outcomes of that review concluded that a<br />
modification of the groundwater monitoring network<br />
was required for current and future mining<br />
operations. Based on the recommendations from<br />
the review, a total of 11 new groundwater<br />
monitoring bores were installed in 2009-2010 with<br />
an additional vibrating wire piezometer installed<br />
during 2010-<strong>2011</strong>. The groundwater monitoring<br />
network now consists of 30 monitoring sites. These<br />
sites consist of purpose constructed monitoring<br />
bores (also referred to as piezometers); water<br />
supply bores, and bores owned by neighbouring<br />
landholders. Actual bores may be standpipe<br />
monitoring bores, stock wells or multiple vibrating<br />
wire piezometers. Appendix 2D presents the<br />
results from the groundwater monitoring network.<br />
The location of groundwater sites monitored during<br />
the reporting period are illustrated in Figure 3.12.<br />
All groundwater samples were collected in<br />
accordance with AS/NZS 5667.11:1998 – Guidance<br />
on sampling of ground waters. All samples collected<br />
were analysed in the field for pH, electrical<br />
conductivity (EC), temperature and depth to water.<br />
3.5.2 Environmental Performance<br />
The purpose of groundwater impact assessment<br />
criteria is to provide “Trigger Levels” for each of the<br />
key groundwater parameters, that is, depth to water,<br />
pH and EC. The “Trigger Levels” for each existing<br />
monitoring site used in the GWMP has been<br />
Page 53
<strong>2011</strong>-<strong>2012</strong> <strong>AEMR</strong><br />
assessed through review of the historical water level<br />
and water quality data. For the depth to water level<br />
and EC, the upper and lower trigger levels have<br />
been assigned as two standard deviations greater<br />
and less than the maximum and minimum observed<br />
values. In terms of pH, the lower and upper trigger<br />
levels have been specified as 6.0 and 9.5<br />
respectively which encompass the normal range for<br />
groundwater. To date, few pH values at either<br />
WCPL or United Collieries have been measured<br />
outside this range.<br />
The groundwater quality criteria from the updated<br />
GWMP which were applicable to groundwater<br />
monitoring sites from December 2005 are<br />
summarised in Table 3.2.<br />
The depth to water monitoring results during the<br />
reporting period are illustrated in Figures 3.13a-b to<br />
3.17 and provided in Appendix 2D. All water levels<br />
are measured from the top of the borehole casing.<br />
3.5.2.1 Depth to Water<br />
In general, water levels remained static for most of<br />
the reporting period, with most groundwater<br />
monitoring sites displaying slightly elevated water<br />
levels through this period. Good rainfall events in<br />
each of the months September through December<br />
<strong>2011</strong> of 72.4mm, 68.8mm, 119.6 mm and 77.8mm<br />
respectively and again during February and March<br />
<strong>2012</strong> of 124.5mm and 85.9mm respectively<br />
supported this trend.<br />
Groundwater Wells<br />
GW02 and GW11 located on the Brosi property<br />
were monitored throughout <strong>2011</strong>-<strong>2012</strong>. During this<br />
time, the water levels showed slight increases,<br />
peaking in February <strong>2012</strong> before showing a gradual<br />
decline for the remainder of the reporting period.<br />
levels at the end of the reporting period. As<br />
recorded in the 2010-<strong>2011</strong> reporting period, the<br />
water level at GW09 again remained outside the<br />
water level criterion during the <strong>2011</strong>-<strong>2012</strong> reporting<br />
period.<br />
100 and 200 Series Piezometers<br />
The 100 and 200 series piezometers located<br />
adjacent to the Wollombi Brook were monitored<br />
throughout <strong>2011</strong>-<strong>2012</strong>. The 100 series piezometers<br />
standing water levels were generally higher than in<br />
2010-<strong>2011</strong> reporting period. Piezometers P106,<br />
P111, P114 and P116 were periodically outside<br />
their respective criteria “minimum” level at times. As<br />
per other groundwater monitoring sites, standing<br />
water levels appeared to be elevated in months<br />
corresponding to good rainfall events.<br />
The 200 series piezometers standing water levels<br />
remained static during the reporting period and also<br />
displayed similar characteristics to the 100 series<br />
piezometers regarding increases in water levels in<br />
February <strong>2012</strong> and April <strong>2012</strong>.<br />
300 Series Piezometers<br />
The 300 series piezometers are located adjacent to<br />
Stony Creek. During this reporting period P301 and<br />
P315 water levels were maintained within their<br />
respective depth to water level criteria. Due to<br />
access issues, GW315 was not sampled in April<br />
and June <strong>2012</strong>.<br />
Longwall Panel 5 moved adjacent to P301 during<br />
January <strong>2012</strong>, corresponding to a drop in measured<br />
depth to water level in December <strong>2011</strong>. However<br />
further monitoring in February <strong>2012</strong> displayed a<br />
substantial recovery of the standing water level.<br />
While GW02 achieved the criteria values, GW11<br />
was found to be periodically below the minimum<br />
criterion level in <strong>2011</strong>-<strong>2012</strong>. In contrast, both water<br />
levels in GW02 and GW11 during 2010-<strong>2011</strong><br />
remained stable and within criterion for the period.<br />
GW08 and GW09 are located on WCPL property<br />
and were monitored throughout the <strong>2011</strong>-<strong>2012</strong><br />
period. The water levels remained mostly static for<br />
the period with a slight increase in water levels<br />
noted after heavy rainfalls in March <strong>2012</strong>.<br />
Groundwater monitoring in <strong>2011</strong>-<strong>2012</strong> identified<br />
only minor decreases and fluctuations of water<br />
Page 54
<strong>2011</strong>-<strong>2012</strong> <strong>AEMR</strong><br />
Table 3.2 – Groundwater Quality Criteria<br />
Groundwater Monitoring<br />
Site<br />
Depth to Groundwater<br />
Level<br />
Min WL<br />
(mbGL)<br />
Max WL<br />
(mbGL)<br />
Min pH<br />
pH<br />
Max pH<br />
Electrical Conductivity<br />
Min EC<br />
(S/cm)<br />
Max EC (S/cm)<br />
P106 7.16 12.3 6.0 9.5 100 1,325<br />
P109 4.30 7.81 6.0 9.5 100 890<br />
P110 2.31 10.86 6.0 9.5 250 1,300<br />
P111 5.54 9.20 6.0 9.5 300 715<br />
P114 5.70 7.92 6.0 9.5 250 750<br />
P116 5.50 9.08 6.0 9.5 1,500 8,000<br />
P202 8.15 10.60 6.0 9.5 2,500 8,500<br />
P206 19.18 23.99 6.0 9.5 1,400 3,500<br />
P301 8.77 15.98 6.0 9.5 8,500 10,000<br />
*P311 18.15 25.85 6.0 9.5 6,500 8,000<br />
P315 2.26 11.90 6.0 9.5 250 600<br />
GW02 4.05 11.41 6.0 9.5 100 860<br />
GW08 1.17 3.80 6.0 9.5 1,500 2,500<br />
GW09 2.02 2.85 6.0 9.5 1,500 1,800<br />
GW11 4.25 7.75 6.0 9.5 200 750<br />
P1 13.33 30.28 6.0 9.5 5,000 12,000<br />
P3 5.63 9.15 6.0 9.5 300 11,200<br />
P5 0.76 7.74 6.0 9.5 750 5,250<br />
P6 1.58 6.47 6.0 9.5 1,500 3,500<br />
P11 0.50 44.58 6.0 9.5 10,000 23,000<br />
P12 5.75 7.77 6.0 9.5 2,800 8,820<br />
P13 5.96 7.98 6.0 9.5 1,000 3,200<br />
P15 5.46 6.42 6.0 9.5 2,900 22,000<br />
P16 6.47 7.37 6.0 9.5 3,800 22,700<br />
P17 5.25 6.21 6.0 9.5 8,900 17,000<br />
P18 6.48 7.53 6.0 9.5 4,450 22,000<br />
P20 6.83 7.86 6.0 9.5 4,750 22,800<br />
Note: mbGL – meters below ground level<br />
* P311 has now been decommissioned due to subsidence related impacts<br />
Page 55
SUMP<br />
SUMP<br />
GW20<br />
GW16 GW17 GW19<br />
P1<br />
P11<br />
NORTH WAMBO CREEK<br />
DIVERSION<br />
P3<br />
P20<br />
STAGE 3 CREEK<br />
DIVERSION<br />
P5<br />
P6<br />
GW21<br />
WAMBO CHPP<br />
GW18<br />
WAMBO ADMIN<br />
P315<br />
WAMBO<br />
GW09<br />
NORTH<br />
CREEK<br />
GW08<br />
WOLLOMBI<br />
BROOK<br />
GW15<br />
P301<br />
GW12<br />
P114 P206<br />
P116<br />
P106<br />
P202<br />
GW14<br />
STONY<br />
CREEK<br />
P109<br />
GW02<br />
SOUTH<br />
GW11<br />
WAMBO<br />
CREEK<br />
GW22<br />
GW13<br />
Legend<br />
Colliery Holding Boundary<br />
DA Approved Open Cut Limits<br />
MOP Open Cut Limits<br />
<strong>Wambo</strong> Owned Land<br />
<strong>Wambo</strong> Ground Water Well Monitoring Site<br />
<strong>Wambo</strong> Peizometer Monitoring Site<br />
<strong>Wambo</strong> Proposed Groundwater Monitoring Site<br />
United Peizometer Monitoring Site<br />
North <strong>Wambo</strong> Underground Workings (Existing)<br />
Prepared by Pegasus Technical CAD FILE: 08674A<br />
North <strong>Wambo</strong> Underground<br />
Workings (Proposed)<br />
Dams<br />
WAMBO COAL<br />
GROUND WATER MONITORING LOCATIONS<br />
FIGURE 3.12
<strong>2011</strong>-<strong>2012</strong> <strong>AEMR</strong><br />
Figure 3.13a – Ground Water (Brosi Wells) Depth to Water<br />
Monthly Piezometer Monitoring<br />
100 Series<br />
Figure 3.13b – Ground Water (<strong>Wambo</strong> Wells) Depth to Water<br />
Monthly Ground Water Monitoring<br />
<strong>Wambo</strong> Property<br />
P106 P109 P110 P111 P114 P116<br />
GW08 - Old Well No. 1 (United Well 1) GW09 - New Well No. 2 (United Well 2)<br />
Month<br />
Month<br />
Depth to Water (m)<br />
0<br />
1<br />
2<br />
3<br />
4<br />
5<br />
6<br />
7<br />
8<br />
9<br />
Jul-11<br />
Aug-11<br />
Sep-11<br />
Oct-11<br />
Nov-11<br />
Dec-11<br />
Jan-12<br />
Feb-12<br />
Mar-12<br />
Apr-12<br />
May-12<br />
Jun-12<br />
Depth to Water (m)<br />
0<br />
1<br />
2<br />
3<br />
4<br />
5<br />
Jul-11<br />
Aug-11<br />
Sep-11<br />
Oct-11<br />
Nov-11<br />
Dec-11<br />
Jan-12<br />
Feb-12<br />
Mar-12<br />
Apr-12<br />
May-12<br />
Jun-12<br />
Figure 3.14 – Ground Water (100 Series) Depth to Water<br />
Figure 3.15 – Ground Water (200 Series) Depth to Water<br />
Monthly Piezometer Monitoring<br />
100 Series<br />
Monthly Piezometer Monitoring<br />
200 Series<br />
Depth to Water (m)<br />
0<br />
1<br />
2<br />
3<br />
4<br />
5<br />
6<br />
7<br />
8<br />
9<br />
Jul-11<br />
Aug-11<br />
P106 P109 P110 P111 P114 P116<br />
Sep-11<br />
Oct-11<br />
Nov-11<br />
Dec-11<br />
Month<br />
Jan-12<br />
Feb-12<br />
Mar-12<br />
Apr-12<br />
May-12<br />
Jun-12<br />
Depth to Water (m)<br />
0<br />
2<br />
4<br />
6<br />
8<br />
10<br />
12<br />
14<br />
16<br />
18<br />
20<br />
Jul-11<br />
Aug-11<br />
Sep-11<br />
Oct-11<br />
Nov-11<br />
P202<br />
Dec-11<br />
Month<br />
Jan-12<br />
P206<br />
Feb-12<br />
Mar-12<br />
Apr-12<br />
May-12<br />
Jun-12<br />
Figure 3.16 – Ground Water (300 Series) Depth to Water<br />
Monthly Piezometer Monitoring<br />
300 Series<br />
P301 P311 P315<br />
Figure 3.17 – Ground Water (United) Depth to Water<br />
Monthly Piezometer Monitoring<br />
United Piezometers<br />
P1 P3 P5 P6 P11 P12<br />
Depth to Water (m)<br />
0<br />
5<br />
10<br />
15<br />
20<br />
25<br />
Jul-11<br />
Aug-11<br />
Sep-11<br />
Oct-11<br />
Nov-11<br />
Dec-11<br />
Month<br />
Jan-12<br />
Feb-12<br />
Mar-12<br />
Apr-12<br />
May-12<br />
Jun-12<br />
Depth to Water (m)<br />
0<br />
5<br />
10<br />
15<br />
20<br />
25<br />
30<br />
35<br />
Jul-11<br />
P13 P15 P16 P17 P18 P20<br />
Month<br />
Aug-11<br />
Sep-11<br />
Oct-11<br />
Nov-11<br />
Dec-11<br />
Jan-12<br />
Feb-12<br />
Mar-12<br />
Apr-12<br />
May-12<br />
Jun-12<br />
Page 57
<strong>2011</strong>-<strong>2012</strong> <strong>AEMR</strong><br />
United Collieries Piezometers<br />
The United Collieries network of piezometers<br />
displayed largely static water levels for most of the<br />
reporting period. All piezometers except P1, P12<br />
and P13 were not sampled in February due to<br />
access issues at the time. P5 and P18 both<br />
periodically exceeded maximum depth to water<br />
value. P11 has remained dry throughout this and<br />
the previous reporting period. The December <strong>2011</strong><br />
result for P6 was outside the minimum depth to<br />
water criteria.<br />
The remaining sites remained within their respective<br />
depth to water criteria for the <strong>2011</strong>-<strong>2012</strong> reporting<br />
period. Significant rainfall events during the middle<br />
of the reporting period were likely influencing<br />
increases in water levels at the corresponding time.<br />
3.5.2.2 pH<br />
The results for pH analysis of the groundwater<br />
monitoring network are provided graphically and<br />
tabulated in Appendix 2D.<br />
The pH values for groundwater in wells GW02,<br />
GW09 and GW11 remained within the GWMP<br />
trigger levels during the reporting period with pH<br />
values averaging from 6.88 to 7.89.<br />
GW08 had a single value slightly outside of<br />
minimum criteria in <strong>2011</strong>-<strong>2012</strong>. The groundwater<br />
wells GW02 and GW11 located on the Brosi’s<br />
property are subject to the ANZECC criteria for<br />
“Raw Waters for drinking purposes subject to<br />
coarse screening”. GW02 was just outside of the<br />
pH range of 6.5-8.5 in August <strong>2011</strong>. This value is<br />
similar to those recorded by the 100 series<br />
piezometers in the ‘<strong>Wambo</strong> Creek Alluvium’. GW11<br />
was within the ANZECC pH range of 6.5-8.5 for the<br />
whole monitoring period.<br />
All pH values recorded during the <strong>2011</strong>-<strong>2012</strong><br />
reporting period for the 100, 200 and 300 series<br />
remained within the pH trigger limits except for one<br />
value recorded at P315. The value of pH3.7<br />
obtained at P315 in February <strong>2012</strong> was not able to<br />
be verified with further sampling due to accessibility<br />
issues. Ongoing monitoring in the next reporting<br />
period will identify if the water quality is returning<br />
back within the water quality criteria.<br />
3.5.2.3 Electrical Conductivity<br />
The results for EC analysis of the groundwater<br />
monitoring network are provided graphically and<br />
tabulated in Appendix 2D.<br />
Groundwater wells GW08 and GW11 remained for<br />
the most part within their respective GWMP trigger<br />
levels for EC during the reporting period. Low<br />
rainfall in July and August <strong>2011</strong> may have<br />
contributed to the elevated EC at GW02 in August<br />
<strong>2011</strong>. The average EC for GW02 and GW11 was<br />
574 uS/cm and 417 uS/cm respectively. The<br />
recorded EC at GW09 has remained below the<br />
minimum EC criterion of 1500S/cm since<br />
December 2010. Average EC of GW09 for this<br />
reporting period was 471 uS/cm.<br />
The measured EC in the 100 and 200 piezometer<br />
series remained relatively static during the reporting<br />
period. The measured EC for P114 was the only<br />
100 or 200 series piezometer with EC values above<br />
the groundwater quality criteria for the reporting<br />
period. Further monitoring demonstrated EC<br />
concentrations for P114 began returning to previous<br />
concentrations. The EC results recorded in the<br />
<strong>2011</strong>-<strong>2012</strong> reporting period for both the 100 and<br />
200 piezometer series were consistent with EC<br />
results recorded in the 2010-<strong>2011</strong> period.<br />
The measured EC in the 300 series piezometers<br />
during the reporting period showed some<br />
fluctuations. All the measured EC values at P301<br />
fell below their minimum EC trigger level of<br />
8500S/cm with an annual average of 2788S/cm<br />
and a minimum EC valve of 2130S/cm for<br />
February <strong>2012</strong>. The April <strong>2012</strong> sampling event at<br />
P301 showed a periodic increase in EC to<br />
4,040uS/cm. The EC results recorded in the 2010-<br />
<strong>2011</strong> reporting period for the 300 piezometer series<br />
were generally consistent with EC results recorded<br />
in the 2009-2010 period.<br />
Most of the United Collieries monitored piezometers<br />
generally remained within their respective EC<br />
criteria levels during the reporting period. The<br />
remainder of United’s piezometers returned EC<br />
values well below their respective minimum EC<br />
trigger levels. The EC results recorded in the <strong>2011</strong>-<br />
<strong>2012</strong> reporting period for the United Collieries<br />
piezometers were consistent with EC results<br />
recorded in the 2010-<strong>2011</strong> period.<br />
All pH values recorded during the <strong>2011</strong>-<strong>2012</strong><br />
reporting period for the United Collieries<br />
piezometers remained within their respective pH<br />
trigger limits as listed in Table 3.2.<br />
Page 58
<strong>2011</strong>-<strong>2012</strong> <strong>AEMR</strong><br />
3.6 Contaminated Land<br />
3.6.1 Environmental Performance<br />
The highest potential for land contamination at<br />
WCPL is from hydrocarbons. The main areas with<br />
the potential for land contamination are the<br />
hydrocarbon storage and refuelling areas. All<br />
hydrocarbon storage areas are routinely inspected<br />
as part of WCPL Environmental Management<br />
System (EMS). These concrete bunded areas are<br />
regularly monitored and maintained, reducing the<br />
risk of any hydrocarbon spillage.<br />
WCPL developed a detailed scope of works to<br />
remove the old underground unleaded fuel tank and<br />
its associated fuel bowser, in response an audit<br />
report recommendation. As discussed in Section<br />
2.9.1, WCPL engaged an independent<br />
environmental consultancy to validate compliance of<br />
the facility against The Protection of the<br />
Environment Operations (Underground Petroleum<br />
Storage Systems) Regulation 2008. Validation of<br />
the UST excavation and waste classification<br />
sampling of the stockpiled material was undertaken<br />
on 5 July <strong>2011</strong>. All concentrations of the soil<br />
samples collected from the pit walls and base as<br />
well as from underneath the bowser and the fuel line<br />
were below the SAC for TPH, BTEX, PAH and<br />
Lead. Therefore, the tank pit excavation is deemed<br />
suitable to remain on a site for continued<br />
commercial/industrial land use in accordance with<br />
the NSW EPA “Contaminated Sites: Guidelines for<br />
Assessing Service Station Sites” (1994).<br />
All concentrations of the soil samples collected from<br />
the excavated material stockpile were below the<br />
SAC for TPH, BTEX, PAH and Lead. Therefore, the<br />
stockpiled material was classified as “General Solid”<br />
waste in accordance with the NSW DECC (2008)<br />
waste classification guidelines.<br />
As discussed in the last <strong>AEMR</strong>, WCPL and Downer<br />
EDI were finalising procedures and location of the<br />
bioremediation site within the Open Cut. The<br />
location of the bioremediation area was changed<br />
during this reporting period to allow for realignment<br />
of the haul road for the raising of the Hunter Pit<br />
tailings dam wall. The new location chosen for the<br />
site is now adjacent to the ramp going to RL 160.<br />
This facility in now operational to accept and treat<br />
hydrocarbon contaminated material. Further details<br />
regarding the bioremediation site are discussed in<br />
Section 3.17.<br />
With the above controls in place, the probability of<br />
contaminated land at WCPL is considered to be low.<br />
Any soil that becomes contaminated with<br />
hydrocarbons is reported and collected for treatment<br />
in the new bioremediation facility.<br />
General location of new bioremediation site<br />
General arrangement of new bioremediation site<br />
3.7 Threatened Flora and<br />
Fauna<br />
3.7.1 Environmental Management<br />
WCPL has a Flora and Fauna Management Plan<br />
(FFMP) for the mine, and for the <strong>Wambo</strong> Rail<br />
Development (WRD). Both Plans have been<br />
prepared in accordance with the development<br />
consent requirements, and were approved by the<br />
DP&I in 2005. The FFMP’s document management<br />
practices aimed at minimising the potential impacts<br />
on flora and fauna as a result of WCPL’s activities.<br />
Both plans include a Vegetation Clearance Protocol<br />
and Threatened Species Management Protocol.<br />
The FFMP for the mine also outlines the Remnant<br />
Woodland Enhancement Program (RWEP), the<br />
Rehabilitation Program and the Flora and Fauna<br />
Monitoring Program.<br />
Page 59
<strong>2011</strong>-<strong>2012</strong> <strong>AEMR</strong><br />
During 2008 the FFMP was reviewed internally and<br />
audited externally by an ecologist. The revised<br />
FFMP was submitted to the DP&I in April 2008, and<br />
approved by the DP&I in June 2008. A further<br />
review of the FFMP was completed in early 2010<br />
and subsequently re-submitted into the DP&I. At the<br />
end of the reporting period, WCPL were awaiting<br />
notification from DP&I regarding the latest revision<br />
of the FFMP.<br />
At the time of writing the <strong>2011</strong>-<strong>2012</strong> <strong>AEMR</strong>, WCPL<br />
were finalising another revision of the FFMP for<br />
submitting to the DP&I and NOW. The revision of<br />
the FFMP was in response to an action item in the<br />
<strong>2011</strong> Environmental Independent Audit.<br />
The WRD FFMP includes the requirements for the<br />
protection and maintenance of the rail loop<br />
woodland areas as part of the RWEP.<br />
The key components of the Vegetation Clearance<br />
Protocol include the delineation of areas to be<br />
cleared of remnant vegetation, pre-clearance<br />
surveys, fauna management strategies, vegetation<br />
clearance procedures, seed collection, and salvage<br />
reuse of materials.<br />
The key components of the Threatened Species<br />
Management Protocol are site observations and<br />
surveys, threatened species management<br />
strategies, consultation and reporting.<br />
3.7.2 Environmental Performance<br />
During the reporting period WCPL engaged a<br />
specialist ecologist to undertake the annual<br />
ecological monitoring Remnant Woodland Areas<br />
and Riparian Bend and Bank Stability Monitoring, in<br />
accordance with the FFMP. A summary of the<br />
monitoring is in Section 3.7.2.3. In addition to this,<br />
WCPL completed Swift Parrot and Regent<br />
Honeyeater and winter bird surveys. The results of<br />
the winter bird survey are incorporated into the<br />
annual Ecological Monitoring Report, included in<br />
Appendix 2G.<br />
3.7.2.1 Pre-Clearance Surveys<br />
During the reporting period, several pre-clearance<br />
surveys were undertaken in consultation with<br />
ecological specialists, for mining and exploration<br />
related activities, including the advancing open cut<br />
into the area known as the Montrose Pit . Under the<br />
FFMP, pre-clearance surveys identify requirements<br />
for additional flora and fauna management<br />
measures.<br />
3.7.2.2 Acacia Species<br />
During the development of the EIS in 2003, a stand<br />
of an Acacia species was found to the west of North<br />
<strong>Wambo</strong> Creek, which was initially identified as<br />
Acacia anuera. In 2004 Terry Tame (Acacia expert)<br />
and Travis Peake (then of the Hunter Catchment<br />
Management Trust) concluded this stand to be<br />
Acacia pendula. However, the lack of flowering<br />
plants meant that confirmation could not be<br />
attained.<br />
The NSW Scientific Committee has made a final<br />
determination to list the population of the tree<br />
Acacia pendula in the Hunter catchment as an<br />
Endangered Population in Part 2 of Schedule 1 of<br />
the Threatened Species Conservation Act 1995.<br />
An Acacia management plan was developed in<br />
2006. During the development of this management<br />
plan site investigations were undertaken of the<br />
Acacia sp. on site and the known stands of Acacia<br />
pendula in Jerry’s Plains cemetery. These<br />
investigations raised questions over the correct<br />
identification of the large stand of Acacia sp at<br />
WCPL. Due to the lack of flowering it is thought that<br />
perhaps this plant is a sterile hybrid of Acacia<br />
pendula and Acacia homalophylla. Conclusively<br />
identified Acacia pendula and these hybrid Acacia<br />
have been found at Jerry’s Plains cemetery and<br />
across WCPL’s site.<br />
Further detailed investigations, which included a site<br />
inspection in April 2007 to determine the correct<br />
identification of these Acacia species was<br />
undertaken by HLA Envirosciences. Although the<br />
findings to date have been inconclusive, WCPL<br />
continued to monitor these plants for signs of<br />
flowering during 2010-<strong>2011</strong> so that correct<br />
identification may be made.<br />
In 2008, investigations were undertaken with an<br />
expert botanist during the reporting period to verify if<br />
the strand is actually Acacia pendula. It was<br />
determined that insufficient information exists (i.e.<br />
did not flower during the reporting period again) with<br />
respect to the genetic characteristic of this species.<br />
In accordance with Condition 16 of the <strong>Wambo</strong> <strong>Coal</strong><br />
SMP, WCPL prepared the Acacia pendula<br />
Management Plan for LW Panel 4. The Acacia<br />
pendula Management Plan for LW Panel 4 was<br />
approved by the DTIRIS on the 13 January <strong>2011</strong>.<br />
In accordance with WCPL’s Acacia pendula<br />
Management Plan for LW Panel 4 an inspection<br />
was completed on 15 June <strong>2011</strong> by an ecologist.<br />
These investigations were conducted as a due<br />
diligence precaution to determine the current<br />
condition of the population with regards to the<br />
health, recruitment, extent and habitat attributes<br />
Page 60
<strong>2011</strong>-<strong>2012</strong> <strong>AEMR</strong><br />
prior to undermining. The results from that survey<br />
concluded the stand is generally healthy with<br />
respect to Age Classes, Recruitment, Health,<br />
Infestations and Senescence. The stand shows the<br />
typical attributes of a dynamic population which is<br />
self-propagating and is likely to continue to do so<br />
provided no stochastic events impact upon the area.<br />
Underground mining activities below this stand of<br />
Acacia species were completed during the reporting<br />
period. In accordance with the Acacia pendula<br />
Management Plan for LW Panel 4, post inspections<br />
were undertaken on 5 December <strong>2011</strong> by an<br />
ecologist. These investigations were conducted as a<br />
due diligence precaution to compare the condition of<br />
the population with regards to the health,<br />
recruitment, extent and habitat attributes<br />
subsequent to undermining by LW-4.<br />
The stand of Acacia pendula (Weeping Myall) within<br />
the RWEP area is generally healthy with respect to<br />
Age Classes, Recruitment, Health, Infestations and<br />
Senescence. The stand shows the typical attributes<br />
of a dynamic population which is currently<br />
selfpropagating and is likely to continue to do so<br />
provided no stochastic events impact upon the area.<br />
There are large numbers of the parasitic mistletoe<br />
Amyema pendula present on many of the Weeping<br />
Myall trees. In high numbers these mistletoes have<br />
a detrimental effect on the Weeping Myall and have<br />
most likely caused the death of some specimens.<br />
For the complete assessment report, please refer to<br />
Appendix 2G.<br />
3.7.2.3 Remnant Woodland Enhancement<br />
Program<br />
The objective of the Remnant Woodland<br />
Enhancement Program (RWEP) is to help conserve<br />
regional biodiversity, whilst enhancing the habitat<br />
available to flora and fauna. The RWEP will provide<br />
a strategy that gives protection in perpetuity for<br />
RWEP Area A and long-term protection of RWEP<br />
Areas B and C. The RWEP also includes the area<br />
within the area of the WRD rail loop (see Figure<br />
3.18).<br />
During late 2009, WCPL added another area of<br />
approximately 50ha to the Remnant Woodland<br />
Enhancement Program. The additional area offset<br />
construction of the new South Dam. This recent<br />
offset area is now referred to as RWEP Area D (see<br />
Figure 3.18).<br />
<strong>2011</strong> Annual Ecological Monitoring Summary<br />
Flora monitoring identified 266 flora species across<br />
34 flora quadrats. Based on these observations, the<br />
current management practices within the RWEP<br />
areas of <strong>Wambo</strong> <strong>Coal</strong> Mine is appropriate for the<br />
conservation of flora species. Variation evident in<br />
the results from the six years of monitoring is most<br />
likely related to natural variation in species<br />
distribution, natural variation in species abundance<br />
and variation inherent in the sampling design, and<br />
not due to current management practices. There<br />
was no evidence to suggest that current<br />
management practices or mining activity was having<br />
any effect on the flora species within the RWEP<br />
areas of <strong>Wambo</strong> <strong>Coal</strong> Mine.<br />
While no Swift Parrots (Lathamus discolor) or<br />
Regent Honeyeaters (Anthochaera phrygia) were<br />
identified during targeted winter bird surveys, annual<br />
surveys for these species should continue into the<br />
future, particularly during years of heavy eucalypt<br />
blossom when either or both species may occur on<br />
<strong>Wambo</strong> <strong>Coal</strong> land.<br />
Diurnal bird monitoring identified a total of 126 bird<br />
species across 26 survey sites and<br />
opportunistically, including nine threatened species.<br />
Current management practises within the RWEP<br />
areas of <strong>Wambo</strong> <strong>Coal</strong> Mine appear to be<br />
appropriate for the conservation of bird species.<br />
Variation evident in the results across the years of<br />
monitoring is most likely related to natural variation<br />
in species diversity, natural variation in species<br />
abundance and variation inherent in the sampling<br />
design, and not to current management practises.<br />
One Powerful Owl (Ninox strenua), which is listed<br />
as Vulnerable under the NSW Threatened Species<br />
Conservation Act 1995 (TSC Act), responded during<br />
call playback surveys. Owl species targeted by call<br />
playback also included Masked Owl (Tyto<br />
novaehollandiae), Barking Owl (Ninox connivens)<br />
and Sooty Owl (Tyto tenebricosa). Due to the large<br />
home range area of the target owl species, which<br />
each have a home range in the vicinity of or greater<br />
than 1000 hectares and the relatively few (four) call<br />
playback sessions undertaken each year it is not<br />
unexpected that threatened owls species are rarely<br />
detected.<br />
Spotlighting surveys identified the Common<br />
Brushtail Possum (Trichosurus vulpecula) as the<br />
most common arboreal mammal species in RWEP<br />
areas of the <strong>Wambo</strong> <strong>Coal</strong> Mine. Across five years of<br />
annual monitoring only four arboreal mammal<br />
species have been identified. The Common<br />
Brushtail Possum was identified each year and the<br />
Sugar Glider (Petaurus breviceps) was recorded for<br />
the first time in <strong>2011</strong>. The threatened Yellow bellied<br />
Page 61
<strong>2011</strong>-<strong>2012</strong> <strong>AEMR</strong><br />
Glider (P. australis) and Squirrel Glider (P.<br />
norfolcensis) were recorded for the first time in<br />
2010. Both species are listed as Vulnerable under<br />
the TSC Act.<br />
Amphibian species were recorded at their highest<br />
abundance to date with 13 species being identified.<br />
Three species of reptile were recorded which is the<br />
lowest abundance from all survey years.<br />
Ten microbat species were positively identified with<br />
four being listed as Vulnerable under the TSC Act,<br />
namely the Large-eared Pied Bat (Chalinolobus<br />
dwyeri), Little Bentwing Bat (Miniopterus australis),<br />
Eastern Bentwing-bat (Miniopterus schreibersii<br />
oceanensis) and Yellow-Bellied Sheathtail-bat<br />
(Saccolarimus flaviventris).<br />
Varied Sittella (Daphoenositta chrysoptera)<br />
There is no evidence to suggest that current<br />
management practices or mining activities are<br />
having any negative impact on fauna species within<br />
the RWEP areas.<br />
Riparian monitoring identified Stoney Creek as<br />
being in good condition, and North <strong>Wambo</strong> and<br />
South <strong>Wambo</strong> Creeks in moderate condition.<br />
Current bank erosion problem areas are a result of<br />
historic land management practises, however, in the<br />
absence of current management will continue to<br />
degrade. Subsidence from mining practices was<br />
detected along North <strong>Wambo</strong> Creek during riparian<br />
assessments. Recommendations have been made<br />
to address problem erosion areas and to undertake<br />
other management actions that would lead to<br />
increased condition scores for all three creeks.<br />
The <strong>2011</strong> survey recorded the average number of<br />
bird species, when compared to all other survey<br />
seasons, including the Common Bronzewing (Phaps<br />
chalcoptera) and Varied Sittella (Daphoenositta<br />
chrysoptera) (see below).<br />
Male Common Bronzewing (Phaps chalcoptera)<br />
Page 62
SUMP<br />
SUMP<br />
V10-A2<br />
NORTH WAMBO<br />
CREEK DIVERSION<br />
STAGE 3 CREEK<br />
DIVERSION<br />
V10-A1<br />
D<br />
V11-B1<br />
V6-A1<br />
V11-B2<br />
V6-B1c<br />
V6-B2c<br />
C<br />
V6-A3<br />
V1-B3<br />
V2-B2<br />
V13-B1<br />
V9-B2<br />
B<br />
V14-B1<br />
V14-A1<br />
V14-B2<br />
V1-B1<br />
V2-B1 V5-B2<br />
V5-B3<br />
V1-B2<br />
A<br />
V6-B2<br />
V6-B3<br />
V1-A1<br />
V3-B1 V6-B1<br />
V5-B1<br />
V6-A1<br />
V5-A1<br />
V5-A2<br />
V10-B1<br />
V9-B1<br />
V1-A2<br />
V2-A1<br />
Wollemi<br />
National<br />
Park<br />
V9-A1<br />
Legend<br />
Colliery Holding Boundary<br />
Remnant Woodland Enhancement<br />
Vegetation Communities<br />
<strong>Wambo</strong> Owned Land<br />
Plot Type - Condition<br />
Base - Satisfactory<br />
Base - Good<br />
Analogue - Poor<br />
Analogue - Satisfactory<br />
Analogue - Good<br />
WAMBO COAL<br />
REMNANT WOODLAND ENHANCEMENT<br />
PROGRAM MONITORING<br />
FIGURE 3.18<br />
Prepared by Pegasus Technical CAD FILE: 08675A
NORTH WAMBO CREEK<br />
DIVERSION<br />
STAGE 3 CREEK<br />
DIVERSION<br />
WARKWORTH<br />
D<br />
STAGE 3 CREEK<br />
DIVERSION<br />
A<br />
C<br />
WAMBO<br />
HOMESTEAD<br />
WAMBO ADMIN<br />
WAMBO CHPP<br />
NORTH WAMBO CREEK<br />
B<br />
A<br />
STONY<br />
CREEK<br />
SOUTH<br />
WAMBO<br />
CREEK<br />
WOLLOMBI<br />
BROOK<br />
Legend<br />
Colliery Holding Boundary<br />
Remnant Woodland Enhancement<br />
Weed Control<br />
Dams<br />
WEED CONTROL<br />
FIGURE 3.19<br />
WAMBO COAL<br />
Prepared by Pegasus Technical CAD FILE: 08676A
<strong>2011</strong>-<strong>2012</strong> <strong>AEMR</strong><br />
3.8 Weeds<br />
3.8.1 Environmental Management<br />
The FFMP details the weed control measures used<br />
to minimise the potential for weed invasion. These<br />
include identification of weed infestations during<br />
pre-clearance surveys, removal of weeds or<br />
application of approved herbicides and follow-up<br />
inspections to assess effectiveness of the weed<br />
management measures implemented.<br />
Only certified personnel who have completed the<br />
ChemCert Farm Chemicals User Course, the<br />
SMART Train Chemical User qualification or<br />
equivalent undertake weed control at WCPL. All<br />
activities are conducted in accordance with the<br />
Pesticides Amendment (Records) Regulation 2002.<br />
Weed sighting sheets have been developed and are<br />
made available to all personnel. The sighting sheets<br />
assist with prioritising weed control works and<br />
identifying problem areas. During the reporting<br />
period WCPL engaged a weed contractor to assist<br />
with the ongoing (monthly) weed control. All areas<br />
that are inspected and controlled are entered into<br />
GIS database to assist in the management of weeds<br />
across the entire site (see Figure 3.19).<br />
3.8.2 Environmental Performance<br />
3.8.2.1 Remnant Woodland Enhancement<br />
Areas<br />
A comprehensive weed control program within<br />
Remnant Woodland Areas continued during the<br />
reporting period. The target species of the weed<br />
control program included African Olive, Mother of<br />
Millions, Creeping Pear, Tiger Pear, Purple Top,<br />
Caster Oil Plant, Galenia and African Boxthorn.<br />
North <strong>Wambo</strong> Creek and Stony Creek. Continued<br />
monitoring will be undertaken during <strong>2011</strong>-<strong>2012</strong> to<br />
determine if there is any seasonal variation in the<br />
weed species present. All weed control work is<br />
performed in accordance with the Cattle Care<br />
requirements.<br />
3.8.2.3 Open Cut Rehabilitation<br />
Weed control programs continued within areas of<br />
the Open Cut rehabilitation. Several methods of<br />
weed control have historically been employed,<br />
including weed spraying, burying and competition<br />
planting.<br />
3.9 Feral Animal Control<br />
3.9.1 Environmental Management<br />
The FFMP details the feral animal control measures<br />
used to minimise the threat to native fauna and<br />
comply with the requirements of the Rural Lands<br />
Protection Act, 1998. Programs to assess the<br />
status of pest populations, implementation of pest<br />
control measures, implementation of mandatory<br />
pest control for any declared pests (i.e. rabbits, pigs<br />
and wild dogs) and follow-up inspections to assess<br />
effectiveness of the control measures implemented<br />
are carried out on an annual basis.<br />
3.9.2 Environmental Performance<br />
During the reporting period WCPL completed an<br />
extensive feral animal control program. The<br />
vertebrate pest control program was undertaken in<br />
during January/February <strong>2012</strong> and during May <strong>2012</strong><br />
throughout the RWEP areas, around WCPL<br />
infrastructure and WCPL owned buffer lands.<br />
Follow up spraying continued in this reporting<br />
period, to enhance previous spraying campaigns.<br />
Weed spraying in RWEP A and the Rail Loop areas<br />
reduced significantly the areas infested by Creeping<br />
Pear. The weed control program also focussed on<br />
reducing the number of African Olive trees across<br />
WCPL landholdings.<br />
WCPL weed control program and continued<br />
monitoring will be undertaken during <strong>2012</strong>-2013 to<br />
determine if there is any seasonal variation in the<br />
weed species present.<br />
3.8.2.2 North <strong>Wambo</strong>, South <strong>Wambo</strong> and<br />
Stoney Creeks<br />
During the reporting period weed control was<br />
undertaken along potions of South <strong>Wambo</strong> Creek,<br />
Jan/Feb <strong>2012</strong> Dog Baiting Locations<br />
The aim of the program was to target wild dogs that<br />
had been reported in and surrounding the<br />
Warkworth area. Feral species control is an integral<br />
component of <strong>Wambo</strong>’s long term flora and fauna<br />
enhancement program.<br />
Page 65
<strong>2011</strong>-<strong>2012</strong> <strong>AEMR</strong><br />
The vertebrate pest management program involved<br />
1080 baiting, targeting wild dogs (Canis lupus<br />
familiaris) and foxes (Vulpes vulpes). The program<br />
was run in conjunction with the Livestock Health and<br />
Pest Authority and surrounding mining operations.<br />
Figure 1 Illustrates the general area targeted for dog<br />
baiting in its regional context.<br />
The vertebrate pest management program proved<br />
extremely successful with at least one bait taken<br />
from 88% (or 41 of the 47 sites) of the baiting sites<br />
established. A further 6% (3 of the 47 sites) of the<br />
sites had been disturbed by dog activity although no<br />
baits were actually taken from these sites, leaving<br />
only three sites (6%) where baits were not taken<br />
and sites were not disturbed at all. Fifty four percent<br />
of all the baits taken showed evidence of being<br />
consumed by dogs of various sizes, 43% were<br />
taken by foxes, with the remaining 3% taken by<br />
other non targeted vertebrate species.<br />
3.9.3 Remnant Woodland<br />
Enhancement Program<br />
The results of the vertebrate pest control program<br />
within the RWEP areas are described in Section<br />
3.9.2.<br />
3.10 Blasting and Vibration<br />
3.10.1 Environmental Management<br />
Open cut blasting activities are conducted by Dyno<br />
Nobel and monitoring is conducted by WCPL<br />
personnel using a network of permanent blast<br />
monitors located on site and on neighbouring<br />
properties surrounding WCPL (Figure 3.1). Blast<br />
monitoring was conducted at four locations around<br />
the mine during the <strong>2011</strong>-<strong>2012</strong> reporting period.<br />
The locations of these blast monitors are as agreed<br />
by the OEH and satisfy WCPL’s regulatory<br />
requirements in relation to blast monitoring.<br />
EPL 529 also permits WCPL’s blasting operations a<br />
maximum of 120 dB(L) and requires less than 5% of<br />
total blasts exceed 115 dB(L) at any non-mine<br />
owned residential location (Table 3.10).<br />
Table 3.10 WCPL Overpressure Criteria<br />
Airblast overpressure<br />
level<br />
Allowable exceedance<br />
(dB(Lin Peak))<br />
5% of the total number of blast over a<br />
115<br />
period of 12 months<br />
120 0%<br />
than 5% of total blasts exceed 5 mm/second at any<br />
non-mine owned residential locations.<br />
Table 3.11 WCPL Ground Vibration Criteria<br />
Peak particle velocity<br />
Allowable exceedance<br />
(mm/s)<br />
5% of the total number of blast over a<br />
5<br />
period of 12 months<br />
10 0%<br />
Every blast is designed with consideration for<br />
vibration and overpressure impacts of blasting on<br />
our neighbours, including the Underground<br />
operations. In addition to the blast designs, a<br />
blasting protocol is in place which prevents blasting<br />
during weather conditions which may adversely<br />
affect neighbours. The wind criteria of the blasting<br />
protocol were modified following an incident in<br />
January 2007.<br />
Prior to each blast, both wind speed and wind<br />
direction are continually assessed in accordance<br />
with WCPL blasting guidelines.<br />
3.10.2 Environmental Performance<br />
3.10.2.1 Blast Monitoring<br />
There were a total of 76 blasts in the open cut<br />
during the reporting period. All 76 blasts were<br />
monitored with a 93.4% capture rate. During<br />
November <strong>2011</strong> WCPL experienced technical<br />
issues with the downloading of the data resulting in<br />
no available vibration data for November <strong>2011</strong>. As a<br />
result WCPL immediately reviewed the procedures<br />
and monitoring system and as a result engaged an<br />
external consultancy firm in December <strong>2011</strong> to<br />
download, maintain and verify the data. To date<br />
there have been no repeat incidents with 100%<br />
capture rate.<br />
The blast results for each of the four monitors are<br />
illustrated in Figure 3.20 and are provided in<br />
Appendix 2E.<br />
There was only one blast at WCPL during the<br />
reporting period recording levels above 115 dB(L) at<br />
blast monitors located at various sensitive<br />
receptors. On the 13/10/<strong>2011</strong> BM05 recorded an<br />
overpressure of 118.5dB(L), however WCPL was<br />
able to meet the 5% of total blasts exceeding 115<br />
dB(L), with the total of 1% of blasts not achieving<br />
the 115 dB(L) criteria.<br />
No blasts exceeded the 120 dB(L) limit during the<br />
reporting period.<br />
EPL 529 permits WCPL a maximum ground<br />
vibration of 10 mm/second and requires that less<br />
Page 66
<strong>2011</strong>-<strong>2012</strong> <strong>AEMR</strong><br />
WCPL’s development consent specifies that blasts<br />
within 2 km of the <strong>Wambo</strong> Homestead need to be<br />
monitored.<br />
monitor). The highest recorded vibration result at<br />
BM01 was 4.07mm on the 16/12/<strong>2011</strong>.<br />
Any recorded overpressures at the <strong>Wambo</strong><br />
Homestead blast monitor, that exceed the EPL<br />
blasting criteria of 115dB and 120dB are not<br />
considered a non-compliance because the property<br />
is owned by the mine.<br />
There were no vibration results greater than 5<br />
mm/second at any of the monitoring sites during the<br />
reporting period (except results from the Homestead<br />
125<br />
<strong>2011</strong>-<strong>2012</strong> <strong>AEMR</strong> Blast Results for WCPL<br />
5.0<br />
100<br />
4.0<br />
Overpressure Result (dB(L))<br />
75<br />
50<br />
25<br />
3.0<br />
2.0<br />
1.0<br />
Vibration (mm/s)<br />
0<br />
08/07/11<br />
15/07/11<br />
22/07/11<br />
29/07/11<br />
05/08/11<br />
12/08/11<br />
19/08/11<br />
26/08/11<br />
02/09/11<br />
09/09/11<br />
16/09/11<br />
23/09/11<br />
30/09/11<br />
07/10/11<br />
14/10/11<br />
21/10/11<br />
28/10/11<br />
04/11/11<br />
11/11/11<br />
18/11/11<br />
25/11/11<br />
02/12/11<br />
09/12/11<br />
16/12/11<br />
23/12/11<br />
30/12/11<br />
06/01/12<br />
13/01/12<br />
20/01/12<br />
27/01/12<br />
03/02/12<br />
10/02/12<br />
17/02/12<br />
24/02/12<br />
02/03/12<br />
09/03/12<br />
16/03/12<br />
23/03/12<br />
30/03/12<br />
06/04/12<br />
13/04/12<br />
20/04/12<br />
27/04/12<br />
04/05/12<br />
11/05/12<br />
18/05/12<br />
25/05/12<br />
01/06/12<br />
08/06/12<br />
15/06/12<br />
22/06/12<br />
29/06/12<br />
0.0<br />
Overpressure Limit Homestead Overpressure Kelly Overpressure Harris Overpressure Muller Overpressure<br />
Kelly Vibration Vibration Limit Homestead Vibration Harris Vibration Muller Vibration<br />
Date<br />
Figure 3.20 – <strong>2011</strong>-<strong>2012</strong> Blast Monitoring Results<br />
Page 67
<strong>2011</strong>-<strong>2012</strong> <strong>AEMR</strong><br />
3.10.2.2 <strong>Wambo</strong> Rail Development Vibration<br />
Monitoring<br />
Construction of the <strong>Wambo</strong> <strong>Coal</strong> Terminal (WCT)<br />
commenced in May 2005 and has been operational<br />
since June 2006. Quarterly vibration monitoring was<br />
undertaken between 2005 and 2008 for the WRD in<br />
accordance with DA 177-8-2004, Schedule 4,<br />
Condition 12, and the approved <strong>Wambo</strong> Rail<br />
Development Vibration Monitoring Program.<br />
Monitoring results from 2005 to 2008 concluded that<br />
WRD has not increased vibration levels in the<br />
Warkworth area. In the previous reporting period<br />
(2008/2009), WCPL engaged a vibration consultant<br />
to complete a summary of all of the vibration<br />
monitoring results since the construction of the<br />
WCT. The summary report was sent to the DoP to<br />
seek approval to discontinue monitoring and<br />
approval was granted in December 2008.<br />
3.11 Operational Noise<br />
3.11.1 Environmental Management<br />
Noise monitoring is undertaken in accordance with<br />
WCPL’s approved Noise Monitoring Program<br />
(NMP).<br />
A number of proactive management measures<br />
designed to minimise noise generation from<br />
operations at WCPL and the WRD have been<br />
implemented over the reporting period including:<br />
<br />
Regular maintenance of plant and equipment<br />
and pre-start up inspections;<br />
The applicant shall ensure noise emissions from the<br />
operation of the JPRL when measured at any<br />
residence along the railway line corridor shall not<br />
exceed the following EPA criteria<br />
a) Planning level of L Aeq24hr 55dB(A); and<br />
b) Maximum pass-by level of L Amax 85dB(A).<br />
Real Time Noise Monitoring<br />
Four real-time monitoring locations have been<br />
established at representative locations to the south<br />
and north-west of WCPL.<br />
The noise environment surrounding WCPL is<br />
monitored using four fixed remote continuous noise<br />
monitors. The monitors are installed on properties<br />
identified in the WCPL’s NMP, including Kelly (N03),<br />
Muller (N16), Thelander (N20) and the WCPL<br />
owned WA (N21).<br />
Attended Noise monitoring<br />
Attended environmental noise monitoring was<br />
undertaken on a quarterly basis at five sites during<br />
Quarters (3) and (4) <strong>2011</strong> and Quarters (1) and (2)<br />
<strong>2012</strong> around the mine. The survey purpose is to<br />
quantify and describe the existing acoustic<br />
environment around WCPL and WRD and compare<br />
results with relevant development consent<br />
conditions or modelled EIS noise levels. Noise<br />
levels from WCPL complied with the development<br />
consent criteria or modelled noise levels at all sites<br />
during the <strong>2011</strong>/<strong>2012</strong> attended monitoring (see<br />
Figure 3.1).<br />
Positioning of portable generators and<br />
machinery to take advantage of natural and<br />
man made barriers to mitigate sound travel;<br />
<br />
Equipment is turned off or throttled down when<br />
not in use;<br />
Construction of noise and visual bunds<br />
surrounding the operational activities; and<br />
<br />
Minimal disturbance of vegetation between the<br />
site and nearby residences to provide a screen<br />
to mitigate sound dispersal.<br />
The noise monitoring criteria for the mine and WRD<br />
are presented in Table 3.3. The noise criteria only<br />
apply to noise generated from WCPL’s mining<br />
operations, rail loop and rail loading operations.<br />
In addition to these noise criteria the <strong>Wambo</strong> rail<br />
line also has rail pass-by criteria as set out in<br />
consent DA 235/97 from SSC. These criteria are<br />
listed in consent Condition 8 DA 235/97 and are as<br />
follows:<br />
Page 68
<strong>2011</strong>-<strong>2012</strong> <strong>AEMR</strong><br />
Day<br />
L Aeq(15 minute)<br />
Table 3.3 – Noise Criteria for WCPL from November 2005<br />
Evening/Night<br />
L Aeq(15 minute)<br />
Night<br />
L A1(1 minute)<br />
35 41 50 94 – Curlewis<br />
35 40 50<br />
35 39 50<br />
35 38 50<br />
3 – Birrell<br />
4B – Circosta<br />
15B - McGowen/Caslick<br />
16 – Cooper<br />
23C – Kannar<br />
25 – Fenwick<br />
28A & B – Garland<br />
33 -Thelander/O'Neill<br />
39 – Northcote<br />
40 – Muller<br />
254A – Algie<br />
5 – Strachan<br />
6 - Merrick<br />
7 - Maizey<br />
37 - Lawry<br />
48 - Ponder<br />
1 - Brosi<br />
17 - Carter<br />
18 - Denney<br />
38 - Williams<br />
49 - Oliver<br />
63 - Abrocuff<br />
75 - Barnes<br />
91 - Bailey<br />
35 37 50 27 - Birralee<br />
43 - Carmody<br />
137 - Woodruff<br />
163 - Rodger/Williams<br />
246 - Bailey<br />
35 36 50 13B - Skinner<br />
178 - Smith<br />
188 - Fuller<br />
262A, B & C - Moses<br />
Land Number<br />
35 35 50 All other residential or sensitive receptors, excluding<br />
the receptors listed in condition 1 above<br />
Notes:<br />
a) Noise from the development is to be measured at the most affected point or within the residential boundary, or at the<br />
most affected point within 30 metres of a dwelling (rural situations) where the dwelling is more than 30 metres from<br />
the boundary, to determine compliance with the LAeq(15 minute) noise limits in the above table. Where it can be<br />
demonstrated that direct measurement of noise from the development is impractical, the DEC may accept alternative<br />
means of determining compliance (see Chapter 11 of the NSW Industrial Noise Policy). The modification factors in<br />
Section 4 of the NSW Industrial Noise Policy shall also be applied to the measured noise levels where applicable.<br />
b) Noise from the development is to be measured at 1 metre from the dwelling façade to determine compliance with the<br />
L A1(1 minute) noise limits in the above table.<br />
c) The noise emission limits identified in the above table apply under meteorological conditions of:<br />
Wind speeds of up to 3 m/s at 10 metres above ground level; or<br />
Temperature inversion conditions of up to 3ºC/100m, and wind speeds of up to 2 m/s at 10 metres above<br />
ground level.<br />
Page 69
<strong>2011</strong>-<strong>2012</strong> <strong>AEMR</strong><br />
3.11.2 Environmental Performance<br />
Real Time Noise Monitoring<br />
WCPL compile quarterly reports on monitoring data<br />
from four fixed SentineX continuous noise<br />
monitoring systems adjacent to WCPL. Below is a<br />
summary of the quarterly reports for real time noise<br />
monitoring during the reporting period.<br />
Q1- July to September <strong>2011</strong><br />
Assessment of noise impacts for the July to<br />
September, <strong>2011</strong>, monitoring period indicates that<br />
WCM complied with the noise level criteria<br />
prescribed in the <strong>Wambo</strong> <strong>Coal</strong> NMP. Review of the<br />
L A1,1minute results indicates that animal noise, road<br />
noise and meteorological influences dominate the<br />
LA1 noise environment adjacent to the WCM.<br />
Mining noise was encountered during audio review<br />
at the N21 (WA) and N16 (Muller) site locations.<br />
However, this was considered to represent only the<br />
background contribution to measured noise levels<br />
rather than the transient or peak events associated<br />
with potential for sleep disturbance. It should be<br />
noted that the N16 (Muller) monitoring location is<br />
subject to cumulative mining noise impacts, and as<br />
the source of mine noise contributions could not be<br />
confirmed, exceedences could not be attributed to<br />
the WCM.<br />
Where mining noise impacts were observed,<br />
uncertainty exists in the validity of the monitoring<br />
data. While EPL 529 excludes data influenced by<br />
strong temperature inversions (lapse rates of<br />
3 C/100m and wind speeds up to 2 m/s), the<br />
methods available to assess atmospheric stability<br />
(sigma-theta method) provide conflicting evaluation<br />
as to the validity of the noise monitoring data.<br />
Pasquill Gifford (P-G) ‘F’ class stability was<br />
commonly observed during the monitoring period,<br />
denoting temperature lapse rates of between +1.5<br />
and +4.0 deg/C per 100m. It stands to reason that<br />
portions of the dataset monitored under ‘F’ class<br />
stability conditions would be subject to lapse rates in<br />
excess of 3.0 deg/C per 100m; however, in the<br />
absence of available methods or data, the<br />
frequency of this scenario could not be determined.<br />
Consequently, all noise monitoring results observed<br />
under ‘F’ class conditions were retained in the<br />
analysis.<br />
October to December, <strong>2011</strong><br />
Assessment of continuous noise monitoring data<br />
indicated that the WCM complied with the<br />
L AeqLF,15minute noise level criteria for more than 88%<br />
of time at the N21 (WA) monitoring location and<br />
98% of the time at the N20 (Thelander) monitoring<br />
location. Following a conservative detailed analysis<br />
of the N16 (Muller) monitoring data, it was found<br />
that L AeqLF,15minute noise levels attributable to WCM<br />
operations exceeded the 40dB(A) criteria<br />
approximately 22% of the monitoring period. The<br />
measured exceedence rate attributable to all<br />
environmental noise sources at this location was<br />
approximately 48%.<br />
Mine noise was audible at both the N21 (WA) and<br />
N16 (Muller) sites; however, it was found to<br />
comprise the background noise contribution for a<br />
majority of these events. Meteorological influences<br />
were also observed to contribute to measured noise<br />
levels at these locations, and the passage of<br />
vehicles on the Golden Highway was the dominant<br />
noise impact at the N16 (Muller) monitoring location.<br />
January to March, <strong>2012</strong><br />
Measured noise levels were found to comply with<br />
the L Aeq,15minute criteria more than 90% of the time at<br />
the N21 (WA) monitoring location and 94% of the<br />
time at the N20 (Thelander) monitoring location.<br />
These results are consistent with those obtained in<br />
the previous (October to December (<strong>2011</strong>)) period.<br />
Analysis of monitoring results, including WCM<br />
meteorological station data, demonstrates that lower<br />
rates of night time temperature inversions were<br />
observed as compared to the winter months. This<br />
indicates that the WCM site may be less affected by<br />
enhanced noise propagation associated with<br />
temperature inversions in the summer months,<br />
resulting in a higher rate of compliance with the<br />
performance criteria.<br />
Results of L Aeq,15minute audio review indicate that<br />
mining noise impacts were present during the<br />
January to March (<strong>2012</strong>) period; however,<br />
environmental sources (including insects, livestock,<br />
road noise and meteorological impacts) were found<br />
to dominate the night time noise environment.<br />
April to June, <strong>2012</strong><br />
Assessment of continuous noise monitoring data<br />
indicated that the WCM complied with the<br />
L AeqLF,15minute noise level criteria for more than 83%<br />
of time at the N21 (WA) monitoring location and<br />
92% of the time at the N20 (Thelander) monitoring<br />
location. Moderate (F class) and strong (G class)<br />
temperature inversions (conditions under which<br />
enhanced noise propagation may occur) were found<br />
to be present for 36% of the night time monitoring<br />
period from April to June. These inversion events<br />
typically generate meteorological conditions under<br />
which enhanced noise propagation may occur.<br />
Comparison of the measured L AeqLF,15minute noise<br />
level result distributions indicates that noise levels<br />
above the relevant criteria may be observed with<br />
higher frequency during the winter months.<br />
Audio review suggested that mine noise was<br />
present at both the N21 (WA) and N16 (Muller)<br />
sites; however, environmental noise sources<br />
(including road noise, insects and meteorological<br />
impacts) were found to dominate the night time<br />
noise environment. The passage of vehicles on the<br />
Golden Highway was the dominant noise impact at<br />
the N16 (Muller) monitoring location. Mining noise<br />
was not observed to contribute to measured Sleep<br />
Page 70
<strong>2011</strong>-<strong>2012</strong> <strong>AEMR</strong><br />
Disturbance (L A1,1minute) noise levels above the<br />
criteria at any monitoring location during this period.<br />
For the complete quarterly reports of real time noise<br />
monitoring at WCPL for the reporting period, please<br />
refer to Appendix 2F.<br />
Attended Noise Monitoring<br />
Q3 <strong>2011</strong> Attended Noise Monitoring<br />
Environmental noise monitoring was undertaken on<br />
4 October <strong>2011</strong> for the day measurements, and<br />
26/27 September <strong>2011</strong> for the night measurements.<br />
During day monitoring, WCPL was audible at all five<br />
locations. During night monitoring, WCPL was<br />
inaudible at two locations. Of the remaining<br />
locations where WCPL was audible, there were no<br />
exceedances of the LAeq(15 minute) or LA1(1<br />
minute) criteria. Noise levels from WCRS complied<br />
with the LAeq(15 minute) and LA1(1 minute)<br />
development consent criteria or modelled noise<br />
levels at all remaining monitoring locations during<br />
the Quarter 3 <strong>2011</strong> survey. It is noted that wind<br />
speeds and/or temperature inversion conditions<br />
were at levels greater than which development<br />
consent conditions would apply for WCPL and rail<br />
activities in some instances. In all instances, the<br />
predicted EIS noise levels were met regardless.<br />
Q4 <strong>2011</strong> Attended Noise Monitoring<br />
Environmental noise monitoring was undertaken on<br />
15 November and 22 December <strong>2011</strong> for the day<br />
measurements, and 14/15 December <strong>2011</strong> for the<br />
night measurements. During day monitoring, WCPL<br />
was audible at all five locations. During night<br />
monitoring, WCPL was inaudible at three locations.<br />
Of the remaining locations WCPL was audible, there<br />
were no exceedances of the LAeq(15 minute) or<br />
LA1(1 minute) criteria. Noise levels from rail<br />
activities complied with the LAeq(15 minute) and<br />
LA1(1 minute) development consent criteria or<br />
modelled noise levels at all remaining monitoring<br />
locations during the Quarter 4 <strong>2011</strong> survey. It is<br />
noted that wind speeds and/or temperature<br />
inversion conditions were at levels greater than<br />
which development consent conditions would apply<br />
for WCPL and rail activities in some instances. In all<br />
instances, the predicted EIS noise levels were met<br />
regardless.<br />
Q1 <strong>2012</strong> Attended Noise Monitoring<br />
Environmental noise monitoring was undertaken on<br />
28 February and11 March <strong>2012</strong> for the night<br />
measurements, and 21 March and 3 April <strong>2012</strong> for<br />
the day measurements. During day monitoring,<br />
WCPL was inaudible at three locations. During night<br />
monitoring, WCPL was inaudible at two locations.<br />
Of the remaining locations where WCM was<br />
audible, there were no exceedances of the LAeq(15<br />
minute) or LA1(1 minute) criteria. Noise levels from<br />
WCRS complied with the LAeq(15 minute) and<br />
LA1(1 minute) development consent criteria or<br />
modelled noise levels at all remaining monitoring<br />
locations during the Quarter 1 <strong>2012</strong> survey. It is<br />
noted that wind speeds and/or temperature<br />
inversion conditions were at levels greater than<br />
which development consent conditions would apply<br />
for WCPL and rail activities in some instances. In all<br />
instances, the predicted EIS noise levels were met<br />
regardless.<br />
Q2 <strong>2012</strong> Attended Noise Monitoring<br />
Environmental noise monitoring described in this<br />
report was undertaken on 26/27 June <strong>2012</strong> for the<br />
night measurements, and 8 May, 29 June and 23<br />
July <strong>2012</strong> for the day measurements. During day<br />
monitoring, WCPL was inaudible at four locations.<br />
During night monitoring, WCPL was inaudible at two<br />
locations. Of the remaining locations where WCPL<br />
was audible, there were no exceedances of the<br />
LAeq(15 minute) or LA1(1 minute) criteria. Noise<br />
levels from rail activies complied with the LAeq(15<br />
minute) and LA1(1 minute) development consent<br />
criteria or modelled noise levels at all remaining<br />
monitoring locations during the Quarter 2 <strong>2012</strong><br />
survey. It is noted that wind speeds and/or<br />
temperature inversion conditions were at levels<br />
greater than which development consent conditions<br />
would apply for WCPL and rail activities in some<br />
instances. In all instances, the predicted EIS noise<br />
levels were met regardless.<br />
For the complete annual report of attended noise<br />
monitoring at WCPL for the reporting period, please<br />
refer to Appendix 2F.<br />
3.12 Visual Stray Light<br />
To minimise lighting impacts on WCPL’s neighbours<br />
there is a plan depicting all the neighbours on<br />
display in the Open Cut Examiners (OCE) office to<br />
reference for lighting plant positioning.<br />
All mobile lighting plants are strategically positioned<br />
to avoid light being directed towards our neighbours<br />
and specific lighting fixtures associated with the<br />
product stockpile area were adjusted in response to<br />
previous community complaints.<br />
3.12.1.1 Environmental Performance<br />
In accordance with Consent Condition 86, Schedule<br />
4 of DA305-2033, WCPL completed an assessment<br />
of all external lighting associated with the mine to<br />
Page 71
<strong>2011</strong>-<strong>2012</strong> <strong>AEMR</strong><br />
Australian Standard AS4282 (INT) 1995 – Control of<br />
Obtrusive Effects of Outdoor Lighting. The<br />
independent audit completed in June <strong>2011</strong><br />
concluded WCPL lighting did meet the requirements<br />
of AS4282.<br />
During this reporting period there were no<br />
community complaints in relation to lighting,<br />
compared to five complaints reported to WCPL in<br />
the previous <strong>AEMR</strong> reporting period. The reduction<br />
in complaints is largely due to change in procedures<br />
implemented by WCPL and completion of mining<br />
activities in the vicinity of the Rug Dump.<br />
3.13 Cultural and Natural<br />
Heritage Conservation<br />
3.13.1 Aboriginal Heritage<br />
3.13.1.1 Environmental Management<br />
Archaeology and Cultural Heritage is managed in<br />
accordance with the National Parks and Wildlife Act<br />
1974 (NPW Act), the Aboriginal Cultural Heritage<br />
Consultation Requirements for Proponents 2010<br />
(ACHCRs) and the Environmental Planning and<br />
Assessment Act 1979 (EP&A Act). The NPW Act<br />
provides protection for Aboriginal objects or places,<br />
while the EP&A Act ensures that Aboriginal cultural<br />
heritage is properly assessed in land use planning<br />
and development. The NPW Act provides statutory<br />
protection for all Aboriginal heritage, places and<br />
objects with penalties levied for breaches of the Act.<br />
This legislation is overseen by the Office of<br />
Environment and Heritage (OEH). Part 6 of this Act<br />
is the relevant part concerned with Aboriginal<br />
objects and places, with Section 86, 87, 89A and<br />
Section 90 being the most pertinent.<br />
The Aboriginal Cultural Heritage Consultation<br />
Requirements for Proponents (ACHCR’s) were<br />
issued by OEH on 12th April 2010. These<br />
consultation requirements generally replace the<br />
previously issued Interim Community Consultation<br />
Requirements (ICCR) for Applicants (DEC 2004).<br />
The ACHCR guidelines apply to all AHIP<br />
applications prepared after 12th April 2010. For<br />
projects commenced before the 12th April 2010,<br />
Section 1 (Q1) of the transitional arrangements<br />
indicates that if Aboriginal consultation was<br />
commenced prior to the 12th April 2010 (including<br />
advertising and notification of stakeholders), then<br />
consultation is to be continued under the previous<br />
ICCR guidelines.<br />
Aboriginal heritage sites within the WCPL mining<br />
leases were identified and assessed during the<br />
2003 EIS. The location of sites is shown on Figure<br />
3.21.<br />
The WCPL Surface Disturbance Permit (SDP)<br />
process requires the location of the proposed<br />
disturbance to be checked, to ensure that an<br />
archaeological and heritage assessment has been<br />
conducted and that any Aboriginal artefacts or<br />
objects likely to be impacted upon have been<br />
salvaged in accordance with the relevant permits<br />
issued under the NPW Act, or are protected from<br />
disturbance.<br />
OEH released a publication entitled Due Diligence<br />
Code of Practice for the Protection of Aboriginal<br />
Objects in New South Wales on 24th September<br />
2010. This Code of Practice was developed with the<br />
express intention of satisfying the due diligence<br />
requirement contained within s87(2) of the NPW Act<br />
1974. In September 2010, the NSW Minerals<br />
Council released a publication entitled NSW<br />
Minerals Industry Due Diligence Code of Practice<br />
for the Protection of Aboriginal Objects which is a<br />
recognised industry specific code of practice. Due<br />
diligence inspection relates to the physical<br />
identification of Aboriginal objects. Community<br />
consultation is only required once Aboriginal objects<br />
have been detected and if an Aboriginal Heritage<br />
Impact Permit (AHIP) is deemed necessary. The<br />
OEH due diligence requirements are described as<br />
the minimum standard of care required, however, it<br />
is noted within that Code of Practice that any<br />
industry-specific due diligence procedures of a<br />
higher standard should be followed instead.<br />
3.13.1.2 Environmental Performance<br />
A Section 87/ 90 Permit (#2222) (now known as an<br />
Aboriginal Heritage Impact Permit) was issued to<br />
WCPL by the DEC (later DECCW and now OEH)<br />
under the NPW Act on 20 June 2005. In<br />
consultation with the DECCW and local Aboriginal<br />
groups, the DECCW granted approval to extend the<br />
permit for an additional 5 years, expiring on the 19<br />
June 2015.<br />
Ongoing artefact analysis works associated with the<br />
salvage programme were conducted during the<br />
reporting period in accordance with the<br />
requirements under Permit #2222. The salvage<br />
programme targeted sites in the approved Open Cut<br />
disturbance area.<br />
The arrangements for the salvage operation<br />
followed the Interim Community Consultation<br />
Guidelines (ICCG) issued by the DEC in 2004. All<br />
respondents to the ICCG process attended a site<br />
induction at WCPL on 12 February 2009. The<br />
members of the Wonnarua Aboriginal Community<br />
Page 72
<strong>2011</strong>-<strong>2012</strong> <strong>AEMR</strong><br />
Stakeholders (WACS) undertook the salvage and<br />
excavation works under the guidance of an<br />
archaeologist.<br />
Temporary Keeping Place<br />
The WACS, WCPL and the Archaeologist from RPS<br />
HSO met at WCPL in February 2009 and agreed on<br />
a Temporary Keeping Place that was subsequently<br />
approved by the DECCW on 14 July 2009. All<br />
artifacts salvaged during the operation are stored at<br />
the Temporary Keeping Place under Permit #3130<br />
for Care and Control of Aboriginal Objects Salvaged<br />
under Section 87/ 90 permits #2085 and #2222 in<br />
accordance with the NPW Act (1974 as amended).<br />
During August <strong>2011</strong>, a staged salvage programme<br />
was undertaken in accordance with the<br />
requirements under Permit #2222. The salvage<br />
programme targeted sites to the south west of North<br />
<strong>Wambo</strong> Creek within the S87-S90 Application Area<br />
and in the northern portion of the approved Open<br />
Cut disturbance area.<br />
3.13.1.3 Aboriginal Cultural Heritage<br />
Conservation Agreement – Remnant<br />
Woodland Enhancement Area (A)<br />
During the previous 2010 reporting period WCPL<br />
engaged an Archaeologist to establish an Aboriginal<br />
Cultural Heritage Conservation Agreement for<br />
RWEP Area A. The preparation of this document<br />
involved consultation with local Aboriginal Groups<br />
and the OEH and was developed in accordance<br />
with DA305-7-2003, Schedule 4, Consent Condition<br />
51. The agreement establishes protocols for<br />
maintaining the cultural significance within RWEP<br />
Area A.<br />
Page 73
WARNING<br />
No part of this plan should be used<br />
for critical design dimensions.<br />
Confirmation of critical positions<br />
should be obtained from RPS Newcastle.<br />
Legend<br />
Colliery Holding Boundary<br />
Approved Open Cut Limit<br />
<strong>Wambo</strong> <strong>Coal</strong> Owned Land<br />
Partially Savaged Sites Permit 2222<br />
Extant Sites Permit 2222<br />
Additional <strong>Wambo</strong> Recorded Sites<br />
United Colliery Recorded Sites<br />
Rio Tinto Recorded Sites<br />
Extant Sites No Permit<br />
Salvaged Sites<br />
Copyright<br />
"This document and the information shown shall remain the property of<br />
RPS Australia East Pty Ltd. The document may only be used for the purpose<br />
for which it was supplied and in accordance with the terms of engagement for<br />
the commission. Unauthorised use of this document in any way is prohibited."<br />
TITLE: FIGURE 3.21: HERITAGE SITES LOCATION: WAMBO<br />
DATUM: (GDA 94)<br />
<strong>2011</strong> - <strong>2012</strong> <strong>AEMR</strong><br />
MGA ZONE 56<br />
PROJECTION:<br />
DATE:<br />
PURPOSE:<br />
9/08/<strong>2012</strong><br />
HERITAGE<br />
LAYOUT REF:<br />
J:\JOBS\<strong>Wambo</strong>\<strong>Wambo</strong> Mapping Database<br />
\Arch a e o l o gy\Arch Sites Extinct & Extant<br />
VERSION (PLAN BY): D A4 (GG-NW)<br />
CLIENT:<br />
JOB REF:<br />
WAMBO COAL<br />
103318-1<br />
RPS AUSTRALIA EAST PTY LTD (ABN 44 140 292 762)<br />
241 DENISON STREET BROADMEADOW PO BOX 428 HAMILTON NSW 2303<br />
T: 02 4940 4200 F: 02 4961 6794 www.rpsgroup.com.au
<strong>2011</strong>-<strong>2012</strong> <strong>AEMR</strong><br />
3.13.2 European Heritage<br />
3.13.2.1 Environmental Management<br />
On the 16 December <strong>2011</strong> the annual inspection of<br />
the <strong>Wambo</strong> Homestead Complex (WHC) was<br />
undertaken by a structural engineer. The objective<br />
of the assessment was to determine if any damage<br />
to the <strong>Wambo</strong> Homestead buildings was attributed<br />
to ground vibration. In the opinion of the structural<br />
engineer, ‘...the <strong>Wambo</strong> Homestead buildings are<br />
not vulnerable to normal blasting, but that elements<br />
of individual buildings are subject to damage when<br />
large blasts result in ground wave frequencies which<br />
are similar to characteristic frequencies of those<br />
building elements. The only damage possibly<br />
caused by blast vibrations in the period was that<br />
which happened in April <strong>2011</strong>. Again, damage was<br />
only of a cosmetic character, did not affect the<br />
structural integrity of the buildings, and could be<br />
readily repaired with normal maintenance.’<br />
The annual archival photographic record of the<br />
WHC was undertaken in November <strong>2011</strong>. Copies<br />
of the Archival Photographic Record November<br />
<strong>2011</strong> were sent to NSW Heritage Office, DP&I and<br />
SSC in March <strong>2012</strong>.<br />
In accordance with the 2006 Conservation<br />
Management Plan for the WHC, routine pest<br />
inspections and baiting programs for termites and<br />
rodents continued.<br />
During the reporting period, Godden Mackay Logan<br />
Pty Ltd (GML) was commissioned by WCPL to<br />
review and update the 2006 CMP for the <strong>Wambo</strong><br />
Homestead. The review of the CMP was necessary<br />
as part of planning by WCPL for the ongoing<br />
conservation and management of the <strong>Wambo</strong><br />
Homestead Complex and to meet the requirements<br />
of the relevant statutory authorities.<br />
The focus of the CMP review was to provide<br />
appropriate conservation policies for managing the<br />
significant heritage components and values of the<br />
<strong>Wambo</strong> Homestead. The review examined the<br />
current conditions and future management options<br />
to identify the relevant opportunities and constraints.<br />
The condition and integrity of the <strong>Wambo</strong><br />
Homestead was also re-examined and reviewed<br />
recording the changes due to both the passage of<br />
time and the recent programmes of maintenance,<br />
stabilisation and repair works.<br />
Voluntary Action Plan<br />
On 02 December 2010, representatives of WCPL,<br />
DP&I and the Heritage Branch conducted an<br />
inspection of the <strong>Wambo</strong> Homestead (WH), to<br />
determine compliance with Condition 59 of the<br />
<strong>Wambo</strong> Development Consent (DA 305-7-2003).<br />
During the inspection it was identified that, although<br />
WCPL had completed maintenance activities<br />
including yard maintenance, installation of a fire<br />
suppression system and other maintenance<br />
activities listed in the 2006 Conservation<br />
Management Plan (CMP), it was also identified that<br />
some additional works would improve WH<br />
conservation.<br />
As a result WCPL, committed to a Voluntary Action<br />
Plan (VAP) to work with the Heritage Council to gain<br />
approval for the proposed VAP works. Completion<br />
of these works would ensure continued<br />
maintenance of the WH in accordance with<br />
Condition 59.<br />
The maintenance tasks and activities committed to<br />
in the VAP were identified during the inspection.<br />
The tasks/activities were divided into two tiers:<br />
<br />
<br />
Tier 1: Those tasks that can be completed<br />
without further assessment or approval; and<br />
Tier 2: Those tasks that will require approval<br />
from the Heritage Branch and/or further<br />
assessment and planning by a suitably qualified<br />
architectural/heritage consultant prior to<br />
commencement.<br />
The following photos display some of the tasks and<br />
activities completed as part of <strong>Wambo</strong> Voluntary<br />
Action Plan regarding the maintenance works at the<br />
<strong>Wambo</strong> Homestead Complex.<br />
Main Homestead stabilisation and stormwater<br />
control<br />
Page 75
<strong>2011</strong>-<strong>2012</strong> <strong>AEMR</strong><br />
only on ppv, WCPL engaged a specialist engineer<br />
(Bill Jordan & Associates) to investigate whether<br />
blast ground wave frequency, as well as ppv, is a<br />
more accurate indicator of potential vibration<br />
impacts. It has been previously been shown that<br />
movement of the building or its parts can be greatly<br />
amplified compared with the blast wave if resonant<br />
frequencies are excited in the building.<br />
Butchers Hut stabilisation<br />
The results of this study will allow a better<br />
appreciation of the risks posed to the <strong>Wambo</strong><br />
Homestead buildings from blast ground vibration,<br />
and lead to more accurate setting of blast limits, and<br />
blast design, which will take the resulting<br />
frequencies into account.<br />
As discussed in the last <strong>AEMR</strong>, a blast vibration<br />
vulnerability study was completed during the<br />
reporting period for the <strong>Wambo</strong> Homestead. For a<br />
copy of the report please refer to Appendix 2E.<br />
3.14 Spontaneous Combustion<br />
3.14.1 Underground<br />
Main Homestead stabilisation and stormwater<br />
control<br />
There were no spontaneous combustion incidents at<br />
the Underground during the reporting period.<br />
Inspections for spontaneous combustion form part<br />
of the Underground inspection system. WCPL will<br />
continue to monitor for signs of spontaneous<br />
combustion in the next reporting period.<br />
The Underground mine atmosphere is monitored<br />
continuously in the main fan return. Monitoring<br />
results and trends are displayed in the control room.<br />
Any abnormal readings trigger an audible and visual<br />
alarm. All monitoring equipment is tested and<br />
calibrated regularly.<br />
3.14.2 Open Cut<br />
Carriage House & Stables stabilisation and<br />
weather control<br />
Blast Vibration Study<br />
<strong>Wambo</strong> currently monitors and reports on open cut<br />
blasting ground vibration, and potential impacts on<br />
the WHC. Ground vibration is currently monitored<br />
and assessed based on peak particle velocity (ppv),<br />
measured in mm per second.<br />
In response to concerns expressed about the<br />
accuracy of assessing blast vibration impacts based<br />
As reported in previous <strong>AEMR</strong>’s, spontaneous<br />
combustion (spon comb activity within the Open Cut<br />
operations is limited to one location. The spon comb<br />
is located on the north western side of the Hunter<br />
Pit. This incident is considered minor and is being<br />
monitored by WCPL operations. Inspections for<br />
spontaneous combustion form part of the Open Cut<br />
inspection program.<br />
3.14.3 CHPP<br />
There were no spontaneous combustion incidents at<br />
the CHPP during the reporting period. Inspections<br />
for spontaneous combustion form part of the CHPP<br />
inspection program.<br />
Page 76
<strong>2011</strong>-<strong>2012</strong> <strong>AEMR</strong><br />
3.15 Bushfire Management<br />
3.15.1 Environmental Management<br />
The Bushfire Management Plan (BFMP) was<br />
originally approved by the NSW Rural Fire Service<br />
(NSWRFS) and SSC in 2005. This plan<br />
incorporates both an identification of likely bushfire<br />
hazards on the site, and an assessment of the risks<br />
those hazards represent. Based on the hazard level<br />
and the associated risk level, fire management<br />
strategies for the site have been formulated.<br />
In February 2008, the BMP was reviewed in<br />
consultation with the NSWRFS and subsequently<br />
approved on 1 July 2008. The revised BMP was<br />
sent to the SSC in accordance with Consent<br />
Condition 93, Schedule 4 of DA305-7-2003.<br />
In December 2010, the NSWRFS completed an<br />
assessment of various grassland and bushland<br />
areas within WCPL’s landholdings regarding<br />
bushfire hazards. WCPL are currently reviewing the<br />
BMP.<br />
3.15.2 Environmental Performance<br />
The bushfire trails around the WCPL boundary were<br />
periodically inspected during the reporting period.<br />
Sections of WCPL internal bush tracks that form<br />
part of the Fire Trail running along the western<br />
boundary of the Wollemi National Park were<br />
maintained for vehicular access. Existing signage<br />
on several main access gates were replaced during<br />
the previous reporting period, detailing land<br />
ownership and emergency contact numbers in case<br />
of fire outbreak. Vegetation under and around power<br />
line easements were maintained in accordance with<br />
BMP during the reporting period.<br />
There were no bushfires or incidents of fire within<br />
WCPL owned land during the reporting period.<br />
3.16 Mine Subsidence<br />
WCPL’s Underground operates under an approved<br />
Subsidence Management Plan (SMP). This SMP<br />
covers underground mining activities for the next<br />
seven years for Longwall Panels 1 through to 6 (LW<br />
1-6), and includes an assessment of environmental<br />
impacts associated with subsidence.<br />
The first of eight longwall blocks (LW1) was<br />
completed in February 2009 and production<br />
commenced in the second longwall block (LW2) in<br />
March 2009. In December 2010, extraction of<br />
Longwall Panel 3 (LW3) was completed, with<br />
production of Longwall Panel 4 (LW4) commencing<br />
in January <strong>2011</strong>. During November <strong>2011</strong> LW4 was<br />
completed. Extraction of Longwall Panel 5 (LW5)<br />
commenced during December <strong>2011</strong>. At the end of<br />
the reporting period LW5 had retreated<br />
approximately 2,858m. The completion of LW5 is<br />
expected during August <strong>2012</strong>. The NWU continues<br />
to operate seven days a week.<br />
The results of subsidence monitoring are reported to<br />
the DII as per the requirements in the SMP.<br />
Subsidence monitoring in the South <strong>Wambo</strong> and<br />
Stony Creek areas is further discussed in Section<br />
5.1.2 of this report. Since 2006, Baseline Riparian<br />
Vegetation and Bed Bank Stability Monitoring<br />
Programs were initiated in North <strong>Wambo</strong>, South<br />
<strong>Wambo</strong> and Stony Creeks. The Riparian Vegetation<br />
and Bed Bank Stability Monitoring Program<br />
continued in during the <strong>2011</strong>-<strong>2012</strong> reporting period.<br />
The monitoring programs are designed to obtain a<br />
greater understanding of any subsidence related<br />
impacts on the riparian environment (see Section<br />
5.1.2).<br />
3.16.1.1 Subsidence Response Strategy<br />
In accordance with the North <strong>Wambo</strong> Creek<br />
Subsidence Response Strategy, monitoring of<br />
pumping volumes from the NWU during the<br />
reporting period was undertaken. A graph of<br />
pumping volumes and rainfall during the reporting<br />
period is provided in Appendix 2D.<br />
3.17 Hydrocarbon<br />
Contamination<br />
Any soil that becomes contaminated by<br />
hydrocarbons is managed on site. All the necessary<br />
information regarding soil contamination incidents,<br />
are captured in relevant <strong>Wambo</strong> Environmental<br />
Incident Reports.<br />
As discussed in Section 3.6.1, WCPL and Downer<br />
EDI have provided a new location for the<br />
bioremediation site within the Open Cut during the<br />
last reporting period. The new facility is open to<br />
accept and treat hydrocarbon contaminated soil<br />
material during the next reporting period. In<br />
accordance with the operating procedure for the<br />
bioremediation facility, contaminated soil from<br />
WCPL operation is placed within segregated bays,<br />
where the material is treated and sampled over time<br />
until laboratory results determine the material<br />
suitable for removal and replacement back into<br />
open cut voids.<br />
Page 77
<strong>2011</strong>-<strong>2012</strong> <strong>AEMR</strong><br />
3.18 Methane Drainage/<br />
Ventilation<br />
For LW2 and the first half of LW3 operations the<br />
Underground was ventilated by both relocated<br />
Wollemi axial fans operating in parallel at<br />
approximately 190 m 3 /s at 2,000 Pascals. Methane<br />
levels at these main fans averaged 0.9 % = 1710<br />
litres / second.<br />
With the commencement of LW2 operations it was<br />
apparent that the Longwall gas make exceeded the<br />
capacity of the relocated Wollemi axial fans and<br />
work began on a project to upgrade the mine’s<br />
ventilation infrastructure. Two larger fans were<br />
purchased to replace the two Wollemi axial fans in<br />
in late 2010. The new fans have made a dramatic<br />
improvement (50%) to ventilation quantities in the<br />
Development panels and a significant increase<br />
(20%) to the Longwall district ventilation quantities.<br />
During the reporting period the NWU was ventilated<br />
by the new larger mine fans CMF03 & CMF04.<br />
Methane emissions have varied throughout the<br />
reporting period from 800l/s to 2800l/s depending on<br />
LW production and gas zone, with an average of<br />
1460l/s. The old Wollemi mine was sealed on 25 th<br />
May <strong>2012</strong>.<br />
3.18.1 Greenhouse Gas<br />
In accordance with the requirements of the National<br />
Greenhouse and <strong>Energy</strong> Reporting Act 2007<br />
(NGERS), WCPL report each year the company’s:<br />
direct greenhouse gas emissions;<br />
total energy produced; and<br />
total energy consumed.<br />
At the time of writing the <strong>AEMR</strong>, the <strong>2011</strong>-<strong>2012</strong><br />
NGERS report was not finalised. A summary of the<br />
greenhouse gas (GHG) emissions and energy<br />
consumed from the 2010-<strong>2011</strong> reporting period are<br />
provided below. A summary of the <strong>2011</strong>-<strong>2012</strong> GHG<br />
emissions will be provided in the next <strong>AEMR</strong>.<br />
2010-<strong>2011</strong><br />
Scope 1: 970,781 (t CO 2 - e)<br />
Scope 2: 36,356 (t CO 2 - e)<br />
<strong>Energy</strong> Consumed: 1,620,613 (GJ)<br />
<strong>Energy</strong> Produced: 153,369,531 (GJ)<br />
The key focus of energy efficiency management at<br />
WCPL is during the business planning phase.<br />
During project planning, consideration is given to<br />
potential energy consumption of project<br />
components, and the availability and practicality of<br />
more energy efficient alternatives.<br />
WCPL participates in the Federal Government’s<br />
energy Efficiency Opportunities (EEO) program. As<br />
part of that program, WCPL has conducted a<br />
systematic review of energy usage across the<br />
operation, and identified areas for potential energy<br />
efficiency improvement.<br />
Regular scheduled maintenance of equipment and<br />
plant is also a key component of maintaining<br />
operational energy efficiency.<br />
An enterprise-wide strategy for managing methane<br />
emissions is being developed by <strong>Peabody</strong> <strong>Energy</strong><br />
Australia.<br />
3.19 Public Safety<br />
Public safety is managed through the<br />
implementation of safety systems and daily security<br />
inspections. Fencing, signposting and locked<br />
external gates form part of the safety measure to<br />
ensure the safety of the public. A contracted<br />
security service patrols the mine site and<br />
surrounding areas. There were no incidents<br />
regarding public safety during the reporting period.<br />
3.19.1 United Colliery Activities<br />
United Collieries (United) ceased Longwall mining<br />
beneath WCPL land during this reporting period.<br />
The last of United’s coal was loaded by rail on 27<br />
May 2010. United are currently under care and<br />
maintenance program. Previously installed<br />
ventilation boreholes that were maintained by<br />
United personnel, have now been decommissioned.<br />
United are still conducting exploration and<br />
environmental monitoring activities on WCPL owned<br />
land.<br />
3.20 Reportable Environmental<br />
Incidents<br />
3.20.1 Environmental Management<br />
Environmental incidents are managed in<br />
accordance with WCPL’s Environmental Incident<br />
Response Procedure. All environmental incidents<br />
are recorded on the Environmental Incident Report<br />
Form which is required to be closed off by the<br />
Environmental Department. Incidents classifications<br />
are as follows:<br />
Minor (Category 1)<br />
Minor incidents are those that cause negligible<br />
actual impact on the environment, are readily<br />
controlled by established procedures (for example:<br />
small hydrocarbon spills in a non-sensitive<br />
environment that are able to be immediately<br />
cleaned up).<br />
Serious (Category 2)<br />
Incidents categorised as serious are those that<br />
cause localised, reversible damage to the<br />
environment, for example: hydrocarbons spills in a<br />
Page 78
<strong>2011</strong>-<strong>2012</strong> <strong>AEMR</strong><br />
non-sensitive environment and/or contained area<br />
and saline water discharge.<br />
Major (Category 3)<br />
Incidents categorised as significant are those that<br />
have actual or potential severe damage to the<br />
environment with the potential to result in<br />
environmental liability, regulatory intervention and/or<br />
significant community concern or actual damage<br />
that will require significant remediation/<br />
management.<br />
3.20.2 Environmental Performance<br />
During the reporting period WCPL recorded a total<br />
of eleven environmental incidents, of which there<br />
were eight Category 1 incidents and three Category<br />
2 incidents (Appendix 3). The Category 1 incidents<br />
included small hydrocarbon spills contained within<br />
the open cut pit, excessive dust generation, and<br />
unapproved works commencing on <strong>Wambo</strong> owned<br />
land.<br />
In accordance with WCPL’s statutory obligations,<br />
regulatory authorities were informed of four<br />
incidents in relation to dam overflow, blasting, dam<br />
seepages and elevated dust results A summary of<br />
the incidents and reports are provided below.<br />
WCPL received a Penalty Infringement Notice (PIN)<br />
on the 12 June <strong>2012</strong> as a result from a site<br />
inspection on the 4 May <strong>2012</strong> by the DP&I. The PIN<br />
was in relation to excessive wheel generated dust<br />
witnessed during the site inspection.<br />
Elevated Dust Result – 20 September <strong>2011</strong><br />
As reported to Scott Brooks via telephone on Friday<br />
23 September <strong>2011</strong>, <strong>Wambo</strong> recorded a PM10 level<br />
of 82.5ug/m 3 for the 24 hour period on 20<br />
September <strong>2011</strong> (midnight to midnight) at<br />
monitoring location PM02. The day was extremely<br />
windy, with upwind monitors (PM03 and PM04)<br />
indicating regional dust contributions of between<br />
26.4 – 27.3 ug/m 3 .<br />
A contributor to the elevated dust result was the<br />
North <strong>Wambo</strong> Creek Diversion Stage 3 (NWCD)<br />
project. The dust risk from the project was assessed<br />
on the morning of the incident and operations were<br />
halted for the day. The only exception was the water<br />
cart, which was kept on a watering circuit until late<br />
in the afternoon when wind speed had subsided.<br />
However, the strong wind gusts caused difficulties<br />
with the refilling of the water cart, increasing refill<br />
time and decreasing the ground watering capacity.<br />
See Appendix 3 for further information.<br />
South <strong>Wambo</strong> Dam Overflow 5 March <strong>2012</strong><br />
WCPL received a written request by the<br />
Environmental Protection Authority (EPA) dated 29<br />
March <strong>2012</strong>, requesting a written report on the mine<br />
water discharge event that occurred on land owned<br />
on the 5 March <strong>2012</strong>. The summary of the<br />
investigation and response to the EPA is provide<br />
below.<br />
A discharge to ground when mine water overflowed<br />
from South <strong>Wambo</strong> Dam (the dam) via the dam<br />
spillway. The discharge was first noticed on the<br />
morning of Monday 05 March <strong>2012</strong>, and was halted<br />
by 10am the same day. During a previous<br />
inspection of the dam at 2pm on Saturday 03 March<br />
<strong>2012</strong>, it was noted that the dam water level was<br />
high, but did not appear to be in any risk of<br />
overflowing. The discharge commenced at some<br />
point after the inspection on the 03 March <strong>2012</strong>,<br />
giving a maximum discharge duration of 44 hours.<br />
The dam water level was already high due to high<br />
rainfall, and operational pumping of mine water to<br />
the dam, in the month leading up to the discharge.<br />
The dam has a water level sensor, which sends an<br />
alarm when water level reaches 1m below the dam<br />
spillway level. An inspection in the last week of<br />
February noted a discrepancy between the actual<br />
dam water level and the level being reported by the<br />
water level sensor. At this time a new sensor was<br />
ordered, and pumping to the dam was halted.<br />
Despite this, heavy rain over the weekend of 03-04<br />
March caused the water level to over top the<br />
spillway.<br />
The following measures have been completed or to<br />
prevent a recurrence of the discharge incident,<br />
including a replacement probe for the dam water<br />
level sensor, increased inspection schedules for the<br />
dam has been revised to ensure weekly verification<br />
of the remotely monitored dam water level,<br />
earthworks to reinstate the spillway in accordance<br />
with the dam design, following the temporary works<br />
completed to halt the discharge and environmental<br />
training package to the workforce.<br />
Open Cut Blast 30 March <strong>2012</strong><br />
WCPL received written request on the 2 April <strong>2012</strong><br />
by the Environment Protection Authority (EPA)<br />
regarding complaints received by the EPA<br />
Environment Line on 30 March <strong>2012</strong> alleging, that<br />
around 3.35pm a large orange plume from a blast<br />
was seen moving towards homes near Jerry Plains.<br />
The complainants also alleged that there was<br />
excessive vibration/overpressure from the blast. The<br />
summary of the investigation and response to the<br />
EPA is provide below.<br />
Two overburden shots were fired in the <strong>Wambo</strong><br />
Open Cut at 15:36 (shot M16WWA2) and 15:40<br />
(shot M9WWD2) on Friday 30 March <strong>2012</strong>. The two<br />
shots on 30 March <strong>2012</strong> generated ground vibration<br />
and overpressure. The blast monitoring results for<br />
the ground vibration and overpressure from these<br />
shots, as monitored at <strong>Wambo</strong> blast monitoring<br />
sites, were well within WCPL blasting criteria.<br />
The shots generated airborne dust and visible NOx<br />
fumes. Both shots were observed and<br />
photographed by WCPL environmental staff, and<br />
recorded on video by Downer EDI Mining (<strong>Wambo</strong><br />
Page 79
<strong>2011</strong>-<strong>2012</strong> <strong>AEMR</strong><br />
open cut mine operators). The video recordings<br />
and photographs indicate that the visible NOx fumes<br />
remained and dissipated onsite. Although the<br />
recordings show that the airborne dust appeared to<br />
remain on site, complaints subsequently received<br />
from neighbours indicate that unobserved dust may<br />
have left site.<br />
C11 Dam Seepage 22 May <strong>2012</strong><br />
WCPL received written request by the Environment<br />
Protection Authority (EPA) dated 23 May <strong>2012</strong>,<br />
requesting a written report on the mine water<br />
seepage from C11 Dam, as reported to the EPA<br />
Pollution line on 22 May <strong>2012</strong> by WCPL. The<br />
summary of the investigation and response to the<br />
EPA is provided below.<br />
Seepage water entering United Collieries’ (United)<br />
Colliery Holding was reported by United<br />
environmental staff to <strong>Wambo</strong> <strong>Coal</strong> Mine (<strong>Wambo</strong>)<br />
environmental staff at approximately 4.45pm on the<br />
21 May <strong>2012</strong>. Investigation that evening, and the<br />
following morning, indicated that the probable<br />
source of the seepage was the <strong>Wambo</strong> C11 Dam,<br />
located within <strong>Wambo</strong>’s Colliery Holding.<br />
The C11 Dam is located adjacent to the Colliery<br />
Holding boundary between <strong>Wambo</strong> and United (see<br />
Figure 1), and is used as a staging dam for transfer<br />
of water between the two mines. The dam is<br />
situated in a disused open cut void, and the<br />
northern dam wall consists of consolidated rock<br />
strata overlain by rehabilitated spoil. Water level in<br />
the C11 Dam has risen since November <strong>2011</strong> due<br />
to water transfers following heavy summer rain. This<br />
increased water level rise has resulted in seepage<br />
through the rehabilitated spoil in the north eastern<br />
wall of the dam. The seepage has then re-surfaced<br />
further downslope, within the United Colliery<br />
Holding.<br />
A remedial action plan was implement which<br />
included recovering water from ponds along the<br />
seepage using a vacuum truck, installing a pump at<br />
C11 to reduce the water level in the dam, daily<br />
inspections of the dam and further water sampling<br />
and testing. The water level in C11 is now<br />
maintained and monitored at an acceptable level.<br />
3.21 Independent Audit<br />
In accordance with Consent Condition 7, Schedule<br />
6 of DA305-7-2003, WCPL completed an<br />
independent environmental audit to assess the<br />
performance of the operation and whether the<br />
operation is complying with its relevant development<br />
consents, EPL or mining leases at the end of the<br />
last reporting period.<br />
In the opinion of the auditors, the documentation,<br />
reporting and activities at the WCPL generally<br />
demonstrated a high degree of compliance with the<br />
conditions attached to the current consent and<br />
approvals granted for the project. However there<br />
were a number of recommendations provided in<br />
relation to management plans and programs to<br />
address specific requirements within the consent<br />
and/or approval conditions. For a summary of<br />
WCPL responses to the audit findings please refer<br />
to Appendix 6 of this <strong>AEMR</strong>.<br />
4.0 Community Relations<br />
4.1 Employment Status<br />
There were approximately 871 personnel, including<br />
contractors, employed at WCPL at the end of the<br />
reporting period. This is an overall increase of<br />
approximately 29 personnel from the previous<br />
reporting period. Downer EDI, who are contracted<br />
by WCPL to undertake the Open Cut mining,<br />
employed a total of 469 personnel, an increase of<br />
approximately 116 personnel compared with the<br />
previous reporting period. The increase of Open Cut<br />
contractors was in response to increasing<br />
production requirements. The breakdown of<br />
employee numbers is presented in Table 4.1.<br />
4.2 Environmental Complaints<br />
WCPL received a total of 82 community complaints,<br />
an overall increase of 47 community complaints<br />
from the previous reporting period. A total of 68<br />
complaints were recorded by WCMP in relation to<br />
noise (Figure 4.1). A review of the noise complaints<br />
identified approximately 71% of all the 68 noise<br />
complaints were from two community members,<br />
residing south of the WCPL operation. A majority of<br />
these complaints were in response to WCPL<br />
completing mining activities in the Homestead Pit<br />
and Rug Dump areas, which are no longer<br />
occurring.<br />
A total of 27 complaints were registered through the<br />
OEH Hotline. A number of the community<br />
complaints related to noise and lighting enquiries.<br />
All community complaints were managed in<br />
accordance with WCPL’s Community Complaints<br />
Procedure.<br />
A comparison between the numbers of complaints<br />
received this year with those received in previous<br />
years is presented in Table 4.2. The number of<br />
complaints received increased from the previous<br />
reporting period by approximately 45%. A register of<br />
complaints and the company’s response to resolve<br />
any issues are presented in Appendix 4.<br />
Page 80
<strong>2011</strong>-<strong>2012</strong> <strong>AEMR</strong><br />
Table 4.1 – WCPL Employment Status (end of June <strong>2012</strong>)<br />
Admin<br />
Open<br />
Cut<br />
CH&PP<br />
Underground<br />
WCPL<br />
Staff/Supervisors 35 2 11 65<br />
Production/Mineworkers 8 85<br />
Fitters 4 34<br />
Electricians 7 27<br />
Contractors - Other 5 30 191<br />
Total WCPL 40 2 60 402<br />
Downer EDI<br />
Employees 54 377<br />
Contractors 3 35<br />
Total Downer EDI 57 412<br />
Total (All) 871<br />
Table 4.2 – WCPL Historical Complaints<br />
Reporting Period<br />
Complaints Received<br />
<strong>2011</strong> - <strong>2012</strong> 82<br />
2010 - <strong>2011</strong> 35<br />
2009 - 2010 18<br />
2008 - 2009 3<br />
2007 - 2008 26<br />
2006 - 2007 29<br />
2005 - 2006 32<br />
2004 - 2005 12<br />
2003 - 2004 28<br />
2002 - 2003 20<br />
2001 - 2002 4<br />
Page 81
<strong>2011</strong>-<strong>2012</strong> <strong>AEMR</strong><br />
No. of complaints<br />
10<br />
9<br />
8<br />
7<br />
6<br />
5<br />
4<br />
3<br />
2<br />
1<br />
0<br />
<strong>2011</strong>-<strong>2012</strong> Community Complaints<br />
Jul Aug Sep Oct Nov Dec Jan Feb Mar Apr May Jun<br />
90<br />
85<br />
80<br />
75<br />
70<br />
65<br />
60<br />
55<br />
50<br />
45<br />
40<br />
35<br />
30<br />
25<br />
20<br />
15<br />
10<br />
5<br />
0<br />
No. (cumulative)<br />
Dust Dust - Blasting Noise Fumes - Blasting Lighting<br />
<strong>Coal</strong> Spillage Other Blasting - Vibration Cumulative FY11 FY12 Total<br />
Figure 4.1 – <strong>2011</strong>-<strong>2012</strong> Breakdown of Community Complaints by Issue<br />
Page 82
<strong>2011</strong>-<strong>2012</strong> <strong>AEMR</strong><br />
4.3 Community Liaison<br />
4.3.1 Community Consultation<br />
During the reporting period WCPL held four<br />
Community Consultative Committee (CCC)<br />
meetings. These meetings were conducted on;<br />
26 th July <strong>2011</strong>;<br />
18 th October <strong>2011</strong>;<br />
<br />
21 st February <strong>2012</strong>; and<br />
22 nd May <strong>2012</strong>.<br />
Community representatives act as the point of<br />
contact between the mine and the community. The<br />
committee is made up of residents from the Jerry’s<br />
Plains, Warkworth and South <strong>Wambo</strong> areas,<br />
representatives of SSC and WCPL and is chaired<br />
by an independent person. The DP&I endorsed the<br />
composition of the committee in December 2005.<br />
There was one publication of the <strong>Wambo</strong> <strong>Coal</strong><br />
Environment and Community Newsletter during the<br />
reporting period. This was distributed to households,<br />
the CCC and the workforce in November <strong>2011</strong>. The<br />
newsletter is intended to keep the community<br />
informed about WCPL activities.<br />
4.3.2 Information Sessions<br />
WCPL plan to hold the next rounds of community<br />
information sessions in August <strong>2012</strong> and February<br />
2013. The sessions will build on our successful<br />
face-to-face sessions in November-December <strong>2011</strong><br />
and will be held at the School of Arts Hall in Jerrys<br />
Plains. Any notifications of the information sessions<br />
are provided in the Singleton Argus, posters at local<br />
petrol stations and notification flyers distributed to<br />
local areas.<br />
4.3.3 Community Contributions<br />
At the end of the <strong>2011</strong>-<strong>2012</strong> reporting period, WCPL<br />
had provided in excess of $55,000 in support and<br />
donations. This includes such programs as the<br />
development of a bushtucker garden at Singleton<br />
High School, educational support for Jerrys Plains<br />
Public School, a new information board at Singleton<br />
Heights Public School, as well as donations to the<br />
Westpac Rescue Helicopter and numerous sporting<br />
teams and clubs in the district.<br />
<strong>Wambo</strong> also takes great pride in its ongoing<br />
partnership with Singleton Council for the Hall of<br />
Fame and Mayoral Scholarship programs.<br />
As well as continuing support for these existing<br />
programs, WCPL provided financial assistance for a<br />
number of community activities. Projects and groups<br />
sponsored included, but not limited to:<br />
<br />
<br />
<br />
<br />
<br />
<br />
<br />
<br />
<br />
<br />
<br />
<br />
Singleton Pony Club<br />
Sydney to Wollongong Charity Ride for<br />
Multiple Sclerosis<br />
Broke Public School<br />
St Josephs High School<br />
Jerrys Plains Public School<br />
Giggle Ball – Camp Quality<br />
Oxfam<br />
Singleton Amateur Swimming Club<br />
Singleton Chamber of Commerce & Industry<br />
Westpac Rescue Helicopter Service<br />
NAIDOC Family Fun Day; and<br />
NSW Streetsmart Handbook.<br />
4.3.4 Community Programs<br />
Language Program<br />
WCPL continued support through the language<br />
program for Jerrys Plains Public School. The<br />
language program was developed in consultation<br />
with the school Principal and teaching staff during<br />
the second half of 2008. After securing a highly<br />
qualified speech pathologist to work with the<br />
students at Jerrys Plains Public School, the<br />
implementation of the program commenced during<br />
Term 1 of 2009.<br />
The language program operates in the school for<br />
nine hours each Tuesday. The program involved a<br />
Page 83
<strong>2011</strong>-<strong>2012</strong> <strong>AEMR</strong><br />
speech and language assessment for each of the<br />
students. The assessment process is<br />
comprehensive, taking several hours for each<br />
student.<br />
In collaboration with the school Principal, two<br />
meetings were organised so that interested parents<br />
could learn about the program and how to best<br />
assist their children with respect to speech and<br />
language skills at home. The language program has<br />
been well received and is set to continue during the<br />
next reporting period.<br />
Singleton High School<br />
WCPL entered into a partnership with Singleton<br />
Public School to enhance the school grounds and<br />
gardens through a native vegetation landscaping<br />
program. This program is considered the initial<br />
stage of a more widely scoped environmental<br />
education program to be developed in consultation<br />
with the wider school community over a number of<br />
years<br />
Singleton Hall of Fame<br />
<strong>Wambo</strong> <strong>Coal</strong> continues to be the proud sponsor of<br />
the <strong>Wambo</strong> <strong>Coal</strong> Singleton Hall of Fame. In 2009,<br />
WCPL welcomed the opportunity to be involved in<br />
the project which celebrates local achievements and<br />
builds community spirit. WCPL involvement in the<br />
Singleton Hall of Fame continued throughout <strong>2011</strong>,<br />
and is planned for the following reporting period.<br />
<strong>Wambo</strong> <strong>Coal</strong>’s Environment and Community<br />
Manager is a member of the <strong>Wambo</strong> <strong>Coal</strong> Singleton<br />
Hall of Fame committee that implemented the<br />
initiative. The committee's role is to decide which<br />
nominated individuals, families and<br />
organisations will be inducted into the <strong>Wambo</strong> <strong>Coal</strong><br />
Singleton Hall of Fame.<br />
Singleton Public School<br />
During the reporting period, WCPL donated to<br />
Singleton Public School a prize consisting of a<br />
HUMMV (Hummer) ride and helicopter joy flight for<br />
10 people. The prize was used by the school to<br />
encourage participation in a healthy lifestyles<br />
program being run for students and their families.<br />
Singleton Mayoral Scholarship<br />
The Singleton Mayoral Scholarship was developed<br />
by the Singleton Council to encourage and<br />
celebrate the dedication and commitment of people<br />
in the Singleton area.<br />
In <strong>2012</strong>, five $5,000 scholarships were on offer. In<br />
line with our commitment to the Singleton Shire, we<br />
take great pride in helping create opportunities for<br />
talented local individuals to progress their education<br />
through the Mayoral Scholarship Programme.<br />
Page 84
<strong>2011</strong>-<strong>2012</strong> <strong>AEMR</strong><br />
5.0 Rehabilitation<br />
Table 5.1 provides a summary of the rehabilitation<br />
undertaken at WCPL during the <strong>2011</strong>-<strong>2012</strong><br />
reporting period. Appendix 5 provides the annual<br />
rehabilitation plan for WCPL. Table 5.2 shows the<br />
maintenance activities conducted during <strong>2011</strong>-<strong>2012</strong><br />
on previously rehabilitated land.<br />
Table 5.1 – Rehabilitation Summary<br />
Area Affected/Rehabilitated (hectares)<br />
Current<br />
2010-<strong>2011</strong><br />
<strong>AEMR</strong><br />
Next Report<br />
(estimated)<br />
A: MINE LEASE AREA<br />
A1 Mine Lease(s) Area 7050 7050 7050<br />
B: DISTURBED AREAS<br />
B1 Infrastructure area (other disturbed areas<br />
to be rehabilitated at closure including facilities,<br />
roads)<br />
B2 Active Mining Area (excluding items B3-<br />
B5 below)<br />
B3 Waste Emplacements<br />
(active/unshaped/in or out-of-pit)<br />
B4 Tailings Emplacements<br />
(active/unshaped/uncapped)<br />
B5 Shaped Waste Emplacement (awaits<br />
final vegetation)<br />
256.24 214.46 256.24<br />
208.54 148.57 223<br />
456.44 508.24 360.44<br />
40.39 40.39 40.39<br />
68.36 0 96<br />
ALL DISTURBED AREAS 1030 911.66 976.07<br />
C1 Planned Rehabilitated Area 120 60 137<br />
C2 Total Rehabilitated Area (except for<br />
maintenance)<br />
249.6 249.6 386.6<br />
D1 10 to 18 degrees 4.3 4.3 4.3<br />
D2 Greater than 18 degrees 0.0 0.0 0.0<br />
E1 Pasture and grasses 206.31 206.31 327.31<br />
E2 Native forest/ecosystems 49.43 49.43 65.13<br />
E3 Plantations and crops 0.0 0.0 0.0<br />
E4 Other (include non vegetative outcomes) 0.0 0.0 0.0<br />
Page 85
<strong>2011</strong>-<strong>2012</strong> <strong>AEMR</strong><br />
Table 5.2 – Maintenance Activities on Previously Rehabilitated Land<br />
Nature of Treatment<br />
Area Treated (ha)<br />
Report<br />
Period<br />
Next<br />
Period<br />
Comment/Control Strategies/Treatment<br />
Detail<br />
Additional erosion control<br />
works (drains re-contouring, rock<br />
protection)<br />
0<br />
As<br />
required<br />
For the next reporting period WCPL will be<br />
developing an annual maintenance rehabilitation<br />
program.<br />
Soil Treatment (detail – fertiliser,<br />
lime, gypsum etc)<br />
Treatment/ Management (detail<br />
– grazing, cropping, slashing etc)<br />
Re-seeding/ Replanting (detail –<br />
species density, season etc)<br />
Repairs to subsidence induced<br />
cracking<br />
0<br />
0<br />
0<br />
0<br />
As<br />
required<br />
As<br />
required<br />
As<br />
required<br />
As<br />
required<br />
For the next reporting period WCPL will be<br />
developing an annual maintenance rehabilitation<br />
program.<br />
For the next reporting period WCPL will be<br />
developing an annual maintenance rehabilitation<br />
program.<br />
For the next reporting period WCPL will be<br />
developing an annual maintenance rehabilitation<br />
program.<br />
Subsidence cracking repaired along site internal<br />
access roads.<br />
Adversely Affected by Weeds<br />
(detail – type and treatment)<br />
0<br />
As<br />
required<br />
See Section 3.8 for to weed control measures on<br />
other WCPL owned land<br />
Feral animal control (detail –<br />
additional fencing, trapping,<br />
baiting etc)<br />
0<br />
As<br />
required<br />
While no work is proposed directly on rehabilitated<br />
areas, work will be conducted on other WCPL<br />
owned land. Refer to Section 3.8.<br />
5.1 Rehabilitation of Disturbed<br />
Land<br />
5.1.1 Open Cut<br />
Landform reshaping consists of re-contouring<br />
overburden dumps to the designed shape for final<br />
rehabilitation. The bulk shaping of overburden is<br />
undertaken using bulldozers. Reshaping results in<br />
a stable landform incorporating slopes and drainage<br />
which blend in with the surrounding natural<br />
topography. Slope stability is integral to<br />
rehabilitation design and the objective during<br />
rehabilitation planning is to design all slopes to a<br />
gradient of ten degrees or less. Slopes steeper than<br />
ten degrees may be necessary in some locations to<br />
ensure rehabilitation merges seamlessly with<br />
adjacent undisturbed land.<br />
Once bulk reshaping is completed, the landform is<br />
deep-ripped to approximately 300mm, and then the<br />
final trim and rock raking are undertaken. The<br />
ripping loosens up any near surface strata within the<br />
landform that have been compacted during<br />
placement, aiding root penetration during vegetation<br />
establishment.<br />
The final trim smooths out any wash-outs, rough<br />
edges, temporary access tracks, local steep<br />
topography and prepares the surface for<br />
revegetation. Rock-raking removes exposed<br />
surface rock greater than 200 mm in diameter. This<br />
raking is usually done along the contour, leaving a<br />
textured surface that assists with erosion<br />
minimisation until vegetation can be established.<br />
Ameliorants, if required, are applied to the trimmed<br />
overburden surface prior to topsoil spreading.<br />
Topsoil stripped ahead of mining will be applied to<br />
the reshaped surface in an even layer generally not<br />
less than 100mm. Topsoil is placed using rear<br />
dump haul trucks, or ejector trucks, and spread with<br />
dozers or graders. Once spread, the topsoil surface<br />
will be disc or chisel cultivated to create a textured<br />
surface which assists in trapping surface runoff,<br />
provides seed entrapments and creates<br />
microclimates favourable for seed germination.<br />
Where biosolids are used, cultivation also integrates<br />
the topdressing material, which is a requirement of<br />
the EPA biosolids handling guidelines.<br />
Following surface preparation, vegetation<br />
establishment across the rehabilitated area is<br />
commenced. The aim of revegetation is to minimise<br />
erosion and facilitate the development of the postmining<br />
land-use, be it agricultural production or<br />
habitat/ecosystem enhancement.<br />
Page 86
<strong>2011</strong>-<strong>2012</strong> <strong>AEMR</strong><br />
5.1.1.1 Rehabilitation Performance<br />
Existing rehabilitated areas include the Whynot,<br />
Low-wall and Ridge Dump areas, RL160 Dump,<br />
Charlies Hole, Wombat Hill, and Radio Shack in the<br />
current Open Cut plus older rehabilitation from<br />
previous Open Cuts.<br />
engineered solutions to cap the weak tailings<br />
surface. The design has considered the strength of<br />
the current crust (verified through Shear Vane<br />
Testing), the equipment to be used and the capping<br />
material to determine the reinforcement and the<br />
placement method required to ensure the safety of<br />
this operation.<br />
During the previous reporting period of 2010-<strong>2011</strong>,<br />
rehabilitated areas within the Open Cut were reliant<br />
on the completion of overburden dumps, particularly<br />
in the Rug/ Ridge dump area. Due to delays in<br />
overburden removal from the Homestead Pit (which<br />
was being placed on the Rug/ Ridge dump), no<br />
significant dump areas were available for reshaping,<br />
and no open cut rehabilitation was completed during<br />
the period of 2010-<strong>2011</strong>.<br />
Further rehabilitation planned for the <strong>2011</strong>-<strong>2012</strong><br />
was primarily focused on the RL 160 Dump. At the<br />
time of reporting, 40 ha of final reshaped landform<br />
had been completed. Topsoiling and seeding of the<br />
area is scheduled to commence and be completed<br />
in September <strong>2012</strong>.<br />
The planned rehabilitation for next reporting period<br />
is 40 ha. This work is planned for the Rug/ Ridge<br />
Dump.<br />
All disused tailings dams are rehabilitated with the<br />
exception of the North East Tailings Dam, which is<br />
currently being capped for rehabilitation (see<br />
Section 5.1.1.2).<br />
5.1.1.2 North East Tailings Dam<br />
The rehabilitation of the area known as the North<br />
East Tailings Dam (NETD) has been established as<br />
a stand alone project within <strong>Peabody</strong>’s <strong>Wambo</strong> <strong>Coal</strong><br />
Operation. Initial works commenced at the NETD<br />
during the 2008/2009 <strong>AEMR</strong> reporting period. The<br />
dam, which was discontinued as an active disposal<br />
site in 2004 following Department Approval under<br />
Section 127, has been the subject of a number of<br />
studies to identify a safe and viable method of<br />
capping the relatively weak surface. WCPL have<br />
been working together with Australian Tailings<br />
Consultants to develop a capping strategy utilising<br />
reinforced geogrid and controlled layers of coarse<br />
reject and overburden placed by specialist low<br />
ground pressure equipment.<br />
NETD rehabilitation works using low press ground<br />
equipment<br />
Placement of the initial rejects layer has continued<br />
with additional small dozers sourced. Progress has<br />
been slow due to the weak surface with the crust rewetting<br />
as the equipment traverses, however a<br />
repeatable process has now been demonstrated<br />
and productivity is improving.<br />
During the last reporting period, heavy rain in early<br />
June <strong>2011</strong> caused major ponds to form on the dam<br />
surface which suspended work activity. Pumping<br />
continued throughout the month with the majority of<br />
water removed. As a result of the water on the<br />
surface no placement of fabric or rejects occurred<br />
during the month. Pumping efforts were successful<br />
with access regained to the dam surface mid month<br />
with rejects placement and geo grid placement<br />
resuming in early July <strong>2011</strong>.<br />
The scope of the NETD capping project is to<br />
rehabilitate the 1220m long by 200m wide<br />
decommissioned tailings storage facility. WCPL<br />
have investigated and evaluated the capping<br />
method utilising purpose built low ground pressure<br />
equipment, in conjunction with Geotextile<br />
reinforcement. Extensive design works have been<br />
undertaken to develop the concept and provide<br />
Wet weather June 15 <strong>2011</strong><br />
Page 87
<strong>2011</strong>-<strong>2012</strong> <strong>AEMR</strong><br />
After pumping 31 July <strong>2011</strong><br />
NETD Rehabilitation Status as of December <strong>2011</strong><br />
NETD at the end of June <strong>2012</strong><br />
NETD Rehabilitation Status as of June <strong>2012</strong><br />
At the end of the reporting period approximately<br />
56% of the dam surface is covered with a layer of<br />
rejects. The target is to complete rejects placement<br />
on 100% of the dam by the end of <strong>2012</strong>.<br />
5.1.2 Rail Line<br />
NETD Rehabilitation Status as of July <strong>2011</strong><br />
Rehabilitation was progressively completed on the<br />
<strong>Wambo</strong> Rail Development (WRD) following the<br />
completion of construction activities. The primary<br />
aims of this rehabilitation was to allow the<br />
regeneration of native flora species on the site,<br />
maintain the structural stability of the land, prevent<br />
erosion and sedimentation, and provide natural<br />
screening, where possible, to maintain the visual<br />
amenity of the WRD.<br />
Continued monitoring of the rehabilitation and tree<br />
maintenance works will continue throughout <strong>2011</strong>-<br />
<strong>2012</strong> reporting period.<br />
Page 88
<strong>2011</strong>-<strong>2012</strong> <strong>AEMR</strong><br />
5.1.3 NWC Diversion<br />
Following Stage 2 completion of the NWC Diversion<br />
construction works, all disturbed areas were<br />
rehabilitated in 2008/2009. Rehabilitation consisted<br />
generally of topsoil application, application of soil<br />
ameliorants, ripping, seeding (mainly a pasture<br />
seedmix), and strategic tubestock planting to<br />
provide long-term bank stabilisation. Revegetation<br />
using hydromulching was also undertaken on<br />
steeper batters.<br />
Following the first two flows, or discharges, through<br />
Stage 2 of the NWC Diversion in February and April<br />
2009, an assessment of diversion condition and<br />
bank stability was undertaken. The diversion was<br />
inspected by the hydrological consultants who<br />
designed the diversion (Gilbert and Associates) and<br />
a Hunter Valley based consultancy that specialises<br />
in rehabilitation and erosion control (GSS<br />
Environmental). The two inspection reports (GSSE,<br />
October 2009, and Gilbert & Associates, September<br />
2009) identified several areas requiring remedial<br />
attention.<br />
During the reporting period, WCPL prepared<br />
tenders for the remedial rehabilitation works within<br />
Stage 2 NWC Diversion, based on the<br />
recommendations provided from both GSSE and<br />
Gilbert’s. After completing the Tendering process<br />
and awarding contracts, rehabilitation works within<br />
Stage 2 of the NWC Diversion commenced in April<br />
<strong>2011</strong>, with works completed during June <strong>2011</strong>.<br />
North <strong>Wambo</strong> Creek Diversion (Stage 3)<br />
Construction works were nearing completion on the<br />
final stage (i.e. Stage 3) of the North <strong>Wambo</strong> Creek<br />
Diversion program. At the end of the reporting<br />
period approximately 800,000 m 3 of excavation had<br />
been carried out to construct the permanent creek<br />
line around the old Wollemi Underground Portal<br />
area, in conjunction with revegetation works. The<br />
construction of this diversion will allow the open cut<br />
to progress mining the Bates South area and<br />
provide future access to the proposed South Bates<br />
underground longwall panels.<br />
Stage 3 revegetation works for the flood bunding<br />
and diversion channels and associated areas is<br />
planned for early September <strong>2012</strong>.<br />
For full details regarding the North <strong>Wambo</strong> Creek<br />
Diversion Discharge Report please refer to Section<br />
2.8.2.2.<br />
5.2 Rehabilitation Trials and<br />
Research<br />
During the previous reporting period, WCPL<br />
commenced incorporating biosoilds into the Open<br />
Cut rehabilitation program. A wider application area<br />
was planned for the current reporting period, as well<br />
as trial application of organic compost material. As<br />
no rehabilitation was completed during this reporting<br />
period, application of biosoilds and organic compost<br />
is expected to occur during the next reporting<br />
period.<br />
The use of mobile tree mulching plant was utilised<br />
throughout the reporting period and will be utilised<br />
where possible during the next reporting period.<br />
After identification and separate recovery of timber<br />
and habitat trees, the mulcher will mulch trees in<br />
situ, leaving a blanket of mulch, which assists with<br />
dust suppression and erosion control, as well as<br />
providing a source of organic matter in the stripped<br />
topsoil.<br />
5.3 Rehabilitation Monitoring<br />
During the reporting period a program of works<br />
associated with the monitoring of revegetated<br />
disturbed riparian lands utilising the CSIRO<br />
developed Ecosystem Function Analysis (EFA)<br />
monitoring tool was undertaken. A separate survey<br />
and report has been prepared for the monitoring of<br />
rehabilitated areas associated with the Open Cut<br />
areas.<br />
The data that has been derived from the monitoring<br />
program provides a scientifically robust platform<br />
against which the effectiveness of rehabilitation<br />
techniques can be assessed and where applicable<br />
amended, with a view to achieving sustainable<br />
vegetation communities on disturbed landscapes.<br />
The purpose of the assessment is to determine<br />
whether rehabilitated areas are on a trajectory<br />
toward self sustainability and functionality.<br />
The riparian areas surveyed included South <strong>Wambo</strong><br />
Creek and North <strong>Wambo</strong> Creek downstream of the<br />
Open Cut offices. The second component of the<br />
riparian monitoring program commenced in 2008<br />
and focused on the North <strong>Wambo</strong> Creek Diversion<br />
rehabilitation works.<br />
5.3.1.1 Ecosystem Function Analysis<br />
Summary<br />
Open Cut EFA<br />
RPS was engaged by <strong>Wambo</strong> <strong>Coal</strong> Pty Ltd (<strong>Wambo</strong><br />
<strong>Coal</strong>) to undertake the October <strong>2011</strong> Ecosystem<br />
Function Analysis (EFA) monitoring of 14 previously<br />
established open cut EFA transects. Twelve EFA<br />
transects were established in 2006 comprising:<br />
Six pasture rehabilitation transects;<br />
Four woodland rehabilitation transects;<br />
One pasture analogue transect; and<br />
One woodland analogue transect.<br />
A further two pasture rehabilitation transects were<br />
created in 2008. During 2009 two pasture<br />
rehabilitation transects were repositioned to more<br />
Page 89
<strong>2011</strong>-<strong>2012</strong> <strong>AEMR</strong><br />
representative pasture rehabilitation locations.<br />
During 2010 six new transects were established,<br />
comprising:<br />
Two pasture analogue transects;<br />
Two woodland analogue transects; and<br />
Two pasture rehabilitation transects.<br />
The total number of EFA transects investigated<br />
during <strong>2011</strong> was 20 and comprised:<br />
Three analogue woodland transects;<br />
Four rehabilitation woodland transects;<br />
Three analogue pasture transects; and<br />
Ten rehabilitation pasture transects.<br />
With the exception of one transect (9R) all other<br />
pasture rehabilitation transects recorded LFA scores<br />
similar to the analogue transects in <strong>2011</strong>. This<br />
suggests that at least during <strong>2011</strong> that many of the<br />
rehabilitation transects had a similar landscape<br />
function to the target analogue transects. Continued<br />
sampling will be required to determine whether the<br />
rehabilitation analogue sites will continue to exhibit<br />
such high scores during future years particularly<br />
those of harsher conditions. Only when<br />
rehabilitation sites recorded similar or better LFA<br />
scores than analogues sites over a range of years<br />
and seasonal conditions, can the rehabilitation<br />
works be considered a success from an EFA<br />
assessment.<br />
Woodland rehabilitation transects appear to be<br />
trending towards the analogue values.<br />
Landscape Organisational Index (LOI) and Stability<br />
Index (SI) scores at the analogue transects were<br />
approximately consistent with the rehabilitation<br />
transect scores, however, some rehabilitation sites<br />
had lower infiltration index (INFI) and nutrient index<br />
(NI) scores than analogue transects. Overall EFA<br />
analysis indicates that the woodland rehabilitation<br />
transects within the open cut area of <strong>Wambo</strong> <strong>Coal</strong><br />
are approaching but have not yet demonstrated LFA<br />
values characteristic of target woodland<br />
communities. However the general pattern of<br />
increase in EFA parameters suggests that the<br />
rehabilitation woodland transects are improving<br />
towards the analogue goal.<br />
NWCD Stage 2 EFA<br />
RPS was engaged by <strong>Wambo</strong> <strong>Coal</strong> Pty Ltd (<strong>Wambo</strong><br />
<strong>Coal</strong>) to undertake the November <strong>2011</strong> Ecosystem<br />
Function Analysis (EFA) monitoring of 14 previously<br />
established riparian EFA transects. This is the fourth<br />
year of monitoring of rehabilitation works along the<br />
North <strong>Wambo</strong> Creek Diversion (NWCD). The EFA<br />
monitoring of 10 rehabilitation transects began in<br />
the October 2008. Two further transects (one<br />
analogue and one rehab) were previously<br />
established in 2006 as part of previous EFA<br />
monitoring of open cut rehabilitation transects. In<br />
2010, two new analogue sites were established<br />
along North <strong>Wambo</strong> Creek to bring the total number<br />
of analogue sites to three (as recommended in the<br />
2009 report). Also in 2010, rehabilitation transect<br />
14R was moved to a more suitable location, as<br />
recommended in the 2009 report.<br />
LFA scores were relatively constant in <strong>2011</strong> in<br />
comparison to previous years. Similarity in scores<br />
was likely due to the continued presence of the tall<br />
grassland along NWCD that was also present in<br />
2009 and 2010. The reasons for declines in some<br />
LFA scores were not known, however the data<br />
indicates that it is related to a decline in the ability of<br />
water to infiltrate the soil and a reduced level of<br />
nutrient cycling via litter decomposition.<br />
Along the approximate 2.5 km length (straight line)<br />
of the NWCD there was a general pattern of<br />
declining LFA scores from upstream to downstream.<br />
As the good season for grass growth was common<br />
to all NWCD transects, the reason for the<br />
geographic variation in scores was unknown.<br />
Vegetation dynamics and habitat complexity scores<br />
were approximately similar between 2009, 2010 and<br />
<strong>2011</strong>.<br />
Open Cut EFA Transect Locations<br />
NWCD Stage 2 EFA Transect Locations<br />
Page 90
<strong>2011</strong>-<strong>2012</strong> <strong>AEMR</strong><br />
Riparian EFA<br />
Riparian assessments which included taking<br />
pedestrian based surveys along sections of North<br />
<strong>Wambo</strong> Creek, South <strong>Wambo</strong> Creek and Stoney<br />
Creek utilising field sheets to give an overall rating<br />
of creek health were undertaken over four days in<br />
November <strong>2011</strong>. Two types of transect were<br />
assessed for each of the three streams, these were:<br />
<br />
<br />
Cross sectional – A marked single line transect<br />
across the width of the stream from bank to<br />
bank, hereafter referred to as ‘transects’; and<br />
Longitudinal – An unmarked transect along the<br />
length of the creek between two transects,<br />
hereafter referred to as ‘sections’.<br />
There are two types of riparian monitoring including<br />
bed and bank stability monitoring, and riparian<br />
vegetation monitoring.<br />
Bed and bank stability monitoring is undertaken by<br />
surveying consultants who undertake replicate<br />
surveys of the three creeks to measure areas of<br />
significant erosion and to identify changes related to<br />
water flow. A written assessment was completed of<br />
any areas of significant erosion, bare soil and visible<br />
subsidence along each creek line. The results were<br />
not finalised at the times of preparing the <strong>AEMR</strong>.<br />
The results of the bed and bank stability for <strong>2011</strong>-<br />
212 will be included in the next <strong>AEMR</strong>.<br />
Riparian Monitoring Condition Scores<br />
Riparian Vegetation Monitoring<br />
The effects of subsidence and erosion on riparian<br />
vegetation were monitored by repetitive sampling of<br />
established permanent transects. Riparian<br />
monitoring identified Stoney Creek as being in good<br />
condition, and North <strong>Wambo</strong> and South <strong>Wambo</strong><br />
Creeks in moderate condition. Current bank erosion<br />
problem areas are a result of historic land<br />
management practises however in the absence of<br />
current management will continue to degrade.<br />
Subsidence has also been recorded during <strong>2011</strong><br />
annual assessments. Impacts from mining<br />
subsidence were found along North <strong>Wambo</strong> creek.<br />
Rock formations at the base of the creek bed<br />
experienced both compression and expansion as a<br />
result of subsidence. Natural fault lines within the<br />
rock as well as solid rock segments experienced<br />
expansion within a range of 6–20 mm.<br />
The subsidence impacts are consistent with the<br />
predictions made in the SMP. Invention measures to<br />
address affected areas will be reported in the next<br />
<strong>AEMR</strong>.<br />
Page 91
<strong>2011</strong>-<strong>2012</strong> <strong>AEMR</strong><br />
6.0 Activities Proposed<br />
for the Next <strong>AEMR</strong><br />
Period<br />
6.1 <strong>Wambo</strong>’s Key Activities for<br />
<strong>2012</strong>-2013<br />
Key activities for WCPL in the next reporting period<br />
include:<br />
Final rehabilitation for NWC Diversion Stage 3.<br />
Rehab maintenance for Stage 2 NWD<br />
Diversion<br />
<br />
<br />
Completion of rejects capping on NETD.<br />
Completion of Open Cut mining in Homestead<br />
Pit, and development of underground access<br />
facilities.<br />
Continuation of mining in Bates/Bates<br />
South/Montrose pits.<br />
<br />
<br />
<br />
Completion of LW5 and commencement of<br />
LW6, and development for LW7<br />
Produce Mining Operations Plan for NWU, and<br />
modify Open Cut Mining Operations Plan<br />
Finalise modifications to development consents<br />
for NWU extension.<br />
6.2 Objectives and Targets for<br />
<strong>2011</strong>-<strong>2012</strong> Reporting<br />
Period<br />
WCPL’s proposed objectives and targets for the<br />
<strong>2012</strong>-2013 reporting period are outlined in Table<br />
6.1.<br />
Objective and Targets <strong>2012</strong>- 2013<br />
Land rehabilitated (hectares) 40<br />
Land disturbed (hectares) 74.9<br />
Number of significant<br />
environmental incidents<br />
0<br />
Average % of waste recycled 70<br />
Number of regulatory<br />
penalties<br />
Number of community<br />
newsletters distributed<br />
0<br />
3<br />
Table 6.1 – Objectives and Targets for <strong>2012</strong>-2013<br />
Page 92
Appendix 1<br />
Rail Haulage Records
<strong>Wambo</strong> <strong>Coal</strong> Pty Ltd <strong>AEMR</strong> <strong>2011</strong>-<strong>2012</strong><br />
Tonnes Railed from <strong>Wambo</strong> <strong>Coal</strong> Terminal <strong>2011</strong>-<strong>2012</strong><br />
Railed date Train No<br />
Tonnes to Port<br />
ex P/N or QR<br />
Arrival Time Commence Loading Complete Loading<br />
1/07/<strong>2011</strong> JW 266 7230.60 30/06/<strong>2011</strong> 11:18 PM 30/06/<strong>2011</strong> 11:35 PM 1/07/<strong>2011</strong> 1:20 AM<br />
1/07/<strong>2011</strong> JW 62 3437.00 1/07/<strong>2011</strong> 10:05 AM 1/07/<strong>2011</strong> 10:11 AM 1/07/<strong>2011</strong> 11:00 AM<br />
3/07/<strong>2011</strong> JW 170 7187.80 3/07/<strong>2011</strong> 9:17 AM 3/07/<strong>2011</strong> 9:25 AM 3/07/<strong>2011</strong> 11:03 AM<br />
3/07/<strong>2011</strong> JW 238 7249.60 3/07/<strong>2011</strong> 10:26 PM 3/07/<strong>2011</strong> 10:32 PM 4/07/<strong>2011</strong> 12:07 AM<br />
4/07/<strong>2011</strong> JW 240 7268.8080 4/07/<strong>2011</strong> 9:20 PM 4/07/<strong>2011</strong> 9:25 PM 4/07/<strong>2011</strong> 11:25 PM<br />
5/07/<strong>2011</strong> JW 272 7272.20 4/07/<strong>2011</strong> 11:30 PM 5/07/<strong>2011</strong> 12:50 AM 5/07/<strong>2011</strong> 3:18 AM<br />
5/07/<strong>2011</strong> JW 930 7262.60 5/07/<strong>2011</strong> 5:25 AM 5/07/<strong>2011</strong> 5:34 AM 5/07/<strong>2011</strong> 7:34 AM<br />
5/07/<strong>2011</strong> JW 62 2769.00 5/07/<strong>2011</strong> 9:14 AM 5/07/<strong>2011</strong> 9:16 AM 5/07/<strong>2011</strong> 10:09 AM<br />
5/07/<strong>2011</strong> JW 190 7321.80 5/07/<strong>2011</strong> 3:20 PM 5/07/<strong>2011</strong> 3:25 PM 5/07/<strong>2011</strong> 5:07 PM<br />
5/07/<strong>2011</strong> JW 210 7345.40 5/07/<strong>2011</strong> 8:04 PM 5/07/<strong>2011</strong> 8:09 PM 5/07/<strong>2011</strong> 9:51 PM<br />
6/07/<strong>2011</strong> JW 124 7354.80 6/07/<strong>2011</strong> 5:37 AM 6/07/<strong>2011</strong> 5:45 AM 6/07/<strong>2011</strong> 7:25 AM<br />
6/07/<strong>2011</strong> JW 144 7289.00 6/07/<strong>2011</strong> 1:10 PM 6/07/<strong>2011</strong> 1:17 PM 6/07/<strong>2011</strong> 3:02 PM<br />
6/07/<strong>2011</strong> JW 190 7389.60 6/07/<strong>2011</strong> 3:49 PM 6/07/<strong>2011</strong> 3:57 PM 6/07/<strong>2011</strong> 5:41 PM<br />
6/07/<strong>2011</strong> JW 74 3477.00 6/07/<strong>2011</strong> 5:50 PM 6/07/<strong>2011</strong> 6:04 PM 6/07/<strong>2011</strong> 7:02 PM<br />
6/07/<strong>2011</strong> JW 954 7337.80 6/07/<strong>2011</strong> 9:27 PM 6/07/<strong>2011</strong> 9:30 PM 6/07/<strong>2011</strong> 11:05 PM<br />
7/07/<strong>2011</strong> JW 982 7337.60 7/07/<strong>2011</strong> 2:45 AM 7/07/<strong>2011</strong> 2:49 AM 7/07/<strong>2011</strong> 4:46 AM<br />
7/07/<strong>2011</strong> JW 124 7377.60 7/07/<strong>2011</strong> 6:21 AM 7/07/<strong>2011</strong> 6:26 AM 7/07/<strong>2011</strong> 8:22 AM<br />
7/07/<strong>2011</strong> JW 158 7376.60 7/07/<strong>2011</strong> 10:50 AM 7/07/<strong>2011</strong> 11:02 AM 7/07/<strong>2011</strong> 12:40 PM<br />
7/07/<strong>2011</strong> JW 188 7377.00 7/07/<strong>2011</strong> 2:34 PM 7/07/<strong>2011</strong> 2:40 PM 7/07/<strong>2011</strong> 4:22 PM<br />
7/07/<strong>2011</strong> JW 932 7379.20 7/07/<strong>2011</strong> 4:55 PM 7/07/<strong>2011</strong> 5:02 PM 7/07/<strong>2011</strong> 7:00 PM<br />
11/07/<strong>2011</strong> JW 112 7395.80 11/07/<strong>2011</strong> 10:00 AM 11/07/<strong>2011</strong> 10:12 AM 11/07/<strong>2011</strong> 12:00 PM<br />
11/07/<strong>2011</strong> JW 164 7393.80 11/07/<strong>2011</strong> 12:00 PM 11/07/<strong>2011</strong> 12:06 PM 11/07/<strong>2011</strong> 1:36 PM<br />
11/07/<strong>2011</strong> JW 262 7324.80 11/07/<strong>2011</strong> 10:05 PM 11/07/<strong>2011</strong> 10:10 PM 11/07/<strong>2011</strong> 11:56 PM<br />
12/07/<strong>2011</strong> JW 134 7135.10 12/07/<strong>2011</strong> 7:16 AM 12/07/<strong>2011</strong> 7:21 AM 12/07/<strong>2011</strong> 9:37 AM<br />
12/07/<strong>2011</strong> JW 62 3437.00 12/07/<strong>2011</strong> 11:38 AM 12/07/<strong>2011</strong> 11:46 AM 12/07/<strong>2011</strong> 12:56 PM<br />
12/07/<strong>2011</strong> JW 178 7446.00 12/07/<strong>2011</strong> 1:02 PM 12/07/<strong>2011</strong> 1:09 PM 12/07/<strong>2011</strong> 2:40 PM<br />
12/07/<strong>2011</strong> JW 214 7171.00 12/07/<strong>2011</strong> 6:30 PM 12/07/<strong>2011</strong> 6:35 PM 12/07/<strong>2011</strong> 8:04 PM<br />
12/07/<strong>2011</strong> JW 250 7372.80 12/07/<strong>2011</strong> 9:17 PM 12/07/<strong>2011</strong> 9:24 PM 12/07/<strong>2011</strong> 10:57 PM<br />
13/07/<strong>2011</strong> JW 260 7355.80 13/07/<strong>2011</strong> 12:57 AM 13/07/<strong>2011</strong> 1:02 AM 13/07/<strong>2011</strong> 2:35 AM<br />
13/07/<strong>2011</strong> JW 176 7453.60 13/07/<strong>2011</strong> 12:10 PM 13/07/<strong>2011</strong> 12:15 PM 13/07/<strong>2011</strong> 1:58 PM<br />
13/07/<strong>2011</strong> JW 188 7262.00 13/07/<strong>2011</strong> 3:40 PM 13/07/<strong>2011</strong> 3:50 PM 13/07/<strong>2011</strong> 5:35 PM<br />
14/07/<strong>2011</strong> JW 276 7400.20 14/07/<strong>2011</strong> 1:22 AM 14/07/<strong>2011</strong> 1:30 AM 14/07/<strong>2011</strong> 3:04 AM<br />
14/07/<strong>2011</strong> JW 278 7435.80 14/07/<strong>2011</strong> 3:12 AM 14/07/<strong>2011</strong> 3:20 AM 14/07/<strong>2011</strong> 4:55 AM<br />
14/07/<strong>2011</strong> JW 190 7388.60 14/07/<strong>2011</strong> 1:43 PM 14/07/<strong>2011</strong> 1:52 PM 14/07/<strong>2011</strong> 3:36 PM<br />
14/07/<strong>2011</strong> JW 206 7350.40 14/07/<strong>2011</strong> 5:35 PM 14/07/<strong>2011</strong> 5:45 PM 14/07/<strong>2011</strong> 7:33 PM<br />
14/07/<strong>2011</strong> JW 248 7405.80 14/07/<strong>2011</strong> 11:10 PM 14/07/<strong>2011</strong> 11:15 PM 15/07/<strong>2011</strong> 12:48 AM<br />
15/07/<strong>2011</strong> JW 282 7456.80 15/07/<strong>2011</strong> 3:33 AM 15/07/<strong>2011</strong> 3:40 AM 15/07/<strong>2011</strong> 5:13 AM<br />
15/07/<strong>2011</strong> JW 292 7402.20 15/07/<strong>2011</strong> 5:19 AM 15/07/<strong>2011</strong> 5:26 AM 15/07/<strong>2011</strong> 7:01 AM<br />
15/07/<strong>2011</strong> JW 930 7425.20 15/07/<strong>2011</strong> 8:30 AM 15/07/<strong>2011</strong> 8:36 AM 15/07/<strong>2011</strong> 10:15 AM<br />
15/07/<strong>2011</strong> JW 162 7402.70 15/07/<strong>2011</strong> 11:51 AM 15/07/<strong>2011</strong> 11:58 AM 15/07/<strong>2011</strong> 1:38 PM<br />
15/07/<strong>2011</strong> JW 904 7398.00 15/07/<strong>2011</strong> 3:36 PM 15/07/<strong>2011</strong> 3:41 PM 15/07/<strong>2011</strong> 5:17 PM<br />
15/07/<strong>2011</strong> JW 966 7377.40 15/07/<strong>2011</strong> 10:55 PM 15/07/<strong>2011</strong> 10:57 PM 16/07/<strong>2011</strong> 12:2929 AM<br />
16/07/<strong>2011</strong> JW 136 7424.30 16/07/<strong>2011</strong> 8:31 AM 16/07/<strong>2011</strong> 8:37 AM 16/07/<strong>2011</strong> 10:23 AM<br />
16/07/<strong>2011</strong> JW 958 7403.40 16/07/<strong>2011</strong> 10:47 AM 16/07/<strong>2011</strong> 10:55 AM 16/07/<strong>2011</strong> 12:34 PM<br />
16/07/<strong>2011</strong> JW 176 7286.50 16/07/<strong>2011</strong> 2:27 PM 16/07/<strong>2011</strong> 2:30 PM 16/07/<strong>2011</strong> 4:11 PM<br />
16/07/<strong>2011</strong> JW 74 3439.00 16/07/<strong>2011</strong> 4:25 PM 16/07/<strong>2011</strong> 4:32 PM 16/07/<strong>2011</strong> 5:25 PM<br />
18/07/<strong>2011</strong> JW 920 7449.00 16/07/<strong>2011</strong> 4:50 PM 18/07/<strong>2011</strong> 8:57 PM 18/07/<strong>2011</strong> 10:23 PM<br />
19/07/<strong>2011</strong> JW 912 7222.40 19/07/<strong>2011</strong> 12:50 AM 19/07/<strong>2011</strong> 1:06 AM 19/07/<strong>2011</strong> 2:38 AM<br />
19/07/<strong>2011</strong> JW 918 7459.40 19/07/<strong>2011</strong> 7:27 AM 19/07/<strong>2011</strong> 7:31 AM 19/07/<strong>2011</strong> 9:05 AM<br />
19/07/<strong>2011</strong> JW 982 7417.00 19/07/<strong>2011</strong> 12:25 PM 19/07/<strong>2011</strong> 10:10 PM 19/07/<strong>2011</strong> 11:54 PM<br />
21/07/<strong>2011</strong> JW 986 7390.00 20/07/<strong>2011</strong> 1:05 PM 20/07/<strong>2011</strong> 11:53 PM 21/07/<strong>2011</strong> 1:24 AM<br />
Appendix 1: Rail Transport Records 1
<strong>Wambo</strong> <strong>Coal</strong> Pty Ltd <strong>AEMR</strong> <strong>2011</strong>-<strong>2012</strong><br />
Railed date Train No<br />
Tonnes to Port<br />
ex P/N or QR<br />
Arrival Time Commence Loading Complete Loading<br />
21/07/<strong>2011</strong> JW 988 7408.00 21/07/<strong>2011</strong> 3:40 AM 21/07/<strong>2011</strong> 12:53 PM 21/07/<strong>2011</strong> 2:25 PM<br />
21/07/<strong>2011</strong> JW 74 3567.00 21/07/<strong>2011</strong> 5:15 PM 21/07/<strong>2011</strong> 5:19 PM 21/07/<strong>2011</strong> 6:28 PM<br />
22/07/<strong>2011</strong> JW 924 7295.00 21/07/<strong>2011</strong> 5:20 PM 22/07/<strong>2011</strong> 1:02 PM 22/07/<strong>2011</strong> 2:48 PM<br />
22/07/<strong>2011</strong> JW 74 2992.00 22/07/<strong>2011</strong> 6:20 PM 22/07/<strong>2011</strong> 6:28 PM 22/07/<strong>2011</strong> 7:19 PM<br />
22/07/<strong>2011</strong> JW 944 7358.60 22/07/<strong>2011</strong> 10:06 PM 22/07/<strong>2011</strong> 10:12 PM 22/07/<strong>2011</strong> 11:48 PM<br />
23/07/<strong>2011</strong> JW 980 7373.20 23/07/<strong>2011</strong> 2:30 AM 23/07/<strong>2011</strong> 2:39 AM 23/07/<strong>2011</strong> 4:29 AM<br />
24/07/<strong>2011</strong> JW 962 7348.80 24/07/<strong>2011</strong> 4:36 AM 24/07/<strong>2011</strong> 4:41 AM 24/07/<strong>2011</strong> 6:20 AM<br />
24/07/<strong>2011</strong> JW 146 7416.80 24/07/<strong>2011</strong> 9:20 AM 24/07/<strong>2011</strong> 9:25 AM 24/07/<strong>2011</strong> 11:02 AM<br />
24/07/<strong>2011</strong> JW 970 7313.80 24/07/<strong>2011</strong> 12:45 PM 24/07/<strong>2011</strong> 12:57 PM 24/07/<strong>2011</strong> 2:32 PM<br />
24/07/<strong>2011</strong> JW 918 7377.20 24/07/<strong>2011</strong> 6:55 PM 24/07/<strong>2011</strong> 7:14 PM 24/07/<strong>2011</strong> 9:00 PM<br />
25/07/<strong>2011</strong> JW 934 7401.80 24/07/<strong>2011</strong> 9:30 PM 25/07/<strong>2011</strong> 12:19 AM 25/07/<strong>2011</strong> 1:51 AM<br />
25/07/<strong>2011</strong> JW 904 7371.80 25/07/<strong>2011</strong> 4:51 AM 25/07/<strong>2011</strong> 4:59 AM 25/07/<strong>2011</strong> 6:32 AM<br />
25/07/<strong>2011</strong> / 0 JW 62 3481.00 25/07/<strong>2011</strong> / 0 9:34 AM 25/07/<strong>2011</strong> / 0 9:46 AM 25/07/<strong>2011</strong> / 0 11:00 AM<br />
25/07/<strong>2011</strong> JW 962 7394.20 25/07/<strong>2011</strong> 5:00 PM 25/07/<strong>2011</strong> 5:04 PM 25/07/<strong>2011</strong> 6:36 PM<br />
26/07/<strong>2011</strong> JW 918 7365.00 26/07/<strong>2011</strong> 5:39 AM 26/07/<strong>2011</strong> 5:43 AM 26/07/<strong>2011</strong> 7:15 AM<br />
26/07/<strong>2011</strong> JW 924 7396.20 26/07/<strong>2011</strong> 10:32 AM 26/07/<strong>2011</strong> 10:43 AM 26/07/<strong>2011</strong> 12:17 PM<br />
26/07/<strong>2011</strong> JW 964 7330.50 26/07/<strong>2011</strong> 3:17 PM 26/07/<strong>2011</strong> 3:22 PM 26/07/<strong>2011</strong> 4:53 PM<br />
26/07/<strong>2011</strong> JW 74 3487.00 26/07/<strong>2011</strong> 5:10 PM 26/07/<strong>2011</strong> 5:16 PM 26/07/<strong>2011</strong> 6:43 PM<br />
27/07/<strong>2011</strong> JW 146 7402.60 27/07/<strong>2011</strong> 7:35 AM 27/07/<strong>2011</strong> 7:45 AM 27/07/<strong>2011</strong> 9:20 AM<br />
27/07/<strong>2011</strong> JW 210 7249.80 27/07/<strong>2011</strong> 4:09 PM 27/07/<strong>2011</strong> 4:16 PM 27/07/<strong>2011</strong> 5:49 PM<br />
27/07/<strong>2011</strong> / JW 240 7219.00 27/07/<strong>2011</strong> / 8:38 PM 27/07/<strong>2011</strong> / 8:43 PM 27/07/<strong>2011</strong> / 10:28 PM<br />
28/07/<strong>2011</strong> JW 978 7185.60 28/07/<strong>2011</strong> 1:20 AM 28/07/<strong>2011</strong> 1:25 AM 28/07/<strong>2011</strong> 3:42 AM<br />
28/07/<strong>2011</strong> JW 918 7193.60 28/07/<strong>2011</strong> 4:30 AM 28/07/<strong>2011</strong> 4:37 AM 28/07/<strong>2011</strong> 6:58 AM<br />
28/07/<strong>2011</strong> JW 988 7212.00 28/07/<strong>2011</strong> 12:36 PM 28/07/<strong>2011</strong> 12:42 PM 28/07/<strong>2011</strong> 2:17 PM<br />
28/07/<strong>2011</strong> JW 936 7205.80 28/07/<strong>2011</strong> 8:40 PM 28/07/<strong>2011</strong> 8:47 PM 28/07/<strong>2011</strong> 10:45 PM<br />
29/07/<strong>2011</strong> JW 926 7229.00 29/07/<strong>2011</strong> 7:00 AM 29/07/<strong>2011</strong> 7:12 AM 29/07/<strong>2011</strong> 9:12 AM<br />
29/07/<strong>2011</strong> JW 62 3413.00 29/07/<strong>2011</strong> 11:54 AM 29/07/<strong>2011</strong> 12:05 PM 29/07/<strong>2011</strong> 1:30 PM<br />
29/07/<strong>2011</strong> JW 918 7267.40 29/07/<strong>2011</strong> 11:25 PM 29/07/<strong>2011</strong> 11:43 PM 30/07/<strong>2011</strong> 1:16 AM<br />
30/07/<strong>2011</strong> JW 164 7256.40 30/07/<strong>2011</strong> 3:34 PM 30/07/<strong>2011</strong> 3:37 PM 30/07/<strong>2011</strong> 5:10 PM<br />
30/07/<strong>2011</strong> JW 218 7282.40 30/07/<strong>2011</strong> 10:11 PM 30/07/<strong>2011</strong> 10:19 PM 30/07/<strong>2011</strong> 11:50 PM<br />
1/08/<strong>2011</strong> JW 974 7265.80 1/08/<strong>2011</strong> 4:07 AM 1/08/<strong>2011</strong> 4:36 AM 1/08/<strong>2011</strong> 6:10 AM<br />
1/08/<strong>2011</strong> JW 978 7229.30 1/08/<strong>2011</strong> 2:30 PM 1/08/<strong>2011</strong> 2:37 PM 1/08/<strong>2011</strong> 4:30 PM<br />
1/08/<strong>2011</strong> JW 964 7295.00 1/08/<strong>2011</strong> 11:35 PM 1/08/<strong>2011</strong> 11:43 PM 2/08/<strong>2011</strong> 1:17 AM<br />
2/08/<strong>2011</strong> JW 284 7317.20 2/08/<strong>2011</strong> 4:30 AM 2/08/<strong>2011</strong> 4:36 AM 2/08/<strong>2011</strong> 6:08 AM<br />
2/08/<strong>2011</strong> JW 62 3387.00 2/08/<strong>2011</strong> 8:48 AM 2/08/<strong>2011</strong> 8:58 AM 2/08/<strong>2011</strong> 10:05 AM<br />
2/08/<strong>2011</strong> JW 976 7168.00 2/08/<strong>2011</strong> 12:56 PM 2/08/<strong>2011</strong> 1:00 PM 2/08/<strong>2011</strong> 2:48 PM<br />
2/08/<strong>2011</strong> JW 914 7261.40 2/08/<strong>2011</strong> 8:15 PM 2/08/<strong>2011</strong> 8:22 PM 2/08/<strong>2011</strong> 9:55 PM<br />
2/08/<strong>2011</strong> JW 958 7305.20 2/08/<strong>2011</strong> 11:37 PM 2/08/<strong>2011</strong> 11:43 PM 3/08/<strong>2011</strong> 1:42 AM<br />
3/08/<strong>2011</strong> JW 936 7312.80 3/08/<strong>2011</strong> 6:42 AM 3/08/<strong>2011</strong> 6:47 AM 3/08/<strong>2011</strong> 8:18 AM<br />
3/08/<strong>2011</strong> JW 62 3485.00 3/08/<strong>2011</strong> 9:27 AM 3/08/<strong>2011</strong> 9:34 AM 3/08/<strong>2011</strong> 10:29 AM<br />
3/08/<strong>2011</strong> JW 166 7251.80 3/08/<strong>2011</strong> 11:50 AM 3/08/<strong>2011</strong> 11:56 AM 3/08/<strong>2011</strong> 1:51 PM<br />
3/08/<strong>2011</strong> JW 206 7355.60 3/08/<strong>2011</strong> 3:08 PM 3/08/<strong>2011</strong> 3:15 PM 3/08/<strong>2011</strong> 4:47 PM<br />
4/08/<strong>2011</strong> JW 142 7222.40 4/08/<strong>2011</strong> 8:55 AM 4/08/<strong>2011</strong> 9:14 AM 4/08/<strong>2011</strong> 10:50 AM<br />
4/08/<strong>2011</strong> JW 74 3429.00 4/08/<strong>2011</strong> 4:33 PM 4/08/<strong>2011</strong> 4:40 PM 4/08/<strong>2011</strong> 5:48 PM<br />
5/08/<strong>2011</strong> JW 272 7243.20 5/08/<strong>2011</strong> 1:50 AM 5/08/<strong>2011</strong> 1:55 AM 5/08/<strong>2011</strong> 3:45 AM<br />
5/08/<strong>2011</strong> JW 282 7264.20 5/08/<strong>2011</strong> 4:00 AM 5/08/<strong>2011</strong> 4:04 AM 5/08/<strong>2011</strong> 5:50 AM<br />
5/08/<strong>2011</strong> JW 962 7205.00 5/08/<strong>2011</strong> 1:30 PM 5/08/<strong>2011</strong> 1:37 PM 5/08/<strong>2011</strong> 3:22 PM<br />
5/08/<strong>2011</strong> JW 930 7199.20 5/08/<strong>2011</strong> 7:17 PM 5/08/<strong>2011</strong> 7:24 PM 5/08/<strong>2011</strong> 9:08 PM<br />
5/08/<strong>2011</strong> JW 252 7222.60 5/08/<strong>2011</strong> 11:40 PM 5/08/<strong>2011</strong> 11:44 PM 6/08/<strong>2011</strong> 1:30 AM<br />
6/08/<strong>2011</strong> JW 920 7227.40 6/08/<strong>2011</strong> 5:09 AM 6/08/<strong>2011</strong> 5:16 AM 6/08/<strong>2011</strong> 7:06 AM<br />
6/08/<strong>2011</strong> JW 152 7257.40 6/08/<strong>2011</strong> 12:20 PM 6/08/<strong>2011</strong> 12:25 PM 6/08/<strong>2011</strong> 1:59 PM<br />
6/08/<strong>2011</strong> JW 206 7233.80 6/08/<strong>2011</strong> 10:30 PM 6/08/<strong>2011</strong> 10:35 PM 7/08/<strong>2011</strong> 12:19 AM<br />
Appendix 1: Rail Transport Records 2
<strong>Wambo</strong> <strong>Coal</strong> Pty Ltd <strong>AEMR</strong> <strong>2011</strong>-<strong>2012</strong><br />
Railed date Train No<br />
Tonnes to Port<br />
ex P/N or QR<br />
Arrival Time Commence Loading Complete Loading<br />
7/08/<strong>2011</strong> JW 62 3152.00 7/08/<strong>2011</strong> 9:16 AM 7/08/<strong>2011</strong> 9:26 AM 7/08/<strong>2011</strong> 11:21 AM<br />
7/08/<strong>2011</strong> JW 938 7335.00 7/08/<strong>2011</strong> 11:35 AM 7/08/<strong>2011</strong> 12:07 PM 7/08/<strong>2011</strong> 1:48 PM<br />
8/08/<strong>2011</strong> JW 126 7196.20 8/08/<strong>2011</strong> 5:49 AM 8/08/<strong>2011</strong> 5:53 AM 8/08/<strong>2011</strong> 7:40 AM<br />
8/08/<strong>2011</strong> JW 130 7303.70 8/08/<strong>2011</strong> 7:45 AM 8/08/<strong>2011</strong> 8:00 AM 8/08/<strong>2011</strong> 9:37 AM<br />
8/08/<strong>2011</strong> JW 74 2964.00 8/08/<strong>2011</strong> 5:28 PM 8/08/<strong>2011</strong> 5:32 PM 8/08/<strong>2011</strong> 6:32 PM<br />
16/08/<strong>2011</strong> JW 258 7127.00 stowed 16/08/<strong>2011</strong> 7:21 PM 16/08/<strong>2011</strong> 11:30 PM<br />
16/08/<strong>2011</strong> JW 246 7254.00 16/08/<strong>2011</strong> 7:15 PM 16/08/<strong>2011</strong> 11:45 PM 17/08/<strong>2011</strong> 1:47 AM<br />
17/08/<strong>2011</strong> JW 122 7069.00 17/08/<strong>2011</strong> 6:32 AM 17/08/<strong>2011</strong> 6:38 AM 17/08/<strong>2011</strong> 8:41 AM<br />
17/08/<strong>2011</strong> JW 132 7185.40 17/08/<strong>2011</strong> 8:43 AM 17/08/<strong>2011</strong> 9:04 AM 17/08/<strong>2011</strong> 10:49 AM<br />
17/08/<strong>2011</strong> JW 172 7149.60 17/08/<strong>2011</strong> 1:00 PM 17/08/<strong>2011</strong> 1:06 PM 17/08/<strong>2011</strong> 2:50 PM<br />
17/08/<strong>2011</strong> JW 74 3498.00 17/08/<strong>2011</strong> 6:41 PM 17/08/<strong>2011</strong> 6:44 PM 17/08/<strong>2011</strong> 7:53 PM<br />
18/08/<strong>2011</strong> JW 236 7135.00 18/08/<strong>2011</strong> 1:38 AM 18/08/<strong>2011</strong> 1:43 AM 18/08/<strong>2011</strong> 3:32 AM<br />
18/08/<strong>2011</strong> 0 JW 288 7221.00 18/08/<strong>2011</strong> 0 4:16 AM 18/08/<strong>2011</strong> 0 4:20 AM 18/08/<strong>2011</strong> 0 6:06 AM<br />
18/08/<strong>2011</strong> JW 182 7179.60 18/08/<strong>2011</strong> 1:22 PM 18/08/<strong>2011</strong> 1:27 PM 18/08/<strong>2011</strong> 3:09 PM<br />
18/08/<strong>2011</strong> JW 230 7139.80 18/08/<strong>2011</strong> 7:10 PM 18/08/<strong>2011</strong> 7:17 PM 18/08/<strong>2011</strong> 8:53 PM<br />
18/08/<strong>2011</strong> JW 234 7227.80 18/08/<strong>2011</strong> 9:05 PM 18/08/<strong>2011</strong> 9:11 PM 18/08/<strong>2011</strong> 10:54 PM<br />
19/08/<strong>2011</strong> JW 276 7205.60 19/08/<strong>2011</strong> 2:58 AM 19/08/<strong>2011</strong> 3:05 AM 19/08/<strong>2011</strong> 4:42 AM<br />
19/08/<strong>2011</strong> JW 118 7227.60 19/08/<strong>2011</strong> 6:09 AM 19/08/<strong>2011</strong> 6:16 AM 19/08/<strong>2011</strong> 7:50 AM<br />
19/08/<strong>2011</strong> JW 150 7123.10 19/08/<strong>2011</strong> 8:35 AM 19/08/<strong>2011</strong> 8:41 AM 19/08/<strong>2011</strong> 10:57 AM<br />
19/08/<strong>2011</strong> JW 74 3461.00 19/08/<strong>2011</strong> 5:36 PM 19/08/<strong>2011</strong> 5:45 PM 19/08/<strong>2011</strong> 9:36 PM<br />
19/08/<strong>2011</strong> / JW 226 7135.60 19/08/<strong>2011</strong> / 10:24 PM 19/08/<strong>2011</strong> / 10:28 PM 20/08/<strong>2011</strong> / 12:06 AM<br />
20/08/<strong>2011</strong> JW 260 7074.00 20/08/<strong>2011</strong> 12:55 AM 20/08/<strong>2011</strong> 12:59 AM 20/08/<strong>2011</strong> 2:32 AM<br />
20/08/<strong>2011</strong> JW 110 7172.00 20/08/<strong>2011</strong> 5:04 AM 20/08/<strong>2011</strong> 5:11 AM 20/08/<strong>2011</strong> 6:52 AM<br />
20/08/<strong>2011</strong> JW 188 6955.00 20/08/<strong>2011</strong> 1:25 PM 20/08/<strong>2011</strong> 1:34 PM 20/08/<strong>2011</strong> 3:16 PM<br />
20/08/<strong>2011</strong> JW 204 6962.00 20/08/<strong>2011</strong> 6:05 PM 20/08/<strong>2011</strong> 6:15 PM 20/08/<strong>2011</strong> 7:59 PM<br />
20/08/<strong>2011</strong> JW 220 7165.80 20/08/<strong>2011</strong> 9:37 PM 20/08/<strong>2011</strong> 9:41 PM 20/08/<strong>2011</strong> 11:27 PM<br />
21/08/<strong>2011</strong> JW 62 3375.00 21/08/<strong>2011</strong> 12:01 PM 21/08/<strong>2011</strong> 12:11 PM 21/08/<strong>2011</strong> 1:09 PM<br />
21/08/<strong>2011</strong> JW 206 7067.20 21/08/<strong>2011</strong> 4:15 PM 21/08/<strong>2011</strong> 4:43 PM 21/08/<strong>2011</strong> 6:38 PM<br />
22/08/<strong>2011</strong> JW 74 3416.00 22/08/<strong>2011</strong> 5:33 PM 22/08/<strong>2011</strong> 5:38 PM 22/08/<strong>2011</strong> 6:42 PM<br />
23/08/<strong>2011</strong> JW 150 7105.20 23/08/<strong>2011</strong> 11:58 AM 23/08/<strong>2011</strong> 12:04 PM 23/08/<strong>2011</strong> 1:49 PM<br />
23/08/<strong>2011</strong> JW 74 3416.00 23/08/<strong>2011</strong> 5:53 PM 23/08/<strong>2011</strong> 6:00 PM 23/08/<strong>2011</strong> 6:49 PM<br />
24/08/<strong>2011</strong> JW 194 7187.00 24/08/<strong>2011</strong> 2:45 PM 24/08/<strong>2011</strong> 2:50 PM 24/08/<strong>2011</strong> 4:41 PM<br />
24/08/<strong>2011</strong> JW 224 7101.60 24/08/<strong>2011</strong> 8:58 PM 24/08/<strong>2011</strong> 9:01 PM 24/08/<strong>2011</strong> 10:40 PM<br />
25/08/<strong>2011</strong> JW 942 7124.80 25/08/<strong>2011</strong> 12:48 PM 25/08/<strong>2011</strong> 12:53 PM 25/08/<strong>2011</strong> 2:47 PM<br />
26/08/<strong>2011</strong> JW 988 7185.00 26/08/<strong>2011</strong> 3:53 AM 26/08/<strong>2011</strong> 3:57 AM 26/08/<strong>2011</strong> 5:39 AM<br />
26/08/<strong>2011</strong> JW 904 7179.00 26/08/<strong>2011</strong> 6:10 AM 26/08/<strong>2011</strong> 6:13 AM 26/08/<strong>2011</strong> 7:57 AM<br />
26/08/<strong>2011</strong> JW 944 7119.40 26/08/<strong>2011</strong> 8:48 AM 26/08/<strong>2011</strong> 8:53 AM 26/08/<strong>2011</strong> 10:37 AM<br />
26/08/<strong>2011</strong> JW 74 3429.00 26/08/<strong>2011</strong> 6:42 PM 26/08/<strong>2011</strong> 6:46 PM 26/08/<strong>2011</strong> 7:35 PM<br />
27/08/<strong>2011</strong> JW 970 7120.60 27/08/<strong>2011</strong> 12:01 AM 27/08/<strong>2011</strong> 12:03 AM 27/08/<strong>2011</strong> 1:32 AM<br />
27/08/<strong>2011</strong> JW 940 7190.00 27/08/<strong>2011</strong> 8:58 AM 27/08/<strong>2011</strong> 9:04 AM 27/08/<strong>2011</strong> 10:36 AM<br />
27/08/<strong>2011</strong> JW 74 3417.00 27/08/<strong>2011</strong> 3:30 PM 27/08/<strong>2011</strong> 3:35 PM 27/08/<strong>2011</strong> 4:23 PM<br />
27/08/<strong>2011</strong> JW 968 7223.00 27/08/<strong>2011</strong> 4:32 PM 27/08/<strong>2011</strong> 4:36 PM 27/08/<strong>2011</strong> 6:08 PM<br />
27/08/<strong>2011</strong> JW 940 7155.40 27/08/<strong>2011</strong> 9:15 PM 27/08/<strong>2011</strong> 9:19 PM 27/08/<strong>2011</strong> 10:52 PM<br />
28/08/<strong>2011</strong> JW 986 7110.20 28/08/<strong>2011</strong> 3:20 AM 28/08/<strong>2011</strong> 3:26 AM 28/08/<strong>2011</strong> 4:56 AM<br />
28/08/<strong>2011</strong> JW 152 7176.20 28/08/<strong>2011</strong> 9:24 AM 28/08/<strong>2011</strong> 9:27 AM 28/08/<strong>2011</strong> 10:50 AM<br />
28/08/<strong>2011</strong> JW 162 7128.80 28/08/<strong>2011</strong> 11:27 AM 28/08/<strong>2011</strong> 11:32 AM 28/08/<strong>2011</strong> 12:57 PM<br />
28/08/<strong>2011</strong> JW 182 7138.40 28/08/<strong>2011</strong> 3:24 PM 28/08/<strong>2011</strong> 3:29 PM 28/08/<strong>2011</strong> 4:49 PM<br />
29/08/<strong>2011</strong> JW 978 7196.00 29/08/<strong>2011</strong> 2:36 AM 29/08/<strong>2011</strong> 2:40 AM 29/08/<strong>2011</strong> 4:12 AM<br />
29/08/<strong>2011</strong> JW 912 7193.00 29/08/<strong>2011</strong> 5:37 AM 29/08/<strong>2011</strong> 5:40 AM 29/08/<strong>2011</strong> 7:14 AM<br />
29/08/<strong>2011</strong> JW 62 3405.00 29/08/<strong>2011</strong> 10:50 AM 29/08/<strong>2011</strong> 10:57 AM 29/08/<strong>2011</strong> 11:50 AM<br />
29/08/<strong>2011</strong> JW 160 7146.80 29/08/<strong>2011</strong> 12:48 PM 29/08/<strong>2011</strong> 1:17 PM 29/08/<strong>2011</strong> 2:46 PM<br />
29/08/<strong>2011</strong> JW 256 7182.00 29/08/<strong>2011</strong> 11:20 PM 29/08/<strong>2011</strong> 11:26 PM 30/08/<strong>2011</strong> 12:58 AM<br />
Appendix 1: Rail Transport Records 3
<strong>Wambo</strong> <strong>Coal</strong> Pty Ltd <strong>AEMR</strong> <strong>2011</strong>-<strong>2012</strong><br />
Railed date Train No<br />
Tonnes to Port<br />
ex P/N or QR<br />
Arrival Time Commence Loading Complete Loading<br />
30/08/<strong>2011</strong> JW 934 7128.00 30/08/<strong>2011</strong> 6:48 AM 30/08/<strong>2011</strong> 6:55 AM 30/08/<strong>2011</strong> 8:32 AM<br />
30/08/<strong>2011</strong> JW 168 7143.80 30/08/<strong>2011</strong> 12:20 PM 30/08/<strong>2011</strong> 12:26 PM 30/08/<strong>2011</strong> 2:06 PM<br />
31/08/<strong>2011</strong> JW 974 7183.60 31/08/<strong>2011</strong> 4:15 AM 31/08/<strong>2011</strong> 4:21 AM 31/08/<strong>2011</strong> 5:55 AM<br />
31/08/<strong>2011</strong> JW 174 7216.40 31/08/<strong>2011</strong> 2:48 PM 31/08/<strong>2011</strong> 2:55 PM 31/08/<strong>2011</strong> 4:27 PM<br />
1/09/<strong>2011</strong> JW 144 7322.00 1/09/<strong>2011</strong> 5:30 AM 1/09/<strong>2011</strong> 5:35 AM 1/09/<strong>2011</strong> 7:02 AM<br />
1/09/<strong>2011</strong> JW 62 3394.00 1/09/<strong>2011</strong> 8:49 AM 1/09/<strong>2011</strong> 9:09 AM 1/09/<strong>2011</strong> 9:57 AM<br />
2/09/<strong>2011</strong> JW 940 7272.00 2/09/<strong>2011</strong> 8:40 AM 2/09/<strong>2011</strong> 8:43 AM 2/09/<strong>2011</strong> 10:35 AM<br />
2/09/<strong>2011</strong> JW 192 7247.20 2/09/<strong>2011</strong> 5:22 PM 2/09/<strong>2011</strong> 5:26 PM 2/09/<strong>2011</strong> 8:37 PM<br />
2/09/<strong>2011</strong> JW 74 3190.00 2/09/<strong>2011</strong> 8:50 PM 2/09/<strong>2011</strong> 9:00 PM 2/09/<strong>2011</strong> 11:30 PM<br />
3/09/<strong>2011</strong> JW 956 7308.00 3/09/<strong>2011</strong> 1:46 AM 3/09/<strong>2011</strong> 1:52 AM 3/09/<strong>2011</strong> 3:51 AM<br />
3/09/<strong>2011</strong> JW 154 7264.80 3/09/<strong>2011</strong> 11:18 AM 3/09/<strong>2011</strong> 11:23 AM 3/09/<strong>2011</strong> 1:05 PM<br />
4/09/<strong>2011</strong> JW 248 7064.60 4/09/<strong>2011</strong> 12:42 AM 4/09/<strong>2011</strong> 12:52 AM 4/09/<strong>2011</strong> 2:22 AM<br />
4/09/<strong>2011</strong> 0 JW 910 7274.00 4/09/<strong>2011</strong> 0 2:55 AM 4/09/<strong>2011</strong> 0 3:01 AM 4/09/<strong>2011</strong> 0 4:45 AM<br />
4/09/<strong>2011</strong> JW 976 7108.00 4/09/<strong>2011</strong> 3:06 PM 4/09/<strong>2011</strong> 3:13 PM 4/09/<strong>2011</strong> 4:42 PM<br />
4/09/<strong>2011</strong> JW 220 7234.80 4/09/<strong>2011</strong> 8:28 PM 4/09/<strong>2011</strong> 8:33 PM 4/09/<strong>2011</strong> 10:27 PM<br />
5/09/<strong>2011</strong> JW 138 7307.00 5/09/<strong>2011</strong> 8:18 AM 5/09/<strong>2011</strong> 8:23 AM 5/09/<strong>2011</strong> 9:55 AM<br />
5/09/<strong>2011</strong> JW 172 7282.40 5/09/<strong>2011</strong> 10:46 AM 5/09/<strong>2011</strong> 10:49 AM 5/09/<strong>2011</strong> 12:41 PM<br />
6/09/<strong>2011</strong> JW 950 7273.00 6/09/<strong>2011</strong> 1:19 AM 6/09/<strong>2011</strong> 1:23 AM 6/09/<strong>2011</strong> 2:56 AM<br />
6/09/<strong>2011</strong> JW 954 7286.00 6/09/<strong>2011</strong> 1:14 PM 6/09/<strong>2011</strong> 1:20 PM 6/09/<strong>2011</strong> 2:54 PM<br />
6/09/<strong>2011</strong> JW 74 3413.00 6/09/<strong>2011</strong> 7:09 PM 6/09/<strong>2011</strong> 7:19 PM 6/09/<strong>2011</strong> 8:11 PM<br />
7/09/<strong>2011</strong> / JW 926 7223.60 7/09/<strong>2011</strong> / 9:15 AM 7/09/<strong>2011</strong> / 9:19 AM 7/09/<strong>2011</strong> / 11:12 AM<br />
7/09/<strong>2011</strong> JW 74 3411.00 7/09/<strong>2011</strong> 4:22 PM 7/09/<strong>2011</strong> 4:27 PM 7/09/<strong>2011</strong> 5:17 PM<br />
8/09/<strong>2011</strong> JW 906 7202.40 8/09/<strong>2011</strong> 1:53 PM 8/09/<strong>2011</strong> 1:57 PM 8/09/<strong>2011</strong> 3:44 PM<br />
9/09/<strong>2011</strong> JW 978 7045.60 9/09/<strong>2011</strong> 5:14 AM 9/09/<strong>2011</strong> 5:19 AM 9/09/<strong>2011</strong> 6:52 AM<br />
9/09/<strong>2011</strong> JW 944 7271.80 9/09/<strong>2011</strong> 8:48 AM 9/09/<strong>2011</strong> 8:53 AM 9/09/<strong>2011</strong> 10:26 AM<br />
9/09/<strong>2011</strong> JW 74 3157.00 9/09/<strong>2011</strong> 5:48 PM 9/09/<strong>2011</strong> 5:54 PM 9/09/<strong>2011</strong> 6:59 PM<br />
10/09/<strong>2011</strong> JW 74 3393.00 10/09/<strong>2011</strong> 4:28 PM 10/09/<strong>2011</strong> 4:38 PM 10/09/<strong>2011</strong> 5:32 PM<br />
11/09/<strong>2011</strong> JW 62 3408.0000 11/09/<strong>2011</strong> 9:01 AM 11/09/<strong>2011</strong> 9:05 AM 11/09/<strong>2011</strong> 9:52 AM<br />
12/09/<strong>2011</strong> JW 162 7230.60 stowed 12/09/<strong>2011</strong> 4:49 AM 12/09/<strong>2011</strong> 6:22 AM<br />
12/09/<strong>2011</strong> JW 944 7203.20 12/09/<strong>2011</strong> 6:25 PM 12/09/<strong>2011</strong> 6:37 PM 12/09/<strong>2011</strong> 8:22 PM<br />
13/09/<strong>2011</strong> JW 904 7244.00 13/09/<strong>2011</strong> 4:22 AM 13/09/<strong>2011</strong> 4:28 AM 13/09/<strong>2011</strong> 6:08 AM<br />
13/09/<strong>2011</strong> JW 944 7206.40 13/09/<strong>2011</strong> 10:30 AM 13/09/<strong>2011</strong> 10:35 AM 13/09/<strong>2011</strong> 12:23 PM<br />
13/09/<strong>2011</strong> JW 974 7203.20 13/09/<strong>2011</strong> 12:35 PM 13/09/<strong>2011</strong> 12:43 PM 13/09/<strong>2011</strong> 2:16 PM<br />
13/09/<strong>2011</strong> JW 74 3186.00 13/09/<strong>2011</strong> 5:44 PM 13/09/<strong>2011</strong> 5:53 PM 13/09/<strong>2011</strong> 6:47 PM<br />
13/09/<strong>2011</strong> JW 246 7197.20 13/09/<strong>2011</strong> 8:30 PM 13/09/<strong>2011</strong> 8:36 PM 13/09/<strong>2011</strong> 10:08 PM<br />
14/09/<strong>2011</strong> JW 108 7312.60 14/09/<strong>2011</strong> 1:10 AM 14/09/<strong>2011</strong> 1:31 AM 14/09/<strong>2011</strong> 3:11 AM<br />
14/09/<strong>2011</strong> JW 140 7268.60 14/09/<strong>2011</strong> 8:04 AM 14/09/<strong>2011</strong> 8:11 AM 14/09/<strong>2011</strong> 9:48 AM<br />
14/09/<strong>2011</strong> JW 62 3413.00 14/09/<strong>2011</strong> 11:21 AM 14/09/<strong>2011</strong> 11:29 AM 14/09/<strong>2011</strong> 12:12 PM<br />
14/09/<strong>2011</strong> JW 162 7248.40 14/09/<strong>2011</strong> 12:26 PM 14/09/<strong>2011</strong> 12:31 PM 14/09/<strong>2011</strong> 2:09 PM<br />
15/09/<strong>2011</strong> JW 286 7212.80 15/09/<strong>2011</strong> 2:01 AM 15/09/<strong>2011</strong> 2:17 AM 15/09/<strong>2011</strong> 3:48 AM<br />
15/09/<strong>2011</strong> JW 122 7266.50 15/09/<strong>2011</strong> 5:30 AM 15/09/<strong>2011</strong> 5:37 AM 15/09/<strong>2011</strong> 7:09 AM<br />
15/09/<strong>2011</strong> JW 62 3422.00 15/09/<strong>2011</strong> 9:24 AM 15/09/<strong>2011</strong> 9:30 AM 15/09/<strong>2011</strong> 10:21 AM<br />
15/09/<strong>2011</strong> JW 976 7283.00 15/09/<strong>2011</strong> 11:53 AM 15/09/<strong>2011</strong> 11:56 AM 15/09/<strong>2011</strong> 1:54 PM<br />
16/09/<strong>2011</strong> JW 278 7263.20 16/09/<strong>2011</strong> 1:00 AM 16/09/<strong>2011</strong> 1:05 AM 16/09/<strong>2011</strong> 2:44 AM<br />
18/09/<strong>2011</strong> JW 142 7174.20 18/09/<strong>2011</strong> 11:35 AM 18/09/<strong>2011</strong> 11:41 AM 18/09/<strong>2011</strong> 1:28 PM<br />
19/09/<strong>2011</strong> JW 62 3413.00 19/09/<strong>2011</strong> 9:17 AM 19/09/<strong>2011</strong> 9:25 AM 19/09/<strong>2011</strong> 10:14 AM<br />
20/09/<strong>2011</strong> JW 62 3404.00 20/09/<strong>2011</strong> 9:10 AM 20/09/<strong>2011</strong> 9:19 AM 20/09/<strong>2011</strong> 10:23 AM<br />
21/09/<strong>2011</strong> JW 166 7202.80 Stowed 21/09/<strong>2011</strong> 12:49 PM 21/09/<strong>2011</strong> 2:22 PM<br />
21/09/<strong>2011</strong> JW 74 3417.00 21/09/<strong>2011</strong> 5:53 PM 21/09/<strong>2011</strong> 5:59 PM 21/09/<strong>2011</strong> 6:50 PM<br />
23/09/<strong>2011</strong> JW 62 3406.00 23/09/<strong>2011</strong> 9:25 AM 23/09/<strong>2011</strong> 9:29 AM 23/09/<strong>2011</strong> 10:15 AM<br />
23/09/<strong>2011</strong> JW 132 7266.60 23/09/<strong>2011</strong> 11:10 AM 23/09/<strong>2011</strong> 11:15 AM 23/09/<strong>2011</strong> 12:48 PM<br />
23/09/<strong>2011</strong> JW 240 7290.00 23/09/<strong>2011</strong> 6:47 PM 23/09/<strong>2011</strong> 6:52 PM 23/09/<strong>2011</strong> 8:25 PM<br />
Appendix 1: Rail Transport Records 4
<strong>Wambo</strong> <strong>Coal</strong> Pty Ltd <strong>AEMR</strong> <strong>2011</strong>-<strong>2012</strong><br />
Railed date Train No<br />
Tonnes to Port<br />
ex P/N or QR<br />
Arrival Time Commence Loading Complete Loading<br />
24/01/1900 JW 110 7227.20 24/09/<strong>2011</strong> 4:24 AM 24/09/<strong>2011</strong> 4:30 AM 24/09/<strong>2011</strong> 6:00 AM<br />
24/01/1900 JW 140 7241.00 24/09/<strong>2011</strong> 7:37 AM 24/09/<strong>2011</strong> 7:41 AM 24/09/<strong>2011</strong> 9:18 AM<br />
24/01/1900 JW 156 7239.20 24/09/<strong>2011</strong> 10:13 AM 24/09/<strong>2011</strong> 10:17 AM 24/09/<strong>2011</strong> 11:51 AM<br />
24/01/1900 JW 62 3428.00 24/09/<strong>2011</strong> 2:58 PM 24/09/<strong>2011</strong> 3:03 PM 24/09/<strong>2011</strong> 3:56 PM<br />
24/01/1900 JW 222 7267.00 24/09/<strong>2011</strong> 5:46 PM 24/09/<strong>2011</strong> 5:51 PM 24/09/<strong>2011</strong> 7:24 PM<br />
24/09/<strong>2011</strong> JW 256 7272.60 24/09/<strong>2011</strong> 7:30 PM 24/09/<strong>2011</strong> 7:35 PM 24/09/<strong>2011</strong> 11:15 PM<br />
25/09/<strong>2011</strong> JW 120 7179.20 25/09/<strong>2011</strong> 4:30 AM 25/09/<strong>2011</strong> 8:58 AM 25/09/<strong>2011</strong> 10:50 AM<br />
25/09/<strong>2011</strong> JW 62 3430.00 25/09/<strong>2011</strong> 11:10 AM 25/09/<strong>2011</strong> 11:17 AM 25/09/<strong>2011</strong> 12:07 PM<br />
25/09/<strong>2011</strong> JW 204 7210.80 25/09/<strong>2011</strong> 3:00 PM 25/09/<strong>2011</strong> 3:08 PM 25/09/<strong>2011</strong> 4:40 PM<br />
26/09/<strong>2011</strong> JW 936 7187.40 26/09/<strong>2011</strong> 9:34 AM 26/09/<strong>2011</strong> 9:39 AM 26/09/<strong>2011</strong> 11:17 AM<br />
26/09/<strong>2011</strong> JW 250 7221.00 26/09/<strong>2011</strong> 10:46 PM 26/09/<strong>2011</strong> 10:52 PM 27/09/<strong>2011</strong> 12:27 AM<br />
28/09/<strong>2011</strong> JW 130 7229.80 28/09/<strong>2011</strong> 4:46 AM 28/09/<strong>2011</strong> 4:51 AM 28/09/<strong>2011</strong> 6:31 AM<br />
28/09/<strong>2011</strong> 0 JW 62 3379.00 28/09/<strong>2011</strong> 0 10:00 00 AM 28/09/<strong>2011</strong> 0 10:08 08 AM 28/09/<strong>2011</strong> 0 10:55 AM<br />
28/09/<strong>2011</strong> JW 978 7085.00 28/09/<strong>2011</strong> 12:30 PM 28/09/<strong>2011</strong> 12:42 PM 28/09/<strong>2011</strong> 2:16 PM<br />
28/09/<strong>2011</strong> JW 194 7236.00 28/09/<strong>2011</strong> 2:24 PM 28/09/<strong>2011</strong> 2:33 PM 28/09/<strong>2011</strong> 4:04 PM<br />
29/09/<strong>2011</strong> JW 948 7284.00 29/09/<strong>2011</strong> 12:28 AM 29/09/<strong>2011</strong> 12:34 AM 29/09/<strong>2011</strong> 2:20 AM<br />
29/09/<strong>2011</strong> JW 62 3181.00 29/09/<strong>2011</strong> 8:38 AM 29/09/<strong>2011</strong> 9:02 AM 29/09/<strong>2011</strong> 9:43 AM<br />
29/09/<strong>2011</strong> JW 948 7271.00 29/09/<strong>2011</strong> 10:44 AM 29/09/<strong>2011</strong> 10:48 AM 29/09/<strong>2011</strong> 12:22 PM<br />
30/09/<strong>2011</strong> JW 974 7053.00 30/09/<strong>2011</strong> 6:46 PM 30/09/<strong>2011</strong> 6:56 PM 30/09/<strong>2011</strong> 8:42 PM<br />
1/10/<strong>2011</strong> JW 932 7260.00 1/10/<strong>2011</strong> 7:32 AM 1/10/<strong>2011</strong> 7:37 AM 1/10/<strong>2011</strong> 9:10 AM<br />
1/10/<strong>2011</strong> / JW 910 7244.60 1/10/<strong>2011</strong> / 1:56 PM 1/10/<strong>2011</strong> / 2:03 PM 1/10/<strong>2011</strong> / 3:36 PM<br />
2/10/<strong>2011</strong> JW 988 7233.00 2/10/<strong>2011</strong> 1:16 AM 2/10/<strong>2011</strong> 1:21 AM 2/10/<strong>2011</strong> 2:57 AM<br />
2/10/<strong>2011</strong> JW 190 7250.60 2/10/<strong>2011</strong> 3:00 PM 2/10/<strong>2011</strong> 3:04 PM 2/10/<strong>2011</strong> 4:36 PM<br />
3/10/<strong>2011</strong> JW 954 7270.00 3/10/<strong>2011</strong> 12:19 AM 3/10/<strong>2011</strong> 12:25 AM 3/10/<strong>2011</strong> 2:04 AM<br />
3/10/<strong>2011</strong> JW 114 7247.60 3/10/<strong>2011</strong> 5:09 AM 3/10/<strong>2011</strong> 5:11 AM 3/10/<strong>2011</strong> 6:36 AM<br />
3/10/<strong>2011</strong> JW 50 3394.00 3/10/<strong>2011</strong> 10:25 AM 3/10/<strong>2011</strong> 10:28 AM 3/10/<strong>2011</strong> 11:17 AM<br />
3/10/<strong>2011</strong> JW 940 7216.40 3/10/<strong>2011</strong> 8:09 PM 3/10/<strong>2011</strong> 8:15 PM 3/10/<strong>2011</strong> 9:48 PM<br />
4/10/<strong>2011</strong> JW 922 7197.00 4/10/<strong>2011</strong> 7:51 AM 4/10/<strong>2011</strong> 7:53 AM 4/10/<strong>2011</strong> 9:33 AM<br />
4/10/<strong>2011</strong> JW 150 7246.80 4/10/<strong>2011</strong> 10:35 AM 4/10/<strong>2011</strong> 10:39 AM 4/10/<strong>2011</strong> 12:13 PM<br />
4/10/<strong>2011</strong> JW 62 3412.00 4/10/<strong>2011</strong> 1:30 PM 4/10/<strong>2011</strong> 1:32 PM 4/10/<strong>2011</strong> 2:20 PM<br />
4/10/<strong>2011</strong> JW 978 7127.60 4/10/<strong>2011</strong> 3:00 PM 4/10/<strong>2011</strong> 3:16 PM 4/10/<strong>2011</strong> 5:22 PM<br />
5/10/<strong>2011</strong> JW 982 7003.00 5/10/<strong>2011</strong> 6:30 AM 5/10/<strong>2011</strong> 6:48 AM 5/10/<strong>2011</strong> 8:27 AM<br />
6/10/<strong>2011</strong> JW 938 7199.20 stowed 6/10/<strong>2011</strong> 9:03 AM 6/10/<strong>2011</strong> 10:48 AM<br />
6/10/<strong>2011</strong> JW 990 7237.40 6/10/<strong>2011</strong> 4:01 PM 6/10/<strong>2011</strong> 4:04 PM 6/10/<strong>2011</strong> 5:37 PM<br />
6/10/<strong>2011</strong> JW 960 7024.80 6/10/<strong>2011</strong> 11:59 AM 7/10/<strong>2011</strong> 12:06 AM 7/10/<strong>2011</strong> 1:41 AM<br />
7/10/<strong>2011</strong> JW 158 7207.40 7/10/<strong>2011</strong> 10:25 AM 7/10/<strong>2011</strong> 10:38 AM 7/10/<strong>2011</strong> 12:25 PM<br />
7/10/<strong>2011</strong> JW 178 7233.40 7/10/<strong>2011</strong> 12:33 PM 7/10/<strong>2011</strong> 12:42 PM 7/10/<strong>2011</strong> 2:33 PM<br />
8/10/<strong>2011</strong> JW 282 7277.80 8/10/<strong>2011</strong> 12:54 AM 8/10/<strong>2011</strong> 1:00 AM 8/10/<strong>2011</strong> 2:34 AM<br />
8/10/<strong>2011</strong> JW 146 7207.00 8/10/<strong>2011</strong> 8:00 AM 8/10/<strong>2011</strong> 8:05 AM 8/10/<strong>2011</strong> 9:42 AM<br />
9/10/<strong>2011</strong> JW 278 7224.00 9/10/<strong>2011</strong> 12:42 AM 9/10/<strong>2011</strong> 12:48 AM 9/10/<strong>2011</strong> 2:20 AM<br />
9/10/<strong>2011</strong> JW 116 6964.20 9/10/<strong>2011</strong> 4:47 AM 9/10/<strong>2011</strong> 4:53 AM 9/10/<strong>2011</strong> 6:23 AM<br />
9/10/<strong>2011</strong> JW 150 7182.00 9/10/<strong>2011</strong> 9:14 AM 9/10/<strong>2011</strong> 9:23 AM 9/10/<strong>2011</strong> 10:56 AM<br />
10/10/<strong>2011</strong> JW 124 7160.0000 10/10/<strong>2011</strong> 6:25 AM 10/10/<strong>2011</strong> 6:29 AM 10/10/<strong>2011</strong> 8:18 AM<br />
10/10/<strong>2011</strong> JW 158 7198.60 10/10/<strong>2011</strong> 10:18 AM 10/10/<strong>2011</strong> 10:25 AM 10/10/<strong>2011</strong> 12:05 PM<br />
10/10/<strong>2011</strong> JW 220 7168.80 10/10/<strong>2011</strong> 6:50 PM 10/10/<strong>2011</strong> 6:55 PM 10/10/<strong>2011</strong> 8:54 PM<br />
11/10/<strong>2011</strong> JW 924 7165.20 11/10/<strong>2011</strong> 4:09 AM 11/10/<strong>2011</strong> 4:17 AM 11/10/<strong>2011</strong> 5:50 AM<br />
12/10/<strong>2011</strong> JW 172 7179.40 12/10/<strong>2011</strong> 9:24 PM 12/10/<strong>2011</strong> 9:33 PM 12/10/<strong>2011</strong> 11:07 PM<br />
13/10/<strong>2011</strong> JW 908 7147.60 13/10/<strong>2011</strong> 9:00 AM 13/10/<strong>2011</strong> 9:06 AM 13/10/<strong>2011</strong> 10:37 AM<br />
13/10/<strong>2011</strong> JW 140 7106.80 13/10/<strong>2011</strong> 11:06 AM 13/10/<strong>2011</strong> 11:09 AM 13/10/<strong>2011</strong> 1:00 PM<br />
14/10/<strong>2011</strong> JW 988 7149.20 14/10/<strong>2011</strong> 2:21 AM 14/10/<strong>2011</strong> 2:29 AM 14/10/<strong>2011</strong> 3:59 AM<br />
14/10/<strong>2011</strong> JW 918 7144.80 14/10/<strong>2011</strong> 4:35 AM 14/10/<strong>2011</strong> 9:33 AM 14/10/<strong>2011</strong> 11:05 AM<br />
14/10/<strong>2011</strong> JW 62 3440.00 14/10/<strong>2011</strong> 11:15 AM 14/10/<strong>2011</strong> 11:44 AM 14/10/<strong>2011</strong> 12:47 PM<br />
Appendix 1: Rail Transport Records 5
<strong>Wambo</strong> <strong>Coal</strong> Pty Ltd <strong>AEMR</strong> <strong>2011</strong>-<strong>2012</strong><br />
Railed date Train No<br />
Tonnes to Port<br />
ex P/N or QR<br />
Arrival Time Commence Loading Complete Loading<br />
14/10/<strong>2011</strong> JW 964 7165.20 14/10/<strong>2011</strong> 12:59 PM 14/10/<strong>2011</strong> 1:14 PM 14/10/<strong>2011</strong> 2:47 PM<br />
15/10/<strong>2011</strong> JW 266 7135.00 15/10/<strong>2011</strong> 1:13 AM 15/10/<strong>2011</strong> 1:18 AM 15/10/<strong>2011</strong> 2:51 AM<br />
15/10/<strong>2011</strong> JW 938 7132.00 15/10/<strong>2011</strong> 8:00 AM 15/10/<strong>2011</strong> 8:06 AM 15/10/<strong>2011</strong> 9:38 AM<br />
15/10/<strong>2011</strong> JW 932 7132.80 15/10/<strong>2011</strong> 9:16 AM 15/10/<strong>2011</strong> 9:21 AM 15/10/<strong>2011</strong> 10:54 AM<br />
16/10/<strong>2011</strong> JW 134 7147.80 16/10/<strong>2011</strong> 6:40 AM 16/10/<strong>2011</strong> 6:49 AM 16/10/<strong>2011</strong> 8:22 AM<br />
16/10/<strong>2011</strong> JW 182 7184.00 16/10/<strong>2011</strong> 1:35 PM 16/10/<strong>2011</strong> 1:43 PM 16/10/<strong>2011</strong> 3:34 PM<br />
16/10/<strong>2011</strong> JW 204 7138.40 16/10/<strong>2011</strong> 5:06 AM 16/10/<strong>2011</strong> 5:17 AM 16/10/<strong>2011</strong> 7:12 AM<br />
17/10/<strong>2011</strong> JW 934 7214.00 17/10/<strong>2011</strong> 7:44 AM 17/10/<strong>2011</strong> 7:48 AM 17/10/<strong>2011</strong> 9:17 AM<br />
17/10/<strong>2011</strong> JW 158 7190.85 17/10/<strong>2011</strong> 4:20 PM 17/10/<strong>2011</strong> 4:31 PM 17/10/<strong>2011</strong> 6:04 PM<br />
17/10/<strong>2011</strong> JW 222 7135.60 17/10/<strong>2011</strong> 10:43 PM 17/10/<strong>2011</strong> 10:47 PM 18/10/<strong>2011</strong> 12:24 AM<br />
18/10/<strong>2011</strong> JW 934 7162.20 18/10/<strong>2011</strong> 7:57 AM 18/10/<strong>2011</strong> 8:01 AM 18/10/<strong>2011</strong> 9:38 AM<br />
18/10/<strong>2011</strong> JW 62 3180.00 18/10/<strong>2011</strong> 2:50 PM 18/10/<strong>2011</strong> 3:02 PM 18/10/<strong>2011</strong> 3:46 PM<br />
18/10/<strong>2011</strong> 0 JW 252 7209.00 00 18/10/<strong>2011</strong> 0 9:20 PM 18/10/<strong>2011</strong> 0 9:28 PM 18/10/<strong>2011</strong> 0 11:00 PM<br />
19/10/<strong>2011</strong> JW 104 7164.00 19/10/<strong>2011</strong> 3:25 AM 19/10/<strong>2011</strong> 3:30 AM 19/10/<strong>2011</strong> 5:01 AM<br />
19/10/<strong>2011</strong> JW 122 7211.00 19/10/<strong>2011</strong> 7:52 AM 19/10/<strong>2011</strong> 8:00 AM 19/10/<strong>2011</strong> 9:32 AM<br />
19/10/<strong>2011</strong> JW 902 7205.00 19/10/<strong>2011</strong> 3:27 PM 19/10/<strong>2011</strong> 3:37 PM 19/10/<strong>2011</strong> 5:15 PM<br />
21/10/<strong>2011</strong> JW 958 7130.80 21/10/<strong>2011</strong> 12:10 AM 21/10/<strong>2011</strong> 12:16 AM 21/10/<strong>2011</strong> 2:04 AM<br />
21/10/<strong>2011</strong> JW 274 7222.20 21/10/<strong>2011</strong> 4:20 AM 21/10/<strong>2011</strong> 4:22 AM 21/10/<strong>2011</strong> 6:16 AM<br />
21/10/<strong>2011</strong> JW 922 7214.00 21/10/<strong>2011</strong> 6:25 AM 21/10/<strong>2011</strong> 6:41 AM 21/10/<strong>2011</strong> 8:16 AM<br />
21/10/<strong>2011</strong> JW 138 7217.90 21/10/<strong>2011</strong> 8:30 AM 21/10/<strong>2011</strong> 9:03 AM 21/10/<strong>2011</strong> 10:37 AM<br />
21/10/<strong>2011</strong> / JW 222 7195.80 21/10/<strong>2011</strong> / 6:35 PM 21/10/<strong>2011</strong> / 6:39 PM 21/10/<strong>2011</strong> / 8:19 PM<br />
22/10/<strong>2011</strong> JW 252 7152.70 22/10/<strong>2011</strong> 1:42 AM 22/10/<strong>2011</strong> 1:49 AM 22/10/<strong>2011</strong> 4:05 AM<br />
22/10/<strong>2011</strong> JW 124 7228.80 22/10/<strong>2011</strong> 5:52 AM 22/10/<strong>2011</strong> 6:00 AM 22/10/<strong>2011</strong> 7:38 AM<br />
23/10/<strong>2011</strong> JW 988 7145.00 23/10/<strong>2011</strong> 12:49 AM 23/10/<strong>2011</strong> 12:53 AM 23/10/<strong>2011</strong> 2:34 AM<br />
23/10/<strong>2011</strong> JW 990 7154.80 23/10/<strong>2011</strong> 2:21 PM 23/10/<strong>2011</strong> 2:28 PM 23/10/<strong>2011</strong> 4:03 PM<br />
24/10/<strong>2011</strong> JW 286 7222.05 24/10/<strong>2011</strong> 3:40 AM 24/10/<strong>2011</strong> 3:43 AM 24/10/<strong>2011</strong> 5:34 AM<br />
25/10/<strong>2011</strong> JW 944 7151.80 25/10/<strong>2011</strong> 8:20 AM 25/10/<strong>2011</strong> 8:32 AM 25/10/<strong>2011</strong> 10:29 AM<br />
26/10/<strong>2011</strong> JW 926 7146.4040 stowed 26/10/<strong>2011</strong> 8:48 PM 26/10/<strong>2011</strong> 10:24 PM<br />
27/10/<strong>2011</strong> JW 62 3192.00 27/10/<strong>2011</strong> 8:59 AM 27/10/<strong>2011</strong> 9:41 AM 27/10/<strong>2011</strong> 10:26 AM<br />
27/10/<strong>2011</strong> JW 966 7169.20 27/10/<strong>2011</strong> 5:35 PM 27/10/<strong>2011</strong> 5:42 PM 27/10/<strong>2011</strong> 7:15 PM<br />
28/10/<strong>2011</strong> JW 916 7141.40 28/10/<strong>2011</strong> 5:10 AM 28/10/<strong>2011</strong> 5:16 AM 28/10/<strong>2011</strong> 7:12 AM<br />
2/11/<strong>2011</strong> JW 110 7213.40 stowed 2/11/<strong>2011</strong> 10:47 AM 2/11/<strong>2011</strong> 12:20 PM<br />
2/11/<strong>2011</strong> JW 236 7306.80 2/11/<strong>2011</strong> 10:38 PM 2/11/<strong>2011</strong> 10:43 PM 3/11/<strong>2011</strong> 12:19 AM<br />
4/11/<strong>2011</strong> JW 278 7321.10 4/11/<strong>2011</strong> 1:53 AM 4/11/<strong>2011</strong> 1:58 AM 4/11/<strong>2011</strong> 3:40 AM<br />
4/11/<strong>2011</strong> JW 136 7316.80 4/11/<strong>2011</strong> 6:55 AM 4/11/<strong>2011</strong> 7:18 AM 4/11/<strong>2011</strong> 8:52 AM<br />
5/11/<strong>2011</strong> JW 74 3238.00 5/11/<strong>2011</strong> 4:32 PM 5/11/<strong>2011</strong> 4:40 PM 5/11/<strong>2011</strong> 5:52 PM<br />
6/11/<strong>2011</strong> JW 220 7301.80 6/11/<strong>2011</strong> 7:15 AM 6/11/<strong>2011</strong> 7:20 AM 6/11/<strong>2011</strong> 8:54 AM<br />
9/11/<strong>2011</strong> JW 62 3491.00 9/11/<strong>2011</strong> 9:20 AM 9/11/<strong>2011</strong> 10:49 AM 9/11/<strong>2011</strong> 12:45 PM<br />
13/11/<strong>2011</strong> JW 908 7170.00 stowed 13/11/<strong>2011</strong> 8:28 AM 13/11/<strong>2011</strong> 10:01 AM<br />
13/11/<strong>2011</strong> JW 150 7141.80 13/11/<strong>2011</strong> 10:20 AM 13/11/<strong>2011</strong> 11:11 AM 13/11/<strong>2011</strong> 12:59 PM<br />
13/11/<strong>2011</strong> JW 182 7197.00 13/11/<strong>2011</strong> 2:32 PM 13/11/<strong>2011</strong> 2:40 PM 13/11/<strong>2011</strong> 4:11 PM<br />
13/11/<strong>2011</strong> JW 246 7236.40 13/11/<strong>2011</strong> 6:38 PM 13/11/<strong>2011</strong> 6:43 PM 13/11/<strong>2011</strong> 8:37 PM<br />
14/11/<strong>2011</strong> JW 958 7267.00 14/11/<strong>2011</strong> 12:11 AM 14/11/<strong>2011</strong> 12:27 AM 14/11/<strong>2011</strong> 2:09 AM<br />
15/11/<strong>2011</strong> JW 120 7309.00 15/11/<strong>2011</strong> 9:35 AM 15/11/<strong>2011</strong> 9:39 AM 15/11/<strong>2011</strong> 11:27 AM<br />
15/11/<strong>2011</strong> JW 962 7281.40 15/11/<strong>2011</strong> 5:50 PM 15/11/<strong>2011</strong> 5:55 PM 15/11/<strong>2011</strong> 7:48 PM<br />
15/11/<strong>2011</strong> JW 236 7302.40 15/11/<strong>2011</strong> 10:29 PM 15/11/<strong>2011</strong> 10:33 PM 16/11/<strong>2011</strong> 12:08 AM<br />
16/11/<strong>2011</strong> JW 262 7308.40 16/11/<strong>2011</strong> 12:10 AM 16/11/<strong>2011</strong> 12:21 AM 16/11/<strong>2011</strong> 3:39 AM<br />
16/11/<strong>2011</strong> JW 140 7375.80 16/11/<strong>2011</strong> 9:07 AM 16/11/<strong>2011</strong> 9:11 AM 16/11/<strong>2011</strong> 10:43 AM<br />
16/11/<strong>2011</strong> JW 154 7338.60 16/11/<strong>2011</strong> 11:02 AM 16/11/<strong>2011</strong> 11:07 AM 16/11/<strong>2011</strong> 12:42 PM<br />
16/11/<strong>2011</strong> JW 74 3457.00 16/11/<strong>2011</strong> 4:28 PM 16/11/<strong>2011</strong> 4:31 PM 16/11/<strong>2011</strong> 5:21 PM<br />
16/11/<strong>2011</strong> JW 226 7330.60 16/11/<strong>2011</strong> 7:14 PM 16/11/<strong>2011</strong> 7:47 PM 16/11/<strong>2011</strong> 9:21 PM<br />
17/11/<strong>2011</strong> JW 964 7287.60 17/11/<strong>2011</strong> 4:50 AM 17/11/<strong>2011</strong> 5:00 AM 17/11/<strong>2011</strong> 6:40 AM<br />
Appendix 1: Rail Transport Records 6
<strong>Wambo</strong> <strong>Coal</strong> Pty Ltd <strong>AEMR</strong> <strong>2011</strong>-<strong>2012</strong><br />
Railed date Train No<br />
Tonnes to Port<br />
ex P/N or QR<br />
Arrival Time Commence Loading Complete Loading<br />
17/11/<strong>2011</strong> JW 930 7344.60 17/11/<strong>2011</strong> 6:48 AM 17/11/<strong>2011</strong> 7:21 AM 17/11/<strong>2011</strong> 12:39 PM<br />
17/11/<strong>2011</strong> JW 970 7095.60 17/11/<strong>2011</strong> 10:32 PM 17/11/<strong>2011</strong> 10:40 PM 18/11/<strong>2011</strong> 12:12 AM<br />
19/11/<strong>2011</strong> JW 948 7113.00 19/11/<strong>2011</strong> 6:22 AM 19/11/<strong>2011</strong> 6:28 AM 19/11/<strong>2011</strong> 8:10 AM<br />
20/11/<strong>2011</strong> JW 946 7061.40 20/11/<strong>2011</strong> 12:57 AM 20/11/<strong>2011</strong> 1:03 AM 20/11/<strong>2011</strong> 2:46 AM<br />
20/11/<strong>2011</strong> JW 986 7078.60 20/11/<strong>2011</strong> 11:06 AM 20/11/<strong>2011</strong> 11:14 AM 20/11/<strong>2011</strong> 12:46 PM<br />
20/11/<strong>2011</strong> JW 74 3485.00 20/11/<strong>2011</strong> 5:00 PM 20/11/<strong>2011</strong> 5:24 PM 20/11/<strong>2011</strong> 6:12 PM<br />
29/11/<strong>2011</strong> JW 62 2792.00 29/11/<strong>2011</strong> 9:32 AM 29/11/<strong>2011</strong> 9:36 AM 29/11/<strong>2011</strong> 10:15 AM<br />
30/11/<strong>2011</strong> JW 62 3482.00 30/11/<strong>2011</strong> 9:25 AM 30/11/<strong>2011</strong> 9:38 AM 30/11/<strong>2011</strong> 10:30 AM<br />
2/12/<strong>2011</strong> JW 944 7049.40 2/12/<strong>2011</strong> 7:55 AM 2/12/<strong>2011</strong> 8:00 AM 2/12/<strong>2011</strong> 9:34 AM<br />
3/12/<strong>2011</strong> JW 936 7071.80 3/12/<strong>2011</strong> 6:55 AM 3/12/<strong>2011</strong> 7:00 AM 3/12/<strong>2011</strong> 9:06 AM<br />
3/12/<strong>2011</strong> JW 904 7109.60 3/12/<strong>2011</strong> 5:40 PM 3/12/<strong>2011</strong> 5:44 PM 3/12/<strong>2011</strong> 7:30 PM<br />
4/12/<strong>2011</strong> JW 928 7061.20 4/12/<strong>2011</strong> 6:28 AM 4/12/<strong>2011</strong> 6:34 AM 4/12/<strong>2011</strong> 8:17 AM<br />
4/12/<strong>2011</strong> / JW 922 7079.20 0 4/12/<strong>2011</strong> / 8:10 PM 4/12/<strong>2011</strong> / 8:14 PM 4/12/<strong>2011</strong> / 10:05 05 PM<br />
5/12/<strong>2011</strong> JW 912 7053.40 5/12/<strong>2011</strong> 8:04 AM 5/12/<strong>2011</strong> 8:09 AM 5/12/<strong>2011</strong> 10:01 AM<br />
7/12/<strong>2011</strong> JW 154 7264.60 7/12/<strong>2011</strong> 11:19 AM 7/12/<strong>2011</strong> 11:23 AM 7/12/<strong>2011</strong> 12:57 PM<br />
7/12/<strong>2011</strong> JW 236 7275.00 7/12/<strong>2011</strong> 10:06 PM 7/12/<strong>2011</strong> 10:13 PM 7/12/<strong>2011</strong> 11:46 PM<br />
8/12/<strong>2011</strong> JW 122 7276.60 8/12/<strong>2011</strong> 5:57 AM 8/12/<strong>2011</strong> 6:02 AM 8/12/<strong>2011</strong> 7:41 AM<br />
8/12/<strong>2011</strong> JW 74 3474.00 8/12/<strong>2011</strong> 5:59 PM 8/12/<strong>2011</strong> 6:03 PM 8/12/<strong>2011</strong> 6:50 PM<br />
8/12/<strong>2011</strong> JW 154 7059.80 8/12/<strong>2011</strong> 11:17 PM 8/12/<strong>2011</strong> 11:22 PM 9/12/<strong>2011</strong> 12:52 AM<br />
9/12/<strong>2011</strong> JW 148 7234.20 9/12/<strong>2011</strong> 8:05 AM 9/12/<strong>2011</strong> 8:15 AM 9/12/<strong>2011</strong> 9:47 AM<br />
9/12/<strong>2011</strong> / JW 174 7037.80 9/12/<strong>2011</strong> / 12:14 PM 9/12/<strong>2011</strong> / 12:18 PM 9/12/<strong>2011</strong> / 1:49 PM<br />
10/12/<strong>2011</strong> JW 290 7227.20 10/12/<strong>2011</strong> 2:35 AM 10/12/<strong>2011</strong> 2:42 AM 10/12/<strong>2011</strong> 4:17 AM<br />
10/12/<strong>2011</strong> JW 62 3213.00 10/12/<strong>2011</strong> 10:35 AM 10/12/<strong>2011</strong> 10:53 AM 10/12/<strong>2011</strong> 11:41 AM<br />
11/12/<strong>2011</strong> JW 982 7333.00 stowed 11/12/<strong>2011</strong> 1:49 PM 11/12/<strong>2011</strong> 3:25 PM<br />
11/12/<strong>2011</strong> JW 932 7355.00 stowed 11/12/<strong>2011</strong> 3:52 PM 11/12/<strong>2011</strong> 5:48 PM<br />
12/12/<strong>2011</strong> JW 288 7261.80 12/12/<strong>2011</strong> 3:30 AM 12/12/<strong>2011</strong> 3:38 AM 12/12/<strong>2011</strong> 6:11 AM<br />
12/12/<strong>2011</strong> JW 908 7346.20 12/12/<strong>2011</strong> 7:19 AM 12/12/<strong>2011</strong> 7:24 AM 12/12/<strong>2011</strong> 9:12 AM<br />
12/12/<strong>2011</strong> JW 976 7444.00 12/12/<strong>2011</strong> 1:17 PM 12/12/<strong>2011</strong> 1:22 PM 12/12/<strong>2011</strong> 2:58 PM<br />
12/12/<strong>2011</strong> JW 906 7222.00 stowed 12/12/<strong>2011</strong> 11:56 PM 13/12/<strong>2011</strong> 1:33 AM<br />
13/12/<strong>2011</strong> JW 904 7367.00 stowed 13/12/<strong>2011</strong> 4:54 AM 13/12/<strong>2011</strong> 6:26 AM<br />
13/12/<strong>2011</strong> JW 74 3006.00 13/12/<strong>2011</strong> 4:25 PM 13/12/<strong>2011</strong> 4:31 PM 13/12/<strong>2011</strong> 5:20 PM<br />
13/12/<strong>2011</strong> JW 944 7360.00 stowed 13/12/<strong>2011</strong> 8:58 PM 13/12/<strong>2011</strong> 10:40 PM<br />
14/12/<strong>2011</strong> JW 248 7309.00 stowed 14/12/<strong>2011</strong> 10:16 AM 14/12/<strong>2011</strong> 11:52 AM<br />
14/12/<strong>2011</strong> JW 920 7347.00 14/12/<strong>2011</strong> 8:49 PM 14/12/<strong>2011</strong> 8:57 PM 14/12/<strong>2011</strong> 10:30 PM<br />
15/12/<strong>2011</strong> JW 276 7351.55 15/12/<strong>2011</strong> 1:20 AM 15/12/<strong>2011</strong> 1:45 AM 15/12/<strong>2011</strong> 3:16 AM<br />
15/12/<strong>2011</strong> JW 994 7360.00 15/12/<strong>2011</strong> 2:40 PM 15/12/<strong>2011</strong> 2:46 PM 15/12/<strong>2011</strong> 4:23 PM<br />
16/12/<strong>2011</strong> JW 238 7075.60 16/12/<strong>2011</strong> 1:25 PM 16/12/<strong>2011</strong> 1:28 PM 16/12/<strong>2011</strong> 3:09 PM<br />
16/12/<strong>2011</strong> JW 74 3461.00 16/12/<strong>2011</strong> 5:12 PM 16/12/<strong>2011</strong> 5:20 PM 16/12/<strong>2011</strong> 6:06 PM<br />
16/12/<strong>2011</strong> JW 234 7111.40 16/12/<strong>2011</strong> 7:40 PM 16/12/<strong>2011</strong> 7:49 PM 16/12/<strong>2011</strong> 9:24 PM<br />
17/12/<strong>2011</strong> JW 74 3392.00 17/12/<strong>2011</strong> 3:40 PM 17/12/<strong>2011</strong> 4:12 PM 17/12/<strong>2011</strong> 5:03 PM<br />
17/12/<strong>2011</strong> JW 928 7218.00 17/12/<strong>2011</strong> 5:08 PM 17/12/<strong>2011</strong> 5:21 PM 17/12/<strong>2011</strong> 7:00 PM<br />
20/12/<strong>2011</strong> JW 952 7261.00 20/12/<strong>2011</strong> 1:32 PM 20/12/<strong>2011</strong> 1:37 PM 20/12/<strong>2011</strong> 5:09 PM<br />
21/12/<strong>2011</strong> JW 134 7151.60 21/12/<strong>2011</strong> 7:33 AM 21/12/<strong>2011</strong> 7:43 AM 21/12/<strong>2011</strong> 9:13 AM<br />
21/12/<strong>2011</strong> JW 62 3218.00 21/12/<strong>2011</strong> 9:56 AM 21/12/<strong>2011</strong> 10:02 AM 21/12/<strong>2011</strong> 10:48 AM<br />
21/12/<strong>2011</strong> JW 218 7157.40 21/12/<strong>2011</strong> 5:19 PM 21/12/<strong>2011</strong> 5:22 PM 21/12/<strong>2011</strong> 6:53 PM<br />
22/12/<strong>2011</strong> JW 980 7086.20 22/12/<strong>2011</strong> 2:56 PM 22/12/<strong>2011</strong> 3:01 PM 22/12/<strong>2011</strong> 4:33 PM<br />
22/12/<strong>2011</strong> JW 194 7124.20 22/12/<strong>2011</strong> 6:20 PM 22/12/<strong>2011</strong> 6:29 PM 22/12/<strong>2011</strong> 8:19 PM<br />
22/12/<strong>2011</strong> JW 264 7088.00 22/12/<strong>2011</strong> 11:48 PM 22/12/<strong>2011</strong> 11:53 PM 23/12/<strong>2011</strong> 1:27 AM<br />
23/12/<strong>2011</strong> JW 922 7080.80 23/12/<strong>2011</strong> 6:35 AM 23/12/<strong>2011</strong> 6:40 AM 23/12/<strong>2011</strong> 8:25 AM<br />
23/12/<strong>2011</strong> JW 62 3422.00 23/12/<strong>2011</strong> 10:05 AM 23/12/<strong>2011</strong> 10:08 AM 23/12/<strong>2011</strong> 11:11 AM<br />
23/12/<strong>2011</strong> JW 162 7097.80 23/12/<strong>2011</strong> 11:23 AM 23/12/<strong>2011</strong> 11:33 AM 23/12/<strong>2011</strong> 1:05 PM<br />
23/12/<strong>2011</strong> JW 998 7111.60 23/12/<strong>2011</strong> 4:16 PM 23/12/<strong>2011</strong> 4:19 PM 23/12/<strong>2011</strong> 5:51 PM<br />
Appendix 1: Rail Transport Records 7
<strong>Wambo</strong> <strong>Coal</strong> Pty Ltd <strong>AEMR</strong> <strong>2011</strong>-<strong>2012</strong><br />
Railed date Train No<br />
Tonnes to Port<br />
ex P/N or QR<br />
Arrival Time Commence Loading Complete Loading<br />
24/12/<strong>2011</strong> JW 950 7099.00 24/12/<strong>2011</strong> 12:25 AM 24/12/<strong>2011</strong> 12:33 AM 24/12/<strong>2011</strong> 2:24 AM<br />
24/12/<strong>2011</strong> JW 280 7156.00 24/12/<strong>2011</strong> 2:45 AM 24/12/<strong>2011</strong> 2:53 AM 24/12/<strong>2011</strong> 4:59 AM<br />
24/12/<strong>2011</strong> JW 904 7108.60 24/12/<strong>2011</strong> 5:50 AM 24/12/<strong>2011</strong> 6:40 AM 24/12/<strong>2011</strong> 8:27 AM<br />
24/12/<strong>2011</strong> JW 136 7101.60 24/12/<strong>2011</strong> 11:14 AM 24/12/<strong>2011</strong> 11:21 AM 24/12/<strong>2011</strong> 12:56 PM<br />
24/12/<strong>2011</strong> JW 148 7104.60 24/12/<strong>2011</strong> 1:16 PM 24/12/<strong>2011</strong> 1:34 PM 24/12/<strong>2011</strong> 4:37 PM<br />
26/12/<strong>2011</strong> JW 216 7121.40 26/12/<strong>2011</strong> 7:38 PM 26/12/<strong>2011</strong> 7:48 PM 26/12/<strong>2011</strong> 9:25 PM<br />
26/12/<strong>2011</strong> JW 248 7072.60 26/12/<strong>2011</strong> 9:32 PM 26/12/<strong>2011</strong> 9:45 PM 26/12/<strong>2011</strong> 11:21 PM<br />
26/12/<strong>2011</strong> JW 250 7120.60 26/12/<strong>2011</strong> 11:45 PM 26/12/<strong>2011</strong> 11:52 PM 27/12/<strong>2011</strong> 1:28 AM<br />
27/12/<strong>2011</strong> JW 982 7182.00 27/12/<strong>2011</strong> 9:00 AM 27/12/<strong>2011</strong> 9:13 AM 27/12/<strong>2011</strong> 10:47 AM<br />
27/12/<strong>2011</strong> JW 182 7139.75 27/12/<strong>2011</strong> 12:42 PM 27/12/<strong>2011</strong> 12:45 PM 27/12/<strong>2011</strong> 2:17 PM<br />
27/12/<strong>2011</strong> JW 210 7105.00 27/12/<strong>2011</strong> 4:43 PM 27/12/<strong>2011</strong> 4:45 PM 27/12/<strong>2011</strong> 6:18 PM<br />
27/12/<strong>2011</strong> JW 248 7225.40 27/12/<strong>2011</strong> 8:35 PM 27/12/<strong>2011</strong> 8:42 PM 27/12/<strong>2011</strong> 10:26 PM<br />
28/12/<strong>2011</strong> / JW 118 7123.30 330 28/12/<strong>2011</strong> / 4:43 AM 28/12/<strong>2011</strong> / 4:49 AM 28/12/<strong>2011</strong> / 6:23 AM<br />
28/12/<strong>2011</strong> JW 936 7158.00 28/12/<strong>2011</strong> 11:23 AM 28/12/<strong>2011</strong> 11:33 AM 28/12/<strong>2011</strong> 1:11 PM<br />
28/12/<strong>2011</strong> JW 192 7151.20 28/12/<strong>2011</strong> 4:01 PM 28/12/<strong>2011</strong> 4:13 PM 28/12/<strong>2011</strong> 5:56 PM<br />
28/12/<strong>2011</strong> JW 930 7115.20 28/12/<strong>2011</strong> 10:00 PM 28/12/<strong>2011</strong> 10:15 PM 28/12/<strong>2011</strong> 11:48 PM<br />
28/12/<strong>2011</strong> JW 962 7113.00 28/12/<strong>2011</strong> 11:52 PM 29/12/<strong>2011</strong> 12:48 AM 29/12/<strong>2011</strong> 2:25 AM<br />
30/12/<strong>2011</strong> JW 62 3493.00 30/12/<strong>2011</strong> 8:45 AM 30/12/<strong>2011</strong> 8:55 AM 30/12/<strong>2011</strong> 9:59 AM<br />
31/12/<strong>2011</strong> JW 272 7091.80 31/12/<strong>2011</strong> 2:27 AM 31/12/<strong>2011</strong> 2:31 AM 31/12/<strong>2011</strong> 4:09 AM<br />
31/12/<strong>2011</strong> JW 286 7089.40 31/12/<strong>2011</strong> 4:18 AM 31/12/<strong>2011</strong> 4:21 AM 31/12/<strong>2011</strong> 5:57 AM<br />
1/01/<strong>2012</strong> / JW 194 7105.20 stowed 1/01/<strong>2012</strong> / 12:06 AM 1/01/<strong>2012</strong> / 1:43 AM<br />
1/01/<strong>2012</strong> JW 168 7114.60 1/01/<strong>2012</strong> 11:41 AM 1/01/<strong>2012</strong> 11:48 AM 1/01/<strong>2012</strong> 1:22 PM<br />
2/01/<strong>2012</strong> JW 182 7094.30 stowed 2/01/<strong>2012</strong> 7:50 AM 2/01/<strong>2012</strong> 9:33 AM<br />
2/01/<strong>2012</strong> JW 62 3425.00 2/01/<strong>2012</strong> 9:51 AM 2/01/<strong>2012</strong> 9:56 AM 2/01/<strong>2012</strong> 10:56 AM<br />
2/01/<strong>2012</strong> JW 184 7106.20 2/01/<strong>2012</strong> 1:03 PM 2/01/<strong>2012</strong> 1:08 PM 2/01/<strong>2012</strong> 2:40 PM<br />
2/01/<strong>2012</strong> JW 204 7072.20 2/01/<strong>2012</strong> 6:00 PM 2/01/<strong>2012</strong> 6:07 PM 2/01/<strong>2012</strong> 7:42 PM<br />
3/01/<strong>2012</strong> JW 244 7125.20 2/01/<strong>2012</strong> 8:00 PM 3/01/<strong>2012</strong> 1:14 AM 3/01/<strong>2012</strong> 2:51 AM<br />
3/01/<strong>2012</strong> JW 158 7150.35 3/01/<strong>2012</strong> 3:15 PM 3/01/<strong>2012</strong> 3:30 PM 3/01/<strong>2012</strong> 5:40 PM<br />
4/01/<strong>2012</strong> JW 182 7106.00 4/01/<strong>2012</strong> 1:32 PM 4/01/<strong>2012</strong> 1:37 PM 4/01/<strong>2012</strong> 3:19 PM<br />
5/01/<strong>2012</strong> JW 62 3367.00 5/01/<strong>2012</strong> 9:12 AM 5/01/<strong>2012</strong> 9:19 AM 5/01/<strong>2012</strong> 10:08 AM<br />
8/01/<strong>2012</strong> JW 62 3470.00 8/01/<strong>2012</strong> 11:08 AM 8/01/<strong>2012</strong> 11:20 AM 8/01/<strong>2012</strong> 12:12 PM<br />
10/01/<strong>2012</strong> JW 62 3203.00 10/01/<strong>2012</strong> 11:03 AM 10/01/<strong>2012</strong> 11:20 AM 10/01/<strong>2012</strong> 12:19 PM<br />
11/01/<strong>2012</strong> JW 218 7072.00 stowed 11/01/<strong>2012</strong> 4:47 AM 11/01/<strong>2012</strong> 6:22 AM<br />
11/01/<strong>2012</strong> JW 146 7131.60 stowed 11/01/<strong>2012</strong> 10:59 PM 12/01/<strong>2012</strong> 12:29 AM<br />
12/01/<strong>2012</strong> JW 140 7191.50 12/01/<strong>2012</strong> 8:04 AM 12/01/<strong>2012</strong> 8:09 AM 12/01/<strong>2012</strong> 9:40 AM<br />
12/01/<strong>2012</strong> JW 184 7278.20 12/01/<strong>2012</strong> 12:25 PM 12/01/<strong>2012</strong> 12:32 PM 12/01/<strong>2012</strong> 2:48 PM<br />
12/01/<strong>2012</strong> JW 188 7280.80 12/01/<strong>2012</strong> 5:12 PM 12/01/<strong>2012</strong> 5:20 PM 12/01/<strong>2012</strong> 7:11 PM<br />
12/01/<strong>2012</strong> JW 220 7270.40 12/01/<strong>2012</strong> 7:20 PM 12/01/<strong>2012</strong> 7:44 PM 12/01/<strong>2012</strong> 11:30 PM<br />
13/01/<strong>2012</strong> JW 956 7278.60 12/01/<strong>2012</strong> 11:25 PM 13/01/<strong>2012</strong> 4:22 AM 13/01/<strong>2012</strong> 5:57 AM<br />
13/01/<strong>2012</strong> JW 902 7290.20 13/01/<strong>2012</strong> 6:02 AM 13/01/<strong>2012</strong> 6:33 AM 13/01/<strong>2012</strong> 8:15 AM<br />
13/01/<strong>2012</strong> JW 980 7246.80 13/01/<strong>2012</strong> 2:45 PM 13/01/<strong>2012</strong> 2:51 PM 13/01/<strong>2012</strong> 4:22 PM<br />
15/01/<strong>2012</strong> JW 930 7259.20 stowed 15/01/<strong>2012</strong> 5:30 AM 15/01/<strong>2012</strong> 7:02 AM<br />
15/01/<strong>2012</strong> JW 62 2998.00 15/01/<strong>2012</strong> 9:10 AM 15/01/<strong>2012</strong> 9:17 AM 15/01/<strong>2012</strong> 10:06 AM<br />
16/01/<strong>2012</strong> JW 922 7235.20 16/01/<strong>2012</strong> 8:00 AM 16/01/<strong>2012</strong> 8:09 AM 16/01/<strong>2012</strong> 9:41 AM<br />
17/01/<strong>2012</strong> JW 926 7251.00 17/01/<strong>2012</strong> 4:10 AM 17/01/<strong>2012</strong> 4:16 AM 17/01/<strong>2012</strong> 5:49 AM<br />
18/01/<strong>2012</strong> JW 974 7291.00 17/01/<strong>2012</strong> 11:58 PM 18/01/<strong>2012</strong> 12:04 AM 18/01/<strong>2012</strong> 1:40 AM<br />
18/01/<strong>2012</strong> JW 938 7236.00 18/01/<strong>2012</strong> 9:12 AM 18/01/<strong>2012</strong> 9:19 AM 18/01/<strong>2012</strong> 10:53 AM<br />
18/01/<strong>2012</strong> JW 190 7283.40 18/01/<strong>2012</strong> 9:58 PM 18/01/<strong>2012</strong> 10:03 PM 18/01/<strong>2012</strong> 11:35 PM<br />
19/01/<strong>2012</strong> JW 104 7269.40 19/01/<strong>2012</strong> 6:53 AM 19/01/<strong>2012</strong> 6:59 AM 19/01/<strong>2012</strong> 8:32 AM<br />
19/01/<strong>2012</strong> JW 954 7233.00 19/01/<strong>2012</strong> 9:00 AM 19/01/<strong>2012</strong> 9:32 AM 19/01/<strong>2012</strong> 1:28 PM<br />
20/01/<strong>2012</strong> JW 232 7298.60 20/01/<strong>2012</strong> 9:20 PM 20/01/<strong>2012</strong> 9:29 PM 20/01/<strong>2012</strong> 11:05 PM<br />
21/01/<strong>2012</strong> JW 256 7275.40 21/01/<strong>2012</strong> 1:25 AM 21/01/<strong>2012</strong> 1:31 AM 21/01/<strong>2012</strong> 3:42 AM<br />
Appendix 1: Rail Transport Records 8
<strong>Wambo</strong> <strong>Coal</strong> Pty Ltd <strong>AEMR</strong> <strong>2011</strong>-<strong>2012</strong><br />
Railed date Train No<br />
Tonnes to Port<br />
ex P/N or QR<br />
Arrival Time Commence Loading Complete Loading<br />
21/01/<strong>2012</strong> JW 62 3510.00 21/01/<strong>2012</strong> 10:10 AM 21/01/<strong>2012</strong> 10:15 AM 21/01/<strong>2012</strong> 11:05 AM<br />
21/01/<strong>2012</strong> JW 194 7237.80 21/01/<strong>2012</strong> 11:19 AM 21/01/<strong>2012</strong> 11:40 AM 21/01/<strong>2012</strong> 1:13 PM<br />
21/01/<strong>2012</strong> JW 926 7321.00 21/01/<strong>2012</strong> 4:57 PM 21/01/<strong>2012</strong> 5:02 PM 21/01/<strong>2012</strong> 6:35 PM<br />
22/01/<strong>2012</strong> JW 982 7255.20 22/01/<strong>2012</strong> 2:02 AM 22/01/<strong>2012</strong> 2:07 AM 22/01/<strong>2012</strong> 3:29 AM<br />
22/01/<strong>2012</strong> JW 62 2758.00 22/01/<strong>2012</strong> 8:39 AM 22/01/<strong>2012</strong> 8:45 AM 22/01/<strong>2012</strong> 9:31 AM<br />
22/01/<strong>2012</strong> JW 176 7283.40 22/01/<strong>2012</strong> 10:40 AM 22/01/<strong>2012</strong> 10:52 AM 22/01/<strong>2012</strong> 12:22 PM<br />
22/01/<strong>2012</strong> JW 926 7317.00 22/01/<strong>2012</strong> 6:40 PM 22/01/<strong>2012</strong> 6:47 PM 22/01/<strong>2012</strong> 8:29 PM<br />
23/01/<strong>2012</strong> JW 972 7328.00 23/01/<strong>2012</strong> 12:38 AM 23/01/<strong>2012</strong> 12:43 AM 23/01/<strong>2012</strong> 2:15 AM<br />
23/01/<strong>2012</strong> JW 278 7309.20 23/01/<strong>2012</strong> 2:20 AM 23/01/<strong>2012</strong> 2:33 AM 23/01/<strong>2012</strong> 4:33 AM<br />
23/01/<strong>2012</strong> JW 136 7320.40 23/01/<strong>2012</strong> 7:28 AM 23/01/<strong>2012</strong> 7:35 AM 23/01/<strong>2012</strong> 9:17 AM<br />
23/01/<strong>2012</strong> JW 166 7296.00 23/01/<strong>2012</strong> 11:07 AM 23/01/<strong>2012</strong> 11:13 AM 23/01/<strong>2012</strong> 12:42 PM<br />
23/01/<strong>2012</strong> JW 988 7304.00 23/01/<strong>2012</strong> 4:17 PM 23/01/<strong>2012</strong> 4:22 PM 23/01/<strong>2012</strong> 5:56 PM<br />
23/01/<strong>2012</strong> / 0 JW 262 7260.80 23/01/<strong>2012</strong> / 0 8:488 PM 23/01/<strong>2012</strong> / 0 8:53 PM 23/01/<strong>2012</strong> / 0 10:25 PM<br />
24/01/<strong>2012</strong> JW 990 7268.60 24/01/<strong>2012</strong> 2:56 AM 24/01/<strong>2012</strong> 3:03 AM 24/01/<strong>2012</strong> 4:34 AM<br />
24/01/<strong>2012</strong> JW 950 7275.00 24/01/<strong>2012</strong> 11:38 AM 24/01/<strong>2012</strong> 11:44 AM 24/01/<strong>2012</strong> 1:15 PM<br />
24/01/<strong>2012</strong> JW 182 7300.80 24/01/<strong>2012</strong> 2:12 PM 24/01/<strong>2012</strong> 2:17 PM 24/01/<strong>2012</strong> 3:48 PM<br />
24/01/<strong>2012</strong> JW 74 3453.00 24/01/<strong>2012</strong> 6:42 PM 24/01/<strong>2012</strong> 6:50 PM 24/01/<strong>2012</strong> 7:41 PM<br />
24/01/<strong>2012</strong> JW 228 7296.60 24/01/<strong>2012</strong> 8:14 PM 24/01/<strong>2012</strong> 8:18 PM 24/01/<strong>2012</strong> 9:53 PM<br />
24/01/<strong>2012</strong> JW 256 7309.20 24/01/<strong>2012</strong> 10:21 PM 24/01/<strong>2012</strong> 10:33 PM 25/01/<strong>2012</strong> 12:06 AM<br />
25/01/<strong>2012</strong> JW 62 2744.00 25/01/<strong>2012</strong> 8:55 AM 25/01/<strong>2012</strong> 9:17 AM 25/01/<strong>2012</strong> 9:56 AM<br />
25/01/<strong>2012</strong> / JW 912 7268.00 25/01/<strong>2012</strong> / 3:02 PM 25/01/<strong>2012</strong> / 3:16 PM 25/01/<strong>2012</strong> / 4:52 PM<br />
25/01/<strong>2012</strong> JW 948 7229.00 25/01/<strong>2012</strong> 9:03 PM 25/01/<strong>2012</strong> 9:08 PM 25/01/<strong>2012</strong> 10:42 PM<br />
26/01/<strong>2012</strong> JW 996 7226.00 26/01/<strong>2012</strong> 4:55 PM 26/01/<strong>2012</strong> 4:59 PM 26/01/<strong>2012</strong> 6:33 PM<br />
26/01/<strong>2012</strong> JW 230 7185.00 26/01/<strong>2012</strong> 7:15 PM 26/01/<strong>2012</strong> 7:19 PM 26/01/<strong>2012</strong> 8:50 PM<br />
27/01/<strong>2012</strong> JW 272 7222.60 27/01/<strong>2012</strong> 3:10 AM 27/01/<strong>2012</strong> 3:17 AM 27/01/<strong>2012</strong> 4:49 AM<br />
27/01/<strong>2012</strong> JW 908 7244.00 27/01/<strong>2012</strong> 7:39 AM 27/01/<strong>2012</strong> 7:42 AM 27/01/<strong>2012</strong> 9:13 AM<br />
27/01/<strong>2012</strong> JW 166 7204.00 27/01/<strong>2012</strong> 10:35 AM 27/01/<strong>2012</strong> 10:44 AM 27/01/<strong>2012</strong> 12:20 PM<br />
27/01/<strong>2012</strong> JW 920 7248.00 27/01/<strong>2012</strong> 8:04 PM 27/01/<strong>2012</strong> 8:09 PM 27/01/<strong>2012</strong> 9:49 PM<br />
27/01/<strong>2012</strong> JW 962 7261.00 27/01/<strong>2012</strong> 10:19 PM 27/01/<strong>2012</strong> 10:24 PM 27/01/<strong>2012</strong> 11:53 PM<br />
28/01/<strong>2012</strong> JW 980 7241.00 28/01/<strong>2012</strong> 8:34 AM 28/01/<strong>2012</strong> 8:39 AM 28/01/<strong>2012</strong> 10:20 AM<br />
29/01/<strong>2012</strong> JW 946 7235.00 29/01/<strong>2012</strong> 2:25 AM 29/01/<strong>2012</strong> 2:29 AM 29/01/<strong>2012</strong> 4:09 AM<br />
29/01/<strong>2012</strong> JW 956 7258.00 29/01/<strong>2012</strong> 11:15 AM 29/01/<strong>2012</strong> 11:22 AM 29/01/<strong>2012</strong> 12:52 PM<br />
29/01/<strong>2012</strong> JW 992 7237.00 29/01/<strong>2012</strong> 2:30 PM 29/01/<strong>2012</strong> 2:34 PM 29/01/<strong>2012</strong> 4:06 PM<br />
30/01/<strong>2012</strong> JW 926 7239.00 30/01/<strong>2012</strong> 12:15 AM 30/01/<strong>2012</strong> 12:22 AM 30/01/<strong>2012</strong> 1:57 AM<br />
30/01/<strong>2012</strong> JW 902 7240.00 30/01/<strong>2012</strong> 5:50 AM 30/01/<strong>2012</strong> 5:57 AM 30/01/<strong>2012</strong> 7:30 AM<br />
30/01/<strong>2012</strong> JW 950 7233.00 30/01/<strong>2012</strong> 7:37 AM 30/01/<strong>2012</strong> 7:49 AM 30/01/<strong>2012</strong> 10:32 AM<br />
30/01/<strong>2012</strong> JW 168 7154.60 30/01/<strong>2012</strong> 12:54 PM 30/01/<strong>2012</strong> 12:59 PM 30/01/<strong>2012</strong> 2:34 PM<br />
31/01/<strong>2012</strong> JW 956 7234.00 31/01/<strong>2012</strong> 2:56 AM 31/01/<strong>2012</strong> 3:01 AM 31/01/<strong>2012</strong> 4:34 AM<br />
31/01/<strong>2012</strong> JW 924 7245.00 31/01/<strong>2012</strong> 6:45 AM 31/01/<strong>2012</strong> 6:51 AM 31/01/<strong>2012</strong> 9:19 AM<br />
1/02/<strong>2012</strong> JW 160 7204.00 1/02/<strong>2012</strong> 12:34 PM 1/02/<strong>2012</strong> 1:53 PM 1/02/<strong>2012</strong> 3:32 PM<br />
1/02/<strong>2012</strong> JW 948 7238.00 1/02/<strong>2012</strong> 8:20 PM 1/02/<strong>2012</strong> 8:28 PM 1/02/<strong>2012</strong> 10:15 PM<br />
2/02/<strong>2012</strong> JW 134 7182.80 2/02/<strong>2012</strong> 10:30 AM 2/02/<strong>2012</strong> 12:27 PM 2/02/<strong>2012</strong> 1:58 PM<br />
2/02/<strong>2012</strong> JW 984 7258.00 2/02/<strong>2012</strong> 2:15 PM 2/02/<strong>2012</strong> 2:29 PM 2/02/<strong>2012</strong> 4:06 PM<br />
2/02/<strong>2012</strong> JW 950 7221.00 2/02/<strong>2012</strong> 11:48 PM 2/02/<strong>2012</strong> 11:54 PM 3/02/<strong>2012</strong> 1:28 AM<br />
3/02/<strong>2012</strong> JW 132 7237.95 3/02/<strong>2012</strong> 6:00 AM 3/02/<strong>2012</strong> 6:04 AM 3/02/<strong>2012</strong> 7:36 AM<br />
3/02/<strong>2012</strong> JW 200 7171.30 3/02/<strong>2012</strong> 2:33 PM 3/02/<strong>2012</strong> 2:41 PM 3/02/<strong>2012</strong> 4:17 PM<br />
3/02/<strong>2012</strong> JW 926 7244.00 3/02/<strong>2012</strong> 6:22 PM 3/02/<strong>2012</strong> 6:30 PM 3/02/<strong>2012</strong> 8:02 PM<br />
3/02/<strong>2012</strong> JW 974 7246.00 3/02/<strong>2012</strong> 10:05 PM 3/02/<strong>2012</strong> 10:10 PM 3/02/<strong>2012</strong> 11:44 PM<br />
4/02/<strong>2012</strong> JW 908 7256.00 4/02/<strong>2012</strong> 1:50 AM 4/02/<strong>2012</strong> 2:02 AM 4/02/<strong>2012</strong> 3:39 AM<br />
4/02/<strong>2012</strong> JW 950 7241.00 4/02/<strong>2012</strong> 9:54 AM 4/02/<strong>2012</strong> 10:00 AM 4/02/<strong>2012</strong> 11:37 AM<br />
4/02/<strong>2012</strong> JW 912 7239.00 4/02/<strong>2012</strong> 7:40 PM 4/02/<strong>2012</strong> 7:48 PM 4/02/<strong>2012</strong> 9:28 PM<br />
5/02/<strong>2012</strong> JW 990 7247.00 5/02/<strong>2012</strong> 1:20 AM 5/02/<strong>2012</strong> 1:24 AM 5/02/<strong>2012</strong> 2:56 AM<br />
Appendix 1: Rail Transport Records 9
<strong>Wambo</strong> <strong>Coal</strong> Pty Ltd <strong>AEMR</strong> <strong>2011</strong>-<strong>2012</strong><br />
Railed date Train No<br />
Tonnes to Port<br />
ex P/N or QR<br />
Arrival Time Commence Loading Complete Loading<br />
5/02/<strong>2012</strong> JW 954 7183.40 5/02/<strong>2012</strong> 9:38 AM 5/02/<strong>2012</strong> 9:43 AM 5/02/<strong>2012</strong> 11:16 AM<br />
5/02/<strong>2012</strong> JW 916 7180.60 5/02/<strong>2012</strong> 11:00 PM 5/02/<strong>2012</strong> 11:17 PM 6/02/<strong>2012</strong> 1:00 AM<br />
6/02/<strong>2012</strong> JW 910 7184.00 6/02/<strong>2012</strong> 2:48 PM 6/02/<strong>2012</strong> 2:54 PM 6/02/<strong>2012</strong> 4:32 PM<br />
6/02/<strong>2012</strong> JW 996 7173.00 6/02/<strong>2012</strong> 4:44 PM 6/02/<strong>2012</strong> 4:50 PM 6/02/<strong>2012</strong> 6:26 PM<br />
7/02/<strong>2012</strong> JW 974 7231.00 7/02/<strong>2012</strong> 12:24 AM 7/02/<strong>2012</strong> 12:36 AM 7/02/<strong>2012</strong> 2:11 AM<br />
7/02/<strong>2012</strong> JW 904 7230.0000 7/02/<strong>2012</strong> 6:10 AM 7/02/<strong>2012</strong> 6:16 AM 7/02/<strong>2012</strong> 8:06 AM<br />
7/02/<strong>2012</strong> JW 62 3216.00 7/02/<strong>2012</strong> 8:55 AM 7/02/<strong>2012</strong> 9:21 AM 7/02/<strong>2012</strong> 10:18 AM<br />
7/02/<strong>2012</strong> JW 928 7226.00 7/02/<strong>2012</strong> 6:40 PM 7/02/<strong>2012</strong> 6:45 PM 7/02/<strong>2012</strong> 8:31 PM<br />
8/02/<strong>2012</strong> JW 918 7208.80 8/02/<strong>2012</strong> 7:23 AM 8/02/<strong>2012</strong> 7:48 AM 8/02/<strong>2012</strong> 9:21 AM<br />
8/02/<strong>2012</strong> JW 62 3261.00 8/02/<strong>2012</strong> 9:25 AM 8/02/<strong>2012</strong> 9:39 AM 8/02/<strong>2012</strong> 10:34 AM<br />
8/02/<strong>2012</strong> JW 938 7170.80 8/02/<strong>2012</strong> 12:38 PM 8/02/<strong>2012</strong> 12:43 PM 8/02/<strong>2012</strong> 2:22 PM<br />
9/02/<strong>2012</strong> JW 932 7251.00 9/02/<strong>2012</strong> 6:30 AM 9/02/<strong>2012</strong> 6:51 AM 9/02/<strong>2012</strong> 8:35 AM<br />
10/02/<strong>2012</strong> / 0 JW 948 7179.60 960 10/02/<strong>2012</strong> / 0 10:21 AM 10/02/<strong>2012</strong> / 0 10:28 AM 10/02/<strong>2012</strong> / 0 11:59 AM<br />
10/02/<strong>2012</strong> JW 940 7236.00 10/02/<strong>2012</strong> 7:46 PM 10/02/<strong>2012</strong> 7:52 PM 10/02/<strong>2012</strong> 9:32 PM<br />
10/02/<strong>2012</strong> JW 74 3206.00 10/02/<strong>2012</strong> 4:18 PM 10/02/<strong>2012</strong> 4:27 PM 10/02/<strong>2012</strong> 5:14 PM<br />
11/02/<strong>2012</strong> JW 912 7201.80 11/02/<strong>2012</strong> 7:20 PM 11/02/<strong>2012</strong> 7:34 PM 11/02/<strong>2012</strong> 9:07 PM<br />
12/02/<strong>2012</strong> JW 904 7185.40 12/02/<strong>2012</strong> 5:35 AM 12/02/<strong>2012</strong> 5:42 AM 12/02/<strong>2012</strong> 7:21 AM<br />
13/02/<strong>2012</strong> JW 154 7211.20 13/02/<strong>2012</strong> 12:08 AM 13/02/<strong>2012</strong> 12:10 AM 13/02/<strong>2012</strong> 1:42 AM<br />
13/02/<strong>2012</strong> JW 992 7185.60 13/02/<strong>2012</strong> 2:13 AM 13/02/<strong>2012</strong> 2:17 AM 13/02/<strong>2012</strong> 3:57 AM<br />
13/02/<strong>2012</strong> JW 962 7235.00 13/02/<strong>2012</strong> 10:35 AM 13/02/<strong>2012</strong> 10:39 AM 13/02/<strong>2012</strong> 12:11 PM<br />
13/02/<strong>2012</strong> / JW 102 7200.40 13/02/<strong>2012</strong> / 11:24 PM 13/02/<strong>2012</strong> / 11:29 PM 14/02/<strong>2012</strong> / 1:01 AM<br />
14/02/<strong>2012</strong> JW 996 7202.00 14/02/<strong>2012</strong> 2:45 PM 14/02/<strong>2012</strong> 2:52 PM 14/02/<strong>2012</strong> 4:24 PM<br />
15/02/<strong>2012</strong> JW 926 7206.40 15/02/<strong>2012</strong> 11:34 AM 15/02/<strong>2012</strong> 11:44 AM 15/02/<strong>2012</strong> 1:20 PM<br />
15/02/<strong>2012</strong> JW 74 3453.00 15/02/<strong>2012</strong> 4:57 PM 15/02/<strong>2012</strong> 5:05 PM 15/02/<strong>2012</strong> 5:58 PM<br />
16/02/<strong>2012</strong> JW 958 2902.20 16/02/<strong>2012</strong> 3:28 AM 16/02/<strong>2012</strong> 3:36 AM 16/02/<strong>2012</strong> 5:00 AM<br />
16/02/<strong>2012</strong> JW 966 7174.20 16/02/<strong>2012</strong> 5:18 AM 16/02/<strong>2012</strong> 5:26 AM 16/02/<strong>2012</strong> 7:19 AM<br />
16/02/<strong>2012</strong> JW 934 7187.80 16/02/<strong>2012</strong> 7:26 AM 16/02/<strong>2012</strong> 7:31 AM 16/02/<strong>2012</strong> 9:25 AM<br />
16/02/<strong>2012</strong> JW 960 7234.00 16/02/<strong>2012</strong> 3:03 PM 16/02/<strong>2012</strong> 3:10 PM 16/02/<strong>2012</strong> 4:52 PM<br />
17/02/<strong>2012</strong> JW 956 7231.00 17/02/<strong>2012</strong> 12:27 AM 17/02/<strong>2012</strong> 12:32 AM 17/02/<strong>2012</strong> 2:04 AM<br />
17/02/<strong>2012</strong> JW 906 7198.40 17/02/<strong>2012</strong> 7:35 AM 17/02/<strong>2012</strong> 7:40 AM 17/02/<strong>2012</strong> 9:17 AM<br />
18/02/<strong>2012</strong> JW 226 7191.80 18/02/<strong>2012</strong> 3:15 AM 18/02/<strong>2012</strong> 3:23 AM 18/02/<strong>2012</strong> 4:57 AM<br />
18/02/<strong>2012</strong> JW 120 7175.20 18/02/<strong>2012</strong> 4:40 PM 18/02/<strong>2012</strong> 4:45 PM 18/02/<strong>2012</strong> 6:28 PM<br />
19/02/<strong>2012</strong> JW 978 7193.40 19/02/<strong>2012</strong> 1:00 AM 19/02/<strong>2012</strong> 1:12 AM 19/02/<strong>2012</strong> 2:45 AM<br />
19/02/<strong>2012</strong> JW 62 2569.00 19/02/<strong>2012</strong> 10:06 AM 19/02/<strong>2012</strong> 11:17 AM 19/02/<strong>2012</strong> 11:53 AM<br />
19/02/<strong>2012</strong> JW 920 7177.00 19/02/<strong>2012</strong> 5:03 PM 19/02/<strong>2012</strong> 5:09 PM 19/02/<strong>2012</strong> 6:43 PM<br />
19/02/<strong>2012</strong> JW 226 7234.00 stowed 19/02/<strong>2012</strong> 7:10 PM 19/02/<strong>2012</strong> 8:53 PM<br />
19/02/<strong>2012</strong> JW 262 7208.80 19/02/<strong>2012</strong> 11:22 PM 19/02/<strong>2012</strong> 11:30 PM 20/02/<strong>2012</strong> 1:07 AM<br />
20/02/<strong>2012</strong> JW 922 7193.80 20/02/<strong>2012</strong> 8:28 AM 20/02/<strong>2012</strong> 8:33 AM 20/02/<strong>2012</strong> 10:05 AM<br />
20/02/<strong>2012</strong> JW 162 7190.60 20/02/<strong>2012</strong> 10:43 AM 20/02/<strong>2012</strong> 11:07 AM 20/02/<strong>2012</strong> 12:38 PM<br />
20/02/<strong>2012</strong> JW 190 7157.80 20/02/<strong>2012</strong> 2:43 PM 20/02/<strong>2012</strong> 2:49 PM 20/02/<strong>2012</strong> 4:22 PM<br />
20/02/<strong>2012</strong> JW 74 3441.00 20/02/<strong>2012</strong> 4:25 PM 20/02/<strong>2012</strong> 4:35 PM 20/02/<strong>2012</strong> 5:23 PM<br />
20/02/<strong>2012</strong> JW 222 7211.40 20/02/<strong>2012</strong> 6:02 PM 20/02/<strong>2012</strong> 6:08 PM 20/02/<strong>2012</strong> 7:48 PM<br />
21/02/<strong>2012</strong> JW 126 7217.00 21/02/<strong>2012</strong> 4:15 AM 21/02/<strong>2012</strong> 4:21 AM 21/02/<strong>2012</strong> 5:54 AM<br />
21/02/<strong>2012</strong> JW 150 7203.20 21/02/<strong>2012</strong> 9:30 AM 21/02/<strong>2012</strong> 9:36 AM 21/02/<strong>2012</strong> 11:12 AM<br />
21/02/<strong>2012</strong> JW 966 7195.20 21/02/<strong>2012</strong> 12:04 PM 21/02/<strong>2012</strong> 12:09 PM 21/02/<strong>2012</strong> 1:47 PM<br />
21/02/<strong>2012</strong> JW 202 7215.40 21/02/<strong>2012</strong> 3:08 PM 21/02/<strong>2012</strong> 3:31 PM 21/02/<strong>2012</strong> 5:02 PM<br />
21/02/<strong>2012</strong> JW 74 3399.00 21/02/<strong>2012</strong> 5:46 PM 21/02/<strong>2012</strong> 6:02 PM 21/02/<strong>2012</strong> 6:55 PM<br />
21/02/<strong>2012</strong> JW 246 7198.40 21/02/<strong>2012</strong> 9:50 PM 21/02/<strong>2012</strong> 9:59 PM 21/02/<strong>2012</strong> 11:36 PM<br />
22/02/<strong>2012</strong> JW 980 7207.40 22/02/<strong>2012</strong> 12:06 AM 22/02/<strong>2012</strong> 12:16 AM 22/02/<strong>2012</strong> 2:08 AM<br />
22/02/<strong>2012</strong> JW 62 3377.00 22/02/<strong>2012</strong> 9:08 AM 22/02/<strong>2012</strong> 9:22 AM 22/02/<strong>2012</strong> 10:14 AM<br />
22/02/<strong>2012</strong> JW 902 7235.40 22/02/<strong>2012</strong> 2:06 PM 22/02/<strong>2012</strong> 2:17 PM 22/02/<strong>2012</strong> 3:59 PM<br />
22/02/<strong>2012</strong> JW 928 7320.20 22/02/<strong>2012</strong> 4:00 PM 22/02/<strong>2012</strong> 7:46 PM 22/02/<strong>2012</strong> 9:19 PM<br />
Appendix 1: Rail Transport Records 10
<strong>Wambo</strong> <strong>Coal</strong> Pty Ltd <strong>AEMR</strong> <strong>2011</strong>-<strong>2012</strong><br />
Railed date Train No<br />
Tonnes to Port<br />
ex P/N or QR<br />
Arrival Time Commence Loading Complete Loading<br />
23/02/<strong>2012</strong> JW 948 7304.20 23/02/<strong>2012</strong> 8:35 AM 23/02/<strong>2012</strong> 8:44 AM 23/02/<strong>2012</strong> 10:19 AM<br />
24/02/<strong>2012</strong> JW 956 7263.40 stowed 23/02/<strong>2012</strong> 2:50 AM 23/02/<strong>2012</strong> 4:24 AM<br />
24/02/<strong>2012</strong> JW 62 3396.00 24/02/<strong>2012</strong> 9:32 AM 24/02/<strong>2012</strong> 9:41 AM 24/02/<strong>2012</strong> 10:34 AM<br />
24/02/<strong>2012</strong> JW 964 7283.00 24/02/<strong>2012</strong> 11:10 AM 24/02/<strong>2012</strong> 11:15 AM 24/02/<strong>2012</strong> 12:47 PM<br />
24/02/<strong>2012</strong> JW 994 7258.40 24/02/<strong>2012</strong> 3:44 PM 24/02/<strong>2012</strong> 3:46 PM 24/02/<strong>2012</strong> 5:21 PM<br />
25/02/<strong>2012</strong> JW 962 7258.00 stowed 25/02/<strong>2012</strong> 3:55 AM 25/02/<strong>2012</strong> 5:36 AM<br />
26/02/<strong>2012</strong> JW 910 7257.40 stowed 26/02/<strong>2012</strong> 4:58 AM 26/02/<strong>2012</strong> 6:31 AM<br />
26/02/<strong>2012</strong> JW 926 7302.80 26/02/<strong>2012</strong> 11:22 AM 26/02/<strong>2012</strong> 11:32 AM 26/02/<strong>2012</strong> 1:06 PM<br />
27/02/<strong>2012</strong> JW 964 7265.20 27/02/<strong>2012</strong> 1:40 AM 27/02/<strong>2012</strong> 1:47 AM 27/02/<strong>2012</strong> 3:17 AM<br />
27/02/<strong>2012</strong> JW 902 7281.40 27/02/<strong>2012</strong> 6:14 AM 27/02/<strong>2012</strong> 6:22 AM 27/02/<strong>2012</strong> 8:13 AM<br />
27/02/<strong>2012</strong> JW 62 3260.00 27/02/<strong>2012</strong> 9:05 AM 27/02/<strong>2012</strong> 9:10 AM 27/02/<strong>2012</strong> 10:55 AM<br />
28/02/<strong>2012</strong> JW 942 7269.20 28/02/<strong>2012</strong> 7:45 AM 28/02/<strong>2012</strong> 7:50 AM 28/02/<strong>2012</strong> 9:20 AM<br />
28/02/<strong>2012</strong> / 0 JW 982 7261.50 28/02/<strong>2012</strong> / 0 1:26 PM 28/02/<strong>2012</strong> / 0 1:34 PM 28/02/<strong>2012</strong> / 0 3:10 PM<br />
1/03/<strong>2012</strong> JW 998 7243.60 stowed 1/03/<strong>2012</strong> 10:55 AM 1/03/<strong>2012</strong> 12:49 PM<br />
1/03/<strong>2012</strong> JW 916 7329.80 1/03/<strong>2012</strong> 2:20 PM 1/03/<strong>2012</strong> 2:48 PM 1/03/<strong>2012</strong> 4:19 PM<br />
2/03/<strong>2012</strong> JW 986 7335.00 2/03/<strong>2012</strong> 4:45 PM 2/03/<strong>2012</strong> 4:51 PM 2/03/<strong>2012</strong> 6:44 PM<br />
2/03/<strong>2012</strong> JW 922 7329.00 2/03/<strong>2012</strong> 6:55 PM 2/03/<strong>2012</strong> 7:19 PM 2/03/<strong>2012</strong> 8:54 PM<br />
3/03/<strong>2012</strong> JW 932 7278.20 3/03/<strong>2012</strong> 12:35 AM 3/03/<strong>2012</strong> 12:42 AM 3/03/<strong>2012</strong> 2:23 AM<br />
3/03/<strong>2012</strong> JW 942 7246.00 3/03/<strong>2012</strong> 8:10 AM 3/03/<strong>2012</strong> 8:18 AM 3/03/<strong>2012</strong> 9:57 AM<br />
3/03/<strong>2012</strong> JW 920 7274.60 3/03/<strong>2012</strong> 10:05 AM 3/03/<strong>2012</strong> 10:14 AM 3/03/<strong>2012</strong> 11:46 AM<br />
3/03/<strong>2012</strong> / JW 178 7204.60 3/03/<strong>2012</strong> / 11:45 AM 3/03/<strong>2012</strong> / 12:12 PM 3/03/<strong>2012</strong> / 1:47 PM<br />
3/03/<strong>2012</strong> JW 226 7245.45 3/03/<strong>2012</strong> 8:18 PM 3/03/<strong>2012</strong> 8:22 PM 3/03/<strong>2012</strong> 9:56 PM<br />
4/03/<strong>2012</strong> JW 252 7240.00 4/03/<strong>2012</strong> 4:30 AM 4/03/<strong>2012</strong> 4:38 AM 4/03/<strong>2012</strong> 6:13 AM<br />
4/03/<strong>2012</strong> JW 912 7274.20 4/03/<strong>2012</strong> 6:20 AM 4/03/<strong>2012</strong> 6:31 AM 4/03/<strong>2012</strong> 8:03 AM<br />
4/03/<strong>2012</strong> JW 62 3231.00 4/03/<strong>2012</strong> 11:40 AM 4/03/<strong>2012</strong> 11:50 AM 4/03/<strong>2012</strong> 12:39 PM<br />
4/03/<strong>2012</strong> JW 192 7270.10 4/03/<strong>2012</strong> 3:50 PM 4/03/<strong>2012</strong> 4:01 PM 4/03/<strong>2012</strong> 6:13 PM<br />
4/03/<strong>2012</strong> JW 216 7270.00 4/03/<strong>2012</strong> 6:15 PM 4/03/<strong>2012</strong> 9:47 PM 4/03/<strong>2012</strong> 11:25 PM<br />
5/03/<strong>2012</strong> JW 274 7293.2525 5/03/<strong>2012</strong> 4:03 AM 5/03/<strong>2012</strong> 4:08 AM 5/03/<strong>2012</strong> 5:49 AM<br />
5/03/<strong>2012</strong> JW 136 7254.35 5/03/<strong>2012</strong> 10:00 AM 5/03/<strong>2012</strong> 10:09 AM 5/03/<strong>2012</strong> 11:44 AM<br />
5/03/<strong>2012</strong> JW 938 7243.60 5/03/<strong>2012</strong> 1:31 PM 5/03/<strong>2012</strong> 1:41 PM 5/03/<strong>2012</strong> 7:11 PM<br />
6/03/<strong>2012</strong> JW 234 7225.80 6/03/<strong>2012</strong> 12:31 AM 6/03/<strong>2012</strong> 12:33 AM 6/03/<strong>2012</strong> 2:05 AM<br />
6/03/<strong>2012</strong> JW 276 7262.35 6/03/<strong>2012</strong> 5:42 AM 6/03/<strong>2012</strong> 5:49 AM 6/03/<strong>2012</strong> 7:22 AM<br />
6/03/<strong>2012</strong> JW 62 3420.00 6/03/<strong>2012</strong> 9:25 AM 6/03/<strong>2012</strong> 9:33 AM 6/03/<strong>2012</strong> 10:25 AM<br />
7/03/<strong>2012</strong> JW 974 7268.40 7/03/<strong>2012</strong> 3:21 AM 7/03/<strong>2012</strong> 3:26 AM 7/03/<strong>2012</strong> 4:59 AM<br />
7/03/<strong>2012</strong> JW 924 7309.00 7/03/<strong>2012</strong> 10:31 AM 7/03/<strong>2012</strong> 10:35 AM 7/03/<strong>2012</strong> 12:07 PM<br />
7/03/<strong>2012</strong> JW 990 7265.80 7/03/<strong>2012</strong> 1:31 PM 7/03/<strong>2012</strong> 1:40 PM 7/03/<strong>2012</strong> 3:15 PM<br />
9/03/<strong>2012</strong> JW 982 7221.40 9/03/<strong>2012</strong> 2:00 AM 9/03/<strong>2012</strong> 2:13 AM 9/03/<strong>2012</strong> 4:02 AM<br />
9/03/<strong>2012</strong> JW 932 7216.60 9/03/<strong>2012</strong> 8:21 AM 9/03/<strong>2012</strong> 8:26 AM 9/03/<strong>2012</strong> 9:58 AM<br />
9/03/<strong>2012</strong> JW 62 3387.00 9/03/<strong>2012</strong> 10:03 AM 9/03/<strong>2012</strong> 10:09 AM 9/03/<strong>2012</strong> 11:03 AM<br />
9/03/<strong>2012</strong> JW 974 7238.60 9/03/<strong>2012</strong> 5:00 PM 9/03/<strong>2012</strong> 5:04 PM 9/03/<strong>2012</strong> 6:37 PM<br />
10/03/<strong>2012</strong> JW 936 7225.80 10/03/<strong>2012</strong> 7:54 AM 10/03/<strong>2012</strong> 8:00 AM 10/03/<strong>2012</strong> 9:32 AM<br />
10/03/<strong>2012</strong> JW 916 7231.00 10/03/<strong>2012</strong> 4:30 PM 10/03/<strong>2012</strong> 4:34 PM 10/03/<strong>2012</strong> 6:06 PM<br />
11/03/<strong>2012</strong> JW 62 3414.00 11/03/<strong>2012</strong> 11:21 AM 11/03/<strong>2012</strong> 11:26 AM 11/03/<strong>2012</strong> 12:16 PM<br />
11/03/<strong>2012</strong> JW 976 7280.00 11/03/<strong>2012</strong> 12:27 PM 11/03/<strong>2012</strong> 12:32 PM 11/03/<strong>2012</strong> 2:06 PM<br />
12/03/<strong>2012</strong> JW 262 7266.80 12/03/<strong>2012</strong> 12:23 AM 12/03/<strong>2012</strong> 12:27 AM 12/03/<strong>2012</strong> 2:00 AM<br />
12/03/<strong>2012</strong> JW 146 7286.20 12/03/<strong>2012</strong> 8:44 AM 12/03/<strong>2012</strong> 8:51 AM 12/03/<strong>2012</strong> 10:22 AM<br />
17/03/<strong>2012</strong> JW 988 7235.20 stowed 17/03/<strong>2012</strong> 5:42 AM 17/03/<strong>2012</strong> 10:04 AM<br />
17/03/<strong>2012</strong> JW 956 7266.20 17/03/<strong>2012</strong> 10:25 AM 17/03/<strong>2012</strong> 10:33 AM 17/03/<strong>2012</strong> 12:06 PM<br />
17/03/<strong>2012</strong> JW 174 7245.20 17/03/<strong>2012</strong> 2:00 PM 17/03/<strong>2012</strong> 2:18 PM 17/03/<strong>2012</strong> 4:06 PM<br />
17/03/<strong>2012</strong> JW 254 7264.05 17/03/<strong>2012</strong> 9:30 PM 17/03/<strong>2012</strong> 9:39 PM 17/03/<strong>2012</strong> 11:13 PM<br />
18/03/<strong>2012</strong> JW 288 7247.40 18/03/<strong>2012</strong> 1:06 AM 18/03/<strong>2012</strong> 1:14 AM 18/03/<strong>2012</strong> 3:14 AM<br />
18/03/<strong>2012</strong> JW 118 7255.00 18/03/<strong>2012</strong> 8:56 AM 18/03/<strong>2012</strong> 9:04 AM 18/03/<strong>2012</strong> 10:50 AM<br />
Appendix 1: Rail Transport Records 11
<strong>Wambo</strong> <strong>Coal</strong> Pty Ltd <strong>AEMR</strong> <strong>2011</strong>-<strong>2012</strong><br />
Railed date Train No<br />
Tonnes to Port<br />
ex P/N or QR<br />
Arrival Time Commence Loading Complete Loading<br />
18/03/<strong>2012</strong> JW 186 7281.40 18/03/<strong>2012</strong> 1:05 PM 18/03/<strong>2012</strong> 1:13 PM 18/03/<strong>2012</strong> 2:45 PM<br />
18/03/<strong>2012</strong> JW 200 7233.20 18/03/<strong>2012</strong> 5:15 PM 18/03/<strong>2012</strong> 5:21 PM 18/03/<strong>2012</strong> 6:59 PM<br />
19/03/<strong>2012</strong> JW 288 7266.50 19/03/<strong>2012</strong> 4:15 AM 19/03/<strong>2012</strong> 4:23 AM 19/03/<strong>2012</strong> 6:12 AM<br />
19/03/<strong>2012</strong> JW 134 7224.80 19/03/<strong>2012</strong> 8:34 AM 19/03/<strong>2012</strong> 8:38 AM 19/03/<strong>2012</strong> 10:22 AM<br />
19/03/<strong>2012</strong> JW 62 3418.00 19/03/<strong>2012</strong> 10:30 AM 19/03/<strong>2012</strong> 10:39 AM 19/03/<strong>2012</strong> 11:25 AM<br />
19/03/<strong>2012</strong> JW 194 7182.00 19/03/<strong>2012</strong> 3:40 PM 19/03/<strong>2012</strong> 3:43 PM 19/03/<strong>2012</strong> 5:18 PM<br />
19/03/<strong>2012</strong> JW 232 7217.80 19/03/<strong>2012</strong> 7:49 PM 19/03/<strong>2012</strong> 7:55 PM 19/03/<strong>2012</strong> 9:29 PM<br />
19/03/<strong>2012</strong> JW 248 7193.00 19/03/<strong>2012</strong> 10:52 PM 19/03/<strong>2012</strong> 10:56 PM 20/03/<strong>2012</strong> 12:29 AM<br />
20/03/<strong>2012</strong> JW 110 7236.00 20/03/<strong>2012</strong> 6:32 AM 20/03/<strong>2012</strong> 6:38 AM 20/03/<strong>2012</strong> 8:12 AM<br />
20/03/<strong>2012</strong> JW 120 7206.00 20/03/<strong>2012</strong> 8:15 AM 20/03/<strong>2012</strong> 8:26 AM 20/03/<strong>2012</strong> 9:58 AM<br />
20/03/<strong>2012</strong> JW 944 7207.20 20/03/<strong>2012</strong> 11:29 AM 20/03/<strong>2012</strong> 11:45 AM 20/03/<strong>2012</strong> 1:25 PM<br />
21/03/<strong>2012</strong> JW 168 7246.20 21/03/<strong>2012</strong> 4:04 PM 21/03/<strong>2012</strong> 4:11 PM 21/03/<strong>2012</strong> 5:45 PM<br />
21/03/<strong>2012</strong> 0 JW 970 7235.60 21/03/<strong>2012</strong> 0 7:30 PM 21/03/<strong>2012</strong> 0 7:43 PM 21/03/<strong>2012</strong> 0 9:17 PM<br />
22/03/<strong>2012</strong> JW 962 7057.20 stowed 22/03/<strong>2012</strong> 2:34 PM 22/03/<strong>2012</strong> 4:04 PM<br />
23/03/<strong>2012</strong> JW 62 3424.00 23/03/<strong>2012</strong> 9:50 AM 23/03/<strong>2012</strong> 9:55 AM 23/03/<strong>2012</strong> 10:45 AM<br />
23/03/<strong>2012</strong> JW 968 7253.20 23/03/<strong>2012</strong> 3:04 PM 23/03/<strong>2012</strong> 3:08 PM 23/03/<strong>2012</strong> 4:40 PM<br />
24/03/<strong>2012</strong> JW 914 6996.40 24/03/<strong>2012</strong> 2:00 AM 24/03/<strong>2012</strong> 2:04 AM 24/03/<strong>2012</strong> 3:37 AM<br />
24/03/<strong>2012</strong> JW 970 7313.00 24/03/<strong>2012</strong> 3:00 PM 24/03/<strong>2012</strong> 3:05 PM 24/03/<strong>2012</strong> 4:39 PM<br />
24/03/<strong>2012</strong> JW 204 7218.40 24/03/<strong>2012</strong> 4:45 PM 24/03/<strong>2012</strong> 4:53 PM 24/03/<strong>2012</strong> 6:28 PM<br />
24/03/<strong>2012</strong> JW 948 7297.00 24/03/<strong>2012</strong> 9:29 PM 24/03/<strong>2012</strong> 9:34 PM 24/03/<strong>2012</strong> 11:05 PM<br />
25/03/<strong>2012</strong> / JW 132 7237.00 25/03/<strong>2012</strong> / 8:22 AM 25/03/<strong>2012</strong> / 8:28 AM 25/03/<strong>2012</strong> / 10:01 AM<br />
25/03/<strong>2012</strong> JW 946 7288.20 25/03/<strong>2012</strong> 10:22 AM 25/03/<strong>2012</strong> 10:32 AM 25/03/<strong>2012</strong> 12:07 PM<br />
25/03/<strong>2012</strong> JW 970 7278.80 25/03/<strong>2012</strong> 11:00 PM 25/03/<strong>2012</strong> 11:25 PM 26/03/<strong>2012</strong> 12:48 AM<br />
26/03/<strong>2012</strong> JW 926 7273.80 26/03/<strong>2012</strong> 6:00 AM 26/03/<strong>2012</strong> 6:09 AM 26/03/<strong>2012</strong> 7:41 AM<br />
27/03/<strong>2012</strong> JW 936 7319.00 27/03/<strong>2012</strong> 8:25 AM 27/03/<strong>2012</strong> 8:34 AM 27/03/<strong>2012</strong> 10:07 AM<br />
27/03/<strong>2012</strong> JW 964 7058.40 27/03/<strong>2012</strong> 11:50 AM 27/03/<strong>2012</strong> 11:55 AM 27/03/<strong>2012</strong> 1:43 PM<br />
28/03/<strong>2012</strong> JW 266 7236.80 28/03/<strong>2012</strong> 12:30 AM 28/03/<strong>2012</strong> 12:38 AM 28/03/<strong>2012</strong> 2:10 AM<br />
29/03/<strong>2012</strong> JW 960 7254.80 29/03/<strong>2012</strong> 1:52 AM 29/03/<strong>2012</strong> 1:57 AM 29/03/<strong>2012</strong> 3:32 AM<br />
29/03/<strong>2012</strong> JW 988 7264.00 29/03/<strong>2012</strong> 3:39 AM 29/03/<strong>2012</strong> 3:43 AM 29/03/<strong>2012</strong> 5:17 AM<br />
29/03/<strong>2012</strong> JW 976 7274.00 29/03/<strong>2012</strong> 7:12 PM 29/03/<strong>2012</strong> 9:10 PM 29/03/<strong>2012</strong> 10:40 PM<br />
30/03/<strong>2012</strong> JW 938 7261.80 30/03/<strong>2012</strong> 7:05 AM 30/03/<strong>2012</strong> 7:15 AM 30/03/<strong>2012</strong> 8:47 AM<br />
30/03/<strong>2012</strong> JW 174 7212.00 30/03/<strong>2012</strong> 1:20 PM 30/03/<strong>2012</strong> 1:29 PM 30/03/<strong>2012</strong> 2:59 PM<br />
30/03/<strong>2012</strong> JW 62 3261.00 30/03/<strong>2012</strong> 3:10 PM 30/03/<strong>2012</strong> 3:23 PM 30/03/<strong>2012</strong> 4:27 PM<br />
30/03/<strong>2012</strong> JW 204 7273.80 30/03/<strong>2012</strong> 9:05 PM 30/03/<strong>2012</strong> 9:10 PM 30/03/<strong>2012</strong> 11:10 PM<br />
31/03/<strong>2012</strong> JW 154 7229.60 31/03/<strong>2012</strong> 9:50 AM 31/03/<strong>2012</strong> 10:00 AM 31/03/<strong>2012</strong> 11:33 AM<br />
31/03/<strong>2012</strong> JW 910 7285.80 31/03/<strong>2012</strong> 11:35 AM 31/03/<strong>2012</strong> 11:42 AM 31/03/<strong>2012</strong> 1:15 PM<br />
31/03/<strong>2012</strong> JW 912 7315.00 31/03/<strong>2012</strong> 1:15 PM 31/03/<strong>2012</strong> 1:26 PM 31/03/<strong>2012</strong> 3:02 PM<br />
31/03/<strong>2012</strong> JW 926 7314.00 31/03/<strong>2012</strong> 10:23 PM 31/03/<strong>2012</strong> 10:27 PM 31/03/<strong>2012</strong> 11:59 PM<br />
1/04/<strong>2012</strong> JW 956 7315.00 1/04/<strong>2012</strong> 12:30 AM 1/04/<strong>2012</strong> 12:35 AM 1/04/<strong>2012</strong> 2:05 AM<br />
1/04/<strong>2012</strong> JW 62 3464.00 1/04/<strong>2012</strong> 11:05 AM 1/04/<strong>2012</strong> 11:11 AM 1/04/<strong>2012</strong> 12:00 PM<br />
1/04/<strong>2012</strong> JW 188 7273.00 1/04/<strong>2012</strong> 1:45 PM 1/04/<strong>2012</strong> 1:51 PM 1/04/<strong>2012</strong> 3:23 PM<br />
1/04/<strong>2012</strong> JW 212 7233.60 1/04/<strong>2012</strong> 4:50 PM 1/04/<strong>2012</strong> 4:55 PM 1/04/<strong>2012</strong> 6:32 PM<br />
1/04/<strong>2012</strong> JW 246 7286.2020 1/04/<strong>2012</strong> 10:10 PM 1/04/<strong>2012</strong> 10:14 PM 1/04/<strong>2012</strong> 11:36 PM<br />
2/04/<strong>2012</strong> JW 982 7280.40 2/04/<strong>2012</strong> 3:34 AM 2/04/<strong>2012</strong> 3:37 AM 2/04/<strong>2012</strong> 5:09 AM<br />
2/04/<strong>2012</strong> JW 940 7299.00 2/04/<strong>2012</strong> 8:35 AM 2/04/<strong>2012</strong> 8:45 AM 2/04/<strong>2012</strong> 10:16 AM<br />
2/04/<strong>2012</strong> JW 152 7254.80 2/04/<strong>2012</strong> 4:14 PM 2/04/<strong>2012</strong> 4:19 PM 2/04/<strong>2012</strong> 5:53 PM<br />
2/04/<strong>2012</strong> JW 214 7227.40 2/04/<strong>2012</strong> 6:01 PM 2/04/<strong>2012</strong> 6:10 PM 2/04/<strong>2012</strong> 7:58 PM<br />
3/04/<strong>2012</strong> JW 930 7167.80 3/04/<strong>2012</strong> 7:45 AM 3/04/<strong>2012</strong> 7:52 AM 3/04/<strong>2012</strong> 9:24 AM<br />
3/04/<strong>2012</strong> JW 166 7269.20 3/04/<strong>2012</strong> 9:30 AM 3/04/<strong>2012</strong> 12:06 PM 3/04/<strong>2012</strong> 1:44 PM<br />
3/04/<strong>2012</strong> JW 216 7192.20 3/04/<strong>2012</strong> 7:06 PM 3/04/<strong>2012</strong> 7:23 PM 3/04/<strong>2012</strong> 8:59 PM<br />
4/04/<strong>2012</strong> JW 904 7244.80 4/04/<strong>2012</strong> 2:23 AM 4/04/<strong>2012</strong> 2:29 AM 4/04/<strong>2012</strong> 3:59 AM<br />
4/04/<strong>2012</strong> JW 922 7225.60 4/04/<strong>2012</strong> 4:05 AM 4/04/<strong>2012</strong> 4:24 AM 4/04/<strong>2012</strong> 6:14 AM<br />
Appendix 1: Rail Transport Records 12
<strong>Wambo</strong> <strong>Coal</strong> Pty Ltd <strong>AEMR</strong> <strong>2011</strong>-<strong>2012</strong><br />
Railed date Train No<br />
Tonnes to Port<br />
ex P/N or QR<br />
Arrival Time Commence Loading Complete Loading<br />
4/04/<strong>2012</strong> JW 136 7226.60 4/04/<strong>2012</strong> 11:04 AM 4/04/<strong>2012</strong> 11:08 AM 4/04/<strong>2012</strong> 12:43 PM<br />
4/04/<strong>2012</strong> JW 166 7252.00 4/04/<strong>2012</strong> 2:50 PM 4/04/<strong>2012</strong> 2:53 PM 4/04/<strong>2012</strong> 4:37 PM<br />
4/04/<strong>2012</strong> JW 258 7246.20 4/04/<strong>2012</strong> 10:29 PM 4/04/<strong>2012</strong> 10:42 PM 5/04/<strong>2012</strong> 12:19 AM<br />
5/04/<strong>2012</strong> JW 154 7267.00 5/04/<strong>2012</strong> 8:11 AM 5/04/<strong>2012</strong> 8:16 AM 5/04/<strong>2012</strong> 9:52 AM<br />
5/04/<strong>2012</strong> JW 170 7249.00 5/04/<strong>2012</strong> 5:20 AM 5/04/<strong>2012</strong> 5:25 AM 5/04/<strong>2012</strong> 7:01 AM<br />
5/04/<strong>2012</strong> JW 246 7269.40 5/04/<strong>2012</strong> 11:30 PM 5/04/<strong>2012</strong> 11:39 PM 6/04/<strong>2012</strong> 1:12 AM<br />
6/04/<strong>2012</strong> JW 958 7281.00 6/04/<strong>2012</strong> 1:16 AM 6/04/<strong>2012</strong> 1:25 AM 6/04/<strong>2012</strong> 3:02 AM<br />
6/04/<strong>2012</strong> JW 120 7260.60 6/04/<strong>2012</strong> 5:00 AM 6/04/<strong>2012</strong> 5:01 AM 6/04/<strong>2012</strong> 7:07 AM<br />
6/04/<strong>2012</strong> JW 138 7243.20 6/04/<strong>2012</strong> 8:50 AM 6/04/<strong>2012</strong> 8:55 AM 6/04/<strong>2012</strong> 10:30 AM<br />
6/04/<strong>2012</strong> JW 154 7251.05 6/04/<strong>2012</strong> 10:34 AM 6/04/<strong>2012</strong> 10:50 AM 6/04/<strong>2012</strong> 12:41 PM<br />
6/04/<strong>2012</strong> JW 188 7266.60 6/04/<strong>2012</strong> 3:25 PM 6/04/<strong>2012</strong> 3:32 PM 6/04/<strong>2012</strong> 5:04 PM<br />
6/04/<strong>2012</strong> JW 210 7252.40 6/04/<strong>2012</strong> 8:24 PM 6/04/<strong>2012</strong> 8:33 PM 6/04/<strong>2012</strong> 10:09 PM<br />
6/04/<strong>2012</strong> / 0 JW 214 7255.40 6/04/<strong>2012</strong> / 0 10:18 PM 6/04/<strong>2012</strong> / 0 10:34 PM 7/04/<strong>2012</strong> / 0 12:05 AM<br />
7/04/<strong>2012</strong> JW 956 7265.60 7/04/<strong>2012</strong> 5:06 AM 7/04/<strong>2012</strong> 5:11 AM 7/04/<strong>2012</strong> 6:52 AM<br />
7/04/<strong>2012</strong> JW 132 7245.60 7/04/<strong>2012</strong> 7:50 AM 7/04/<strong>2012</strong> 8:06 AM 7/04/<strong>2012</strong> 9:32 AM<br />
7/04/<strong>2012</strong> JW 202 7251.80 7/04/<strong>2012</strong> 2:39 PM 7/04/<strong>2012</strong> 2:47 PM 7/04/<strong>2012</strong> 4:22 PM<br />
7/04/<strong>2012</strong> JW 924 7233.60 7/04/<strong>2012</strong> 4:30 PM 7/04/<strong>2012</strong> 4:43 PM 7/04/<strong>2012</strong> 6:27 PM<br />
7/04/<strong>2012</strong> JW 966 7307.00 7/04/<strong>2012</strong> 11:56 PM 8/04/<strong>2012</strong> 12:06 AM 8/04/<strong>2012</strong> 1:36 AM<br />
8/04/<strong>2012</strong> JW 926 7192.00 8/04/<strong>2012</strong> 7:50 AM 8/04/<strong>2012</strong> 8:24 AM 8/04/<strong>2012</strong> 10:08 AM<br />
8/04/<strong>2012</strong> JW 968 7282.00 8/04/<strong>2012</strong> 12:11 PM 8/04/<strong>2012</strong> 12:15 PM 8/04/<strong>2012</strong> 1:53 PM<br />
8/04/<strong>2012</strong> / JW 976 7261.00 8/04/<strong>2012</strong> / 5:16 PM 8/04/<strong>2012</strong> / 5:20 PM 8/04/<strong>2012</strong> / 6:58 PM<br />
8/04/<strong>2012</strong> JW 928 7286.00 8/04/<strong>2012</strong> 9:42 PM 8/04/<strong>2012</strong> 9:52 PM 8/04/<strong>2012</strong> 11:23 PM<br />
9/04/<strong>2012</strong> JW 256 7211.60 9/04/<strong>2012</strong> 1:43 AM 9/04/<strong>2012</strong> 1:50 AM 9/04/<strong>2012</strong> 3:19 AM<br />
9/04/<strong>2012</strong> JW 102 7262.00 9/04/<strong>2012</strong> 4:21 AM 9/04/<strong>2012</strong> 4:31 AM 9/04/<strong>2012</strong> 6:07 AM<br />
9/04/<strong>2012</strong> JW 948 7210.30 9/04/<strong>2012</strong> 8:05 AM 9/04/<strong>2012</strong> 8:14 AM 9/04/<strong>2012</strong> 9:47 AM<br />
9/04/<strong>2012</strong> JW 186 7245.95 9/04/<strong>2012</strong> 3:15 PM 9/04/<strong>2012</strong> 3:30 PM 9/04/<strong>2012</strong> 5:17 PM<br />
9/04/<strong>2012</strong> JW 902 7263.00 9/04/<strong>2012</strong> 5:22 PM 9/04/<strong>2012</strong> 5:34 PM 9/04/<strong>2012</strong> 7:21 PM<br />
10/04/<strong>2012</strong> JW 124 7237.80 10/04/<strong>2012</strong> 4:00 AM 10/04/<strong>2012</strong> 4:07 AM 10/04/<strong>2012</strong> 5:42 AM<br />
10/04/<strong>2012</strong> JW 62 3469.00 10/04/<strong>2012</strong> 8:52 AM 10/04/<strong>2012</strong> 9:00 AM 10/04/<strong>2012</strong> 10:20 AM<br />
12/04/<strong>2012</strong> JW 934 7272.00 12/04/<strong>2012</strong> 4:55 AM 12/04/<strong>2012</strong> 5:00 AM 12/04/<strong>2012</strong> 6:37 AM<br />
12/04/<strong>2012</strong> JW 62 3446.00 12/04/<strong>2012</strong> 9:41 AM 12/04/<strong>2012</strong> 10:01 AM 12/04/<strong>2012</strong> 10:56 AM<br />
13/04/<strong>2012</strong> JW 908 7205.40 12/04/<strong>2012</strong> 11:36 PM 12/04/<strong>2012</strong> 11:42 PM 13/04/<strong>2012</strong> 1:19 AM<br />
13/04/<strong>2012</strong> JW 956 7204.20 13/04/<strong>2012</strong> 3:24 AM 13/04/<strong>2012</strong> 3:31 AM 13/04/<strong>2012</strong> 5:02 AM<br />
13/04/<strong>2012</strong> JW 940 7270.40 13/04/<strong>2012</strong> 9:50 AM 13/04/<strong>2012</strong> 9:56 AM 13/04/<strong>2012</strong> 11:31 AM<br />
13/04/<strong>2012</strong> JW 992 7179.20 13/04/<strong>2012</strong> 2:15 PM 13/04/<strong>2012</strong> 2:21 PM 13/04/<strong>2012</strong> 3:51 PM<br />
13/04/<strong>2012</strong> JW 938 7203.20 13/04/<strong>2012</strong> 9:53 PM 13/04/<strong>2012</strong> 9:59 PM 13/04/<strong>2012</strong> 11:33 PM<br />
15/04/<strong>2012</strong> JW 902 7293.00 15/04/<strong>2012</strong> 6:10 AM 15/04/<strong>2012</strong> 6:16 AM 15/04/<strong>2012</strong> 7:56 AM<br />
15/04/<strong>2012</strong> JW 952 7284.00 15/04/<strong>2012</strong> 8:55 AM 15/04/<strong>2012</strong> 9:00 AM 15/04/<strong>2012</strong> 10:33 AM<br />
15/04/<strong>2012</strong> JW 204 7297.95 15/04/<strong>2012</strong> 2:56 PM 15/04/<strong>2012</strong> 3:04 PM 15/04/<strong>2012</strong> 4:43 PM<br />
16/04/<strong>2012</strong> JW 138 7210.40 16/04/<strong>2012</strong> 10:45 AM 16/04/<strong>2012</strong> 10:49 AM 16/04/<strong>2012</strong> 12:23 PM<br />
16/04/<strong>2012</strong> JW 170 7307.35 16/04/<strong>2012</strong> 12:26 PM 16/04/<strong>2012</strong> 12:36 PM 16/04/<strong>2012</strong> 2:10 PM<br />
17/04/<strong>2012</strong> JW 230 7295.60 17/04/<strong>2012</strong> 5:52 AM 17/04/<strong>2012</strong> 7:09 AM 17/04/<strong>2012</strong> 8:42 AM<br />
17/04/<strong>2012</strong> JW 62 2773.00 17/04/<strong>2012</strong> 9:20 AM 17/04/<strong>2012</strong> 9:27 AM 17/04/<strong>2012</strong> 10:07 AM<br />
17/04/<strong>2012</strong> JW 234 7367.65 17/04/<strong>2012</strong> 9:57 PM 17/04/<strong>2012</strong> 10:03 PM 17/04/<strong>2012</strong> 11:36 PM<br />
18/04/<strong>2012</strong> JW 248 7318.60 18/04/<strong>2012</strong> 6:45 AM 18/04/<strong>2012</strong> 6:50 AM 18/04/<strong>2012</strong> 8:21 AM<br />
18/04/<strong>2012</strong> JW 62 3508.00 18/04/<strong>2012</strong> 10:00 AM 18/04/<strong>2012</strong> 10:05 AM 18/04/<strong>2012</strong> 11:29 AM<br />
19/04/<strong>2012</strong> JW 950 7189.80 19/04/<strong>2012</strong> 10:53 AM 19/04/<strong>2012</strong> 10:58 AM 19/04/<strong>2012</strong> 12:36 PM<br />
20/04/<strong>2012</strong> JW 978 7271.20 20/04/<strong>2012</strong> 1:14 PM 20/04/<strong>2012</strong> 1:19 PM 20/04/<strong>2012</strong> 2:53 PM<br />
20/04/<strong>2012</strong> JW 994 7254.00 20/04/<strong>2012</strong> 3:00 PM 20/04/<strong>2012</strong> 3:07 PM 20/04/<strong>2012</strong> 5:01 PM<br />
21/04/<strong>2012</strong> JW 908 7303.40 21/04/<strong>2012</strong> 8:02 AM 21/04/<strong>2012</strong> 8:09 AM 21/04/<strong>2012</strong> 9:46 AM<br />
21/04/<strong>2012</strong> JW 988 7295.00 21/04/<strong>2012</strong> 6:25 PM 21/04/<strong>2012</strong> 6:32 PM 21/04/<strong>2012</strong> 8:07 PM<br />
22/04/<strong>2012</strong> JW 62 3409.00 22/04/<strong>2012</strong> 10:27 AM 22/04/<strong>2012</strong> 10:32 AM 22/04/<strong>2012</strong> 11:20 AM<br />
Appendix 1: Rail Transport Records 13
<strong>Wambo</strong> <strong>Coal</strong> Pty Ltd <strong>AEMR</strong> <strong>2011</strong>-<strong>2012</strong><br />
Railed date Train No<br />
Tonnes to Port<br />
ex P/N or QR<br />
Arrival Time Commence Loading Complete Loading<br />
23/04/<strong>2012</strong> JW 960 7142.40 22/04/<strong>2012</strong> 11:57 PM 23/04/<strong>2012</strong> 12:01 AM 23/04/<strong>2012</strong> 1:34 AM<br />
23/04/<strong>2012</strong> JW 978 7291.80 23/04/<strong>2012</strong> 5:58 AM 23/04/<strong>2012</strong> 6:04 AM 23/04/<strong>2012</strong> 7:39 AM<br />
23/04/<strong>2012</strong> JW 976 7290.00 23/04/<strong>2012</strong> 10:00 PM 23/04/<strong>2012</strong> 10:11 PM 24/04/<strong>2012</strong> 1:08 AM<br />
24/04/<strong>2012</strong> JW 902 7281.40 24/04/<strong>2012</strong> 8:14 AM 24/04/<strong>2012</strong> 8:18 AM 24/04/<strong>2012</strong> 9:53 AM<br />
24/04/<strong>2012</strong> JW 924 7322.00 24/04/<strong>2012</strong> 10:05 AM 24/04/<strong>2012</strong> 10:45 AM 24/04/<strong>2012</strong> 1:04 PM<br />
24/04/<strong>2012</strong> JW 956 7343.00 24/04/<strong>2012</strong> 3:10 PM 24/04/<strong>2012</strong> 3:16 PM 24/04/<strong>2012</strong> 4:51 PM<br />
25/04/<strong>2012</strong> JW 996 7321.00 25/04/<strong>2012</strong> 1:30 AM 25/04/<strong>2012</strong> 1:37 AM 25/04/<strong>2012</strong> 3:09 AM<br />
25/04/<strong>2012</strong> JW 950 7167.60 25/04/<strong>2012</strong> 6:50 AM 25/04/<strong>2012</strong> 6:56 AM 25/04/<strong>2012</strong> 8:30 AM<br />
25/04/<strong>2012</strong> JW 62 3489.00 25/04/<strong>2012</strong> 11:18 AM 25/04/<strong>2012</strong> 11:26 AM 25/04/<strong>2012</strong> 12:12 PM<br />
26/04/<strong>2012</strong> JW 62 3417.00 26/04/<strong>2012</strong> 12:38 PM 26/04/<strong>2012</strong> 12:47 PM 26/04/<strong>2012</strong> 1:38 PM<br />
28/04/<strong>2012</strong> JW 986 7173.80 28/04/<strong>2012</strong> 3:45 PM 28/04/<strong>2012</strong> 4:01 PM 28/04/<strong>2012</strong> 5:33 PM<br />
29/04/<strong>2012</strong> JW 122 7284.40 29/04/<strong>2012</strong> 1:42 AM 29/04/<strong>2012</strong> 1:49 AM 29/04/<strong>2012</strong> 3:23 AM<br />
30/04/<strong>2012</strong> / 0 JW 962 7259.20 30/04/<strong>2012</strong> / 0 1:00 AM 30/04/<strong>2012</strong> / 0 1:07 AM 30/04/<strong>2012</strong> / 0 3:08 AM<br />
30/04/<strong>2012</strong> JW 152 7276.60 30/04/<strong>2012</strong> 11:45 AM 30/04/<strong>2012</strong> 11:52 AM 30/04/<strong>2012</strong> 2:19 PM<br />
30/04/<strong>2012</strong> JW 212 7287.40 30/04/<strong>2012</strong> 5:31 PM 30/04/<strong>2012</strong> 5:38 PM 30/04/<strong>2012</strong> 7:14 PM<br />
30/04/<strong>2012</strong> JW 982 7335.00 30/04/<strong>2012</strong> 7:30 PM 30/04/<strong>2012</strong> 9:01 PM 30/04/<strong>2012</strong> 10:33 PM<br />
1/05/<strong>2012</strong> JW 948 7243.00 1/05/<strong>2012</strong> 10:55 PM 1/05/<strong>2012</strong> 11:01 PM 2/05/<strong>2012</strong> 12:32 AM<br />
2/05/<strong>2012</strong> JW 914 7272.00 2/05/<strong>2012</strong> 9:50 AM 2/05/<strong>2012</strong> 9:56 AM 2/05/<strong>2012</strong> 11:39 AM<br />
2/05/<strong>2012</strong> JW 62 3467.00 2/05/<strong>2012</strong> 12:05 PM 2/05/<strong>2012</strong> 12:13 PM 2/05/<strong>2012</strong> 1:13 PM<br />
3/05/<strong>2012</strong> JW 240 7282.80 2/05/<strong>2012</strong> 11:37 PM 2/05/<strong>2012</strong> 11:47 PM 3/05/<strong>2012</strong> 1:23 AM<br />
3/05/<strong>2012</strong> / JW 134 7295.20 3/05/<strong>2012</strong> / 6:41 AM 3/05/<strong>2012</strong> / 6:51 AM 3/05/<strong>2012</strong> / 8:26 AM<br />
3/05/<strong>2012</strong> JW 148 7319.80 3/05/<strong>2012</strong> 12:55 PM 3/05/<strong>2012</strong> 12:58 PM 3/05/<strong>2012</strong> 2:40 PM<br />
3/05/<strong>2012</strong> JW 194 7274.40 3/05/<strong>2012</strong> 5:24 PM 3/05/<strong>2012</strong> 5:28 PM 3/05/<strong>2012</strong> 7:02 PM<br />
4/05/<strong>2012</strong> JW 288 7220.60 4/05/<strong>2012</strong> 8:58 AM 4/05/<strong>2012</strong> 9:01 AM 4/05/<strong>2012</strong> 10:34 AM<br />
4/05/<strong>2012</strong> JW 118 7275.60 4/05/<strong>2012</strong> 10:40 AM 4/05/<strong>2012</strong> 10:59 AM 4/05/<strong>2012</strong> 12:30 PM<br />
4/05/<strong>2012</strong> JW 148 7214.00 4/05/<strong>2012</strong> 1:50 PM 4/05/<strong>2012</strong> 2:02 PM 4/05/<strong>2012</strong> 3:33 PM<br />
4/05/<strong>2012</strong> JW 162 7221.80 4/05/<strong>2012</strong> 4:20 PM 4/05/<strong>2012</strong> 4:25 PM 4/05/<strong>2012</strong> 6:18 PM<br />
4/05/<strong>2012</strong> JW 954 7280.0000 4/05/<strong>2012</strong> 8:00 PM 4/05/<strong>2012</strong> 8:10 PM 4/05/<strong>2012</strong> 9:42 PM<br />
5/05/<strong>2012</strong> JW 62 3425.00 5/05/<strong>2012</strong> 9:14 AM 5/05/<strong>2012</strong> 9:20 AM 5/05/<strong>2012</strong> 10:09 AM<br />
5/05/<strong>2012</strong> JW 908 7159.10 5/05/<strong>2012</strong> 3:21 PM 5/05/<strong>2012</strong> 3:25 PM 5/05/<strong>2012</strong> 4:57 PM<br />
6/05/<strong>2012</strong> JW 62 3423.00 6/05/<strong>2012</strong> 9:31 AM 6/05/<strong>2012</strong> 9:36 AM 6/05/<strong>2012</strong> 10:26 AM<br />
6/05/<strong>2012</strong> JW 944 7220.60 6/05/<strong>2012</strong> 11:07 AM 6/05/<strong>2012</strong> 11:12 AM 6/05/<strong>2012</strong> 12:49 PM<br />
6/05/<strong>2012</strong> JW 222 7243.60 6/05/<strong>2012</strong> 5:45 PM 6/05/<strong>2012</strong> 5:53 PM 6/05/<strong>2012</strong> 7:25 PM<br />
7/05/<strong>2012</strong> JW 158 7196.20 7/05/<strong>2012</strong> 7:00 AM 7/05/<strong>2012</strong> 7:04 AM 7/05/<strong>2012</strong> 8:41 AM<br />
7/05/<strong>2012</strong> JW 986 7266.80 7/05/<strong>2012</strong> 5:35 PM 7/05/<strong>2012</strong> 5:44 PM 7/05/<strong>2012</strong> 7:22 PM<br />
8/05/<strong>2012</strong> JW 928 7293.00 8/05/<strong>2012</strong> 2:55 PM 8/05/<strong>2012</strong> 2:59 PM 8/05/<strong>2012</strong> 4:38 PM<br />
9/05/<strong>2012</strong> JW 950 7269.80 9/05/<strong>2012</strong> 12:25 AM 9/05/<strong>2012</strong> 12:32 AM 9/05/<strong>2012</strong> 2:04 AM<br />
9/05/<strong>2012</strong> JW 132 7262.00 9/05/<strong>2012</strong> 6:50 AM 9/05/<strong>2012</strong> 6:56 AM 9/05/<strong>2012</strong> 8:33 AM<br />
9/05/<strong>2012</strong> JW 966 7271.40 9/05/<strong>2012</strong> 5:23 PM 9/05/<strong>2012</strong> 5:27 PM 9/05/<strong>2012</strong> 7:00 PM<br />
10/05/<strong>2012</strong> JW 938 7309.00 10/05/<strong>2012</strong> 2:36 AM 10/05/<strong>2012</strong> 2:43 AM 10/05/<strong>2012</strong> 4:14 AM<br />
10/05/<strong>2012</strong> JW 950 7166.80 10/05/<strong>2012</strong> 3:53 PM 10/05/<strong>2012</strong> 4:03 PM 10/05/<strong>2012</strong> 6:10 PM<br />
10/05/<strong>2012</strong> JW 958 7279.20 10/05/<strong>2012</strong> 8:17 PM 10/05/<strong>2012</strong> 8:23 PM 10/05/<strong>2012</strong> 9:55 PM<br />
11/05/<strong>2012</strong> JW 910 7239.00 11/05/<strong>2012</strong> 10:18 PM 11/05/<strong>2012</strong> 10:51 PM 12/05/<strong>2012</strong> 1:30 AM<br />
13/05/<strong>2012</strong> JW 954 7277.00 13/05/<strong>2012</strong> 10:34 AM 13/05/<strong>2012</strong> 10:40 AM 13/05/<strong>2012</strong> 12:14 PM<br />
13/05/<strong>2012</strong> JW 922 7264.00 13/05/<strong>2012</strong> 5:10 PM 13/05/<strong>2012</strong> 5:15 PM 13/05/<strong>2012</strong> 6:52 PM<br />
14/05/<strong>2012</strong> JW 136 7256.60 14/05/<strong>2012</strong> 10:18 AM 14/05/<strong>2012</strong> 10:23 AM 14/05/<strong>2012</strong> 11:54 AM<br />
14/05/<strong>2012</strong> JW 956 7155.70 14/05/<strong>2012</strong> 10:57 PM 14/05/<strong>2012</strong> 11:04 PM 15/05/<strong>2012</strong> 12:36 AM<br />
19/05/<strong>2012</strong> JW 960 7144.80 19/05/<strong>2012</strong> 7:00 AM 19/05/<strong>2012</strong> 10:14 AM 19/05/<strong>2012</strong> 11:45 AM<br />
19/05/<strong>2012</strong> JW 154 7236.20 19/05/<strong>2012</strong> 11:52 AM 19/05/<strong>2012</strong> 12:04 PM 19/05/<strong>2012</strong> 1:35 PM<br />
19/05/<strong>2012</strong> JW 172 7257.20 19/05/<strong>2012</strong> 1:58 PM 19/05/<strong>2012</strong> 2:03 PM 19/05/<strong>2012</strong> 3:45 PM<br />
19/05/<strong>2012</strong> JW 214 7217.00 19/05/<strong>2012</strong> 9:53 PM 19/05/<strong>2012</strong> 9:58 PM 19/05/<strong>2012</strong> 11:37 PM<br />
20/05/<strong>2012</strong> JW 908 7163.10 20/05/<strong>2012</strong> 10:20 AM 20/05/<strong>2012</strong> 10:26 AM 20/05/<strong>2012</strong> 12:02 PM<br />
Appendix 1: Rail Transport Records 14
<strong>Wambo</strong> <strong>Coal</strong> Pty Ltd <strong>AEMR</strong> <strong>2011</strong>-<strong>2012</strong><br />
Railed date Train No<br />
Tonnes to Port<br />
ex P/N or QR<br />
Arrival Time Commence Loading Complete Loading<br />
20/05/<strong>2012</strong> JW 924 7234.20 20/05/<strong>2012</strong> 4:40 PM 20/05/<strong>2012</strong> 4:45 PM 20/05/<strong>2012</strong> 6:23 PM<br />
21/05/<strong>2012</strong> JW 256 7254.80 20/05/<strong>2012</strong> 11:57 PM 21/05/<strong>2012</strong> 12:03 AM 21/05/<strong>2012</strong> 1:36 AM<br />
21/05/<strong>2012</strong> JW 902 7152.00 21/05/<strong>2012</strong> 4:34 AM 21/05/<strong>2012</strong> 4:40 AM 21/05/<strong>2012</strong> 6:15 AM<br />
21/05/<strong>2012</strong> JW 946 7174.80 21/05/<strong>2012</strong> 11:30 AM 21/05/<strong>2012</strong> 11:39 AM 21/05/<strong>2012</strong> 1:13 PM<br />
22/05/<strong>2012</strong> JW 924 7162.70 22/05/<strong>2012</strong> 6:10 AM 22/05/<strong>2012</strong> 6:20 AM 22/05/<strong>2012</strong> 7:54 AM<br />
22/05/<strong>2012</strong> JW 62 2924.00 22/05/<strong>2012</strong> 12:19 PM 22/05/<strong>2012</strong> 12:25 PM 22/05/<strong>2012</strong> 1:05 PM<br />
24/05/<strong>2012</strong> JW 908 7382.00 23/05/<strong>2012</strong> 7:13 PM 24/05/<strong>2012</strong> 12:08 AM 24/05/<strong>2012</strong> 1:41 AM<br />
24/05/<strong>2012</strong> JW 976 7292.60 24/05/<strong>2012</strong> 4:42 PM 24/05/<strong>2012</strong> 4:46 PM 24/05/<strong>2012</strong> 6:28 PM<br />
25/05/<strong>2012</strong> JW 928 7199.80 25/05/<strong>2012</strong> 4:05 AM 25/05/<strong>2012</strong> 4:10 AM 25/05/<strong>2012</strong> 5:45 AM<br />
25/05/<strong>2012</strong> JW 902 7307.00 25/05/<strong>2012</strong> 2:30 PM 25/05/<strong>2012</strong> 8:15 PM 25/05/<strong>2012</strong> 9:49 PM<br />
26/05/<strong>2012</strong> JW 930 7369.00 26/05/<strong>2012</strong> 1:45 PM 26/05/<strong>2012</strong> 1:51 PM 26/05/<strong>2012</strong> 3:24 PM<br />
26/05/<strong>2012</strong> JW 920 7255.20 26/05/<strong>2012</strong> 10:10 PM 26/05/<strong>2012</strong> 10:14 PM 26/05/<strong>2012</strong> 11:49 PM<br />
27/05/<strong>2012</strong> 0 JW 62 3212.00 27/05/<strong>2012</strong> 0 9:25 AM 27/05/<strong>2012</strong> 0 10:24 AM 27/05/<strong>2012</strong> 0 11:14 AM<br />
27/05/<strong>2012</strong> JW 922 7172.20 27/05/<strong>2012</strong> 11:20 AM 27/05/<strong>2012</strong> 11:35 AM 27/05/<strong>2012</strong> 1:06 PM<br />
27/05/<strong>2012</strong> JW 968 7224.60 27/05/<strong>2012</strong> 1:50 PM 27/05/<strong>2012</strong> 1:56 PM 27/05/<strong>2012</strong> 3:36 PM<br />
28/05/<strong>2012</strong> JW 906 7443.00 28/05/<strong>2012</strong> 5:56 AM 28/05/<strong>2012</strong> 6:01 AM 28/05/<strong>2012</strong> 7:33 AM<br />
28/05/<strong>2012</strong> JW 152 7255.20 28/05/<strong>2012</strong> 9:12 AM 28/05/<strong>2012</strong> 9:22 AM 28/05/<strong>2012</strong> 10:56 AM<br />
28/05/<strong>2012</strong> JW 202 7221.00 28/05/<strong>2012</strong> 5:14 PM 28/05/<strong>2012</strong> 5:19 PM 28/05/<strong>2012</strong> 6:51 PM<br />
30/05/<strong>2012</strong> JW 284 7283.40 30/05/<strong>2012</strong> 2:44 AM 30/05/<strong>2012</strong> 2:49 AM 30/05/<strong>2012</strong> 4:25 AM<br />
30/05/<strong>2012</strong> JW 62 3239.00 30/05/<strong>2012</strong> 9:46 AM 30/05/<strong>2012</strong> 9:52 AM 30/05/<strong>2012</strong> 10:42 AM<br />
30/05/<strong>2012</strong> / JW 234 7218.80 30/05/<strong>2012</strong> / 7:10 PM 30/05/<strong>2012</strong> / 7:23 PM 30/05/<strong>2012</strong> / 8:56 PM<br />
31/05/<strong>2012</strong> JW 944 7239.00 31/05/<strong>2012</strong> 12:02 AM 31/05/<strong>2012</strong> 12:12 AM 31/05/<strong>2012</strong> 1:47 AM<br />
31/05/<strong>2012</strong> JW 932 7291.20 31/05/<strong>2012</strong> 6:26 AM 31/05/<strong>2012</strong> 6:33 AM 31/05/<strong>2012</strong> 9:06 AM<br />
31/05/<strong>2012</strong> JW 982 7248.00 31/05/<strong>2012</strong> 1:00 PM 31/05/<strong>2012</strong> 1:06 PM 31/05/<strong>2012</strong> 4:38 PM<br />
31/05/<strong>2012</strong> JW 224 7404.20 31/05/<strong>2012</strong> 6:10 PM 31/05/<strong>2012</strong> 6:34 PM 31/05/<strong>2012</strong> 8:14 PM<br />
31/05/<strong>2012</strong> JW 252 7434.20 31/05/<strong>2012</strong> 8:25 PM 31/05/<strong>2012</strong> 8:41 PM 31/05/<strong>2012</strong> 10:13 PM<br />
1/06/<strong>2012</strong> JW 112 7169.80 1/06/<strong>2012</strong> 5:38 AM 1/06/<strong>2012</strong> 5:45 AM 1/06/<strong>2012</strong> 7:52 AM<br />
1/06/<strong>2012</strong> JW 134 7331.60 1/06/<strong>2012</strong> 8:04 AM 1/06/<strong>2012</strong> 8:10 AM 1/06/<strong>2012</strong> 9:45 AM<br />
1/06/<strong>2012</strong> JW 916 7277.20 1/06/<strong>2012</strong> 6:47 PM 1/06/<strong>2012</strong> 6:54 PM 1/06/<strong>2012</strong> 8:34 PM<br />
1/06/<strong>2012</strong> JW 924 7398.00 2/06/<strong>2012</strong> 6:07 AM 2/06/<strong>2012</strong> 6:13 AM 2/06/<strong>2012</strong> 7:46 AM<br />
2/06/<strong>2012</strong> JW 950 7263.80 2/06/<strong>2012</strong> 10:32 AM 2/06/<strong>2012</strong> 10:38 AM 2/06/<strong>2012</strong> 12:10 PM<br />
2/06/<strong>2012</strong> JW 162 7295.00 2/06/<strong>2012</strong> 12:31 PM 2/06/<strong>2012</strong> 1:04 PM 2/06/<strong>2012</strong> 2:37 PM<br />
4/06/<strong>2012</strong> JW 904 7414.00 4/06/<strong>2012</strong> 6:00 AM 4/06/<strong>2012</strong> 6:07 AM 4/06/<strong>2012</strong> 7:38 AM<br />
4/06/<strong>2012</strong> JW 62 2758.00 4/06/<strong>2012</strong> 1:45 PM 4/06/<strong>2012</strong> 2:46 PM 4/06/<strong>2012</strong> 3:25 PM<br />
5/06/<strong>2012</strong> JW 978 7343.00 5/06/<strong>2012</strong> 3:25 AM 5/06/<strong>2012</strong> 3:32 AM 5/06/<strong>2012</strong> 5:09 AM<br />
5/06/<strong>2012</strong> JW 908 7276.20 5/06/<strong>2012</strong> 5:35 AM 5/06/<strong>2012</strong> 5:41 AM 5/06/<strong>2012</strong> 7:23 AM<br />
5/06/<strong>2012</strong> JW 62 3473.00 5/06/<strong>2012</strong> 10:38 AM 5/06/<strong>2012</strong> 10:45 AM 5/06/<strong>2012</strong> 11:39 AM<br />
5/06/<strong>2012</strong> JW 172 7246.80 5/06/<strong>2012</strong> 12:25 PM 5/06/<strong>2012</strong> 12:32 PM 5/06/<strong>2012</strong> 2:06 PM<br />
5/06/<strong>2012</strong> JW 194 7284.40 5/06/<strong>2012</strong> 6:04 PM 5/06/<strong>2012</strong> 6:09 PM 5/06/<strong>2012</strong> 8:06 PM<br />
6/06/<strong>2012</strong> JW 62 3274.00 6/06/<strong>2012</strong> 9:11 AM 6/06/<strong>2012</strong> 9:20 AM 6/06/<strong>2012</strong> 10:08 AM<br />
7/06/<strong>2012</strong> JW 984 7286.60 7/06/<strong>2012</strong> 2:15 AM 7/06/<strong>2012</strong> 2:21 AM 7/06/<strong>2012</strong> 3:53 AM<br />
7/06/<strong>2012</strong> JW 122 7255.00 7/06/<strong>2012</strong> 6:47 AM 7/06/<strong>2012</strong> 6:51 AM 7/06/<strong>2012</strong> 8:26 AM<br />
7/06/<strong>2012</strong> JW 952 7226.80 7/06/<strong>2012</strong> 11:07 AM 7/06/<strong>2012</strong> 11:15 AM 7/06/<strong>2012</strong> 12:48 PM<br />
7/06/<strong>2012</strong> JW 180 7260.60 7/06/<strong>2012</strong> 1:40 PM 7/06/<strong>2012</strong> 1:47 PM 7/06/<strong>2012</strong> 3:23 PM<br />
7/06/<strong>2012</strong> JW 908 7429.00 7/06/<strong>2012</strong> 3:42 PM 7/06/<strong>2012</strong> 4:19 PM 7/06/<strong>2012</strong> 5:50 PM<br />
8/06/<strong>2012</strong> JW 62 3109.00 8/06/<strong>2012</strong> 9:30 AM 8/06/<strong>2012</strong> 9:46 AM 8/06/<strong>2012</strong> 10:36 AM<br />
8/06/<strong>2012</strong> JW 970 7262.60 8/06/<strong>2012</strong> 12:40 PM 8/06/<strong>2012</strong> 12:43 PM 8/06/<strong>2012</strong> 2:16 PM<br />
8/06/<strong>2012</strong> JW 240 7245.80 8/06/<strong>2012</strong> 8:20 PM 8/06/<strong>2012</strong> 8:26 PM 8/06/<strong>2012</strong> 9:58 PM<br />
9/06/<strong>2012</strong> JW 130 7260.20 9/06/<strong>2012</strong> 6:00 AM 9/06/<strong>2012</strong> 6:04 AM 9/06/<strong>2012</strong> 7:41 AM<br />
9/06/<strong>2012</strong> JW 202 7219.40 9/06/<strong>2012</strong> 5:48 PM 9/06/<strong>2012</strong> 5:52 PM 9/06/<strong>2012</strong> 7:24 PM<br />
10/06/<strong>2012</strong> JW 258 7260.20 10/06/<strong>2012</strong> 3:50 AM 10/06/<strong>2012</strong> 3:56 AM 10/06/<strong>2012</strong> 5:35 AM<br />
10/06/<strong>2012</strong> JW 272 7240.60 10/06/<strong>2012</strong> 5:54 AM 10/06/<strong>2012</strong> 6:01 AM 10/06/<strong>2012</strong> 7:34 AM<br />
Appendix 1: Rail Transport Records 15
<strong>Wambo</strong> <strong>Coal</strong> Pty Ltd <strong>AEMR</strong> <strong>2011</strong>-<strong>2012</strong><br />
Railed date Train No<br />
Tonnes to Port<br />
ex P/N or QR<br />
Arrival Time Commence Loading Complete Loading<br />
10/06/<strong>2012</strong> JW 170 7231.20 10/06/<strong>2012</strong> 1:50 PM 10/06/<strong>2012</strong> 1:55 PM 10/06/<strong>2012</strong> 3:28 PM<br />
10/06/<strong>2012</strong> JW 206 7242.20 10/06/<strong>2012</strong> 5:20 PM 10/06/<strong>2012</strong> 5:24 PM 10/06/<strong>2012</strong> 7:03 PM<br />
10/06/<strong>2012</strong> JW 240 7230.60 10/06/<strong>2012</strong> 9:10 PM 10/06/<strong>2012</strong> 9:22 PM 10/06/<strong>2012</strong> 11:21 PM<br />
11/06/<strong>2012</strong> JW 124 7280.80 11/06/<strong>2012</strong> 5:25 AM 11/06/<strong>2012</strong> 5:29 AM 11/06/<strong>2012</strong> 7:03 AM<br />
11/06/<strong>2012</strong> JW 936 7231.40 11/06/<strong>2012</strong> 7:29 AM 11/06/<strong>2012</strong> 7:33 AM 11/06/<strong>2012</strong> 9:22 AM<br />
12/06/<strong>2012</strong> JW 904 7346.00 12/06/<strong>2012</strong> 6:25 PM 12/06/<strong>2012</strong> 6:28 PM 12/06/<strong>2012</strong> 8:01 PM<br />
14/06/<strong>2012</strong> JW 246 7277.60 14/06/<strong>2012</strong> 12:10 AM 14/06/<strong>2012</strong> 12:16 AM 14/06/<strong>2012</strong> 1:50 AM<br />
14/06/<strong>2012</strong> JW 182 7221.40 14/06/<strong>2012</strong> 12:09 PM 14/06/<strong>2012</strong> 12:14 PM 14/06/<strong>2012</strong> 1:46 PM<br />
15/06/<strong>2012</strong> JW 152 7244.80 15/06/<strong>2012</strong> 12:05 PM 15/06/<strong>2012</strong> 12:11 PM 15/06/<strong>2012</strong> 1:48 PM<br />
16/06/<strong>2012</strong> JW 958 7255.00 16/06/<strong>2012</strong> 8:31 PM 16/06/<strong>2012</strong> 8:37 PM 16/06/<strong>2012</strong> 10:09 PM<br />
17/06/<strong>2012</strong> JW 154 7291.15 17/06/<strong>2012</strong> 10:44 AM 17/06/<strong>2012</strong> 10:48 AM 17/06/<strong>2012</strong> 12:20 PM<br />
17/06/<strong>2012</strong> JW 62 3248.00 17/06/<strong>2012</strong> 12:25 PM 17/06/<strong>2012</strong> 12:40 PM 17/06/<strong>2012</strong> 1:25 PM<br />
17/06/<strong>2012</strong> 0 JW 970 7278.00 800 17/06/<strong>2012</strong> 0 2:22 PM 17/06/<strong>2012</strong> 0 2:28 PM 17/06/<strong>2012</strong> 0 4:06 PM<br />
17/06/<strong>2012</strong> JW 962 7260.80 17/06/<strong>2012</strong> 11:34 PM 17/06/<strong>2012</strong> 11:40 PM 18/06/<strong>2012</strong> 1:11 AM<br />
18/06/<strong>2012</strong> JW 62 3288.00 18/06/<strong>2012</strong> 9:38 AM 18/06/<strong>2012</strong> 9:43 AM 18/06/<strong>2012</strong> 10:26 AM<br />
18/06/<strong>2012</strong> JW 194 7251.20 18/06/<strong>2012</strong> 3:13 PM 18/06/<strong>2012</strong> 3:18 PM 18/06/<strong>2012</strong> 4:50 PM<br />
18/06/<strong>2012</strong> JW 234 7247.60 18/06/<strong>2012</strong> 9:39 PM 18/06/<strong>2012</strong> 9:47 PM 18/06/<strong>2012</strong> 11:23 PM<br />
19/06/<strong>2012</strong> JW 982 7226.10 19/06/<strong>2012</strong> 3:14 AM 19/06/<strong>2012</strong> 3:20 AM 19/06/<strong>2012</strong> 5:02 AM<br />
19/06/<strong>2012</strong> JW 62 3530.00 19/06/<strong>2012</strong> 8:55 AM 19/06/<strong>2012</strong> 9:07 AM 19/06/<strong>2012</strong> 9:57 AM<br />
19/06/<strong>2012</strong> JW 232 7293.20 19/06/<strong>2012</strong> 10:00 PM 19/06/<strong>2012</strong> 10:11 PM 19/06/<strong>2012</strong> 11:55 PM<br />
20/06/<strong>2012</strong> / JW 74 3520.00 20/06/<strong>2012</strong> / 6:35 PM 20/06/<strong>2012</strong> / 6:41 PM 20/06/<strong>2012</strong> / 7:28 PM<br />
20/06/<strong>2012</strong> JW 248 7235.00 20/06/<strong>2012</strong> 8:31 PM 20/06/<strong>2012</strong> 8:41 PM 20/06/<strong>2012</strong> 10:13 PM<br />
21/06/<strong>2012</strong> JW 260 7228.40 21/06/<strong>2012</strong> 12:35 AM 21/06/<strong>2012</strong> 12:44 AM 21/06/<strong>2012</strong> 2:23 AM<br />
21/06/<strong>2012</strong> JW 150 7273.40 21/06/<strong>2012</strong> 11:48 AM 21/06/<strong>2012</strong> 11:53 AM 21/06/<strong>2012</strong> 1:25 PM<br />
21/06/<strong>2012</strong> JW 154 7274.40 21/06/<strong>2012</strong> 3:24 PM 21/06/<strong>2012</strong> 3:29 PM 21/06/<strong>2012</strong> 5:00 PM<br />
22/06/<strong>2012</strong> JW 108 7278.60 22/06/<strong>2012</strong> 3:30 AM 22/06/<strong>2012</strong> 3:33 AM 22/06/<strong>2012</strong> 5:11 AM<br />
23/06/<strong>2012</strong> JW 286 7319.40 23/06/<strong>2012</strong> 1:55 AM 23/06/<strong>2012</strong> 1:59 AM 23/06/<strong>2012</strong> 3:41 AM<br />
23/06/<strong>2012</strong> JW 120 7323.40 23/06/<strong>2012</strong> 6:06 AM 23/06/<strong>2012</strong> 6:12 AM 23/06/<strong>2012</strong> 7:45 AM<br />
23/06/<strong>2012</strong> JW 62 3467.00 23/06/<strong>2012</strong> 10:00 AM 23/06/<strong>2012</strong> 10:06 AM 23/06/<strong>2012</strong> 10:56 AM<br />
24/06/<strong>2012</strong> JW 984 7451.00 24/06/<strong>2012</strong> 1:40 PM 24/06/<strong>2012</strong> 1:46 PM 24/06/<strong>2012</strong> 3:20 PM<br />
25/06/<strong>2012</strong> JW 62 3489.00 25/06/<strong>2012</strong> 9:01 AM 25/06/<strong>2012</strong> 9:09 AM 25/06/<strong>2012</strong> 9:59 AM<br />
25/06/<strong>2012</strong> JW 182 7258.60 25/06/<strong>2012</strong> 4:08 PM 25/06/<strong>2012</strong> 4:12 PM 25/06/<strong>2012</strong> 5:48 PM<br />
25/06/<strong>2012</strong> JW 234 7321.60 25/06/<strong>2012</strong> 7:56 PM 25/06/<strong>2012</strong> 8:00 PM 25/06/<strong>2012</strong> 9:33 PM<br />
26/06/<strong>2012</strong> JW 162 7344.75 26/06/<strong>2012</strong> 12:20 PM 26/06/<strong>2012</strong> 12:26 PM 26/06/<strong>2012</strong> 1:58 PM<br />
26/06/<strong>2012</strong> JW 918 7353.00 26/06/<strong>2012</strong> 8:27 PM 26/06/<strong>2012</strong> 8:32 PM 26/06/<strong>2012</strong> 10:04 PM<br />
26/06/<strong>2012</strong> JW 252 7323.00 26/06/<strong>2012</strong> 11:26 PM 26/06/<strong>2012</strong> 11:35 PM 27/06/<strong>2012</strong> 1:08 AM<br />
27/06/<strong>2012</strong> JW 278 7332.05 27/06/<strong>2012</strong> 2:00 AM 27/06/<strong>2012</strong> 2:05 AM 27/06/<strong>2012</strong> 3:42 AM<br />
27/06/<strong>2012</strong> JW 288 7320.50 27/06/<strong>2012</strong> 3:45 AM 27/06/<strong>2012</strong> 4:04 AM 27/06/<strong>2012</strong> 5:36 AM<br />
27/06/<strong>2012</strong> JW 934 7353.00 27/06/<strong>2012</strong> 11:55 AM 27/06/<strong>2012</strong> 11:57 AM 27/06/<strong>2012</strong> 1:30 PM<br />
27/06/<strong>2012</strong> JW 904 7475.00 27/06/<strong>2012</strong> 7:11 PM 27/06/<strong>2012</strong> 7:21 PM 27/06/<strong>2012</strong> 9:15 PM<br />
28/06/<strong>2012</strong> JW 922 7483.00 28/06/<strong>2012</strong> 4:33 AM 28/06/<strong>2012</strong> 4:43 AM 28/06/<strong>2012</strong> 6:37 AM<br />
28/06/<strong>2012</strong> JW 954 7471.00 28/06/<strong>2012</strong> 8:00 AM 28/06/<strong>2012</strong> 8:03 AM 28/06/<strong>2012</strong> 9:35 AM<br />
28/06/<strong>2012</strong> JW 168 6950.40 stowed 28/06/<strong>2012</strong> 8:59 PM 28/06/<strong>2012</strong> 10:40 PM<br />
29/06/<strong>2012</strong> JW 62 3526.00 29/06/<strong>2012</strong> 8:53 AM 29/06/<strong>2012</strong> 9:02 AM 29/06/<strong>2012</strong> 9:48 AM<br />
29/06/<strong>2012</strong> JW 182 7299.00 29/06/<strong>2012</strong> 12:20 PM 29/06/<strong>2012</strong> 12:28 PM 29/06/<strong>2012</strong> 2:08 PM<br />
30/06/<strong>2012</strong> JW 168 7342.00 30/06/<strong>2012</strong> 10:03 AM 30/06/<strong>2012</strong> 10:08 AM 30/06/<strong>2012</strong> 11:41 AM<br />
30/06/<strong>2012</strong> JW 188 7308.60 30/06/<strong>2012</strong> 12:55 PM 30/06/<strong>2012</strong> 1:01 PM 30/06/<strong>2012</strong> 2:32 PM<br />
30/06/<strong>2012</strong> JW 74 3524.00 30/06/<strong>2012</strong> 8:55 PM 30/06/<strong>2012</strong> 9:03 PM 30/06/<strong>2012</strong> 9:56 PM<br />
30/06/<strong>2012</strong> JW 228 7344.60 30/06/<strong>2012</strong> 10:21 PM 30/06/<strong>2012</strong> 10:29 PM 1/07/<strong>2012</strong> 12:01 AM<br />
Appendix 1: Rail Transport Records 16
Appendix 2<br />
Environmental Monitoring<br />
Program Results
Appendix 2A<br />
Meteorological Data
<strong>Wambo</strong> <strong>Coal</strong> Pty Ltd <strong>AEMR</strong> <strong>2011</strong>-<strong>2012</strong><br />
<strong>Wambo</strong> <strong>Coal</strong> Pty Ltd - Weather Summary - July <strong>2011</strong> to June <strong>2012</strong><br />
Date<br />
Temperature (2m) Temperature (10m) Humidity Wind Speed Solar Radiation<br />
Cumulative<br />
Rain Cumulative Rain Evaporation<br />
Minimum Average Maximum Minimum Average Maximum Minimum Average Maximum Minimum Average Maximum Minimum Average Maximum<br />
Evaporatio<br />
July 11 -1.5 11.1 24.3 -0.6 11.3 21.1 30.3 72.7 99.8 0.03 2.1 4.4 -2.0 393.6 540.4 13.1 13.1 343.4 343.4<br />
August 11 1.5 11.7 25.4 2.6 12.6 25.6 25.6 79.8 99.8 0.02 1.7 3.7 -5.0 239.5 824.2 36.4 49.4 239.6 583.0<br />
September 11 1.6 15.1 32.2 2.6 15.9 32.5 12.0 66.9 99.3 0.04 2.0 4.9 -4.1 349.1 862.6 72.4 121.8 322.6 905.6<br />
October 11 5.2 17.0 31.8 6.4 17.7 31.4 17.3 73.2 99.5 0.04 1.8 3.9 -4.0 413.2 992.9 68.8 190.6 379.9 1,285.5<br />
November 11 8.7 21.8 36.3 9.8 22.2 35.9 25.7 71.8 99.1 0.04 2.0 4.0 -2.7 387.9 1023.9 119.6 310.2 375.9 1,661.4<br />
December 11 8.5 19.3 29.8 9.6 19.8 29.8 28.6 73.9 98.6 0.0 1.9 3.7 -2.8 584.8 1119.8 77.8 388.1 509.4 2,170.9<br />
January 12 9.3 22.7 37.5 11.3 23.2 37.3 19.0 71.4 98.1 0.0 2.0 4.2 -2.0 278.5 1135.0 36.9 424.9 308.7 2,479.5<br />
February 12 13.1 21.7 32.3 14.0 22.1 32.2 31.3 79.8 98.9 0.0 1.7 3.5 -1.8 518.6 1022.5 124.1 549.0 427.7 2,907.3<br />
March 12 11.0 20.4 33.0 12.3 21.0 33.1 28.8 77.5 99.2 0.0 1.8 4.0 -2.3 175.4 974.6 85.9 634.9 224.0 3,131.3<br />
April 12 7.2 17.9 30.9 7.9 18.6 30.7 33.4 77.0 99.6 0.0 1.6 3.9 -2.3 153.6 874.0 18.4 653.3 189.8 3,321.1<br />
May 12 -0.6 12.0 28.2 0.7 13.1 28.3 21.4 76.5 99.3 0.0 1.6 4.0 -3.7 109.9 720.7 33.2 686.5 158.9 3,480.0<br />
June 12 -1.8 11.2 21.9 -0.5 12.0 22.1 38.8 81.9 99.7 0.0 1.8 3.7 -4.3 103.7 614.1 43.3 729.8 142.9 3,622.9<br />
Yearly -1.8 16.8 37.5 -0.6 17.5 37.3 12 75 100 0.0 1.8 4.9 -5 309 1,135 729.8 729.8 3,622.9 25,891.7<br />
Temperature (oC)<br />
45<br />
40<br />
35<br />
30<br />
25<br />
20<br />
15<br />
10<br />
5<br />
0<br />
-5<br />
Jul 11<br />
Aug 11<br />
Sep 11<br />
<strong>Wambo</strong> <strong>Coal</strong> Weather Station<br />
Temperature (2m) - July <strong>2011</strong> to June <strong>2012</strong><br />
Oct 11<br />
Nov 11<br />
Dec 11<br />
Jan 12<br />
Feb 12<br />
Mar 12<br />
Apr 12<br />
May 12<br />
Jun 12<br />
Maximum<br />
Temperature<br />
Average<br />
Temperature<br />
Minimum<br />
Temperature<br />
Temperature ( o C)<br />
45<br />
40<br />
35<br />
30<br />
25<br />
20<br />
15<br />
10<br />
5<br />
0<br />
-5<br />
Jul 11<br />
Aug 11<br />
Sep 11<br />
<strong>Wambo</strong> <strong>Coal</strong> Weather Station<br />
Temperature (10m) - July <strong>2011</strong> to June <strong>2012</strong><br />
Oct 11<br />
Nov 11<br />
Dec 11<br />
Jan 12<br />
Feb 12<br />
Mar 12<br />
Apr 12<br />
May 12<br />
Jun 12<br />
Maximum<br />
Temperature<br />
Average<br />
Temperature<br />
Minimum<br />
Temperature<br />
<strong>Wambo</strong> <strong>Coal</strong> Weather Station<br />
Wind Speed - July <strong>2011</strong> to June <strong>2012</strong><br />
<strong>Wambo</strong> <strong>Coal</strong> Weather Station<br />
Humidity - July <strong>2011</strong> to June <strong>2012</strong><br />
Wind Speed (m/s)<br />
20<br />
18<br />
16<br />
14<br />
12<br />
10<br />
8<br />
6<br />
4<br />
2<br />
0<br />
Jul 11<br />
Aug 11<br />
Sep 11<br />
Oct 11<br />
Nov 11<br />
Dec 11<br />
Jan 12<br />
Feb 12<br />
Mar 12<br />
Apr 12<br />
May 12<br />
Jun 12<br />
Maximum Wind<br />
Speed<br />
Average Wind<br />
Speed<br />
Minimum Wind<br />
Speed<br />
Relative Humidity (%)<br />
100<br />
90<br />
80<br />
70<br />
60<br />
50<br />
40<br />
30<br />
20<br />
10<br />
0<br />
Jul 11<br />
Aug 11<br />
Sep 11<br />
Oct 11<br />
Nov 11<br />
Dec 11<br />
Jan 12<br />
Feb 12<br />
Mar 12<br />
Apr 12<br />
May 12<br />
Jun 12<br />
Maximum<br />
Humidity<br />
Average<br />
Humidity<br />
Minimum<br />
Humidity<br />
Appendix2A: Meterological Data 1
<strong>Wambo</strong> <strong>Coal</strong> Pty Ltd <strong>AEMR</strong> <strong>2011</strong>-<strong>2012</strong><br />
<strong>Wambo</strong> <strong>Coal</strong> Pty Ltd - Weather Summary - July <strong>2011</strong> to June <strong>2012</strong><br />
<strong>Wambo</strong> <strong>Coal</strong> Weather Station<br />
Rainfall - July <strong>2011</strong> to June <strong>2012</strong><br />
<strong>Wambo</strong> <strong>Coal</strong> Weather Station<br />
Evaporation - July <strong>2011</strong> to June <strong>2012</strong><br />
140<br />
120<br />
100<br />
80<br />
60<br />
40<br />
20<br />
0<br />
800<br />
700<br />
600<br />
500<br />
400<br />
300<br />
200<br />
100<br />
0<br />
Monthly<br />
Rainfall<br />
Cumulative<br />
Rainfall<br />
600<br />
500<br />
400<br />
300<br />
200<br />
4000<br />
3500<br />
3000<br />
2500<br />
2000<br />
1500<br />
1000<br />
Jul 11<br />
Aug 11<br />
Sep 11<br />
Oct 11<br />
Nov 11<br />
Dec 11<br />
Jan 12<br />
Feb 12<br />
Mar 12<br />
Apr 12<br />
May 12<br />
Jun 12<br />
Monthly Rainfall (mm)<br />
100<br />
Cumulative Rainfall (mm)<br />
0<br />
500<br />
0<br />
Monthly<br />
Evaporation<br />
Cumulative<br />
Evaporation<br />
Jul 11<br />
Aug 11<br />
Sep 11<br />
Oct 11<br />
Nov 11<br />
Dec 11<br />
Jan 12<br />
Feb 12<br />
Mar 12<br />
Apr 12<br />
May 12<br />
Jun 12<br />
Monthly Evaporation (mm)<br />
Cumulative Evaporation (mm)<br />
1200<br />
1000<br />
800<br />
600<br />
400<br />
200<br />
0<br />
<strong>Wambo</strong> <strong>Coal</strong> Weather Station<br />
Solar Radiation - July <strong>2011</strong> to June <strong>2012</strong><br />
Maximum<br />
Solar<br />
Radiation<br />
Average<br />
Solar<br />
Radiation<br />
Jul 11<br />
Aug 11<br />
Sep 11<br />
Oct 11<br />
Nov 11<br />
Dec 11<br />
Jan 12<br />
Feb 12<br />
Mar 12<br />
Apr 12<br />
May 12<br />
Jun 12<br />
Solar Radiation<br />
Minimum<br />
Solar<br />
600<br />
500<br />
400<br />
300<br />
200<br />
100<br />
<strong>Wambo</strong> <strong>Coal</strong> Weather Station<br />
Rainfall vs Evaporation - July <strong>2011</strong> to June <strong>2012</strong><br />
Radiation 0<br />
0<br />
4000<br />
3500<br />
3000<br />
2500<br />
2000<br />
1500<br />
1000<br />
500<br />
Monthly Rainfall<br />
Monthly<br />
Evaporation<br />
Cumulative Rainfall<br />
Jul 11<br />
Aug 11<br />
Sep 11<br />
Oct 11<br />
Nov 11<br />
Dec 11<br />
Jan 12<br />
Feb 12<br />
Mar 12<br />
Apr 12<br />
May 12<br />
Jun 12<br />
Monthly (mm)<br />
Cumulative (mm)<br />
Cumulative<br />
Evaporation<br />
Appendix2A: Meterological Data 2
Jerrys Plains Long Term Climate Statistics<br />
Monthly Climate Statistics for 'JERRYS PLAINS POST OFFICE' [061086]<br />
Created on [ 27 Jun <strong>2012</strong> 18:45:15 GMT+00:00]<br />
061086 JERRYS PLAINS POST OFFICE<br />
Commenced: 1884<br />
Last Record: <strong>2012</strong><br />
Latitude: 32.50 Degrees South<br />
Longitude: 150.91 Degrees East<br />
Elevation: 90 m<br />
State: NSW<br />
Statistic Element January February March April May June July August September October November December Annual No. Years Start Year End Year<br />
Mean maximum temperature (Degrees C) for years 1907 to <strong>2012</strong> 31.7 30.9 28.9 25.3 21.3 18 17.4 19.4 22.9 26.2 29.1 31.2 25.2 105 1907 <strong>2012</strong><br />
Highest temperature (Degrees C) for years 1957 to <strong>2012</strong> 44.6 45.5 42.8 38.9 30 26.1 26 31 36.2 41 44.9 45.6 45.6 55 1957 <strong>2012</strong><br />
Date of Highest temperature for years 1957 to <strong>2012</strong> 12‐Jan‐07 2‐Feb‐06 14‐Mar‐98 4‐Apr‐86 24‐May‐58 5‐Jun‐58 24‐Jul‐90 21‐Aug‐95 25‐Sep‐80 21‐Oct‐88 19‐Nov‐68 25‐Dec‐57 25‐Dec‐57 N/A 1957 <strong>2012</strong><br />
Lowest maximum temperature (Degrees C) for years 1957 to <strong>2012</strong> 17.8 18 16.5 15.2 11.6 8.9 8.3 8.3 12.8 14.1 15.4 16.7 8.3 55 1957 <strong>2012</strong><br />
Date of Lowest maximum temperature for years 1957 to <strong>2012</strong> 17‐Jan‐86 24‐Feb‐04 2‐Mar‐87 17‐Apr‐83 27‐May‐87 26‐Jun‐59 7‐Jul‐57 10‐Aug‐61 5‐Sep‐75 3‐Oct‐66 5‐Nov‐96 25‐Dec‐62 10‐Aug‐61 N/A 1957 <strong>2012</strong><br />
Decile 1 maximum temperature (Degrees C) for years 1957 to <strong>2011</strong> 24.6 24.4 23.5 20.8 17.5 15.1 14.4 15.6 17.8 19.9 21.7 24 54 1957 <strong>2011</strong><br />
Decile 9 maximum temperature (Degrees C) for years 1957 to <strong>2011</strong> 38 36.6 33.7 29.8 25 21 20.2 23.3 27.8 31.7 35.2 36.7 54 1957 <strong>2011</strong><br />
Mean number of days >= 30 Degrees C for years 1957 to <strong>2012</strong> 17.4 13.8 9.8 2.8 0 0 0 0.1 1.4 5.5 10.5 15.8 77.1 55 1957 <strong>2012</strong><br />
Mean number of days >= 35 Degrees C for years 1957 to <strong>2012</strong> 7.3 4.4 2 0.1 0 0 0 0 0.1 0.8 3.3 5.7 23.7 55 1957 <strong>2012</strong><br />
Mean number of days >= 40 Degrees C for years 1957 to <strong>2012</strong> 1.3 0.7 0.1 0 0 0 0 0 0 0 0.5 0.8 3.4 55 1957 <strong>2012</strong><br />
Mean minimum temperature (Degrees C) for years 1907 to <strong>2012</strong> 17.2 17.1 15 11 7.4 5.3 3.8 4.4 7 10.3 13.2 15.7 10.6 105 1907 <strong>2012</strong><br />
Lowest temperature (Degrees C) for years 1957 to <strong>2012</strong> 7.7 6.5 4.5 0.6 ‐1.8 ‐3 ‐4.5 ‐3 ‐0.6 1 3 5 ‐4.5 55 1957 <strong>2012</strong><br />
Date of Lowest temperature for years 1957 to <strong>2012</strong> 9‐Jan‐04 21‐Feb‐88 28‐Mar‐84 27‐Apr‐78 29‐May‐87 30‐Jun‐86 4‐Jul‐71 1‐Aug‐98 6‐Sep‐81 18‐Oct‐84 23‐Nov‐08 19‐Dec‐60 4‐Jul‐71 N/A 1957 <strong>2012</strong><br />
Highest minimum temperature (Degrees C) for years 1957 to <strong>2012</strong> 27.8 26.2 22.7 21.1 17.8 17.2 15.3 15.3 19.2 20.6 30 27.8 30 55 1957 <strong>2012</strong><br />
Date of Highest minimum temperature for years 1957 to <strong>2012</strong> 26‐Jan‐82 6‐Feb‐11 14‐Mar‐83 1‐Apr‐59 11‐May‐63 5‐Jun‐58 25‐Jul‐90 30‐Aug‐99 23‐Sep‐03 28‐Oct‐67 30‐Nov‐59 26‐Dec‐57 30‐Nov‐59 N/A 1957 <strong>2012</strong><br />
Decile 1 minimum temperature (Degrees C) for years 1957 to <strong>2011</strong> 13.4 13.4 10.7 6.4 3.2 0.9 ‐0.6 0.4 2.8 5.6 8.8 11.4 54 1957 <strong>2011</strong><br />
Decile 9 minimum temperature (Degrees C) for years 1957 to <strong>2011</strong> 21.1 20.9 19.2 16.4 13.3 10.6 8.9 10 12.2 15.4 17.8 20 54 1957 <strong>2011</strong><br />
Mean number of days = 10 mm for years 1884 to <strong>2012</strong> 2.6 2.2 1.8 1.3 1.2 1.4 1.3 1 1.4 1.7 1.9 2.2 20 127 1884 <strong>2012</strong><br />
Mean number of days of rain >= 25 mm for years 1884 to <strong>2012</strong> 0.8 0.8 0.6 0.4 0.3 0.3 0.3 0.2 0.3 0.4 0.5 0.7 5.6 127 1884 <strong>2012</strong><br />
Mean daily wind run (km) for years 1957 to 1972 276 255 236 200 197 186 231 228 227 256 262 270 235 13 1957 1972<br />
Mean daily solar exposure (MJ/(m*m)) for years 1990 to <strong>2012</strong> 24.5 21.4 18.6 15 11.4 9.7 10.7 14.1 18 21.4 23.6 25.4 17.8 22 1990 <strong>2012</strong><br />
Mean number of clear days for years 1957 to 2010 7.3 5.6 7.4 9.1 8.5 8.4 10.5 12.1 11.1 8.7 7.2 7.5 103.4 53 1957 2010<br />
Mean number of cloudy days for years 1957 to 2010 11.3 11.2 10.8 9.5 10.3 10.7 8.4 7.7 7.7 10.5 10.7 10.8 119.6 53 1957 2010<br />
Mean daily evaporation (mm) for years 1957 to 1972 7.1 6 5 4 2.9 2 2.3 2.6 3.7 5.3 6.5 6.6 4.5 10 1957 1972<br />
Mean 9am temperature (Degrees C) for years 1940 to 2010 23.4 22.7 21.2 18 13.6 10.6 9.4 11.4 15.3 19 21.1 23 17.4 69 1940 2010<br />
Mean 9am wet bulb temperature (Degrees C) for years 1940 to 2010 19.3 19.3 17.9 15 11.6 9 7.7 9 11.9 14.5 16.3 18.1 14.1 64 1940 2010<br />
Mean 9am dew point temperature (Degrees C) for years 1957 to 2010 16.9 17.3 15.7 12.8 9.7 7.2 5.7 6.2 8.3 10.5 12.8 14.8 11.5 45 1957 2010<br />
Mean 9am relative humidity (%) for years 1940 to 2010 67 72 72 72 77 80 78 71 65 59 60 61 70 60 1940 2010<br />
Mean 9am cloud cover (okas) for years 1907 to 2010 4.2 4.4 4 3.6 3.9 4 3.5 3.1 3.1 3.6 3.9 4 3.8 103 1907 2010<br />
Mean 9am wind speed (km/h) for years 1957 to 2010 9.6 9 8.8 8.6 9 9.4 10.6 11 11.7 10.9 10.5 9.9 9.9 53 1957 2010<br />
Mean 3pm temperature (Degrees C) for years 1956 to 2010 29.8 28.9 27.2 24.1 20.1 17.1 16.4 18.2 21.2 24.2 26.9 29 23.6 54 1956 2010<br />
Mean 3pm wet bulb temperature (Degrees C) for years 1956 to 2010 21.1 21.1 19.6 17.1 14.6 12.2 11.2 12.1 14.1 16.2 18 19.7 16.4 50 1956 2010<br />
Mean 3pm dew point temperature (Degrees C) for years 1957 to 2010 15.6 16.3 14.4 11.7 9.3 7.2 5.7 5.4 6.9 9 11.1 13.1 10.5 45 1957 2010<br />
Mean 3pm relative humidity (%) for years 1957 to 2010 47 50 49 49 52 54 51 45 43 42 42 42 47 45 1957 2010<br />
Mean 3pm cloud cover (oktas) for years 1957 to 2010 4.6 4.8 4.5 4.3 4.3 4.3 4 3.8 4 4.4 4.6 4.5 4.3 53 1957 2010<br />
Mean 3pm wind speed (km/h) for years 1957 to 2010 13.2 13 12.4 11.3 11 11.5 13 14.3 14.7 14.1 14.2 14.2 13.1 52 1957 2010<br />
Appendix 2A: Jerrys Plans Long‐Term Climate Statistics<br />
Source: http://www.bom.gov.au/climate/averages/tables/cw_061086.shtml
Appendix 2B<br />
Air Monitoring Data
<strong>Wambo</strong> <strong>Coal</strong> Pty Ltd <strong>AEMR</strong> <strong>2011</strong>-<strong>2012</strong><br />
D01 D03 D07<br />
D26<br />
Month<br />
Insoluble<br />
Solids (g/m 2<br />
/month)<br />
Ash Residue<br />
(g/m 2 /month)<br />
IS/AR Ratio<br />
Insoluble<br />
Solids (g/m 2<br />
/month)<br />
Ash Residue<br />
(g/m 2 /month)<br />
IS/AR Ratio<br />
Insoluble<br />
Solids (g/m 2<br />
/month)<br />
Ash Residue<br />
(g/m 2 /month)<br />
IS/AR Ratio<br />
Insoluble<br />
Solids (g/m 2<br />
/month)<br />
Ash Residue<br />
(g/m 2 /month)<br />
IS/AR Ratio<br />
Jul 11 6.4c 5.0c 78 3.1 1.8 58 7.6c 6.2c 82 0.3 0.3 100<br />
Aug 11 86.1c 82.5c 96 3.8 2.6 68 6.2c 3.6c 58 1.0 0.7 70<br />
Sep 11 3.7 2.3 62 2.3 1.4 61 3.5 2.5 71 1.2 0.9 75<br />
Oct 11 12.5 5.7 46 2.2 1.7 77 5.1 3.3 65 1.1 0.8 73<br />
Nov 11 10.1c 4.9c 49 5.9c 3.0c 51 10.0c 4.1c 41 0.5 0.3 60<br />
Dec 11 4.3c 2.0c 47 4.5c 1.3c 29 Missing Dust Gauge Bottle & Funnel 1.9 1.0 53<br />
Jan 12 11.9c 6.4c 54 2.7 2.2 81 4.8c 3.4c 71 1.3 1.2 92<br />
Feb 12 29.8c 16.9c 57 2.0 1.7 85 7.4c 5.1c 69 2.3 1.7 74<br />
Mar 12 9.1 1.0c 11 1.4 1.0 71 6.5c 4.7c 72 1.8 1.2 67<br />
Apr 12 25.9 16.3 63 2.8 1.9 68 5.3 3.5 66 1.4 1.1 79<br />
May 12 39.2 25.3 65 1.9 1.4 74 4.5 3.4 76 1.1 0.9 82<br />
Jun 12 10.0c 7.6c 76 1.5 1.0 67 4.5c 2.0c 44 0.4c 0.4c 100<br />
Average<br />
(incl. Cont.)<br />
Average<br />
(excl.cont)<br />
20.8 14.7 58 2.8 1.8 66 5.9 3.8 65 1.2 0.9 73<br />
18.1 12.4 58 2.4 1.7 66 4.6 3.2 65 1.3 0.9 73<br />
D09 D11 D12 D14<br />
Month<br />
Insoluble<br />
Solids (g/m 2<br />
/month)<br />
Ash Residue<br />
(g/m 2 /month)<br />
IS/AR Ratio<br />
Insoluble<br />
Solids (g/m 2<br />
/month)<br />
Ash Residue<br />
(g/m 2 /month)<br />
IS/AR Ratio<br />
Insoluble<br />
Solids (g/m 2<br />
/month)<br />
Ash Residue<br />
(g/m 2 /month)<br />
IS/AR Ratio<br />
Insoluble<br />
Solids (g/m 2<br />
/month)<br />
Ash Residue<br />
(g/m 2 /month)<br />
IS/AR Ratio<br />
Jul 11 7.7c 3.6c 47 0.8 0.6 75 2.3 1.3 57 13.1c 4.5c 34<br />
Aug 11 2.3 1.6 70 1.6 1.0 63 1.6 1.1 69<br />
Sep 11 36 3.6 23 2.3 64 20 2.0 13 1.3 65 33 3.3 21 2.1 64<br />
Oct 11 3.3 2.1 64 3.3 2.0 61 3.7 2.7 73<br />
Nov 11 4.8c 2.0c 42 3.4 1.8 53<br />
Dust Gauge Bottle Broken<br />
Dec 11 3.3 1.2 36 2.4 1.3 54 2.7 1.8 67<br />
Jan 12 2.3 1.6 70 1.5 1.4 93 3.7 2.6 70<br />
Feb 12 4.0c 2.6c 65 2.4 1.5 63 3.3 2.5 76<br />
Mar 12 6.8c 3.1c 46 3.4 1.9 56 3.9 2.4 62<br />
Apr 12 4.2 2.3 55 1.9 1.2 63 3.1 2.4 77<br />
May 12 6.9 3.8 55 2.8 1.8 64 2.1 1.6 76<br />
Jun 12 5.0c 3.5c 70 1.1 0.8 73 1.9c 1.3c 68<br />
Average<br />
(incl. Cont.)<br />
Average<br />
(excl.cont)<br />
4.5 2.5 57 2.2 1.4 62 2.9 2.0 69 13.1 4.5 34<br />
3.7 2.1 57 2.2 1.4 62 3.0 2.1 69 13.1 4.5 34<br />
Appendix 2B: Air Monitoring Results<br />
'c' indicates that the sample was contaminated<br />
Shaded cells indicate that the result was above 4g/m 2 /month
<strong>Wambo</strong> <strong>Coal</strong> Pty Ltd <strong>AEMR</strong> <strong>2011</strong>-<strong>2012</strong><br />
D17<br />
D19 D20 D21<br />
Month<br />
Insoluble<br />
Solids (g/m 2<br />
/month)<br />
Ash Residue<br />
(g/m 2 /month)<br />
IS/AR Ratio<br />
Insoluble<br />
Solids (g/m 2<br />
/month)<br />
Ash Residue<br />
(g/m 2 /month)<br />
IS/AR Ratio<br />
Insoluble<br />
Solids (g/m 2<br />
/month)<br />
Ash Residue<br />
(g/m 2 /month)<br />
IS/AR Ratio<br />
Insoluble<br />
Solids (g/m 2<br />
/month)<br />
Ash Residue<br />
(g/m 2 /month)<br />
IS/AR Ratio<br />
Jul 11 0.4 0.3 75 0.7 0.6 86 0.6 0.5 83 0.5 0.4 80<br />
Aug 11 0.7 0.5 71 1.9 1.5 79 1.3 1.0 77 0.5 0.4 80<br />
Sep 11 1.0 0.6 60 2.8 2.0 71 1.2 0.8 67 1.3 0.9 69<br />
Oct 11 1.4 1.0 71 3.6 2.5 69 1.5 1.0 67 1.2 0.8 67<br />
Nov 11 2.4 0.9 38 4.1c 2.5c 61 2.2 1.4 64 1.6 1.1 69<br />
Dec 11 1.2 0.8 67 4.0c 2.7c 68 1.4 0.8 57 1.8 1.2 67<br />
Jan 12 1.9 1.5 79 3.9 2.9 74 1.5 1.3 87 2.0 1.6 80<br />
Feb 12 2.8 2.0 71 3.8 2.6 68 1.0 0.9 90 2.80 1.80 64<br />
Mar 12 1.2 0.9 75 3.7 2.5 68 1.6 1.3 81 1.60 1.30 81<br />
Apr 12 0.9 0.8 89 3.6 2.7 75 1.2 1.1 92 1.30 1.30 100<br />
May 12 0.7 0.6 86 2.4 1.8 75 2.2 1.8 82 0.50 0.50 100<br />
Jun 12 0.8c 0.7c 88 1.4c 0.9c 64 0.9c 0.7 78 0.5c 0.50 100<br />
Average<br />
(incl. Cont.)<br />
Average<br />
(excl.cont)<br />
1.3 0.9 72 3.0 2.1 72 1.4 1.1 77 1.3 1.0 80<br />
1.3 0.9 72 2.9 2.1 72 1.4 1.1 77 1.4 1.0 80<br />
D22<br />
D23<br />
D24<br />
D25<br />
Month<br />
Insoluble<br />
Solids (g/m 2<br />
/month)<br />
Ash Residue<br />
(g/m 2 /month)<br />
IS/AR Ratio<br />
Insoluble<br />
Solids (g/m 2<br />
/month)<br />
Ash Residue<br />
(g/m 2 /month)<br />
IS/AR Ratio<br />
Insoluble<br />
Solids (g/m 2<br />
/month)<br />
Ash Residue<br />
(g/m 2 /month)<br />
IS/AR Ratio<br />
Insoluble<br />
Solids (g/m 2<br />
/month)<br />
Ash Residue<br />
(g/m 2 /month)<br />
IS/AR Ratio<br />
Jul 11 0.5 0.4 80 3.3 2.2 67 0.3 0.2 67 1.0 0.6 60<br />
Aug 11 0.6 0.5 83 2.5 1.2 48 0.9 0.6 67 1.4 0.9 64<br />
Sep 11 1.2 0.9 09 75 1.0 0.7 70 1.0 0.6 06 60 1.4 0.9 64<br />
Oct 11 1.0 0.8 80 0.9 0.8 89 10.6c 9.7 92 1.4 1.1 79<br />
Nov 11 1.2 0.9 75 2.0 0.9 45 1.9 0.9 47 1.9 1.1 58<br />
Dec 11 1.5 1.1 73 3.7 1.3 35 1.3 0.7 54 2.2 1.5 68<br />
Jan 12 2.0 1.9 95 1.2 1.0 83 1.2 0.9 75 2.6 2.4 92<br />
Feb 12 2.5 1.9 76 13.8c 5.7c 41 1.2 0.8 67 3.5 2.2 63<br />
Mar 12 1.8 1.2 67 2.1 1.4 67 0.9 0.6 67 4.2 2.7 64<br />
Apr 12 2.5 2.2 88 3.2 1.4 44 1.4 1.0 71 2.9 2.3 79<br />
May 12 1.0 0.9 90 1.3 1.0 77 0.7 0.5 71 1.7 1.3 76<br />
Jun 12 1.2c 0.9c 75 2.0c 1.1c 55 0.3c 0.2 67 1.1c 0.9c 82<br />
Average<br />
(incl. Cont.)<br />
Average<br />
(excl.cont)<br />
1.4 1.1 80 3.1 1.6 60 1.8 1.4 67 2.1 1.5 71<br />
1.4 1.2 80 2.1 1.2 60 1.1 1.4 67 2.2 1.5 71<br />
Appendix 2B: Air Monitoring Results<br />
'c' indicates that the sample was contaminated<br />
Shaded cells indicate that the result was above 4g/m 2 /month
<strong>Wambo</strong> <strong>Coal</strong> Pty Ltd <strong>AEMR</strong> <strong>2011</strong>-<strong>2012</strong><br />
<strong>Wambo</strong> <strong>Coal</strong> Dust Monitoring Program<br />
Particulate Matter (10 Micron) Monitoring Data<br />
Date of Run<br />
PM01 - Coralie<br />
(Sentinex 19)<br />
PM10 24<br />
Hour Result<br />
YTD<br />
Average<br />
PM02 - <strong>Wambo</strong> Road<br />
(Caban) (Sentinex 20)<br />
PM10 24<br />
Hour Result<br />
YTD<br />
Average<br />
PM03 - Thelander<br />
(Sentinex 21)<br />
PM10 24<br />
Hour Result<br />
YTD<br />
Average<br />
PM04 - Muller<br />
(Sentinex 22)<br />
PM10 24<br />
Hour Result<br />
YTD<br />
Average<br />
(ug/m 3 )<br />
(ug/m 3 )<br />
(ug/m 3 )<br />
(ug/m 3 )<br />
01/07/11 11.2 11.20 6.7 6.70 8.4 8.40 9.9 9.90<br />
02/07/11 8.3 9.75 8.7 7.70 7.4 7.90 8.4 9.15<br />
03/07/11 9.0 9.50 9.1 8.17 6.8 7.53 7.5 8.60<br />
04/07/11 10.2 9.68 9.3 8.45 8.1 7.68 8.1 8.48<br />
05/07/11 19.3 11.60 14.2 9.60 11.8 8.50 8.9 8.56<br />
06/07/11 11.4 11.57 15.1 10.52 10.5 8.83 9.2 8.67<br />
07/07/11 11.5 10.99 12.6 10.81 7.5 8.64 7.1 8.44<br />
08/07/11 7.0 10.99 11.6 10.91 6.8 8.41 6.1 8.15<br />
09/07/11 5.4 10.37 12.5 11.09 5.8 8.12 5.3 7.83<br />
10/07/11 7.1 10.04 10.1 10.99 6.5 7.96 5.6 7.61<br />
11/07/11 8.1 9.86 12.2 11.10 8.7 8.03 7.9 7.64<br />
12/07/11 11.8 10.03 15.5 11.47 12.0 8.36 9.8 7.82<br />
13/07/11 14.1 10.34 27.7 12.72 15.1 8.88 14.0 8.29<br />
14/07/11 12.2 10.47 10.7 9.01 12.7 8.61<br />
15/07/11 17.7 10.95 10.1 12.53 15.7 9.45 16.4 9.13<br />
16/07/11 12.5 11.05 11.5 9.58 15.8 9.54<br />
17/07/11 11.3 11.06 11.3 9.68 12.4 9.71<br />
18/07/11 9.9 11.00 4.7 9.41 5.5 9.48<br />
19/07/11 7.3 10.81 7.8 12.21 5.2 9.18 4.8 9.23<br />
20/07/11 8.5 10.69 8.0 11.95 7.3 9.09 7.0 9.12<br />
21/07/11 5.0 10.42 5.3 11.56 5.0 8.90 4.9 8.92<br />
22/07/11 6.7 10.25 6.6 11.28 6.5 8.79 7.3 8.85<br />
23/07/11 7.2 10.12 7.2 8.72 7.7 8.80<br />
24/07/11 6.2 9.95 4.8 8.55 4.9 8.63<br />
25/07/11 8.6 9.90 6.7 8.48 6.3 8.54<br />
26/07/11 8.2 9.83 5.0 8.35 5.6 8.43<br />
27/07/11 11.8 9.91 6.4 8.27 8.2 8.42<br />
28/07/11 16.3 10.1414 12.11 11.33 86 8.6 829 8.29 91 9.1 844 8.44<br />
29/07/11 12.3 10.21 19.4 11.73 8.8 8.30 10.2 8.50<br />
30/07/11 13.6 10.32 13.6 11.82 9.2 8.33 9.6 8.54<br />
31/07/11 12.7 10.40 22.0 12.28 12.3 8.46 12.8 8.68<br />
01/08/11 19.9 10.70 24.0 12.79 15.4 8.68 15.3 8.88<br />
02/08/11 24.4 11.11 26.9 13.38 15.0 8.87 11.5 8.96<br />
03/08/11 22.0 11.43 23.1 13.77 14.5 9.04 16.0 9.17<br />
04/08/11 21.0 11.71 16.8 9.26 17.1 9.40<br />
05/08/11 20.6 11.95 24.2 14.17 14.1 9.39 14.5 9.54<br />
06/08/11 20.9 12.19 22.9 14.49 14.5 9.53 15.3 9.69<br />
07/08/11 9.7 12.13 8.9 14.29 7.8 9.48 9.4 9.69<br />
08/08/11 5.9 11.97 4.4 9.35 4.0 9.54<br />
09/08/11 6.7 11.84 5.2 13.98 3.6 9.21 3.7 9.40<br />
10/08/11 5.5 11.68 9.9 13.84 4.6 9.10 4.6 9.28<br />
11/08/11 9.9 11.64 11.6 13.77 5.9 9.02 6.4 9.21<br />
12/08/11 12.4 11.66 12.4 13.73 8.6 9.01 12.0 9.27<br />
13/08/11 14.1 11.71 11.0 9.06 12.3 9.34<br />
14/08/11 14.3 11.77 12.1 9.12 15.7 9.48<br />
15/08/11 14.0 11.82 11.8 9.18 9.8 9.49<br />
16/08/11 15.7 11.90 12.8 9.26 13.2 9.57<br />
17/08/11 12.3 11.91 12.1 9.32 13.5 9.65<br />
18/08/11 7.5 11.82 6.1 9.25 7.0 9.60<br />
19/08/11 7.7 11.74 7.7 9.22 7.2 9.55<br />
20/08/11 10.8 11.72 10.3 9.24 10.6 9.57<br />
21/08/11 8.6 11.66 9.8 9.25 9.5 9.57<br />
22/08/11 7.6 11.58 6.8 9.21 7.4 9.53<br />
Appendix 2B: Air Monitoring Results<br />
Individual results in bold are above the yearly average limit.<br />
Individual results in bold and red, shaded grey are above daily limit.
<strong>Wambo</strong> <strong>Coal</strong> Pty Ltd <strong>AEMR</strong> <strong>2011</strong>-<strong>2012</strong><br />
<strong>Wambo</strong> <strong>Coal</strong> Dust Monitoring Program<br />
Particulate Matter (10 Micron) Monitoring Data<br />
Date of Run<br />
PM01 - Coralie<br />
(Sentinex 19)<br />
PM10 24<br />
Hour Result<br />
YTD<br />
Average<br />
PM02 - <strong>Wambo</strong> Road<br />
(Caban) (Sentinex 20)<br />
PM10 24<br />
Hour Result<br />
YTD<br />
Average<br />
PM03 - Thelander<br />
(Sentinex 21)<br />
PM10 24<br />
Hour Result<br />
YTD<br />
Average<br />
PM04 - Muller<br />
(Sentinex 22)<br />
PM10 24<br />
Hour Result<br />
YTD<br />
Average<br />
(ug/m 3 )<br />
(ug/m 3 )<br />
(ug/m 3 )<br />
(ug/m 3 )<br />
23/08/11 8.1 11.52 5.0 13.46 6.9 9.16 6.6 9.47<br />
24/08/11 12.0 11.53 9.0 13.33 9.2 9.17 10.1 9.49<br />
25/08/11 11.8 11.53 6.7 9.12 10.5 9.50<br />
26/08/11 17.8 11.64 22.3 13.59 14.3 9.21 15.4 9.61<br />
27/08/11 24.1 11.86 14.9 9.31 17.7 9.75<br />
28/08/11 18.6 11.97 16.6 9.43 16.5 9.86<br />
29/08/11 23.0 13.85 12.7 9.49 15.8 9.96<br />
30/08/11 17.2 12.06 16.9 13.93 18.1 9.63 19.3 10.11<br />
31/08/11 21.1 12.21 19.0 14.07 15.7 9.73 17.9 10.24<br />
01/09/11 18.6 12.31 17.3 14.15 16.2 9.83 17.1 10.35<br />
02/09/11 14.8 12.35 12.0 14.10 15.6 9.92 17.9 10.47<br />
03/09/11 14.5 12.38 11.5 14.03 12.6 9.96 13.4 10.51<br />
04/09/11 13.4 12.40 13.0 14.01 10.8 9.97 14.3 10.57<br />
05/09/11 18.6 12.49 19.9 14.14 15.3 10.05 17.0 10.66<br />
06/09/11 15.3 12.53 23.4 14.35 12.8 10.09 13.30 10.70<br />
07/09/11 24.6 12.71 18.2 14.44 17.3 10.20 21.1 10.85<br />
08/09/11 19.4 12.81 18.6 14.53 20.3 10.34 22.5 11.02<br />
09/09/11 5.4 12.70 4.7 14.32 3.5 10.25 4.6 10.93<br />
10/09/11 9.4 12.66 8.0 14.19 6.8 10.20 6.3 10.87<br />
11/09/11 10.1 12.62 12.2 14.15 7.5 10.16 7.6 10.82<br />
12/09/11 15.7 12.66 16.2 14.19 16.3 10.24 15.3 10.88<br />
13/09/11 14.0 12.68 20.5 14.31 5.4 10.18 7.9 10.84<br />
14/09/11 10.9 12.66 25.1 14.52 8.8 10.16 9.1 10.82<br />
15/09/11 27.0 12.85 29.6 14.81 11.1 10.17 11.8 10.83<br />
16/09/11 17.7 12.91 31.5 15.11 10.5 10.18 11.6 10.84<br />
17/09/11 21.2 13.02 23.0 15.26 12.6 10.21 15.8 10.90<br />
18/09/11 29.0 13.22 26.7 15.46 20.4 10.34 18.9 11.00<br />
19/09/11 37.1 13.52 42.3 15.93 43.1 10.74 41.5 11.38<br />
20/09/11 49.4 13.96 82.5 17.08 27.3 10.94 26.4 11.56<br />
21/09/11 25.3 14.10 30.1 17.30 12.6 10.96 14.5 11.60<br />
22/09/11 25.3 14.23 25.3 17.44 22.9 11.10 22.4 11.73<br />
23/09/11 32.9 14.45 34.9 17.72 25.6 11.28 21.8 11.85<br />
24/09/11 37.0 14.72 31.8 17.95 35.6 11.56 36.5 12.13<br />
25/09/11 5.3 14.61 4.2 17.73 4.6 11.48 3.8 12.04<br />
26/09/11 9.9 14.56 8.9 17.59 12.5 11.49 9.1 12.00<br />
27/09/11 13.2 14.54 12.5 17.51 15.1 11.53 14.6 12.03<br />
28/09/11 14.0 14.53 12.3 17.43 12.7 11.54 14.1 12.06<br />
29/09/11 7.2 14.45 6.7 17.27 5.7 11.48 5.5 11.98<br />
30/09/11 8.0 14.38 10.2 17.17 6.3 11.42 5.9 11.92<br />
01/10/11 8.7 14.32 9.1 17.05 6.8 11.37 6.7 11.86<br />
02/10/11 6.6 14.24 7.3 16.91 9.4 11.35 6.8 11.81<br />
03/10/11 10.8 14.20 11.0 16.83 10.0 11.34 11.0 11.80<br />
04/10/11 13.4 14.19 13.4 16.78 14.2 11.37 12.0 11.80<br />
05/10/11 15.6 14.21 17.2 16.79 14.0 11.39 16.1 11.85<br />
06/10/11 12.1 14.19 11.7 16.72 12.0 11.40 13.9 11.87<br />
07/10/11 20.5 14.25 22.8 16.80 17.2 11.46 21.0 11.96<br />
08/10/11 13.1 14.24 13.4 16.76 13.5 11.48 14.5 11.98<br />
09/10/11 12.4 14.22 6.5 16.62 6.5 11.43 6.1 11.93<br />
10/10/11 14.5 14.22 8.1 16.51 6.1 11.38 5.7 11.86<br />
11/10/11 14.7 14.23 12.9 16.47 10.0 11.37 7.6 11.82<br />
12/10/11 20.4 14.29 20.9 16.52 17.0 11.42 18.6 11.89<br />
13/10/11 27.1 14.41 17.4 16.53 19.1 11.49<br />
14/10/11 20.2 14.47 17.3 16.54 15.0 11.53 19.3 11.96<br />
Appendix 2B: Air Monitoring Results<br />
Individual results in bold are above the yearly average limit.<br />
Individual results in bold and red, shaded grey are above daily limit.
<strong>Wambo</strong> <strong>Coal</strong> Pty Ltd <strong>AEMR</strong> <strong>2011</strong>-<strong>2012</strong><br />
<strong>Wambo</strong> <strong>Coal</strong> Dust Monitoring Program<br />
Particulate Matter (10 Micron) Monitoring Data<br />
Date of Run<br />
PM01 - Coralie<br />
(Sentinex 19)<br />
PM10 24<br />
Hour Result<br />
YTD<br />
Average<br />
PM02 - <strong>Wambo</strong> Road<br />
(Caban) (Sentinex 20)<br />
PM10 24<br />
Hour Result<br />
YTD<br />
Average<br />
PM03 - Thelander<br />
(Sentinex 21)<br />
PM10 24<br />
Hour Result<br />
YTD<br />
Average<br />
PM04 - Muller<br />
(Sentinex 22)<br />
PM10 24<br />
Hour Result<br />
YTD<br />
Average<br />
(ug/m 3 )<br />
(ug/m 3 )<br />
(ug/m 3 )<br />
(ug/m 3 )<br />
15/10/11 14.8 14.47 12.0 16.49 10.3 11.51 11.5 11.95<br />
16/10/11 19.0 14.51 16.5 16.49 14.1 11.54 13.0 11.96<br />
17/10/11 24.2 14.60 21.2 16.54 24.5 11.66 28.9 12.12<br />
18/10/11 23.1 14.68 21.2 16.60 27.1 11.80 29.8 12.28<br />
19/10/11 23.0 14.75 27.7 16.73 19.5 11.87<br />
20/10/11 18.3 14.79 24.2 16.81 14.9 11.89 19.1 12.35<br />
21/10/11 27.0 14.90 38.6 17.06 22.9 11.99 19.4 12.41<br />
22/10/11 34.0 15.06 37.7 17.29 33.2 12.18 31.0 12.58<br />
23/10/11 30.2 15.20 34.3 17.47 28.1 12.32 30.7 12.74<br />
24/10/11 43.5 15.44 58.2 17.92 20.0 12.38 27.1 12.86<br />
25/10/11 22.8 15.51 36.4 18.11 15.5 12.41 15.0 12.88<br />
26/10/11 10.2 15.46 8.1 18.01 9.2 12.38 9.3 12.85<br />
27/10/11 21.9 15.52 10.9 17.93 15.3 12.41 14.9 12.87<br />
28/10/11 20.7 15.56 15.5 17.91 18.9 12.46 24.4 12.96<br />
29/10/11 16.0 15.56 18.7 17.92 12.7 12.46 16.8 13.00<br />
30/10/11 12.1 15.53 14.3 17.88 10.0 12.44 8.4 12.96<br />
31/10/11 15.2 15.53 11.5 17.81 17.0 12.48 13.2 12.96<br />
01/11/11 19.3 15.56 18.0 17.82 21.3 12.55 20.9 13.03<br />
02/11/11 25.9 15.65 22.7 17.86 20.1 12.61 18.5 13.07<br />
03/11/11 17.0 13.10<br />
04/11/11 19.7 15.68 18.0 17.87 24.4 13.19<br />
05/11/11 23.6 15.74 28.2 17.97 12.6 12.61 26.6 13.30<br />
06/11/11 21.4 15.79 30.1 18.08 23.3 12.69 22.6 13.37<br />
07/11/11 23.1 15.84 31.9 18.21 26.7 12.80 21.4 13.43<br />
08/11/11 29.7 15.95 40.8 18.43 26.1 12.91 25.8 13.53<br />
09/11/11 23.3 16.01 32.7 18.56 20.0 12.96 22.4 13.60<br />
10/11/11 25.4 16.08 43.5 18.79 18.8 13.01 20.3 13.65<br />
11/11/11 45.9 16.30 30.33 18.90 43.2 13.23 33.33 13.80<br />
12/11/11 28.2 16.39 25.8 18.96 31.6 13.37 26.2 13.89<br />
13/11/11 30.1 16.50 26.0 19.02 31.7 13.51 26.1 13.98<br />
14/11/11 28.0 16.58 32.7 19.15 32.5 13.65 21.5 14.04<br />
15/11/11 44.9 16.79 36.0 19.29 42.6 13.86 41.9 14.24<br />
16/11/11 29.3 16.88 28.4 19.37 22.5 13.93 26.4 14.33<br />
17/11/11 9.3 16.83 7.5 19.27 9.2 13.89 9.9 14.30<br />
18/11/11 14.6 16.81 13.6 19.22 17.5 13.92 17.4 14.32<br />
19/11/11 18.6 16.82 18.5 19.22 20.6 13.97 17.7 14.35<br />
20/11/11 32.7 16.94 31.3 19.32 22.1 14.02 24.4 14.42<br />
21/11/11 18.9 16.95 18.4 19.31 18.0 14.05 20.2 14.46<br />
22/11/11 9.6 16.90 12.9 19.26 14.6 14.06 12.9 14.45<br />
23/11/11 5.8 16.82 5.2 19.14 14.6 14.06 5.7 14.39<br />
24/11/11 10.5 16.78 9.7 19.06 6.4 14.01 10.7 14.36<br />
25/11/11 6.2 16.70 4.6 18.95 9.6 13.98 5.4 14.30<br />
26/11/11 7.9 16.64 5.2 18.84 4.4 13.91 4.2 14.23<br />
27/11/11 14.0 16.63 14.6 18.80 12.3 13.90 11.5 14.21<br />
28/11/11 20.3 16.65 19.0 18.80 23.7 13.97 23.0 14.27<br />
29/11/11 24.2 16.70 30.3 18.89 24.1 14.03 29.0 14.37<br />
30/11/11 22.6 16.74 27.1 18.96 15.3 14.04 18.0 14.39<br />
01/12/11 18.8 16.75 19.3 18.96 15.5 14.05 16.0 14.40<br />
02/12/11 15.8 16.75 16.5 18.94 17.2 14.07 19.5 14.44<br />
03/12/11 15.7 16.74 17.5 18.93 18.0 14.10 21.5 14.48<br />
04/12/11 14.2 16.73 16.9 18.92 13.7 14.09 17.3 14.50<br />
05/12/11 15.6 16.72 13.5 18.87 14.8 14.10 21.8 14.55<br />
06/12/11 15.3 16.71 14.2 18.84 26.1 14.18 19.0 14.58<br />
Appendix 2B: Air Monitoring Results<br />
Individual results in bold are above the yearly average limit.<br />
Individual results in bold and red, shaded grey are above daily limit.
<strong>Wambo</strong> <strong>Coal</strong> Pty Ltd <strong>AEMR</strong> <strong>2011</strong>-<strong>2012</strong><br />
<strong>Wambo</strong> <strong>Coal</strong> Dust Monitoring Program<br />
Particulate Matter (10 Micron) Monitoring Data<br />
Date of Run<br />
PM01 - Coralie<br />
(Sentinex 19)<br />
PM10 24<br />
Hour Result<br />
YTD<br />
Average<br />
PM02 - <strong>Wambo</strong> Road<br />
(Caban) (Sentinex 20)<br />
PM10 24<br />
Hour Result<br />
YTD<br />
Average<br />
PM03 - Thelander<br />
(Sentinex 21)<br />
PM10 24<br />
Hour Result<br />
YTD<br />
Average<br />
PM04 - Muller<br />
(Sentinex 22)<br />
PM10 24<br />
Hour Result<br />
YTD<br />
Average<br />
(ug/m 3 )<br />
(ug/m 3 )<br />
(ug/m 3 )<br />
(ug/m 3 )<br />
07/12/11 11.5 16.68 11.4 18.78 12.8 14.17 17.2 14.59<br />
08/12/11 10.0 16.63 7.3 18.70 9.6 14.14 11.3 14.57<br />
09/12/11 17.4 16.64 12.7 18.66 16.2 14.15 17.9 14.59<br />
10/12/11 13.1 16.62 12.2 18.61 17.4 14.17 16.0 14.60<br />
11/12/11 14.3 16.60 13.1 18.57 11.6 14.16 12.7 14.59<br />
12/12/11 8.6 16.55 6.5 18.48 6.1 14.11 7.8 14.55<br />
13/12/11 20.4 16.58 13.9 18.45 16.0 14.12 12.6 14.54<br />
14/12/11 21.5 16.61 16.1 18.43 19.2 14.15 19.0 14.56<br />
15/12/11 24.1 16.65 17.3 18.43 21.8 14.61<br />
16/12/11 22.8 16.69 12.6 18.39 21.9 14.20 18.0 14.63<br />
17/12/11 21.5 16.72 15.2 18.36 21.0 14.24 22.9 14.68<br />
18/12/11 18.0 16.72 20.0 18.38 19.6 14.27 27.3 14.75<br />
19/12/11 16.8 16.73 18.3 18.37 17.4 14.29 24.5 14.81<br />
20/12/11 21.1 16.75 14.0 18.35 18.4 14.31 14.9 14.81<br />
21/12/11 26.6 16.81 17.4 18.34 20.5 14.35 20.6 14.84<br />
22/12/11 16.6 16.81 13.6 18.31 14.7 14.35 22.2 14.89<br />
23/12/11 15.6 16.80 12.1 18.27 14.2 14.35 18.3 14.91<br />
24/12/11 20.0 16.82 14.3 18.24 19.3 14.38 19.1 14.93<br />
25/12/11 13.5 16.80 12.4 18.20 13.0 14.37 15.5 14.93<br />
26/12/11 12.8 16.78 13.2 18.17 12.0 14.36 12.7 14.92<br />
27/12/11 17.4 16.78 13.8 18.14 21.1 14.39 21.2 14.96<br />
28/12/11 23.4 16.82 19.1 18.15 21.5 14.43 29.1 15.03<br />
29/12/11 21.3 16.84 16.7 18.14 28.9 14.51 29.0 15.11<br />
30/12/11 22.2 16.87 21.7 18.16 30.8 14.60 29.5 15.19<br />
31/12/11 19.0 16.88 18.6 18.16 23.0 14.65 26.2 15.25<br />
01/01/12 24.1 16.92 23.3 18.20 21.8 14.69 26.4 15.31<br />
02/01/12 30.6 17.00 22.5 18.22 30.0 14.77 27.8 15.38<br />
03/01/12 21.8 17.02 33.33 18.32 30.33 14.86 32.22 15.47<br />
04/01/12 23.8 17.06 38.7 18.44 24.0 14.91 34.3 15.57<br />
05/01/12 36.2 17.16 34.6 18.54 34.5 15.01 35.2 15.68<br />
06/01/12 17.6 17.16 14.4 18.51 14.7 15.01 17.8 15.69<br />
07/01/12 19.1 17.17 22.5 18.54 31.7 15.10 29.6 15.76<br />
08/01/12 30.0 17.24 36.9 18.65 28.9 15.17 31.9 15.85<br />
09/01/12 20.7 17.26 20.6 18.66 16.7 15.18 20.7 15.87<br />
10/01/12 15.4 17.25 15.3 18.64 13.1 15.17 18.9 15.89<br />
11/01/12 31.1 17.32 26.1 18.68 16.5 15.18 16.7 15.89<br />
12/01/12 30.7 17.39 23.0 18.71 19.6 15.20 23.6 15.93<br />
13/01/12 25.3 17.43 31.5 18.78 26.7 15.26 34.4 16.03<br />
14/01/12 25.2 17.47 20.9 18.80 25.6 15.31 30.3 16.10<br />
15/01/12 18.7 17.48 12.5 18.76 16.3 15.32 21.4 16.13<br />
16/01/12 17.5 17.48 14.6 18.74 18.9 15.34 19.4 16.14<br />
17/01/12 23.9 17.51 18.8 18.74 24.0 15.38 26.4 16.20<br />
18/01/12 19.6 17.52 15.3 18.72 20.0 15.40 22.6 16.23<br />
19/01/12 19.2 17.53 14.5 18.69 19.8 15.42 28.5 16.29<br />
20/01/12 24.3 17.56 21.5 18.71 26.9 15.48 29.9 16.36<br />
21/01/12 20.2 17.58 16.7 18.70 17.7 15.49 26.7 16.41<br />
22/01/12 17.4 17.57 11.2 18.66 16.0 15.50 23.3 16.44<br />
23/01/12 23.0 17.60 14.2 18.63 17.1 15.50 19.6 16.46<br />
24/01/12 19.4 17.61 12.9 18.60 17.3 15.51 25.9 16.50<br />
25/01/12 12.7 17.59 8.2 18.54 9.2 15.48 18.0 16.51<br />
26/01/12 14.3 17.57 9.1 18.49 10.2 15.46 10.6 16.48<br />
27/01/12 23.9 17.60 14.0 18.47 15.7 15.46 16.6 16.48<br />
28/01/12 14.2 17.58 10.6 18.43 15.7 15.46 15.0 16.47<br />
Appendix 2B: Air Monitoring Results<br />
Individual results in bold are above the yearly average limit.<br />
Individual results in bold and red, shaded grey are above daily limit.
<strong>Wambo</strong> <strong>Coal</strong> Pty Ltd <strong>AEMR</strong> <strong>2011</strong>-<strong>2012</strong><br />
<strong>Wambo</strong> <strong>Coal</strong> Dust Monitoring Program<br />
Particulate Matter (10 Micron) Monitoring Data<br />
Date of Run<br />
PM01 - Coralie<br />
(Sentinex 19)<br />
PM10 24<br />
Hour Result<br />
YTD<br />
Average<br />
PM02 - <strong>Wambo</strong> Road<br />
(Caban) (Sentinex 20)<br />
PM10 24<br />
Hour Result<br />
YTD<br />
Average<br />
PM03 - Thelander<br />
(Sentinex 21)<br />
PM10 24<br />
Hour Result<br />
YTD<br />
Average<br />
PM04 - Muller<br />
(Sentinex 22)<br />
PM10 24<br />
Hour Result<br />
YTD<br />
Average<br />
(ug/m 3 )<br />
(ug/m 3 )<br />
(ug/m 3 )<br />
(ug/m 3 )<br />
29/01/12 19.4 17.59 13.7 18.40 18.5 15.47 17.2 16.48<br />
30/01/12 17.3 17.59 16.6 18.39 12.4 15.46 19.3 16.49<br />
31/01/12 14.1 17.58 16.2 18.38 12.9 15.45 12.9 16.47<br />
01/02/12 8.3 17.53 5.9 18.31 5.7 15.40 6.0 16.43<br />
02/02/12 6.6 17.48 5.4 18.25 4.3 15.35 5.1 16.37<br />
03/02/12 11.5 17.45 7.4 18.19 9.4 15.32 8.8 16.34<br />
04/02/12 20.0 17.46 12.1 18.16 15.3 15.32 15.1 16.33<br />
05/02/12 19.3 17.47 20.9 18.17 17.0 15.33 18.5 16.34<br />
06/02/12 34.7 17.55 22.4 18.20 25.1 15.37 25.5 16.38<br />
07/02/12 14.4 17.54 13.5 18.17 14.4 15.37 15.0 16.38<br />
08/02/12 21.6 17.56 19.0 18.18 21.8 15.40 21.3 16.40<br />
09/02/12 22.0 17.58 16.4 18.17 21.5 15.43 25.0 16.44<br />
10/02/12 19.0 17.58 15.2 18.15 15.1 15.42 17.7 16.44<br />
11/02/12 14.8 17.57 11.4 18.12 10.5 15.40 14.9 16.44<br />
12/02/12 15.4 17.56 15.4 18.11 15.4 15.40 17.5 16.44<br />
13/02/12 20.0 17.57 17.2 18.10 14.6 15.40 20.3 16.46<br />
14/02/12 22.0 17.59 13.2 18.08 16.5 15.40 14.9 16.45<br />
15/02/12 17.3 17.59 11.6 18.05 13.8 15.40 18.7 16.46<br />
16/02/12 19.7 17.60 16.8 18.04 16.7 15.40 21.7 16.48<br />
17/02/12 21.6 17.62 22.4 18.06 18.3 15.41 21.5 16.51<br />
18/02/12 26.6 17.65 23.4 18.09 22.9 15.45 24.9 16.54<br />
19/02/12 24.6 17.68 22.0 18.10 23.7 15.48 25.2 16.58<br />
20/02/12 16.2 17.68 13.4 18.08 10.2 15.46 15.0 16.57<br />
21/02/12 10.5 17.65 8.7 18.04 9.4 15.43 10.2 16.55<br />
22/02/12 21.2 17.66 14.8 18.02 17.6 15.44 17.9 16.55<br />
23/02/12 17.0 17.66 18.2 18.02 21.7 15.47 21.9 16.57<br />
24/02/12 27.2 17.70 15.5 18.01 19.0 15.48 30.1 16.63<br />
25/02/12 15.55 17.69 14.2 17.99 14.9 15.48 22.9 16.6666<br />
26/02/12 14.8 17.68 14.9 17.98 11.3 15.46 18.2 16.66<br />
27/02/12 15.9 17.67 21.8 18.00 16.4 15.47 15.6 16.66<br />
28/02/12 19.6 17.68 35.5 18.08 14.4 15.46 14.9 16.65<br />
29/02/12 17.1 17.68 20.5 18.09 17.4 15.47 23.7 16.68<br />
01/03/12 18.8 17.68 20.2 18.10 14.6 15.47 16.1 16.68<br />
02/03/12 6.8 17.64 5.0 18.04 2.1 15.41 4.8 16.63<br />
03/03/12 14.2 17.62 11.4 18.01 11.0 15.40 11.1 16.61<br />
04/03/12 19.2 17.63 16.1 18.00 13.9 15.39 15.1 16.60<br />
05/03/12 18.5 17.63 10.5 17.97 11.4 15.37 14.2 16.59<br />
06/03/12 21.6 17.65 16.5 17.96 16.1 15.38 20.1 16.61<br />
07/03/12 11.7 17.63 11.4 17.93 15.3 16.60<br />
08/03/12 8.9 17.59 8.6 17.89 3.2 15.33 4.3 16.55<br />
09/03/12 12.7 17.57 18.4 17.89 8.2 15.30 4.8 16.51<br />
10/03/12 20.4 17.58 16.9 17.89 14.9 15.30 11.7 16.49<br />
11/03/12 21.9 17.91 23.7 15.33 28.1 16.53<br />
12/03/12 22.8 17.60 16.3 17.90 19.3 15.35 23.1 16.56<br />
13/03/12 23.4 17.63 20.0 17.91 25.4 15.39 25.3 16.59<br />
14/03/12 23.6 17.65 18.6 17.91 19.6 15.40 24.8 16.62<br />
15/03/12 22.9 17.67 21.5 17.93 21.5 15.43 22.5 16.65<br />
16/03/12 14.8 17.66 25.8 17.96 13.7 15.42 15.7 16.64<br />
17/03/12 11.8 17.64 10.6 17.93 10.3 15.40 15.9 16.64<br />
18/03/12 16.3 17.63 14.5 17.91 16.5 15.40 18.8 16.65<br />
19/03/12 13.7 17.62 11.4 17.89 12.4 15.39 17.0 16.65<br />
20/03/12 20.6 17.63 14.4 17.87 18.9 15.41 18.0 16.66<br />
21/03/12 8.7 15.38<br />
Appendix 2B: Air Monitoring Results<br />
Individual results in bold are above the yearly average limit.<br />
Individual results in bold and red, shaded grey are above daily limit.
<strong>Wambo</strong> <strong>Coal</strong> Pty Ltd <strong>AEMR</strong> <strong>2011</strong>-<strong>2012</strong><br />
<strong>Wambo</strong> <strong>Coal</strong> Dust Monitoring Program<br />
Particulate Matter (10 Micron) Monitoring Data<br />
Date of Run<br />
PM01 - Coralie<br />
(Sentinex 19)<br />
PM10 24<br />
Hour Result<br />
YTD<br />
Average<br />
PM02 - <strong>Wambo</strong> Road<br />
(Caban) (Sentinex 20)<br />
PM10 24<br />
Hour Result<br />
YTD<br />
Average<br />
PM03 - Thelander<br />
(Sentinex 21)<br />
PM10 24<br />
Hour Result<br />
YTD<br />
Average<br />
PM04 - Muller<br />
(Sentinex 22)<br />
PM10 24<br />
Hour Result<br />
YTD<br />
Average<br />
(ug/m 3 )<br />
(ug/m 3 )<br />
(ug/m 3 )<br />
(ug/m 3 )<br />
22/03/12 20.2 17.64 11.4 17.84 17.5 15.39 17.7 16.66<br />
23/03/12 24.0 17.66 29.3 17.89 20.4 15.41 18.8 16.67<br />
24/03/12 22.0 17.68 17.1 17.89 12.5 15.40 13.6 16.66<br />
25/03/12 20.7 17.69 14.7 17.88 19.3 15.41 25.5 16.69<br />
26/03/12 21.4 17.70 17.2 17.87 17.8 15.42 24.6 16.72<br />
27/03/12 25.4 17.73 18.7 17.88 17.7 15.43 22.2 16.74<br />
28/03/12 22.6 17.75 19.0 17.88 15.9 15.43 27.2 16.78<br />
29/03/12 24.8 17.78 13.3 17.86 11.0 15.41 16.2 16.78<br />
30/03/12 19.9 17.78 15.3 17.85 18.3 15.42 20.7 16.79<br />
31/03/12 17.8 17.78 15.3 17.84 14.7 15.42 17.3 16.79<br />
01/04/12 25.1 17.81 19.1 17.85 16.2 15.42 18.0 16.80<br />
02/04/12 25.0 17.84 13.7 17.83 16.9 15.43 16.2 16.79<br />
03/04/12 23.5 17.86 21.0 17.84 20.2 15.45 22.3 16.81<br />
04/04/12 40.0 17.94 24.0 17.87 25.4 15.48 29.5 16.86<br />
05/04/12 33.4 17.99 17.7 17.87 20.5 15.50 25.4 16.89<br />
06/04/12 24.9 18.02 20.7 17.88 19.5 15.52 23.2 16.91<br />
07/04/12 35.8 18.08 32.7 17.94 26.4 15.56 26.5 16.95<br />
08/04/12 28.0 18.12 29.8 17.98 30.9 15.61 31.7 17.00<br />
09/04/12 14.4 18.11 13.7 17.97 11.1 15.59 10.4 16.98<br />
10/04/12 12.9 18.09 14.4 17.95 9.8 15.57 14.5 16.97<br />
11/04/12 11.7 18.06 13.5 17.93 11.1 15.56 15.3 16.96<br />
12/04/12 12.8 18.05 9.8 17.90 13.5 15.55 13.6 16.95<br />
13/04/12 21.6 18.06 24.7 17.93 13.2 15.54 15.3 16.95<br />
14/04/12 12.1 18.04 21.3 17.94 10.7 15.53 17.0 16.95<br />
15/04/12 25.4 18.06 30.6 17.99 21.0 15.54 25.1 16.97<br />
16/04/12 29.4 18.10 22.0 18.01 25.2 15.58 30.3 17.02<br />
17/04/12 11.0 18.08 16.4 18.00 10.6 15.56 11.1 17.00<br />
18/04/12 11.9 18.06 59 5.9 17.95 13.8 15.5555 14.11 16.99<br />
19/04/12 12.8 18.04 8.9 17.92 22.6 15.58 11.8 16.97<br />
20/04/12 19.3 18.04 12.3 17.90 11.5 15.56 17.7 16.97<br />
21/04/12 21.3 18.05 13.8 17.88 16.8 15.57 20.4 16.99<br />
22/04/12 19.5 18.06 20.1 17.89 18.4 15.58 21.6 17.00<br />
23/04/12 15.4 18.05 14.4 17.88 8.7 15.56 13.3 16.99<br />
24/04/12 14.3 18.04 9.6 17.85 8.8 15.53 8.6 16.96<br />
25/04/12 9.5 18.01 15.2 17.84 8.0 15.51 7.5 16.93<br />
26/04/12 17.5 18.01 17.2 17.84 11.3 15.49 13.3 16.92<br />
27/04/12 18.5 18.01 22.1 17.85 15.3 15.49 16.2 16.91<br />
28/04/12 17.5 18.01 25.1 17.88 13.4 15.49 17.7 16.92<br />
29/04/12 15.3 18.00 15.4 17.87 14.5 15.48 17.6 16.92<br />
30/04/12 25.0 18.02 24.2 17.89 22.6 15.51 22.4 16.94<br />
01/05/12 20.8 18.03 20.6 17.90 13.6 15.50 17.3 16.94<br />
02/05/12 22.0 18.04 23.9 17.92 8.7 15.48 11.2 16.92<br />
03/05/12 14.9 18.03 9.9 17.89 6.6 15.45 7.7 16.89<br />
04/05/12 21.5 18.04 16.9 17.89 14.5 15.44 14.6 16.88<br />
05/05/12 10.1 18.02 12.7 17.87 6.7 15.42 10.2 16.86<br />
06/05/12 10.9 17.99 17.7 17.87 7.8 15.39 6.9 16.83<br />
07/05/12 17.1 17.99 15.2 17.86 10.6 15.38 11.1 16.81<br />
08/05/12 17.3 17.99 16.6 17.86 13.5 15.37 8.4 16.78<br />
09/05/12 27.0 18.02 25.0 17.88 10.3 15.35 9.3 16.76<br />
10/05/12 33.7 18.07 22.1 17.90 11.4 15.34 9.8 16.74<br />
11/05/12 19.7 18.07 27.1 17.93 11.9 15.33 11.9 16.72<br />
12/05/12 18.0 18.07 24.4 17.95 12.0 15.32 10.3 16.70<br />
13/05/12 19.2 18.08 18.4 17.95 12.0 15.31 11.2 16.68<br />
Appendix 2B: Air Monitoring Results<br />
Individual results in bold are above the yearly average limit.<br />
Individual results in bold and red, shaded grey are above daily limit.
<strong>Wambo</strong> <strong>Coal</strong> Pty Ltd <strong>AEMR</strong> <strong>2011</strong>-<strong>2012</strong><br />
<strong>Wambo</strong> <strong>Coal</strong> Dust Monitoring Program<br />
Particulate Matter (10 Micron) Monitoring Data<br />
Date of Run<br />
PM01 - Coralie<br />
(Sentinex 19)<br />
PM10 24<br />
Hour Result<br />
YTD<br />
Average<br />
PM02 - <strong>Wambo</strong> Road<br />
(Caban) (Sentinex 20)<br />
PM10 24<br />
Hour Result<br />
YTD<br />
Average<br />
PM03 - Thelander<br />
(Sentinex 21)<br />
PM10 24<br />
Hour Result<br />
YTD<br />
Average<br />
PM04 - Muller<br />
(Sentinex 22)<br />
PM10 24<br />
Hour Result<br />
YTD<br />
Average<br />
(ug/m 3 )<br />
(ug/m 3 )<br />
(ug/m 3 )<br />
(ug/m 3 )<br />
14/05/12 15.8 18.07 17.1 17.95 11.8 15.30 8.8 16.66<br />
15/05/12 25.4 18.09 21.7 17.96 11.1 15.28 11.7 16.64<br />
16/05/12 26.2 18.12 33.6 18.02 16.2 15.29 18.0 16.65<br />
17/05/12 26.7 18.15 28.4 18.05 14.8 15.29 15.8 16.64<br />
18/05/12 22.0 18.16 23.6 18.07 13.5 15.28 14.9 16.64<br />
19/05/12 13.8 18.14 38.1 18.14 13.6 15.27 11.8 16.62<br />
20/05/12 20.7 18.15 26.2 18.16 15.7 15.28 16.6 16.62<br />
21/05/12 25.0 18.17 23.8 18.18 17.7 15.28 19.2 16.63<br />
22/05/12 14.8 18.16 24.3 18.20 13.5 15.28 11.3 16.61<br />
23/05/12 22.2 18.18 30.3 18.24 13.0 15.27 17.6 16.62<br />
24/05/12 20.2 18.18 22.2 18.26 17.1 15.28 17.9 16.62<br />
25/05/12 9.3 18.15 9.4 18.23 8.3 15.25 7.5 16.59<br />
26/05/12 8.6 18.13 13.5 18.21 5.4 15.22 7.9 16.57<br />
27/05/12 10.6 18.10 6.4 18.17 6.4 15.20 6.7 16.54<br />
28/05/12 23.8 18.12 15.9 18.17 10.0 15.18 10.9 16.52<br />
29/05/12 10.7 18.10 8.2 18.13 7.5 15.16 11.6 16.51<br />
30/05/12 14.9 18.09 8.9 18.10 19.1 16.51<br />
31/05/12 21.5 18.10 11.5 18.08 17.3 15.17 23.3 16.53<br />
01/06/12 15.1 18.09 9.3 18.05 13.6 15.16 19.7 16.54<br />
02/06/12 10.3 18.07 6.1 18.02 11.2 15.15 17.2 16.54<br />
03/06/12 5.2 18.03 4.0 17.97 6.1 15.12 8.0 16.52<br />
04/06/12 5.7 17.99 5.4 17.93 3.8 15.09 5.0 16.49<br />
05/06/12 7.4 17.96 9.3 17.90 7.6 15.07 6.2 16.45<br />
06/06/12 11.1 17.94 10.0 17.88 8.9 15.05 9.5 16.43<br />
07/06/12 14.8 17.93 6.3 17.84 9.1 15.03 11.2 16.42<br />
08/06/12 12.2 17.91 10.3 17.82 6.5 15.00 7.5 16.39<br />
09/06/12 14.1 17.90 11.4 17.80 8.4 14.99 9.5 16.37<br />
10/06/12 17.6 17.90 12.22 17.7878 86 8.6 14.97 10.00 16.35<br />
11/06/12 6.8 17.87 5.4 17.74 4.5 14.94 7.7 16.33<br />
12/06/12 8.4 17.84 7.6 17.71 8.2 14.92 10.6 16.31<br />
13/06/12 9.3 17.82 8.2 17.68 13.2 14.91 9.7 16.29<br />
14/06/12 18.8 17.82 15.5 17.67 11.0 14.90 11.8 16.28<br />
15/06/12 23.3 17.83 11.8 17.66 7.9 14.88 8.5 16.26<br />
16/06/12 10.4 17.81 12.2 17.64 8.4 14.86 9.1 16.24<br />
17/06/12 6.4 17.78 7.9 17.61 5.5 14.83 5.9 16.21<br />
18/06/12 12.1 17.76 10.2 17.59 5.0 14.81 5.8 16.18<br />
19/06/12 14.5 17.76 6.9 17.55 5.5 14.78 5.0 16.15<br />
20/06/12 19.3 17.76 11.1 17.54 4.8 14.75 4.9 16.11<br />
21/06/12 11.6 17.74 16.5 17.53 7.0 14.73 7.1 16.09<br />
22/06/12 10.3 17.72 16.2 17.53 9.3 14.71 9.2 16.07<br />
23/06/12 6.3 17.69 6.7 17.50 4.7 14.69 5.1 16.04<br />
24/06/12 7.6 17.66 11.2 17.48 5.5 14.66 5.9 16.01<br />
25/06/12 18.4 17.66 13.7 17.47 6.3 14.64 5.3 15.98<br />
26/06/12 12.0 17.65 8.2 17.44 11.1 14.63 9.6 15.96<br />
27/06/12 10.5 17.63 8.3 17.41 10.2 14.61 13.7 15.96<br />
28/06/12 10.8 17.61 6.8 17.38 9.9 14.60 15.8 15.96<br />
29/06/12 19.4 17.61 17.4 17.38 10.3 14.59 16.3 15.96<br />
30/06/12 12.6 17.60 10.8 17.36 5.0 14.56 5.6 15.93<br />
Run 366.0 366.0 366.0 366.0<br />
Data 362.0 340.0 361.0 363.0<br />
Capture % 99 93 99 99<br />
Max 49.4 82.5 43.2 41.9<br />
Appendix 2B: Air Monitoring Results<br />
Individual results in bold are above the yearly average limit.<br />
Individual results in bold and red, shaded grey are above daily limit.
<strong>Wambo</strong> <strong>Coal</strong> Pty Ltd <strong>AEMR</strong> <strong>2011</strong>-<strong>2012</strong><br />
Date of Run<br />
TSP Result<br />
(ug/m 3 )<br />
Monthly<br />
Mean<br />
YTD<br />
Average<br />
<strong>Wambo</strong> <strong>Coal</strong> Dust Monitoring Program<br />
High Volume Air Sampling<br />
HV01 - Coralie HV02 - <strong>Wambo</strong> Road HV03 - Thelander<br />
TSP Result<br />
(ug/m 3 )<br />
Monthly<br />
Mean<br />
YTD<br />
Average<br />
TSP<br />
Result<br />
(ug/m 3 )<br />
Monthly<br />
Mean<br />
YTD<br />
Average<br />
TSP<br />
Result<br />
(ug/m 3 )<br />
HV04 - Muller<br />
01/07/11 23.2 23 7.2 7 7 7 16.5 17<br />
07/07/11 37.1 30 26.4 17 8.6 8 7.7 12<br />
13/07/11 22.3 28 90.2 41 16.8 11 13.9 13<br />
19/07/11 21.9 26 18.8 36 6.2 10 8.8 12<br />
25/07/11 21.4 25 24.4 33 6.5 9 6.5 11<br />
31/07/11 29.7 26 26 48.3 42 36 16.3 11 10 21.9 12 13<br />
06/08/11 52.9 30 58.8 39 22 12 23.8 14<br />
12/08/11 27 29 28.3 38 10 12 27.7 16<br />
18/08/11 13.2 28 13.1 35 9 11 11.2 15<br />
24/08/11 26.7 28 19.1 33 22.1 12 21.4 16<br />
30/08/11 47.1 33 29 41 32 34 37.8 20 15 46.9 26 19<br />
05/09/11 58.8 32 67.1 37 35.2 16 45.6 21<br />
11/09/11 25.1 31 29 36 7.5 16 10 20<br />
17/09/11 66.9 34 77.6 39 25.8 16 34.4 21<br />
23/09/11 92 38 77.7 42 47.1 19 57.6 24<br />
29/09/11 20.5 53 37 13 53 40 9.5 25.02 18 11 31.72 23<br />
05/10/11 51.2 37 56.9 41 39.3 19 44.8 24<br />
11/10/11 55.4 38 38.4 41 18 19 23.3 24<br />
17/10/11 80.2 41 62.1 42 63.5 21 89.4 27<br />
23/10/11 100 44 103 45 74.4 24 79.4 30<br />
29/10/11 71.2 72 45 66.7 65 46 36.1 46.26 25 42.3 55.84 31<br />
04/11/11 115 48 74 47 86.6 28 76.5 33<br />
10/11/11 103 51 120 50 49.2 28 50.7 34<br />
16/11/11 75.6 52 71.5 51 40.4 29 56.4 34<br />
22/11/11 37.2 51 40.2 51 22 29 31.8 34<br />
28/11/11 61 78 51 63.6 74 51 52.7 50.18 30 56.3 54.34 35<br />
04/12/11 41.4 51 23.5 50 24.5 29 61.7 36<br />
10/12/11 46.2 51 34.3 50 40.2 30 46.1 37<br />
16/12/11 82.6 52 42 50 65.3 31 61.8 37<br />
22/12/11 57.1 52 37.1 49 39.6 31 80.8 39<br />
28/12/11 56.8 57 52 33.1 34 49 42.8 42.48 32 77.1 65.5 40<br />
03/01/12 87.4 53 122 51 89.0 33 117 43<br />
09/01/12 52.6 53 53.4 51 41.9 34 48.1 43<br />
15/01/12 91.1 54 44.5 51 61 35 83.3 44<br />
21/01/12 62.9 55 38.6 50 56.2 35 98.5 45<br />
27/01/12 91.9 77 56 43.6 60 50 48.9 59.4 36 47.4 78.86 45<br />
02/02/12 11.4 55 12.8 49 4.8 35 4.8 44<br />
08/02/12 56.3 55 40 49 44.1 35 42.9 44<br />
Monthly<br />
Mean<br />
YTD<br />
Average<br />
Appendix 2B: Air Monitoring Results<br />
Individual results in bold are above the long-term goal for TSP
<strong>Wambo</strong> <strong>Coal</strong> Pty Ltd <strong>AEMR</strong> <strong>2011</strong>-<strong>2012</strong><br />
Date of Run<br />
TSP Result<br />
(ug/m 3 )<br />
HV01 - Coralie HV02 - <strong>Wambo</strong> Road HV03 - Thelander<br />
Monthly<br />
Mean<br />
YTD<br />
Average<br />
TSP Result<br />
(ug/m 3 )<br />
Monthly<br />
Mean<br />
YTD<br />
Average<br />
TSP<br />
Result<br />
(ug/m 3 )<br />
Monthly<br />
Mean<br />
YTD<br />
Average<br />
TSP<br />
Result<br />
(ug/m 3 )<br />
HV04 - Muller<br />
14/02/12 66.2 55 28.1 48 35 57.4 45<br />
20/02/12 36.1 54 32 48 16.3 34 27.3 44<br />
26/02/12 41.5 42 54 50.8 33 48 21 21.55 34 82.2 42.92 45<br />
03/03/12 31.8 54 27.4 48 17.1 34 22.4 45<br />
09/03/12 39.8 53 65.4 48 19.9 33 37.3 44<br />
15/03/12 57.7 53 61.2 48 58.4 34 44<br />
21/03/12 47.3 53 44.4 48 18.4 34 44<br />
27/03/12 82.3 52 54 57.5 51 48 37.4 30 34 30 44<br />
02/04/12 87.4 55 50.5 48 57.6 34 82.3 45<br />
08/04/12 82.7 55 93.4 49 79.1 35 102 47<br />
14/04/12 42.6 55 76.8 50 23.6 35 122 48<br />
20/04/12 63.4 55 43.5 50 29.4 35 58.8 48<br />
26/04/12 55.8 66 55 68.5 67 50 38.2 46 35 84.3 90 49<br />
02/05/12 68.1 55 78 51 18.3 35 30 49<br />
08/05/12 43.5 55 61.6 51 21 34 17.4 48<br />
14/05/12 43.2 55 50.7 51 19.8 34 18.8 48<br />
20/05/12 64.5 55 86.9 52 30 34 50.4 48<br />
26/05/12 29.1 50 55 57 67 52 11 20 34 14 26 47<br />
01/06/12 51.7 55 27.2 51 42.4 34 76.3 48<br />
07/06/12 35 54 13.6 51 16.8 33 30.1 47<br />
13/06/12 16.7 54 16.1 50 13.2 33 40.6 47<br />
19/06/12 31.8 53 28.6 50 5.2 33 4.2 46<br />
25/06/12 41.3 35 53 52.9 28 50 4.9 17 32 7.9 32 46<br />
Monthly<br />
Mean<br />
YTD<br />
Average<br />
HV01 HV02 HV03 HV04<br />
Total Runs to Date 61 61 61 61 61<br />
Possible Runs to Date 61 61 61 60 58<br />
% Capture 100 100 100 98 95<br />
Annual Average (ug/m3) 53 50 32 46<br />
Max 115 122 89 122<br />
Appendix 2B: Air Monitoring Results<br />
Individual results in bold are above the long-term goal for TSP
Appendix 2C<br />
Surface Water Monitoring<br />
Results
Annual Environmental Management Report <strong>2011</strong>-<strong>2012</strong><br />
EC and Flow Data for Wollombi Brook (Warkworth) January <strong>2011</strong> to December <strong>2011</strong><br />
EC and Flow Data for Wollombi Brook (Warkworth) January <strong>2012</strong> to July <strong>2012</strong><br />
Source: http://realtimedata.water.nsw.gov.au/water.stm?ppbm=SURFACE_WATER&rs&3&rskm_url<br />
Appendix 2C: Surface Water Monitoring Results
Annual Environmental Management Report <strong>2011</strong>-<strong>2012</strong><br />
EC and Flow Data for Wollombi Brook (Bulga) January <strong>2011</strong> to December <strong>2011</strong><br />
EC and Flow Data for Wollombi Brook (Bulga) January <strong>2012</strong> to July <strong>2012</strong><br />
Source: http://realtimedata.water.nsw.gov.au/water.stm?ppbm=SURFACE_WATER&rs&3&rskm_url<br />
Appendix 2C: Surface Water Monitoring Results
Annual Environmental Management Report <strong>2011</strong>-<strong>2012</strong><br />
Monthly Surface Water Monitoring<br />
Mine Water Dams<br />
SW30 - Turkeys Nest Dam SW31 - GBF Dam SW38 - Homestead Open Cut<br />
SW47 - NWU Pumpout SW48 - Homestead Pit Inflow SW49 - Bates Pit Pump Out<br />
Monthly Surface Water Monitoring<br />
Mine Water Dams<br />
SW30 - Turkeys Nest Dam SW31 - GBF Dam SW38 - Homestead Open Cut<br />
SW47 - NWU Pumput SW48 - Homestead Pit Inflow SW49 - Bates Pit Pump Out<br />
pH<br />
10.0<br />
9.0<br />
8.0<br />
7.0<br />
6.0<br />
5.0<br />
Jul-11<br />
Aug-11<br />
Sep-11<br />
Oct-11<br />
Nov-11<br />
Dec-11<br />
Jan-12<br />
Month<br />
Feb-12<br />
Mar-12<br />
Apr-12<br />
May-12<br />
Jun-12<br />
Electrical Conductivity (uS/cm)<br />
10,000<br />
9,000<br />
8,000<br />
7,000<br />
6,000<br />
5,000<br />
4,000<br />
3,000<br />
2,000<br />
1,000<br />
0<br />
Jul-11<br />
Aug-11<br />
Sep-11<br />
Oct-11<br />
Nov-11<br />
Dec-11<br />
Jan-12<br />
Month<br />
Feb-12<br />
Mar-12<br />
Apr-12<br />
May-12<br />
Jun-12<br />
Monthly Surface Water Monitoring<br />
Mine Water Dams<br />
Monthly Surface Water Monitoring<br />
Mine Water Dams<br />
SW13 - Area C Dam<br />
SW14 - Admin Dam<br />
SW13 - Area C Dam<br />
SW14 - Admin Dam<br />
pH<br />
10.0<br />
9.0<br />
8.0<br />
7.0<br />
6.0<br />
5.0<br />
Jul-11<br />
Aug-11<br />
Sep-11<br />
SW29 - SCB Dam<br />
Oct-11<br />
Nov-11<br />
Dec-11<br />
Jan-12<br />
Month<br />
SW37 - Wollemi Sump<br />
Feb-12<br />
Mar-12<br />
Apr-12<br />
May-12<br />
Jun-12<br />
Electrical Conductivity (uS/cm)<br />
8,000<br />
7,000<br />
6,000<br />
5,000<br />
4,000<br />
3,000<br />
2,000<br />
1,000<br />
0<br />
Jul-11<br />
Aug-11<br />
Sep-11<br />
SW29 - SCB Dam<br />
Oct-11<br />
Nov-11<br />
Dec-11<br />
Jan-12<br />
Month<br />
SW37 - Wollemi Sump<br />
Feb-12<br />
Mar-12<br />
Apr-12<br />
May-12<br />
Jun-12<br />
Appendix 2C: Surface Water Monitoring Results (Mine Water)<br />
Blank in graph indicates that no sample was collected
Annual Environmental Management Report <strong>2011</strong>-<strong>2012</strong><br />
Monthly Surface Water Monitoring<br />
Mine Water Dams<br />
Monthly Surface Water Monitoring<br />
Mine Water Dams<br />
10.0<br />
9.0<br />
8.0<br />
7.0<br />
6.0<br />
5.0<br />
SW15 - Eagles Nest Dam<br />
Monthly Surface Water Monitoring<br />
Mine Water Dams<br />
Monthly Surface Water Monitoring<br />
Mine Water Dams<br />
SW15 Eagles Nest Dam<br />
80<br />
70<br />
60<br />
50<br />
40<br />
30<br />
20<br />
10<br />
0<br />
6,000<br />
5,000<br />
4,000<br />
3,000<br />
2,000<br />
1,000<br />
0<br />
SW15 - Eagles Nest Dam<br />
Total Suspended Solids (mg/L)<br />
Mar-12<br />
Apr-12<br />
May-12<br />
Jun-12<br />
Total Dissolved Solids (mg/L)<br />
Jul-11<br />
Aug-11<br />
Sep-11<br />
Oct-11<br />
Nov-11<br />
Dec-11<br />
Jan-12<br />
Feb-12<br />
Mar-12<br />
Apr-12<br />
May-12<br />
Jun-12<br />
pH<br />
Month<br />
9,000<br />
8,000<br />
7,000<br />
6,000<br />
5,000<br />
4,000<br />
3,000<br />
2,000<br />
1,000<br />
0<br />
SW15 - Eagles Nest Dam<br />
Electrical Conductivity (uS/cm)<br />
Jul-11<br />
Aug-11<br />
Sep-11<br />
Oct-11<br />
Nov-11<br />
Dec-11<br />
Jan-12<br />
Feb-12<br />
Mar-12<br />
Apr-12<br />
May-12<br />
Jun-12<br />
Month<br />
Jul-11<br />
Aug-11<br />
Sep-11<br />
Oct-11<br />
Nov-11<br />
Dec-11<br />
Jan-12<br />
Feb-12<br />
Jul-11<br />
Aug-11<br />
Sep-11<br />
Oct-11<br />
Nov-11<br />
Dec-11<br />
Jan-12<br />
Feb-12<br />
Mar-12<br />
Apr-12<br />
May-12<br />
Jun-12<br />
Month<br />
Month<br />
Appendix 2C: Surface Water Monitoring Results (Mine Water) Blank in graph indicates that no sample was collected
Annual Environmental Management Report <strong>2011</strong>-<strong>2012</strong><br />
Monthly Surface Water Monitoring<br />
Mine Water Dams<br />
Monthly Surface Water Monitoring<br />
Mine Water Dams<br />
pH<br />
10.0<br />
9.0<br />
8.0<br />
7.0<br />
6.0<br />
5.0<br />
Jul-11<br />
Aug-11<br />
SW11 - West Cut Dam Pipe<br />
SW20 - Dam Adj to West Cut Dam<br />
Sep-11<br />
Oct-11<br />
Nov-11<br />
Dec-11<br />
Jan-12<br />
Feb-12<br />
SW12 - West Cut Dam<br />
Mar-12<br />
Apr-12<br />
May-12<br />
Jun-12<br />
Electrical Conductivity (uS/cm)<br />
8,000<br />
7,000<br />
6,000<br />
5,000<br />
4,000<br />
3,000<br />
2,000<br />
1,000<br />
0<br />
Jul-11<br />
SW11 - West Cut Dam Pipe<br />
SW20 - Dam Adj to West Cut Dam<br />
Aug-11<br />
Sep-11<br />
Oct-11<br />
Nov-11<br />
Dec-11<br />
Jan-12<br />
Feb-12<br />
SW12 - West Cut Dam<br />
Mar-12<br />
Apr-12<br />
May-12<br />
Jun-12<br />
Month<br />
Month<br />
Appendix 2C: Surface Water Monitoring Results (Mine Water)<br />
Blank in graph indicates that no sample was collected
Annual Environmental Management Report <strong>2011</strong>-<strong>2012</strong><br />
Month<br />
SW12 - West Cut Dam<br />
SW14 - Box Cut Dam<br />
(Admin)<br />
SW15 - Eagles Nest Dam<br />
pH EC (uS/cm) pH EC (uS/cm) pH EC (uS/cm) TSS (mg/L) TDS (mg/L)<br />
Jul-11 8.70 5,730 8.70 1,105 8.90 7,330<br />
Aug-11 8.90 1,378 9.10 6,440 10 4,150<br />
Sep-11 9.30 6,630 8.70 1,093 9.10 5,970 73 3,830<br />
Oct-11 8.90 715 9.10 6,450<br />
Nov-11 9.10 6,250 8.90 728 9.00 6,870 24 5,000<br />
Dec-11 8.90 645 8.80 4,930 27 3,320<br />
Jan-12 8.90 7,430 8.90 723 8.60 6,510
Annual Environmental Management Report <strong>2011</strong>-<strong>2012</strong><br />
SW47 - NWU Pumpout<br />
SW49 - Bates Pit Pump<br />
SW48 - Inpit Water<br />
Month<br />
water<br />
out<br />
SW51 - South Dam<br />
pH EC (uS/cm) pH EC (uS/cm) pH EC (uS/cm) pH EC (uS/cm)<br />
Jul-11 8.80 9,180 8.40 6,180 8.30 3,180 8.9 7730<br />
Aug-11 8.80 8,780 7.90 7,330 8.50 1,478 8.9 7540<br />
Sep-11 9.00 6,530 8.50 6,800 8.20 1,150 9.1 7350<br />
Oct-11 9.50 6,780 8.60 6,150 8.60 1261.00 9.1 6400<br />
Nov-11 8.60 5,900 7.30 3,170 9 6920<br />
Dec-11 8.50 3,800 6.80 712 9 6480<br />
Jan-12 8.20 5,750 8.60 914 8.8 6530<br />
Feb-12 8.50 3,950 8.30 807 8.9 6780<br />
Mar-12 7.50 5,240 8.70 738 9 7260<br />
Apr-12 8.60 7,030 8.70 813 9.1 7,430<br />
May-12 8.70 6,670 8.70 649 9 6,760<br />
Jun-12 8.70 6,830 8.70 813 9.00 6,160<br />
Average 9.03 7,818 8.39 5,969 8.28 1,307 8.98 6,945<br />
Appendix 2C: Surface Water Monitoring Results (Mine Water)<br />
Blank cells indicate that no sample was collected due to the site being dry, inaccessible or not due for collection<br />
Bolded/shaded cells indicate results outside recommended criteria
Annual Environmental Management Report <strong>2011</strong>-12<br />
Month<br />
SW03 - Wollombi Brook Pump Out<br />
SW02 - Wollombi Brook Down<br />
pH EC (uS/cm) TSS (mg/L) TDS (mg/L) O&G (mg/L) pH EC (uS/cm) TSS (mg/L) TDS (mg/L) O&G (mg/L)<br />
Jul-11 7.20 286 12 191
Annual Environmental Management Report <strong>2011</strong> - <strong>2012</strong><br />
Month<br />
SW01 - Wollombi Brook Up SW03 - Wollombi Brook Pump Out SW02 - Wollombi Brook Down<br />
pH EC (uS/cm) TSS (mg/L) TDS (mg/L) pH EC (uS/cm) TSS (mg/L) TDS (mg/L) pH EC (uS/cm) TSS (mg/L) TDS (mg/L)<br />
Criteria 6.0-9.5 3,269 120 N/A 6.0-9.5 3,269 120 N/A 6.0-9.5 3,269 120 N/A<br />
Jul-11 7.20 285 12 190 7.20 286 12 191 7.10 354 15 204<br />
Aug-11 7.40 398 6 226 7.80 392 7 228 7.40 398 6 220<br />
Sep-11 7.60 474 8 258 7.80 465 14 278 7.90 481 6 270<br />
Oct-11 8.10 302 7 138 7.20 269 8 189 9.00 340 5 174<br />
Nov-11 7.00 589 5 348 7.50 577 11 320 7.80 623 18 354<br />
Dec-11 7.80 212 16 185 7.70 290 42 192 8.10 376 17 223<br />
Jan-12 7.30 536 6 406 7.40 553 10 340 7.30 583 5 366<br />
Feb-12 7.80 366 5 196 7.60 412 8 214 8.80 511 6 244<br />
Mar-12 7.60 306 9 188 7.20 350 58 194 7.10 299 17 189<br />
Apr-12 7.30 444 8 212 7.60 464 8 218 7.40 470 6 244<br />
May-12 7.40 545 6 332 7.70 602 17 319 7.50 622 5 330<br />
Jun-12 8.00 433 8 268 7.70 437 12 248 7.40 442 8 274<br />
Average 7.54 408 8 246 7.53 425 17 244 7.73 458 10 258<br />
Month<br />
SW40 - Wollombi Brook Upstream of SWC SW04 - North <strong>Wambo</strong> Creek Up SW26 - North <strong>Wambo</strong> Creek Middle Upper<br />
pH EC (uS/cm) TSS (mg/L) TDS (mg/L) pH EC (uS/cm) TSS (mg/L) TDS (mg/L) pH EC (uS/cm) TSS (mg/L) TDS (mg/L)<br />
Criteria 6.0-9.5 3,269 120 N/A 6.0-9.5 2,140 120 N/A 6.0-9.5 2,140 120 N/A<br />
Jul-11 6.40 275<br />
Aug-11 7.50 396<br />
Sep-11 7.80 455 12 266<br />
Oct-11 8.20 280 6 171<br />
Nov-11 6.90 637 50 149<br />
Dec-11 8.40 315 15 227 8.00 280 5 173<br />
Jan-12 7.50 750 532 5 322<br />
Feb-12 8.20 381 6 206<br />
Mar-12 7.70 647 87 116<br />
Apr-12 7.40 444 14 190<br />
May-12 7.50 600 12 302<br />
Jun-12 8.20 443 6 286<br />
Average 7.64 450 21 224 8.00 280 5 173<br />
Appendix 2C: Surface Water Monitoring Results<br />
Blank cells indicate that no sample was collected as the site was dry, inaccessible or not due for collection<br />
Bolded/shaded cells indicated results are outside recommended criteria
Annual Environmental Management Report <strong>2011</strong> - <strong>2012</strong><br />
Month<br />
SW27 - North <strong>Wambo</strong> Creek Middle Lower<br />
SW32 - North <strong>Wambo</strong> Creek Pump<br />
SW05 - North <strong>Wambo</strong> Creek Down<br />
pH EC (uS/cm) TSS (mg/L) TDS (mg/L) pH EC (uS/cm) TSS (mg/L) TDS (mg/L) pH EC (uS/cm) TSS (mg/L) TDS (mg/L)<br />
Criteria 6.0-9.5 2,140 120 N/A 6.0-9.5 2,140 120 N/A 6.0-9.5 2,140 120 N/A<br />
Jul-11 7.60 2,290 5 1,310<br />
Aug-11 7.00 438 60 570 7.50 2,160 5 1,190<br />
Sep-11 8.00 296 508 596 7.70 1,702 60 1,030<br />
Oct-11 7.20 275 111 826 7.00 381 38 356<br />
Nov-11 7.40 2,050 28 1,180<br />
Dec-11 8.10 244 42 297 7.80 350 71 406<br />
Jan-12 7.60 2,230 16 340<br />
Feb-12 7.80 202 316 626 7.30 1,297 48 748<br />
Mar-12 7.90 1,122 548 700 7.60 221 85 172<br />
Apr-12 7.80 2,470 6 1,320<br />
May-12 7.80 2,310 5 1,290<br />
Jun-12 7.30 2,060 5 1,250<br />
Average 7.67 430 264 603 7.53 1,627 31 883<br />
Month<br />
SW06 - South <strong>Wambo</strong> Creek SW07 - South <strong>Wambo</strong>/Stony Creeks SW08 - Stony Creek<br />
pH EC (uS/cm) TSS (mg/L) TDS (mg/L) pH EC (uS/cm) TSS (mg/L) TDS (mg/L) pH EC (uS/cm) TSS (mg/L) TDS (mg/L)<br />
Criteria 6.0-9.5 581 120 N/A 6.0-9.5 581 120 N/A 6.0-9.5 581 120 N/A<br />
Jul-11 7.00 431 8 250 7.00 294 5 149<br />
Aug-11 7.00 496 5 262 6.80 328 5 185<br />
Sep-11 7.60 450 27 214<br />
Oct-11 7.70 334 5 228 7.60 558 5 280 6.60 358 5 164<br />
Nov-11 7.30 434 10 258 7.40 788 5 400<br />
Dec-11 8.10 810 306 5 151 8.20 820 326 5 145<br />
Jan-12 7.30 475 5 312 7.70 596 5 376<br />
Feb-12 7.70 521 5 158 7.70 521 19 292<br />
Mar-12 7.20 258 5 134 7.60 243 29 178<br />
Apr-12 7.40 475 5 234 7.60 596 5 290 7.10 402 5 176<br />
May-12 7.50 584 6 217 7.50 640 5 312<br />
Jun-12 7.30 503 33 284 7.40 658 5 388<br />
Average 7.43 439 10 225 7.63 547 9 296 6.88 346 5 169<br />
Appendix 2C: Surface Water Monitoring Results<br />
Blank cells indicate that no sample was collected as the site was dry, inaccessible or not due for collection<br />
Bolded/shaded cells indicated results are outside recommended criteria
Annual Environmental Management Report <strong>2011</strong> - <strong>2012</strong><br />
Month<br />
SW39 - Waterfall Creek<br />
pH EC (uS/cm) TSS (mg/L) TDS (mg/L)<br />
Criteria 6.0-9.5 492 120 N/A<br />
Jul-11<br />
Aug-11 7.20 438 276 690<br />
Sep-11 7.70 163 594 817<br />
Oct-11 8.40 188 38 552<br />
Nov-11<br />
Dec-11 7.80 230 308 934<br />
Jan-12<br />
Feb-12 8.30 218 586 620<br />
Mar-12 7.50 762 194 258<br />
Apr-12<br />
May-12<br />
Jun-12<br />
Average 7.82 333 333 645<br />
Appendix 2C: Surface Water Monitoring Results<br />
Blank cells indicate that no sample was collected as the site was dry, inaccessible or not due for collection<br />
Bolded/shaded cells indicated results are outside recommended criteria
Annual Environmental Management Report <strong>2011</strong>-<strong>2012</strong><br />
Monthly Surface Water Monitoring<br />
Wollombi Brook<br />
Monthly Surface Water Monitoring<br />
Wollombi Brook<br />
10.0<br />
SW01 - Up SW02 - Down SW03 - Pump Out SW40 - Confluence<br />
SW01 - Up SW02 - Down SW03 - Pump Out SW40 - Upstream of SWC<br />
2,000<br />
pH<br />
9.0<br />
8.0<br />
7.0<br />
6.0<br />
5.0<br />
Electrical Conductivity<br />
(uS/cm)<br />
1,600<br />
1,200<br />
800<br />
400<br />
Jul-11<br />
Aug-11<br />
Sep-11<br />
Oct-11<br />
Nov-11<br />
Dec-11<br />
Jan-12<br />
Month<br />
Feb-12<br />
Mar-12<br />
Apr-12<br />
May-12<br />
Jun-12<br />
0<br />
Monthly Surface Water Monitoring<br />
Wollombi Brook<br />
Monthly Surface Water Monitoring<br />
Wollombi Brook<br />
Total Suspended Solids (mg/L)<br />
100<br />
90<br />
80<br />
70<br />
60<br />
50<br />
40<br />
30<br />
20<br />
10<br />
0<br />
-10<br />
SW01 - Up SW02 - Down SW03 - Pump Out SW40 - Confluence<br />
Jul-11<br />
Aug-11<br />
Sep-11<br />
Oct-11<br />
Nov-11<br />
Dec-11<br />
Jan-12<br />
Feb-12<br />
Mar-12<br />
Apr-12<br />
May-12<br />
Jun-12<br />
Month<br />
Total Dissolved Solids (mg/L)<br />
450<br />
400<br />
350<br />
300<br />
250<br />
200<br />
150<br />
100<br />
50<br />
0<br />
SW01 - Up SW02 - Down SW03 - Pump Out SW40 - Confluence<br />
Jul-11<br />
Aug-11<br />
Sep-11<br />
Oct-11<br />
Nov-11<br />
Dec-11<br />
Jan-12<br />
Feb-12<br />
Mar-12<br />
Apr-12<br />
May-12<br />
Jun-12<br />
Month<br />
Appendix 2C: Surface Water Monitoring Results<br />
Blanks in graphs indicate that no sample was collected
Annual Environmental Management Report <strong>2011</strong>-<strong>2012</strong><br />
Monthly Surface Water Monitoring<br />
North <strong>Wambo</strong> Creek<br />
Monthly Surface Water Monitoring<br />
North <strong>Wambo</strong> Creek<br />
10.0<br />
SW04 - Up SW26 - Middle Upper SW27 - Middle Lower<br />
SW32 - Pump<br />
SW05 - Down<br />
3,000<br />
SW04 - Up SW26 - Middle Upper SW27 - Middle Lower<br />
SW32 - Pump<br />
SW05 - Down<br />
pH<br />
9.0<br />
8.0<br />
7.0<br />
6.0<br />
5.0<br />
Jul-11<br />
Aug-11<br />
Sep-11<br />
Oct-11<br />
Nov-11<br />
Dec-11<br />
Jan-12<br />
Month<br />
Feb-12<br />
Mar-12<br />
Apr-12<br />
May-12<br />
Jun-12<br />
Electrical Conductivity (uS/cm)<br />
2,500<br />
2,000<br />
1,500<br />
1,000<br />
500<br />
0<br />
Jul-11<br />
Aug-11<br />
Sep-11<br />
Oct-11<br />
Nov-11<br />
Dec-11<br />
Jan-12<br />
Month<br />
Feb-12<br />
Mar-12<br />
Apr-12<br />
May-12<br />
Jun-12<br />
Monthly Surface Water Monitoring<br />
North <strong>Wambo</strong> Creek<br />
Monthly Surface Water Monitoring<br />
North <strong>Wambo</strong> Creek<br />
SW04 - Up SW26 - Middle Upper SW27 - Middle Lower<br />
SW04 - Up SW26 - Middle Upper SW27 - Middle Lower<br />
SW32 - Pump<br />
SW05 - Down<br />
SW32 - Pump<br />
SW05 - Down<br />
Total Suspended Solids (mg/L)<br />
600<br />
500<br />
400<br />
300<br />
200<br />
100<br />
0<br />
Jul-11<br />
Aug-11<br />
Sep-11<br />
Oct-11<br />
Nov-11<br />
Dec-11<br />
Jan-12<br />
Month<br />
Feb-12<br />
Mar-12<br />
Apr-12<br />
May-12<br />
Jun-12<br />
Total Dissolved Solids (mg/L)<br />
1,600<br />
1,400<br />
1,200<br />
1,000<br />
800<br />
600<br />
400<br />
200<br />
0<br />
Jul-11<br />
Aug-11<br />
Sep-11<br />
Oct-11<br />
Nov-11<br />
Dec-11<br />
Jan-12<br />
Month<br />
Feb-12<br />
Mar-12<br />
Apr-12<br />
May-12<br />
Jun-12<br />
Appendix 2C: Surface Water Monitoring Results<br />
Blanks in graphs indicate that no sample was collected
Annual Environmental Management Report <strong>2011</strong>-<strong>2012</strong><br />
Monthly Surface Water Monitoring<br />
South <strong>Wambo</strong> & Stony Creeks<br />
Monthly Surface Water Monitoring<br />
South <strong>Wambo</strong> & Stony Creeks<br />
pH<br />
10.0<br />
9.0<br />
8.0<br />
7.0<br />
6.0<br />
5.0<br />
Jul-11<br />
SW06 - South <strong>Wambo</strong> SW07 - South <strong>Wambo</strong>/Stony SW08 - Stony<br />
Aug-11<br />
Sep-11<br />
Oct-11<br />
Nov-11<br />
Dec-11<br />
Jan-12<br />
Month<br />
Feb-12<br />
Mar-12<br />
Apr-12<br />
May-12<br />
Jun-12<br />
Electrical Conductivity (uS/cm)<br />
900<br />
800<br />
700<br />
600<br />
500<br />
400<br />
300<br />
200<br />
100<br />
0<br />
Jul-11<br />
SW06 - South <strong>Wambo</strong> SW07 - South <strong>Wambo</strong>/Stony SW08 - Stony<br />
Aug-11<br />
Sep-11<br />
Oct-11<br />
Nov-11<br />
Dec-11<br />
Jan-12<br />
Month<br />
Feb-12<br />
Mar-12<br />
Apr-12<br />
May-12<br />
Jun-12<br />
Monthly Surface Water Monitoring<br />
South <strong>Wambo</strong> & Stony Creeks<br />
Monthly Surface Water Monitoring<br />
South <strong>Wambo</strong> & Stony Creeks<br />
SW06 - South <strong>Wambo</strong> SW07 - South <strong>Wambo</strong>/Stony SW08 - Stony<br />
SW06 - South <strong>Wambo</strong> SW07 - South <strong>Wambo</strong>/Stony SW08 - Stony<br />
Total Suspended Solids (mg/L)<br />
350<br />
300<br />
250<br />
200<br />
150<br />
100<br />
50<br />
0<br />
Jul-11<br />
Aug-11<br />
Sep-11<br />
Oct-11<br />
Nov-11<br />
Dec-11<br />
Jan-12<br />
Feb-12<br />
Mar-12<br />
Apr-12<br />
May-12<br />
Jun-12<br />
Total Dissolved Solids (mg/L)<br />
451<br />
401<br />
351<br />
301<br />
251<br />
201<br />
151<br />
101<br />
51<br />
1<br />
Jul-11<br />
Aug-11<br />
Sep-11<br />
Oct-11<br />
Nov-11<br />
Dec-11<br />
Jan-12<br />
Feb-12<br />
Mar-12<br />
Apr-12<br />
May-12<br />
Jun-12<br />
Month<br />
Month<br />
Appendix 2C: Surface Water Monitoring Results<br />
Blanks in graphs indicate that no sample was collected
232, 6% 271, 7%<br />
Inflows (ML)<br />
Rainfall Runoff<br />
Tailings Water Bleed<br />
0, 0%<br />
175, 5%<br />
281, 8%<br />
154, 4%<br />
319, 9%<br />
2240, 61%<br />
Groundwater Inflows (Open<br />
Cuts)<br />
Groundwater Inflows<br />
(Underground)<br />
Recovery of Water supplied to<br />
Underground<br />
Hunter River Extractions<br />
Wollembi Brook Extractions<br />
United Bores<br />
The bulk of water inflows occurred from rainfall and runoff captured in the water<br />
management system (61%). In comparison with EIS predictions this would correspond to<br />
the bulk of the open cut dewatering (25.8%), the sediment control dams (11.5%) and a<br />
proportion of the tailings water recovery (43.5%). The EIS prediction for average licenced<br />
extraction of 2.6% compares with about 6% of inflows in <strong>2011</strong> – <strong>2012</strong>. The recovery of<br />
water from the underground (8%) was less than the EIS prediction of 13%.<br />
The estimate water management system outflows over <strong>2011</strong>-<strong>2012</strong> are shown graphically on<br />
Figure below<br />
Outflows (ML)<br />
360,<br />
12%<br />
0, 0%<br />
621, 20%<br />
Dust Suppression<br />
CHPP Makeup<br />
Underground Supply<br />
Transfers To United<br />
Domestic Usage<br />
2, 0%<br />
0, 0%<br />
743, 24%<br />
384,<br />
12%<br />
999, 32%<br />
Evaporation<br />
HRSTS/MERF Releases<br />
Spill<br />
Appendix 2C: Water Balance Summary <strong>2011</strong>-<strong>2012</strong>
Releases to the Hunter River via the HRSTS amounted to 12% of outflows. There were no<br />
reported spills from the water management system. There were no transfers to United<br />
Collieries and a negligible water use for potable supply. The bulk of outflows comprised<br />
water re-use in the CHPP (32%), evaporation losses (24%) and water used for dust<br />
suppression activities (20%).<br />
Appendix 2C: Water Balance Summary <strong>2011</strong>-<strong>2012</strong>
Appendix 2D<br />
Groundwater Monitoring<br />
Results
<strong>Wambo</strong> <strong>Coal</strong> Pty Ltd <strong>AEMR</strong> <strong>2011</strong>‐<strong>2012</strong><br />
Water Volume (m3)<br />
160000<br />
140000<br />
120000<br />
100000<br />
80000<br />
60000<br />
40000<br />
20000<br />
0<br />
North <strong>Wambo</strong> Creek Subsidence Monitoring Response Strategy:<br />
Water Usage & Pump Out Rates & Rainfall<br />
140<br />
120<br />
100<br />
80<br />
60<br />
40<br />
20<br />
0<br />
Monthly Rainfall (mm)<br />
Water In Pump Out Balance Rainfall<br />
Appendix 2D: Groundwater Monitoring Results
<strong>Wambo</strong> <strong>Coal</strong> Pty Ltd <strong>AEMR</strong> <strong>2011</strong>-<strong>2012</strong><br />
Monthly Piezometer Monitoring<br />
100 Series<br />
Monthly Piezometer Monitoring<br />
100 Series<br />
Jul-11<br />
Aug-11<br />
Sep-11<br />
Oct-11<br />
Nov-11<br />
Dec-11<br />
Jan-12<br />
Feb-12<br />
Mar-12<br />
Apr-12<br />
May-12<br />
Jun-12<br />
Electrical Conductivity (uS/cm)<br />
10.0<br />
9.0<br />
8.0<br />
7.0<br />
6.0<br />
5.0<br />
P106 P109 P110 P111 P114 P116<br />
P106 P109 P110 P111 P114 P116<br />
8,000<br />
7,000<br />
6,000<br />
5,000<br />
4,000<br />
3,000<br />
2,000<br />
1,000<br />
0<br />
Jul-11<br />
Aug-11<br />
Sep-11<br />
Oct-11<br />
Nov-11<br />
Dec-11<br />
Jan-12<br />
Feb-12<br />
Mar-12<br />
Apr-12<br />
May-12<br />
Jun-12<br />
pH<br />
Month<br />
Month<br />
Monthly Piezometer Monitoring<br />
100 Series<br />
Monthly Piezometer Monitoring<br />
100 Series<br />
P106 P109 P110 P111 P114 P116<br />
P106 P109 P110 P111 P114 P116<br />
Month<br />
25<br />
20<br />
15<br />
10<br />
5<br />
0<br />
Jul-11<br />
Aug-11<br />
Sep-11<br />
Oct-11<br />
Nov-11<br />
Dec-11<br />
Jan-12<br />
Feb-12<br />
Mar-12<br />
Apr-12<br />
May-12<br />
Jun-12<br />
Temperature ( o C)<br />
0<br />
1<br />
2<br />
3<br />
4<br />
5<br />
6<br />
7<br />
8<br />
9<br />
Depth to Water (m)<br />
Jul-11<br />
Aug-11<br />
Sep-11<br />
Oct-11<br />
Nov-11<br />
Dec-11<br />
Jan-12<br />
Feb-12<br />
Mar-12<br />
Apr-12<br />
May-12<br />
Jun-12<br />
Month<br />
Appendix 2D: Ground Water Monitoring Results Blanks in graphs indicate that no sample was collected
<strong>Wambo</strong> <strong>Coal</strong> Pty Ltd <strong>AEMR</strong> <strong>2011</strong>-<strong>2012</strong><br />
Monthly Piezometer Monitoring<br />
200 Series<br />
Monthly Piezometer Monitoring<br />
200 Series<br />
P202 P206<br />
P202 P206<br />
10.0<br />
6,000<br />
Jul-11<br />
Aug-11<br />
Sep-11<br />
Oct-11<br />
Nov-11<br />
Dec-11<br />
Jan-12<br />
Feb-12<br />
Mar-12<br />
Apr-12<br />
May-12<br />
Jun-12<br />
Electrical Conductivity (uS/cm)<br />
9.0<br />
8.0<br />
7.0<br />
6.0<br />
5.0<br />
pH<br />
Month<br />
5,000<br />
4,000<br />
3,000<br />
2,000<br />
1,000<br />
0<br />
Jul-11<br />
Aug-11<br />
Sep-11<br />
Oct-11<br />
Nov-11<br />
Dec-11<br />
Jan-12<br />
Feb-12<br />
Mar-12<br />
Apr-12<br />
May-12<br />
Jun-12<br />
Month<br />
Monthly Piezometer Monitoring<br />
200 Series<br />
Monthly Piezometer Monitoring<br />
200 Series<br />
P202 P206<br />
Month<br />
25<br />
20<br />
P202 P206<br />
Temperature ( o C)<br />
Jul-11<br />
Aug-11<br />
Sep-11<br />
Oct-11<br />
Nov-11<br />
Dec-11<br />
Jan-12<br />
Feb-12<br />
Mar-12<br />
Apr-12<br />
May-12<br />
Jun-12<br />
0<br />
2<br />
4<br />
6<br />
8<br />
10<br />
12<br />
14<br />
16<br />
18<br />
20<br />
15<br />
10<br />
5<br />
0<br />
Depth to Water (m)<br />
Jul-11<br />
Aug-11<br />
Sep-11<br />
Oct-11<br />
Nov-11<br />
Dec-11<br />
Jan-12<br />
Feb-12<br />
Mar-12<br />
Apr-12<br />
May-12<br />
Jun-12<br />
Month<br />
Appendix 2D: Ground Water Monitoring Results Blanks in graphs indicate that no sample was collected
<strong>Wambo</strong> <strong>Coal</strong> Pty Ltd <strong>AEMR</strong> <strong>2011</strong>-<strong>2012</strong><br />
Monthly Piezometer Monitoring<br />
300 Series<br />
Monthly Piezometer Monitoring<br />
300 Series<br />
P301 P311 P315<br />
P301 P311 P315<br />
Jul-11<br />
Aug-11<br />
Sep-11<br />
Oct-11<br />
Nov-11<br />
Dec-11<br />
Jan-12<br />
Feb-12<br />
Mar-12<br />
Apr-12<br />
May-12<br />
Jun-12<br />
Electrical Conductivity (uS/cm)<br />
10.0<br />
9.0<br />
8.0<br />
7.0<br />
6.0<br />
5.0<br />
4.0<br />
3.0<br />
2.0<br />
1.0<br />
0.0<br />
6,000<br />
4,000<br />
2,000<br />
0<br />
Jul-11<br />
Aug-11<br />
Sep-11<br />
Oct-11<br />
Nov-11<br />
Dec-11<br />
Jan-12<br />
Feb-12<br />
Mar-12<br />
Apr-12<br />
May-12<br />
Jun-12<br />
pH<br />
Month<br />
Month<br />
Monthly Piezometer Monitoring<br />
300 Series<br />
Monthly Piezometer Monitoring<br />
300 Series<br />
P301 P311 P315<br />
P301 P311 P315<br />
Month<br />
22<br />
21.5<br />
21<br />
20.5<br />
20<br />
19.5<br />
19<br />
18.5<br />
18<br />
17.5<br />
17<br />
Jul-11<br />
Aug-11<br />
Sep-11<br />
Oct-11<br />
Nov-11<br />
Dec-11<br />
Jan-12<br />
Feb-12<br />
Mar-12<br />
Apr-12<br />
May-12<br />
Jun-12<br />
Jul-11<br />
Aug-11<br />
Sep-11<br />
Oct-11<br />
Nov-11<br />
Dec-11<br />
Jan-12<br />
Feb-12<br />
Mar-12<br />
Apr-12<br />
May-12<br />
Jun-12<br />
Temperature ( o C)<br />
0<br />
5<br />
10<br />
15<br />
20<br />
25<br />
Depth to Water (m)<br />
Month<br />
Appendix 2D: Ground Water Monitoring Results Blanks in graphs indicate that no sample was collected
<strong>Wambo</strong> <strong>Coal</strong> Pty Ltd <strong>AEMR</strong> <strong>2011</strong>-<strong>2012</strong><br />
P106<br />
P109<br />
P110<br />
Month<br />
Depth to<br />
pH EC (uS/cm)<br />
Temp ( o Depth to<br />
C) pH EC (uS/cm)<br />
Temp ( o Depth to<br />
C) pH EC (uS/cm)<br />
Water (m)<br />
Water (m)<br />
Water (m)<br />
Temp ( o C)<br />
Criteria 6.1-8.1 292-1069 6.21-13.21 N/A 6.0-7.9 367-768 5.09-7.38 N/A 6.0-9.5 250-1,300 2.31-10.86 N/A<br />
Jul-11<br />
Aug-11 6.80 509 4.69 18.0 6.60 454 5.26 18.0 6.00 622 4.69 18.0<br />
Sep-11<br />
Oct-11 6.90 466 7.45 19.5 7.00 431 4.74 17.3 6.40 574 4.37 17.5<br />
Nov-11<br />
Dec-11 7.00 558 6.59 19.7 8.70 522 4.35 17.6 7.60 801 4.20 17.9<br />
Jan-12<br />
Feb-12 6.90 484 6.55 20.8 6.80 567 4.34 22.1 6.60 760 4.16 20.2<br />
Mar-12<br />
Apr-12 6.90 491 6.33 19.9 6.90 567 4.36 18.8 6.40 731 4.20 19.0<br />
May-12<br />
Jun-12 7.40 449 7.14 18.4 7.20 528 4.43 18.3 6.80 633 4.23 18.1<br />
Average 6.98 493 6.46 19.4 7.20 512 4.58 18.7 6.63 687 4.31 18.5<br />
P111 P114 P116<br />
Month<br />
Depth to<br />
pH EC (uS/cm)<br />
Temp ( o Depth to<br />
C) pH EC (uS/cm)<br />
Temp ( o Depth to<br />
C) pH EC (uS/cm)<br />
Water (m)<br />
Water (m)<br />
Water (m)<br />
Temp ( o C)<br />
Criteria 6.0-9.5 300-715 5.54-9.20 N/A 6.3-8.2 458-715 6.02-7.79 N/A 6.3-7.8 181-8035 4.80-8.53 N/A<br />
Jul-11<br />
Aug-11 6.10 496 6.69 19.0 6.80 509 7.67 18.9 7.10 1,570 6.18 19.0<br />
Sep-11<br />
Oct-11 6.80 603 5.94 18.5 6.80 1,065 5.40 18.7 7.20 737 5.40 18.9<br />
Nov-11<br />
Dec-11 6.40 586 5.57 19.1 7.30 3,240 5.36 19.9 7.30 666 5.03 19.7<br />
Jan-12<br />
Feb-12 6.30 536 5.51 19.0 6.80 6,890 5.29 22.7 7.00 677 4.67 21.7<br />
Mar-12<br />
Apr-12 6.40 450 5.60 21.4 6.80 3,320 5.22 19.6 6.80 593 4.41 20.5<br />
May-12<br />
Jun-12 7.30 604 5.75 18.0 7.00 2,880 5.33 18.5 7.00 588 4.57 18.8<br />
Average 6.55 546 5.84 19.2 6.92 2,984 5.71 19.7 7.07 805 5.04 19.8<br />
Appendix 2D: Ground Water Monitoring Results<br />
Blank cells indicate that no sample was collected due to the site<br />
being dry, inaccessible or not due for collection. Bolded/Shaded<br />
cells indicate results outside recommended criteria
<strong>Wambo</strong> <strong>Coal</strong> Pty Ltd <strong>AEMR</strong> <strong>2011</strong>-<strong>2012</strong><br />
Month<br />
pH<br />
P202<br />
Depth to<br />
EC (uS/cm)<br />
Water (m)<br />
P206<br />
Temp ( o Depth to<br />
C) pH EC (uS/cm)<br />
Water (m)<br />
Temp ( o C)<br />
Criteria 6.4-7.9 2519-7616 6.81-11.35 N/A 7.1-8.5 1848-3175 18.34-22.72 N/A<br />
Jul-11 7.50 3,520 7.65 19.2<br />
Aug-11 7.40 3,490 8.11 19.6 7.30 2,340 17.82 19.2<br />
Sep-11<br />
Oct-11 7.40 3,490 8.18 19.4 7.20 2,240 17.17 19.6<br />
Nov-11<br />
Dec-11 7.10 3,600 7.95 19.2 7.20 2,360 17.00 20.4<br />
Jan-12<br />
Feb-12 7.70 3,600 7.14 20.8 7.30 2,340 16.44 21.6<br />
Mar-12<br />
Apr-12 7.50 3,820 8.02 18.9 7.30 2,360 15.56 19.3<br />
May-12<br />
Jun-12 7.40 5,100 8.25 17.3 7.30 2,160 16.08 18.6<br />
Average 7.43 3,803 7.90 19.2 7.27 2,300 16.68 19.8<br />
Month<br />
pH<br />
P301<br />
Depth to<br />
EC (uS/cm)<br />
Water (m)<br />
P311<br />
Temp ( o Depth to<br />
C) pH EC (uS/cm)<br />
Water (m)<br />
P315<br />
Temp ( o Depth to<br />
C) pH EC (uS/cm)<br />
Water (m)<br />
Criteria 5.7-7.4 3045-12735 10.62-14.59 N/A 6.0-9.5 6,500-8,000 18.15-25.50 N/A 5.6-7.2 291-522 4.90-10.42 N/A<br />
Jul-11<br />
Aug-11 7.20 2,420 10.13 19.0 6.40 376 4.67 19.2<br />
Sep-11<br />
Oct-11 7.40 2,420 10.57 19.1 6.90 593 6.14 18.8<br />
Nov-11<br />
Dec-11 7.00 2,490 19.90 20.5 7.50 365 3.77 20.0<br />
Jan-12<br />
Feb-12 6.50 2,130 13.20 19.9 3.70 624 4.00 21.6<br />
Mar-12<br />
Apr-12 6.80 4,040 13.28 19.7<br />
May-12<br />
Jun-12 7.00 3,230 13.60 18.8<br />
Average 6.98 2,788 13.45 19.5 #DIV/0! #DIV/0! #DIV/0! #DIV/0! 6.13 490 4.65 19.9<br />
P311 ceased to be monitored as at Mar. 08<br />
because it has collapsed<br />
Temp ( o C)<br />
Appendix 2D: Ground Water Monitoring Results<br />
Blank cells indicate that no sample was collected due to the site<br />
being dry, inaccessible or not due for collection. Bolded/Shaded<br />
cells indicate results outside recommended criteria
<strong>Wambo</strong> <strong>Coal</strong> Pty Ltd <strong>AEMR</strong> <strong>2011</strong>-<strong>2012</strong><br />
GW 12 GW 13 GW14<br />
Month<br />
Depth to<br />
pH EC (uS/cm)<br />
Temp ( o Depth to<br />
C) pH EC (uS/cm)<br />
Temp ( o Depth to<br />
C) pH EC (uS/cm)<br />
Water (m)<br />
Water (m)<br />
Water (m)<br />
Temp ( o C)<br />
Criteria N/A N/A N/A<br />
Aug-11 6.80 21,400 10.22 21.0 6.80 3,490 4.94 18.9 9.48<br />
Sep-11<br />
Oct-11 6.70 21,300 10.20 20.4 6.90 3,990 4.82 19.8<br />
Nov-11<br />
Dec-11 6.60 22,300 10.18 6.90 4,180 4.79 21.9 9.90<br />
Jan-12<br />
Feb-12 6.80 22,000 9.93 20.8 6.90 3,920 4.76 21.4<br />
Mar-12<br />
Apr-12 6.80 22,200 9.89 21.0 7.10 4,820 4.82 21.4<br />
May-12<br />
Jun-12 6.90 19,700 10.14 18.6 7.30 3,540 4.88 19.4<br />
Average<br />
Average 6.77 21,483 10.09 20.4 6.98 3,990 4.84 20.5 #DIV/0! #DIV/0! 9.69 #DIV/0!<br />
GW15 GW16 GW17<br />
Month<br />
Depth to<br />
pH EC (uS/cm)<br />
Temp ( o Depth to<br />
C) pH EC (uS/cm)<br />
Temp ( o Depth to<br />
C) pH EC (uS/cm)<br />
Water (m)<br />
Water (m)<br />
Water (m)<br />
Temp ( o C)<br />
Criteria<br />
Aug-11 7.10 628 10.87 20.1 7.40 556 6.39 18.7 7.00 5,240 10.65 19.0<br />
Sep-11<br />
Oct-11 7.00 628 10.74 21.2 7.20 600 7.11 19.1 7.00 5,200 10.62 20.3<br />
Nov-11<br />
Dec-11 6.60 521 10.71 21.1 7.10 414 4.28 18.8 7.00 5,080 8.25 19.9<br />
Jan-12<br />
Feb-12 6.90 725 10.57 21.3 7.30 492 5.23 20.8 7.00 5,160 8.49 21.2<br />
Mar-12<br />
Apr-12 6.90 621 10.42 20.2 7.50 500 5.00 19.0 7.20 5,050 7.60 19.2<br />
May-12<br />
Jun-12 7.00 599 10.44 19.8 7.50 656 6.77 18.3 7.20 4,740 8.67 18.8<br />
Average<br />
Average 6.92 620 10.63 20.6 7.33 536 5.80 19.1 7.07 5078 9.05 19.7<br />
Appendix 2D: Ground Water Monitoring Results<br />
Blank cells indicate that no sample was collected due to the site<br />
being dry, inaccessible or not due for collection. Bolded/Shaded<br />
cells indicate results outside recommended criteria
<strong>Wambo</strong> <strong>Coal</strong> Pty Ltd <strong>AEMR</strong> <strong>2011</strong>-<strong>2012</strong><br />
GW18 GW19 GW20<br />
Month<br />
Depth to<br />
pH EC (uS/cm)<br />
Temp ( o Depth to<br />
C) pH EC (uS/cm)<br />
Temp ( o Depth to<br />
C) pH EC (uS/cm)<br />
Water (m)<br />
Water (m)<br />
Water (m)<br />
Temp ( o C)<br />
Criteria<br />
Aug-11<br />
Sep-11<br />
Oct-11<br />
Nov-11<br />
Dec-11<br />
Jan-12<br />
Feb-12 VIBRATING WIRE PIEZO<br />
Mar-12<br />
Apr-12<br />
Decommissioned<br />
May-12<br />
Jun-12<br />
Average<br />
Average #DIV/0! #DIV/0! #DIV/0! #DIV/0! #DIV/0! #DIV/0! #DIV/0! #DIV/0! #DIV/0! #DIV/0! #DIV/0! #DIV/0!<br />
Appendix 2D: Ground Water Monitoring Results<br />
Blank cells indicate that no sample was collected due to the site<br />
being dry, inaccessible or not due for collection. Bolded/Shaded<br />
cells indicate results outside recommended criteria
<strong>Wambo</strong> <strong>Coal</strong> Pty Ltd <strong>AEMR</strong> <strong>2011</strong>-<strong>2012</strong><br />
Month<br />
pH<br />
GW21<br />
Depth to<br />
EC (uS/cm)<br />
Water (m)<br />
GW22<br />
Temp ( o Depth to<br />
C) pH EC (uS/cm)<br />
Water (m)<br />
Temp ( o C)<br />
Criteria<br />
Aug-11 7.20 16,050 36.13 19.0 8.00 6,560 36.67 21.0<br />
Sep-11<br />
Oct-11 7.90 6,690 36.65 21.4<br />
Nov-11<br />
Dec-11 8.10 6,770 22.20 36.6<br />
Jan-12<br />
Feb-12 8.10 6,680 36.47 22.8<br />
Mar-12<br />
Apr-12 8.10 6,890 36.39 21.6<br />
May-12<br />
Jun-12 36.40 8.30 6,110 36.31 20.60<br />
Average<br />
Average 7.20 16,050 36.27 19.0 8.08 6,617 34.12 24.0<br />
Appendix 2D: Ground Water Monitoring Results<br />
Blank cells indicate that no sample was collected due to the site<br />
being dry, inaccessible or not due for collection. Bolded/Shaded<br />
cells indicate results outside recommended criteria
<strong>Wambo</strong> <strong>Coal</strong> Pty Ltd <strong>AEMR</strong> <strong>2011</strong>-<strong>2012</strong><br />
Monthly Ground Water Monitoring<br />
Brosi Property<br />
Monthly Ground Water Monitoring<br />
Brosi Property<br />
Jul-11<br />
Aug-11<br />
Sep-11<br />
Oct-11<br />
Nov-11<br />
Dec-11<br />
Jan-12<br />
Feb-12<br />
Mar-12<br />
Apr-12<br />
May-12<br />
Jun-12<br />
Electrical Conductivity (uS/cm)<br />
10.0<br />
9.0<br />
8.0<br />
7.0<br />
6.0<br />
5.0<br />
GW02 - Max's New Well GW11 - Max's Extra Well<br />
GW02 - Max's New Well GW11 - Max's Extra Well<br />
pH<br />
Month<br />
1,000<br />
800<br />
600<br />
400<br />
200<br />
0<br />
Jul-11<br />
Aug-11<br />
Sep-11<br />
Oct-11<br />
Nov-11<br />
Dec-11<br />
Jan-12<br />
Feb-12<br />
Mar-12<br />
Apr-12<br />
May-12<br />
Jun-12<br />
Month<br />
Monthly Ground Water Monitoring<br />
Brosi Property<br />
Monthly Ground Water Monitoring<br />
Brosi Property<br />
GW02 - Max's New Well GW11 - Max's Extra Well<br />
GW02 - Max's New Well GW11 - Max's Extra Well<br />
Month<br />
25<br />
0<br />
1<br />
2<br />
3<br />
4<br />
5<br />
6<br />
7<br />
20<br />
15<br />
10<br />
5<br />
0<br />
Jul-11<br />
Aug-11<br />
Sep-11<br />
Oct-11<br />
Nov-11<br />
Dec-11<br />
Jan-12<br />
Feb-12<br />
Mar-12<br />
Apr-12<br />
May-12<br />
Jun-12<br />
Depth to Water (m)<br />
Jul-11<br />
Aug-11<br />
Sep-11<br />
Oct-11<br />
Nov-11<br />
Dec-11<br />
Jan-12<br />
Feb-12<br />
Mar-12<br />
Apr-12<br />
May-12<br />
Jun-12<br />
Temperaturee ( o C)<br />
Month<br />
Appendix 2D: Ground Water Monitoring Results Blanks in graphs indicate that no sample was collected
<strong>Wambo</strong> <strong>Coal</strong> Pty Ltd <strong>AEMR</strong> <strong>2011</strong>-<strong>2012</strong><br />
Monthly Ground Water Monitoring<br />
<strong>Wambo</strong> Property<br />
Monthly Ground Water Monitoring<br />
<strong>Wambo</strong> Property<br />
10.0<br />
GW08 - Old Well No. 1 (United Well 1) GW09 - New Well No. 2 (United Well 2)<br />
2,400<br />
GW08 - Old Well No. 1 (United Well 1) GW09 - New Well No. 2 (United Well 2)<br />
pH<br />
9.0<br />
8.0<br />
7.0<br />
6.0<br />
5.0<br />
Jul-11<br />
Aug-11<br />
Sep-11<br />
Oct-11<br />
Nov-11<br />
Dec-11<br />
Jan-12<br />
Month<br />
Feb-12<br />
Mar-12<br />
Apr-12<br />
May-12<br />
Jun-12<br />
Electrical Conductivity (uS/cm)<br />
2,000<br />
1,600<br />
1,200<br />
800<br />
400<br />
0<br />
Jul-11<br />
Aug-11<br />
Sep-11<br />
Oct-11<br />
Nov-11<br />
Dec-11<br />
Jan-12<br />
Month<br />
Feb-12<br />
Mar-12<br />
Apr-12<br />
May-12<br />
Jun-12<br />
Monthly Ground Water Monitoring<br />
<strong>Wambo</strong> Property<br />
GW08 - Old Well No. 1 (United Well 1) GW09 - New Well No. 2 (United Well 2)<br />
Month<br />
0<br />
Jul-11<br />
Aug-11<br />
Sep-11<br />
Oct-11<br />
Nov-11<br />
Dec-11<br />
Jan-12<br />
Feb-12<br />
Mar-12<br />
Apr-12<br />
May-12<br />
Jun-12<br />
Depth to Water (m)<br />
1<br />
2<br />
3<br />
4<br />
5<br />
Appendix 2D: Ground Water Monitoring Results<br />
Blanks in graphs indicate that no sample was collected
<strong>Wambo</strong> <strong>Coal</strong> Pty Ltd <strong>AEMR</strong> <strong>2011</strong>-<strong>2012</strong><br />
Monthly Piezometer Monitoring<br />
United Piezometers<br />
P1 P3 P5 P6 P11 P12<br />
10.0<br />
P13 P15 P16 P17 P18 P20<br />
9.0<br />
8.0<br />
pH<br />
7.0<br />
6.0<br />
5.0<br />
Jul-11<br />
Aug-11<br />
Sep-11<br />
Oct-11<br />
Nov-11<br />
Dec-11<br />
Jan-12<br />
Feb-12<br />
Mar-12<br />
Apr-12<br />
May-12<br />
Jun-12<br />
Month<br />
Monthly Piezometer Monitoring<br />
United Piezometers<br />
P1 P3 P5 P6 P11 P12<br />
P13 P15 P16 P17 P18 P20<br />
Month<br />
0<br />
Jul-11<br />
Aug-11<br />
Sep-11<br />
Oct-11<br />
Nov-11<br />
Dec-11<br />
Jan-12<br />
Feb-12<br />
Mar-12<br />
Apr-12<br />
May-12<br />
Jun-12<br />
Depth<br />
to Water (m)<br />
5<br />
10<br />
15<br />
20<br />
25<br />
30<br />
35<br />
Monthly Piezometer Monitoring<br />
United Piezometers<br />
P1 P3 P5 P6 P11 P12<br />
Electrical Conductivity<br />
(uS/cm)<br />
P13 P15 P16 P17 P18 P20<br />
16,000<br />
14,000<br />
12,000<br />
10,000<br />
8,000<br />
6,000<br />
4,000<br />
2,000<br />
0<br />
Jul-11<br />
Aug-11<br />
Sep-11<br />
Oct-11<br />
Nov-11<br />
Dec-11<br />
Jan-12<br />
Feb-12<br />
Mar-12<br />
Apr-12<br />
May-12<br />
Jun-12<br />
Month<br />
Appendix 2D: Ground Water Monitoring Results<br />
Blanks in graphs indicate that no sample was collected
<strong>Wambo</strong> <strong>Coal</strong> Pty Ltd <strong>AEMR</strong> <strong>2011</strong>-<strong>2012</strong><br />
GW02 - Max's New Well<br />
GW11 - Max's Extra Well<br />
Month<br />
pH EC (uS/cm)<br />
Depth to<br />
Temp ( o Depth to<br />
C) pH EC (uS/cm)<br />
Water (m)<br />
Water (m)<br />
Temp ( o C)<br />
Criteria 6.2-7.4 355-734 5.39-9.3.6 N/A 6.5-7.8 356-649 3.99-7.68 N/A<br />
Jul-11<br />
Aug-11 6.30 908 6.09 17.9 6.70 454 4.20 16.9<br />
Sep-11<br />
Oct-11 6.80 518 5.93 19.0 6.70 505 4.10 18.2<br />
Nov-11<br />
Dec-11 7.40 550 5.80 19.9 7.10 691 3.92 20.5<br />
Jan-12<br />
Feb-12 6.70 490 5.67 20.9 6.90 477 3.89 21.2<br />
Mar-12<br />
Apr-12 6.90 492 5.64 19.9 7.20 504 3.94 19.8<br />
May-12<br />
Jun-12 7.20 486 5.71 17.5 7.20 468 4.00 17.0<br />
Average 6.88 574 5.81 19.2 6.97 517 4.01 18.9<br />
GW08 - Old Well No. 1 (United Well 1)<br />
GW09 - New Well No. 2 (United Well 2)<br />
Month<br />
pH EC (uS/cm)<br />
Depth to<br />
Temp ( o Depth to<br />
C) pH EC (uS/cm)<br />
Water (m)<br />
Water (m)<br />
Temp ( o C)<br />
Criteria 6.5-7.6 1660-2158 2.32-3.55 N/A 6.6-6.9 1215-2047 1.92-3.88 N/A<br />
Jul-11<br />
Aug-11 6.86 1,925 3.39 7.70 657 3.78<br />
Sep-11<br />
Oct-11 6.83 1,767 3.28 7.72 374 3.79<br />
Nov-11<br />
Dec-11 5.94 594 1,836 3.30 330 7.87 787 374 3.70 370<br />
Jan-12<br />
Feb-12 7.94 1,864 3.27 8.28 555 3.65<br />
Mar-12 .<br />
Apr-12 7.22 1,847 3.37 7.55 420 3.83<br />
May-12<br />
Jun-12 6.94 1,846 3.41 8.22 446 4.00<br />
Average 6.96 1,848 3.34 #DIV/0! 7.89 471 3.79 #DIV/0!<br />
Appendix 2D: Ground Water Monitoring Results<br />
Blank cells indicate that no sample was collected due to the site<br />
being dry, inaccessible or not due for collection. Bolded/Shaded<br />
cells indicate results outside recommended criteria
<strong>Wambo</strong> <strong>Coal</strong> Pty Ltd <strong>AEMR</strong> <strong>2011</strong>-<strong>2012</strong><br />
P1 P3 P5<br />
Month<br />
Depth to<br />
Depth to<br />
Depth to<br />
pH EC (uS/cm)<br />
pH EC (uS/cm)<br />
pH EC (uS/cm)<br />
Water (m)<br />
Water (m)<br />
Water (m)<br />
Criteria 6.5-7.3 6924-10053 20.12-30.18 6.1-8.3 42-329 5.82-10.53 7.0-7.9 1638-5107 3.56-8.35<br />
Jul-11<br />
Aug-11 6.93 8560 25.99 7.38 1043 8.56<br />
Sep-11<br />
Oct-11 7.08 7640 25.99 7.44 870 8.10<br />
Nov-11<br />
Dec-11 6.94 8,300 25.61 7.30 895 7.08<br />
Jan-12<br />
Feb-12 6.83 8,060 25.63<br />
Mar-12<br />
Apr-12 7.16 8,080 25.85 7.31 888 7.48<br />
May-12<br />
Jun-12 6.84 8,380 25.90 7.27 796 8.32<br />
Average 6.96 8,170 25.83 7.34 898 7.91<br />
P6 P11 P12<br />
Month<br />
Depth to<br />
Depth to<br />
pH EC (uS/cm)<br />
pH EC (uS/cm)<br />
pH EC (uS/cm)<br />
Water (m)<br />
Water (m)<br />
13035-<br />
Criteria 6.8-8.5 236-4353 2.82-7.10 6.4-7.6<br />
20646<br />
Depth to<br />
Water (m)<br />
4.60-36.27 6.0-9.5 2,800-8,820 5.75-7.77<br />
Jul-11<br />
Aug-11 7.49 574 5.90 7 1037 6.38<br />
Sep-11<br />
Oct-11 7.16 718 4.56 7.2 958 6.22<br />
Nov-11<br />
Dec-11 7.42 421 1.37 7.10 1,280 6.31<br />
Jan-12<br />
Feb-12 6.42 1,581 6.32<br />
Mar-12<br />
Apr-12 6.67 355 4.87 7.63 961 6.72<br />
May-12<br />
Jun-12 7.23 426 5.81 7.07 684 6.72<br />
Average 7.19 499 4.50 7.07 1,084 6.45<br />
Appendix 2: Ground Water Monitoring Results<br />
Blank cells indicate that no sample was collected due to the site<br />
being dry, inaccessible or not due for collection. Bolded/Shaded<br />
cells indicate results outside recommended criteria
<strong>Wambo</strong> <strong>Coal</strong> Pty Ltd <strong>AEMR</strong> <strong>2011</strong>-<strong>2012</strong><br />
P13 P15 P16<br />
Month<br />
Depth to<br />
Depth to<br />
pH EC (uS/cm)<br />
pH EC (uS/cm)<br />
pH EC (uS/cm)<br />
Water (m)<br />
Water (m)<br />
Criteria 6.0-9.5 1,000-3,200 5.96-7.98 6.0-9.5<br />
5.46-6.42 6.0-9.5<br />
2,900-<br />
22,000<br />
3,800-<br />
22,700<br />
Depth to<br />
Water (m)<br />
6.47-7.37<br />
Jul-11<br />
Aug-11 6.52 1062 6.56 7.59 7,740 5.96 7.27 8,080 6.97<br />
Sep-11<br />
Oct-11 6.26 1,048 6.44 7.71 6,950 5.87 7.4 7170 6.83<br />
Nov-11<br />
Dec-11 6.24 1,107 6.42 7.02 7,380 5.86 6.44 7,780 7.01<br />
Jan-12<br />
Feb-12 6.16 1,025 6.53<br />
Mar-12<br />
Apr-12 6.69 1,107 6.73 7.98 7,380 5.98 7.64 7,630 7.16<br />
May-12<br />
Jun-12 6.27 1,091 6.91 7.38 7,470 6.00 7.30 7,690 7.24<br />
Average 6.36 1,073 6.60 7.54 7,384 5.93 7.21 7,670 7.04<br />
Month<br />
pH<br />
Criteria 6.0-9.5<br />
P17<br />
EC (uS/cm)<br />
8,900-<br />
17,000<br />
Depth to<br />
Water (m)<br />
pH<br />
5.25-6.21 6.0-9.5<br />
EC (uS/cm)<br />
4,450-<br />
22,000<br />
Depth to<br />
Water (m)<br />
pH<br />
6.48-7.53 6.0-9.5<br />
EC (uS/cm)<br />
4,750-<br />
22,800<br />
Depth to<br />
Water (m)<br />
6.83-7.86<br />
Jul-11<br />
Aug-11 7.50 11480 5.77 7.35 8460 7.02 7.24 8940 7.16<br />
Sep-11<br />
Oct-11 7.42 9900 5.98 7.48 7610 7.17 7.24 8150 6.94<br />
Nov-11<br />
Dec-11 6.94 10,560 5.95 6.90 8,630 7.15 6.54 8,820 7.22<br />
Jan-12<br />
Feb-12<br />
Mar-12<br />
Apr-12 8.04 10,480 5.96 7.76 7,950 8.38 7.58 8,260 7.58<br />
May-12<br />
Jun-12 7.63 10,820 6.05 7.49 8,010 7.45 7.23 8,540 7.69<br />
Average 7.51 10,648 5.94 7.40 8,132 7.43 7.17 8,542 7.32<br />
P18<br />
P20<br />
Appendix 2: Ground Water Monitoring Results<br />
Blank cells indicate that no sample was collected due to the site<br />
being dry, inaccessible or not due for collection. Bolded/Shaded<br />
cells indicate results outside recommended criteria
Appendix 2E<br />
Blast Monitoring Results
<strong>Wambo</strong> <strong>Coal</strong> Pty Ltd <strong>AEMR</strong> <strong>2011</strong>-<strong>2012</strong><br />
Homestead (BM01) Kelly (BM02) Muller (BM05) Harris (BM03)<br />
Blast<br />
Number<br />
Date Time Identification<br />
Monitor<br />
No.<br />
Cal Date<br />
Overpressure Vibration<br />
Monitor<br />
Overpressure Vibration<br />
Monitor<br />
Overpressure Vibration<br />
Monitor<br />
Overpressure<br />
Waveform<br />
Cal Date<br />
Waveform<br />
Cal Date<br />
Waveform<br />
Cal Date<br />
dB(L) (mm/sec)<br />
No.<br />
dB(L) (mm/sec)<br />
No.<br />
dB(L) (mm/sec)<br />
No.<br />
dB(L)<br />
Vibration<br />
(mm/sec)<br />
Waveform<br />
1 6/7/<strong>2011</strong> 11:26:00 M7WWD2 722 05/04/11
WA M B O H O M E S T E A D<br />
BLAST VIBRATION VULNERABILITY STUDY<br />
REPORT FOR<br />
WAMBO COAL MINE<br />
PEABODY ENERGY AUSTRALIA<br />
Bill Jordan & Associates Pty Ltd<br />
ABN 83 003 320 652<br />
Chartered Structural Engineer specialising<br />
in conservation of historical structures<br />
PO Box 141<br />
NEWCASTLE NSW 2300<br />
Telephone: (02)4929 4841<br />
Fax: (02)4929 7933<br />
E-mail: mail@bjaeng.com.au<br />
Web: www.bjaeng.com.au
WAMBO HOMESTEAD<br />
1<br />
B L A S T V I B R AT I O N V U L N E R A B I L I T Y S T U DY<br />
1 INTRODUCTION<br />
1.1 <strong>Wambo</strong> Homestead and blast vibrations<br />
<strong>Wambo</strong> Homestead is a complex of early 19 th century buildings located on the <strong>Wambo</strong> <strong>Coal</strong> Mine site near Warkworth<br />
in the NSW Hunter Valley. The building complex has been the subject of many studies over the years and is registered<br />
under the NSW Heritage Act with State Significance. No further discussion of the many heritage aspects of these<br />
buildings will be contained in this report.<br />
Vibrations from mine blasting are a risk to the buildings and their condition has been monitored continually for many<br />
years. A permanent ground vibration monitoring station is set up near the complex and the records from this station<br />
are assessed continually. Bill Jordan & Associates has also been undertaking an annual assessment of the buildings to<br />
determine if vibration damage has been caused; separate visits and assessments have also been carried out following<br />
the few occasions when the monitor recording registers a value greater than 5 mm/s peak particle velocity (PPV).<br />
1.2 Setting of limits<br />
1.2.1 BLAST VIBRATION LIMITS BASIS<br />
The following publications appear to form the basis for the setting of vibration limits in use at present:<br />
• AS 2187.2—2006 (or particularly its predecessor, AS 2187.2—1979), “Explosives—Storage and<br />
use, Part 2: Use of Explosives”,<br />
• Australian and New Zealand Environment Council, “Technical basis for guidelines to minimise<br />
annoyance due to blasting overpressure and ground vibration”, September 1990 (ANZEC 1990).<br />
Since the existing limits were set, further publications have been issued which are relevant and likely to be considered<br />
in any future approvals, in particular “Assessing Vibration: a technical guideline, Department of Environment and<br />
Conservation NSW, February 2006 (DEC 2006).<br />
Of particular note from all these publications is that the limits have all been based on human response to vibration,<br />
not building response. For example, the ANZEC 1990 guideline states:<br />
The recommended criteria apply only to the minimisation of annoyance and. discomfort arising<br />
from blasting.<br />
Similarly, the more recent DEC 2006 publication states:<br />
This guideline presents preferred and maximum vibration values for use in assessing human<br />
responses to vibration and provides recommendations for measurement and evaluation<br />
techniques. It does not address motion sickness, occupational vibration, blasting vibration<br />
effects or vibration-induced damage to buildings or structures.<br />
AS 2187.2—2006 does address damage limits in the “Informative” appendix (i.e. does not form part of the Standard<br />
as a “Normative” appendix does), Appendix J, but does not distinguish between normal buildings and sensitive or<br />
heritage buildings. The previous edition (1979) suggested a PPV limit of 5 mm/s for heritage buildings, but without<br />
any justification.<br />
Overseas standards such as the United States (USBM) RI 8507, the British BS 7385–2 and German DIN 4150 have<br />
some applicable limits. One of the key features in these standards, now recognized in AS 2187.2, is that the limits<br />
are frequency dependent: in AS 2187.2—2006 the frequency dependent vibration limits from BS 7385–2 are given<br />
in Figure J4.4.2.1 and those from (USBM) RI 8507 in Figure J4.4.2.2. Whilst heritage buildings are not dealt with<br />
specifically in these standards, it is notable that the most stringent case in BS 7385–2 is for a PPV of 15 mm/s at<br />
4 Hz, rising to 20 mm/s at 15 Hz and 50 mm/s at 40 Hz; the most stringent condition in (USBM) RI 8507 has similar<br />
April <strong>2012</strong><br />
<strong>Wambo</strong> Homestead<br />
Vibration vulnerability
2<br />
frequency limits but starts at a lower PPV with a “plaster” cosmetic limit of 12.7 mm/s from 2.5 Hz to 10 Hz, before<br />
rising to a PPV of 50 mm/s at 40 Hz also.<br />
1.2.2 APPLICATION OF LIMITS<br />
One key factor in all these limits is that they apply either to maintaining comfort levels for occupants or guard against<br />
even the slightest cosmetic damage in a pristine occupied building. The limits have also been set with no consideration<br />
for the vulnerability of a particular building and are therefore an envelope of a “worst case” scenario: the “worst<br />
case” would be when the vibration frequencies generated by a blast coincide with resonant frequencies in the building,<br />
leading to substantial amplification.<br />
The application of these standards has been explored in recent papers 1,2,3 . The work leading to the papers started with<br />
detailed finite element structural modelling, but with limited monitoring of buildings; it was then extended so that the<br />
induced vibrations of elements of the building could be directly measured, in the first instance with velocity-recording<br />
instruments. Whilst this has led to more robust results in assessing the vulnerability of the buildings, the difficulties<br />
of setting up such instruments on delicate fabric was limiting in its application.<br />
1.3 The basis for the new approach<br />
The long term monitoring at <strong>Wambo</strong> has shown few, if any, indications that vibrations were affecting the buildings,<br />
with the exception of a single incident when there was possibly some slight ceiling plaster cracking in the main house<br />
(“New House”) which could have been caused by resonant vibrations.<br />
Building structures react to ground vibrations caused by blasting in a similar manner to their reaction to earthquake<br />
ground vibrations. Vibrations are transmitted to the building from the foundation and the reaction of the building<br />
depends upon the size and frequency of the activating movement and the inertia and frequency response of the<br />
building. Air blast limits are such that buildings would normally not be affected even to the extent of what might be<br />
experienced in strong winds. There is little or no evidence that air blast has caused damage in buildings at the distances<br />
relevant to <strong>Wambo</strong> Homestead.<br />
In design for earthquake actions, the vibration is normally considered in terms of acceleration units and these can<br />
be readily transformed into building forces from Newtonian mechanics: this is the simplest, quasi-static approach<br />
often used in the past for smaller and less important structures. For larger structures the response of the building<br />
is taken in account by evaluating the response spectrum in accordance with the Australian Standard AS 1170.4: this<br />
can be readily done for a new building built from modern materials with known properties and of a form which can<br />
be readily modelled and analysed. Historical masonry buildings can be analysed approximately if full dimensional<br />
details are known, but the unknown properties of the materials and the connections between elements do no yield<br />
satisfactory results.<br />
The inability to obtain usable results by calculation has led to the approach of directly measuring the vibrational<br />
characteristics of a building.<br />
As explained above, the previous building monitoring work was limited in application due to the type of instrument<br />
available. New lightweight and very sensitive accelerometers have now been sourced and coupled to a seismic recorder,<br />
so giving the best results yet obtained for building vibrational behaviour.<br />
1.4 Application to <strong>Wambo</strong><br />
1.4.1 GROUND VIBRATION<br />
The response of a building is dependent upon the magnitude, direction and frequencies of the ground vibration and<br />
the orientation and characteristic frequencies of the building and its individual components. In general, it is found that<br />
for a 19 th century building such as <strong>Wambo</strong>, the following characteristic frequencies are present:<br />
• single storey building as a whole — 5 Hz to 10 Hz (new house);<br />
• two-storey building as a whole — 2 Hz to 5 Hz (kitchen wing);<br />
1 Jordan, JW, Sutcliffe D and Mullard J, Blast Vibration Effects on Historical Buildings, Australasian Structural Engineering Conference, Melbourne, June 2008 (revised and<br />
published in the Australian Journal of Structural Engineering, Vol. 10 No. 1, 2009).<br />
2 Jordan, JW, Monitoring Blast Effects on Historical Buildings, Australasian Structural Engineering Conference Sydney, August 2010<br />
3 Jordan, JW, Mine blasting vibration and its effects on buildings and structures – implementing a frequency-based approach, Australian Earthquake Engineering Society<br />
Annual Conference, Barossa Valley, November <strong>2011</strong>.<br />
<strong>Wambo</strong> Homestead<br />
Vibration vulnerability<br />
April <strong>2012</strong>
• individual wall panels — 20 Hz to 40 Hz;<br />
• ceilings — 15 Hz to 30 Hz (the form of the roof structure in the <strong>Wambo</strong> house is not known,<br />
and possible shorter framing member spans result in higher frequencies).<br />
These frequencies are relevant for blast design in that, if a ground vibration is similar to a characteristic building<br />
frequency, the action can be greatly magnified. Theoretically, a maximum amplification of 50× is possible at resonance<br />
for a single-degree-of-freedom structure and structure amplifications of more than 20× have been measured during<br />
blasting events in or near Hunter Valley mines.<br />
3<br />
2 THE ASSESSMENT<br />
2.1 Monitoring<br />
Recording instrumentation was set up on two occasions when blasting was being carried out in the Homestead Pit,<br />
on 16 December <strong>2011</strong> and 17 February <strong>2012</strong>, with ground vibration PPV levels recorded at the Homestead monitor<br />
of 4.07 mm/s and 1.68 mm/s respectively. Instrumentation was set up in the house on the first occasion and the first<br />
floor of the kitchen wing on the second. Figure 1 shows the sensor locations for the two events.<br />
Figure 1: Positions of accelerometers<br />
for the two monitored events. The<br />
New House was monitored on 16<br />
December <strong>2011</strong> and the Kitchen Wing,<br />
first floor, on 17 February <strong>2012</strong>.<br />
The wall mounted accelerometers were,<br />
in each case, mounted at the tops of<br />
the walls. The numbers relate to the<br />
vibration recording data and are the<br />
channel numbers used on the recorder.<br />
( Base drawing from EJE Architecture)<br />
2.1.1 THE NEW HOUSE (16/2/<strong>2011</strong>)<br />
Three accelerometers were set up in a front room of the new house where the wall and ceiling dimensions were<br />
judged to be of a size which might make them vulnerable to out-of-plane resonant vibration at the expected blast wave<br />
frequencies: one sensor was fixed near the middle of the ceiling, one just below the ceiling on the front wall and one<br />
just below the ceiling near the middle of the wall adjoining the front hallway.<br />
Photographs of the installation are shown in Figures 2 to 5.<br />
The seismic recorder is fitted with a GPS receiver which gives time accuracy to better than one millisecond. The<br />
current ground monitor is not accurately timed and is understood to have an internal clock which is reset periodically.<br />
If times of similar accuracy could be obtained from both recorders, then observation of arrival times in the building<br />
could be correlated with different stages of the blast wave, allowing better indication of the activating vibration.<br />
April <strong>2012</strong><br />
<strong>Wambo</strong> Homestead<br />
Vibration vulnerability
4<br />
Figure 2: Channel 1 sensor was mounted<br />
high on the wall adjoining the hallway.<br />
Figure 3: Channel 2 sensor was mounted<br />
high on the front wall between the two<br />
windows. The timber seen had been placed<br />
to prop the ceiling and were temporarily<br />
removed for the recording.<br />
Figure 4: Channel 3 was as close to the<br />
centre of the ceiling as practicable. All<br />
accelerometers were mounted using a special<br />
wax and masking tape. The mounting<br />
materials have been chosen to be the least<br />
likely to damage sensitive paint finishes.<br />
<strong>Wambo</strong> Homestead<br />
Vibration vulnerability<br />
April <strong>2012</strong>
5<br />
Figure 5: Setup for recording in front<br />
room of New House<br />
2.1.2 KITCHEN WING<br />
The ceiling of the first floor of the Kitchen Wing is timber lined and not considered generally vulnerable to vibration<br />
damage at the levels expected: it is of the “collar-tie” form with sloped sides leading up to a central flat section. The<br />
accelerometer sensors were therefore mounted at the tops of walls with a view to obtaining the best data:<br />
• one sensor was placed on the end (southern) wall above the door;<br />
• one was placed midway along the eastern wall near the non-structural partition wall;<br />
• one was placed on the chimney breast as the chimney may have different vibrational characteristics<br />
and a lower frequency response from the walls.<br />
Photographs of the installation are shown in Figures 6 to 8.<br />
Figure 6: Sensor 2 beside non-structural wall, which was not considered to<br />
affect significantly the behaviour of the brick wall which it joins.<br />
April <strong>2012</strong><br />
<strong>Wambo</strong> Homestead<br />
Vibration vulnerability
6<br />
Figure 7: Sensor 1 above the doorway.<br />
Figure 8: Overall setup in the southern,<br />
first-floor room of the Kitchen Wing.<br />
Sensor 3 was set up on the chimney breast<br />
as its behaviour may have been different<br />
from the rest of the building.<br />
2.2 Results<br />
2.2.1 ANALYSIS<br />
The results from the accelerometers were analysed as follows:<br />
• using an routine based on in the program Matlab, the acceleration readings were analysed to yield<br />
velocity and displacement values, a typical result being shown in Figure 9;<br />
Figure 9: Recordings and transformations from sensor 3 (centre<br />
of ceiling) on 16/12/<strong>2011</strong>. The maximum velocity is 21.6<br />
mm/s, an amplification of 16×. Displacement of the ceiling is a<br />
maximum of 0.3 mm, which is well within the acceptable limit.<br />
The time scale in this plot relates to the GPS-sourced time and could<br />
be used to give greater understanding of the effects if other blast<br />
recorders were time to similar accuracy.<br />
<strong>Wambo</strong> Homestead<br />
Vibration vulnerability<br />
April <strong>2012</strong>
• spectrograms were constructed using a Matlab procedure from both the ground monitor velocity<br />
signals and the accelerometer results so that comparisons of activating and induced vibrations<br />
could be made as seen in Figure 10.<br />
7<br />
Figure 10: For the event of 16/12/<strong>2011</strong>, the ground monitor spectrogram for the vertical recording is on the left and the resultant<br />
ceiling spectrogram is on the right. Note that the scales of the two spectrograms are different. It will be seen that the ground vibration<br />
had a strong vertical pulse at 16 Hz and that the ceiling resonated at about 13 Hz. The closeness of these values explains the large<br />
amplification.<br />
All the diagrams for the two monitored events are reproduced in the appendix.<br />
It should be emphasised that the results may not explain the behaviour of the whole of the buildings. However, every<br />
effort was made to make them representative and, in the case of the New House ceiling, the location was chosen to<br />
coincide with fabric which may have been damaged previously by blast vibration.<br />
The ground monitor geophone is mounted with axes north-south, east-west and vertical. The horizontal axes have<br />
orientations similar to the walls of the house, making it easier to make comparisons.<br />
2.2.2 NEW HOUSE<br />
Readings taken in the New House are summarised in Table 1. The orientation refers to the direction of movement.<br />
Event ident.<br />
Channel<br />
no.<br />
Table 1 – New House 16/12/<strong>2011</strong><br />
Orientation Max ‘a’, Max ‘v’, Max. ‘s’, mm<br />
mm/s² mm/s<br />
Dominant<br />
frequency,<br />
Hz<br />
House 1 E-W 676 8.4 0.21 30 2.3<br />
2 N-S 712 8.7 0.14 13 4.6<br />
3 V 1630 21.6 0.28 13 16.6<br />
Velocity<br />
amplification<br />
in building<br />
Grounds E-W 1.9 12.5<br />
N-S 3.6 15.5<br />
V 1.3 16<br />
The dominant frequencies tabulated are not sharp peaks and, in some cases, there are a number of pulses at different<br />
frequencies which probably relate to the blast design parameters. The spectrograms from which the frequencies are<br />
taken are appended.<br />
It can be seen clearly that significant movement occurs in elements of the house when resonance is present. The<br />
movement in the ceiling has a particularly high acceleration, equivalent to 0.16 g (where g = acceleration due to<br />
gravity). On its own, this value suggests that fastenings of the ceiling were subjected to a 16% increase in load but this<br />
should not have led to adverse effects. However, if values increased proportionally for higher levels of blast vibration,<br />
then a PPV of 5 mm/s might result in a ceiling load increase of 64%. Such an extrapolation is only very approximate<br />
because of the many factors involved, but it does show that the ceiling is vulnerable at a low PPV of 5 mm/s if<br />
frequencies are not controlled.<br />
April <strong>2012</strong><br />
<strong>Wambo</strong> Homestead<br />
Vibration vulnerability
8<br />
2.2.3 KITCHEN WING<br />
Results for the first floor of the Kitchen Wing, recorded on 17/2/<strong>2012</strong>, are scheduled in a similar manner in Table 2.<br />
Event ident.<br />
Channel<br />
no.<br />
Table 2 – Kitchen Wing first floor 17/2/<strong>2012</strong><br />
Orientation Max ‘a’, Max ‘v’, Max. ‘s’, mm<br />
mm/s² mm/s<br />
Dominant<br />
frequency,<br />
Hz<br />
Kitchen Wing 1 N-S 845 13.1 0.31 10 10<br />
2 E-W: 1 184 3.9 0.25 12 2.7<br />
3 E-W: 2 220 3.8 0.13 10 2.6<br />
Velocity<br />
amplification<br />
in building<br />
Grounds N-S 1.31 11<br />
E-W 1.47 12<br />
V 0.84 NA<br />
Reference to the spectrogram plots helps explain the different levels of amplification from what was experienced<br />
in the house. In particular, the vibration of the chimney was quite low, indicating that resonance did not occur; the<br />
north-south side wall did seem to get some resonance, as seen by the distinct pulses in the spectrogram, but other<br />
frequencies were present as seen by the smearing. The most distinct movement was for the N-S direction, which is<br />
likely to have been attributable to the movement in the end wall of building; the frequency correlating with what might<br />
have been expected from the building as a whole would be up to 5 Hz.<br />
3 CONCLUSIONS<br />
3.1 Vibration vulnerability<br />
Vibration monitoring during blast events in representative rooms in the New House and Kitchen Wing at <strong>Wambo</strong><br />
Homestead has shown that effects on the buildings are related to the frequencies in the blast wave. In particular, it was<br />
observed that the buildings are most vulnerable to damage when the blast wave contains frequencies in the 10 Hz to<br />
15 Hz range.<br />
3.2 Scope for blast design adjustments to reduce vulnerability<br />
Adjusting detonator delays and blast patterns has the potential for controlling the frequency distribution within the<br />
blast wave. If, in the future, blasts critical to <strong>Wambo</strong> Homestead were be designed to have frequencies below 8 Hz<br />
and greater than (say) 16 Hz, then the potential for damage, particularly to plaster ceilings, could be greatly reduced.<br />
With suitable blast design this could allow substantially increased blast sizes without any greater risk of damage to the<br />
buildings.<br />
J.W. Jordan FIEAust CPEng<br />
NPER Structural & Conservation Reg. No. 161488<br />
April <strong>2012</strong><br />
<strong>Wambo</strong> Homestead<br />
Vibration vulnerability<br />
April <strong>2012</strong>
APPENDIX A<br />
Waveforms and spectrograms<br />
Event of 16 December <strong>2011</strong><br />
April <strong>2012</strong><br />
Appendices<br />
<strong>Wambo</strong> Homestead<br />
Vibration vulnerability
Channel 1: Wall adjoining hallway, front room of New House (east-west movement).<br />
Channel 2: Front wall facing verandah of New House.<br />
Channel 3: Centre of ceiling in front room of New House
East - west ground monitor (“transverse”)<br />
North - south ground monitor (“radial”)<br />
Vertical ground monitor<br />
April <strong>2012</strong><br />
Appendices<br />
<strong>Wambo</strong> Homestead<br />
Vibration vulnerability
APPENDIX B<br />
Waveforms and spectrograms<br />
Event of 17/2/<strong>2012</strong><br />
April <strong>2012</strong><br />
Appendices<br />
<strong>Wambo</strong> Homestead<br />
Vibration vulnerability
Channel 1:<br />
Channel 2:<br />
Channel 3:
North - south ground monitor (“radial”)<br />
East - west ground monitor (“transverse”)<br />
April <strong>2012</strong><br />
Appendices<br />
<strong>Wambo</strong> Homestead<br />
Vibration vulnerability
Appendix 2F<br />
Noise Monitoring Results
<strong>Wambo</strong> <strong>Coal</strong> Mine<br />
Annual Report<br />
_____________________________________________<br />
<strong>2011</strong>/<strong>2012</strong><br />
Environmental Noise Monitoring<br />
Prepared for<br />
<strong>Wambo</strong> <strong>Coal</strong> Pty Limited<br />
_____________________________________
<strong>Wambo</strong> <strong>Coal</strong> Mine Annual Report<br />
<strong>2011</strong>/<strong>2012</strong><br />
Environmental Noise Monitoring<br />
Reference: 12384_R01.doc<br />
Report date: 21 August <strong>2012</strong><br />
Prepared for<br />
<strong>Wambo</strong> <strong>Coal</strong> Pty Limited<br />
PMB 1<br />
Singleton NSW 2330<br />
Prepared by<br />
Global Acoustics Pty Ltd<br />
PO Box 3115<br />
Thornton NSW 2322<br />
Prepared:<br />
Katie Weekes<br />
Environmental Scientist<br />
QA Review: Joel Curran<br />
Chemical Engineer (Acoustics)<br />
Global Acoustics Pty Ltd ~ Environmental noise modeling and impact assessment ~ Sound power testing ~ Noise<br />
control advice ~ Noise and vibration monitoring ~ OHS noise monitoring and advice ~ Expert evidence in Land<br />
and Environment and Compensation Courts ~ Architectural acoustics ~ Blasting assessments and monitoring ~<br />
Noise management plans (NMP) ~ Sound level meter and noise logger sales and hire<br />
12384_R01.doc<br />
Page i
EXECUTIVE SUMMARY<br />
Global Acoustics was engaged by <strong>Wambo</strong> <strong>Coal</strong> Pty Ltd to provide a summary of the<br />
quarterly environmental noise surveys conducted around <strong>Wambo</strong> <strong>Coal</strong> Mine (WCM), and the<br />
<strong>Wambo</strong> <strong>Coal</strong> Rail Spur (WCRS) from 1 July <strong>2011</strong> to 30 June <strong>2012</strong>.<br />
Monitoring was delayed several times during Quarter 2, <strong>2012</strong> due to train scheduling and the<br />
arrival of trains coinciding with acceptable meteorological conditions. As a result of trying to<br />
find a suitable time to undertake WCRS monitoring, the Quarter 2 <strong>2012</strong> survey was extended<br />
into August <strong>2012</strong>.<br />
WCM was granted consent (DA 305-7-2003) in February 2004, which enables the extension of<br />
current open cut and underground mining operations.<br />
The WCRS consists of two Development Applications (DA’s):<br />
<br />
The <strong>Wambo</strong> Rail Loop (DA 177-8-2004); and<br />
The <strong>Wambo</strong> Rail Line (DA 235/97).<br />
The relevant sections of these consents are reproduced in Appendix A.<br />
Attended environmental noise monitoring described in this report was undertaken on a<br />
quarterly basis at five sites during Quarters 3 and 4 <strong>2011</strong> and Quarters 1 and 2 <strong>2012</strong> around<br />
the mine. The survey purpose is to quantify and describe the existing acoustic environment<br />
around WCM and WCRS and compare results with relevant development consent conditions<br />
or modelled EIS noise levels.<br />
Noise levels from WCM complied with the development consent criteria or modelled noise<br />
levels at all sites during the <strong>2011</strong>/<strong>2012</strong> attended monitoring.<br />
Noise levels from WCRS complied with the development consent criteria or modelled noise<br />
levels at all sites during the <strong>2011</strong>/<strong>2012</strong> attended monitoring. Monitoring was delayed several<br />
times during Quarter 2, <strong>2012</strong> due to train scheduling and the arrival of trains coinciding with<br />
acceptable meteorological conditions. As a result of trying to find a suitable time to<br />
undertake WCRS monitoring, the Quarter 2 <strong>2012</strong> survey was extended into July <strong>2012</strong>.<br />
It is noted that wind speeds and/or temperature inversion conditions were at levels greater<br />
than which development consent conditions would apply for WCM and WCRS activities in<br />
some instances. In all instances, the predicted EIS noise levels were met regardless.<br />
Rail pass-by monitoring was not undertaken during this reporting period.<br />
12384_R01.doc<br />
Page ii
Table of Contents<br />
1 INTRODUCTION...........................................................................................................................1<br />
1.1 Background ................................................................................................................................1<br />
1.2 Monitoring Locations and Frequency ........................................................................................2<br />
1.3 Terminology...............................................................................................................................4<br />
1.4 <strong>Wambo</strong> <strong>Coal</strong> Mine Development Consent.................................................................................5<br />
1.5 <strong>Wambo</strong> <strong>Coal</strong> Rail Spur Development Consent ..........................................................................6<br />
2 METHODOLOGY..........................................................................................................................8<br />
2.1 Assessment Method ...................................................................................................................8<br />
2.1.1 Overview .............................................................................................................................8<br />
2.1.2 Attended Noise Monitoring .................................................................................................8<br />
3 RESULTS.........................................................................................................................................9<br />
3.1 Attended Noise Monitoring – Quarter 3, <strong>2011</strong>...........................................................................9<br />
3.1.1 <strong>Wambo</strong> <strong>Coal</strong> Mine Noise ....................................................................................................9<br />
3.1.2 <strong>Wambo</strong> <strong>Coal</strong> Rail Spur Noise ...........................................................................................11<br />
3.2 Attended Noise Monitoring – Quarter 4, <strong>2011</strong>.........................................................................13<br />
3.2.1 <strong>Wambo</strong> <strong>Coal</strong> Mine Noise ..................................................................................................13<br />
3.2.2 <strong>Wambo</strong> <strong>Coal</strong> Rail Spur Noise ...........................................................................................15<br />
3.3 Attended Noise Monitoring – Quarter 1, <strong>2012</strong>.........................................................................17<br />
3.3.1 <strong>Wambo</strong> <strong>Coal</strong> Mine Noise ..................................................................................................17<br />
3.3.2 <strong>Wambo</strong> <strong>Coal</strong> Rail Spur Noise ...........................................................................................19<br />
3.4 Attended Noise Monitoring – Quarter 2, <strong>2012</strong>.........................................................................21<br />
3.4.1 <strong>Wambo</strong> <strong>Coal</strong> Mine Noise ..................................................................................................21<br />
3.4.2 <strong>Wambo</strong> <strong>Coal</strong> Rail Spur Noise ...........................................................................................23<br />
4 SUMMARY OF COMPLIANCE ................................................................................................25<br />
4.1 Summary ..................................................................................................................................25<br />
Appendices<br />
A. DEVELOPMENT CONSENT................................................................................................A.1<br />
A.1 <strong>Wambo</strong> <strong>Coal</strong> Mine Development Consent............................................................................. A.1<br />
A.1.1 Relevant <strong>Wambo</strong> <strong>Coal</strong> Mine Development Consent Conditions ..................................... A.1<br />
A.2 <strong>Wambo</strong> Rail Spur Development Consent .............................................................................. A.4<br />
A.2.1 Relevant WCRS Development Consent Conditions......................................................... A.4<br />
12384_R01.doc<br />
Page iii
1 INTRODUCTION<br />
1.1 Background<br />
Global Acoustics was engaged by <strong>Wambo</strong> <strong>Coal</strong> Pty Ltd to provide a summary of the<br />
quarterly environmental noise surveys conducted around <strong>Wambo</strong> <strong>Coal</strong> Mine (WCM), and the<br />
<strong>Wambo</strong> <strong>Coal</strong> Rail Spur (WCRS) from 1 July <strong>2011</strong> to 30 June <strong>2012</strong>.<br />
Monitoring was delayed several times during Quarter 2, <strong>2012</strong> due to train scheduling and the<br />
arrival of trains coinciding with acceptable meteorological conditions. As a result of trying to<br />
find a suitable time to undertake WCRS monitoring, the Quarter 2 <strong>2012</strong> survey was extended<br />
into August <strong>2012</strong>.<br />
The rail spur and mine operate under separate development consents and have been<br />
monitored separately. Reporting, however, has been combined in this document.<br />
<strong>Wambo</strong> <strong>Coal</strong> operates both open cut and underground mining operations from their mine at<br />
Warkworth, NSW. The open cut operations include use of heavy mobile equipment in open<br />
cut pits, on haul roads and on waste rock emplacements. The underground operations have<br />
surface facilities. Both operations utilise a coal handling and preparation plant (CHPP)<br />
including conveyors, bins and other material-handling infrastructure.<br />
The WCRS is located between Mt Thorley and Warkworth Village, New South Wales (as<br />
shown in Figure 1) and includes the following components:<br />
<br />
<br />
a product coal stockpile and reclaim area, product coal conveyer, train loadout bin, rail<br />
loop and a rail spur from the <strong>Wambo</strong> <strong>Coal</strong> Mine to Mount Thorley; and<br />
rail transport of product coal to the market, an intermittent activity that can take place at<br />
anytime.<br />
Attended environmental noise monitoring described in this report was undertaken on a<br />
quarterly basis at five sites during Quarters 3 and 4 <strong>2011</strong> and Quarters 1 and 2 <strong>2012</strong> around<br />
the mine. Figure 1 shows the monitoring locations.<br />
Two of the five monitoring locations are within the Noise Affectation Zone, as identified in<br />
EIS reports (<strong>Wambo</strong> Development Project EIS (Resource Strategies, 2003), and Jerrys Plains <strong>Coal</strong><br />
Terminal and Rail Line Environmental Impact Statement and Statement of Environmental Effects<br />
(CMPS&F, 1997)); as such, noise criteria do not apply directly to these properties. For these<br />
locations, measured noise levels from WCM and WCRS are compared against EIS modelled<br />
noise results. Compliance with modelled noise levels at these nearest receptors indicates<br />
compliance with development consent criteria at properties further away is likely.<br />
12384_R01.doc<br />
Page 1
The survey purpose is to quantify and describe the existing acoustic environment around<br />
WCM and WCRS and compare results with relevant development consent conditions or<br />
modelled EIS noise levels.<br />
1.2 Monitoring Locations and Frequency<br />
Table 1.1 outlines the monitor type and frequency for the noise monitoring locations shown<br />
in Figure 1.<br />
Table 1.1 WAMBO COAL MONITORING LOCATIONS AND FREQUENCY1<br />
Site<br />
Reference<br />
Site Location<br />
Monitor<br />
Type<br />
Consent Requirement Frequency 1<br />
N01 Lambkin Residence Attended Mine & Rail Spur<br />
Development Consents<br />
Quarterly<br />
N03 Kelly Residence Real-time &<br />
Attended<br />
N16 Muller Residence Real-time &<br />
Attended<br />
Mine Development Consent<br />
Mine Development Consent<br />
Continuous & Quarterly<br />
Continuous & Quarterly<br />
N20 Thelander Residence Real-time Mine Development Consent Continuous<br />
N21<br />
<strong>Wambo</strong> South<br />
Residence<br />
Real-time Mine Development Consent Continuous<br />
N22 3 Henderson Residence Attended Rail Spur Development<br />
Consent<br />
Quarterly<br />
N23 Redmanvale Road Attended Mine Development Consent Quarterly<br />
N24 Curlewis Residence Attended Mine & Rail Spur<br />
Development Consents<br />
N25 2 Dyson Residence Rail Pass-by Rail Spur Development<br />
Consent<br />
Quarterly<br />
Every fifth quarterly<br />
period<br />
Source: <strong>Wambo</strong> <strong>Coal</strong> Noise Monitoring Program – EMP011 2007.<br />
Notes: 1. Quarterly attended locations are shown in italics;<br />
2. Dyson required every fifth quarterly period (last monitored in Q2 <strong>2011</strong>); and<br />
3. Monitoring at N22 not undertaken after Quarter 3, 2010 due to a change of ownership (mine<br />
owned).<br />
12384_R01.doc<br />
Page 2
Source: WCNMP, 2007<br />
Figure 1<br />
Monitoring Sites<br />
12384_R01.doc<br />
Page 3
1.3 Terminology<br />
Some definitions of terminology, which may be used in this report, are provided in Table 1.2.<br />
Table 1.2 TERMINOLOGY<br />
Descriptor<br />
L A<br />
L A10<br />
Definition<br />
The A-weighted root mean squared (RMS) noise level at any instant<br />
The noise level which is exceeded for 10 per cent of the time, which is<br />
approximately the average of the maximum noise levels<br />
L A90<br />
The level exceeded for 90 per cent of the time, which is approximately the<br />
average of the minimum noise levels. The L A90 level is often referred to as<br />
the “background” noise level and is commonly used to determine noise<br />
criteria for assessment purposes<br />
L Aeq<br />
L pk<br />
dB(A)<br />
The average noise energy during a measurement period<br />
The unweighted peak noise level at any instant<br />
Noise level measurement units are decibels (dB). The “A” weighting scale<br />
is used to describe human response to noise<br />
SPL<br />
Sound pressure level (SPL), fluctuations in pressure measured as 10 times a<br />
logarithmic scale, the reference pressure being 20 micropascals<br />
SEL<br />
Sound exposure level (SEL), the A-weighted noise energy during a<br />
measurement period normalised to one second<br />
Hertz (Hz)<br />
Cycles per second, the frequency of fluctuations in pressure, sound is<br />
usually a combination of many frequencies together<br />
ABL<br />
Assessment background level (ABL), the 10th percentile background noise<br />
level for a single period (day, evening or night) of a 24 hour monitoring<br />
period<br />
RBL<br />
Rating background level (RBL), the background noise level for a period<br />
(day, evening or night) determined from ABL data<br />
Day<br />
Evening<br />
Night<br />
This is the period 7:00am to 6:00pm<br />
This is the period 6:00pm to 10:00pm<br />
The period 10:00pm to 7:00am<br />
12384_R01.doc<br />
Page 4
1.4 <strong>Wambo</strong> <strong>Coal</strong> Mine Development Consent<br />
WCM was granted consent (DA 305-7-2003) in February 2004, which enables the extension of<br />
current open cut and underground mining operations.<br />
The <strong>Wambo</strong> <strong>Coal</strong> Environmental Management System, Noise Monitoring Programme (Document<br />
EMP011, Rev 3, May 2007) was prepared in accordance with Schedule 4, Consent Condition 9.<br />
The Noise Monitoring Programme indicates that monitoring will be conducted for WCM<br />
activities, and the noise levels to be used for assessment. Monitoring for noise from mining<br />
activities is undertaken at the properties numbered N01, N03, N16, N23 and N24.<br />
It should be noted that properties N01, and N03 are within the Noise Affectation Zone for the<br />
development, and are also subject to acquisition upon request, as detailed in Schedule 4,<br />
Condition 1 of DA 305-7-2003. As such, there are no operational noise goals that apply<br />
directly to these properties. Predicted maximum noise levels from the EIS are therefore used<br />
for comparison at these locations except where these levels are less than the minimum<br />
criterion for intrusive noise nominated in the NSW Industrial Noise Policy (35 dB). In these<br />
instances, a criterion of 35 dB is used for assessment. Compliance with predicted levels at<br />
these locations indicates likely compliance at properties further away from WCM.<br />
Table 1.3 summarises relevant noise assessment criteria for WCM.<br />
Table 1.3 WAMBO COAL MINE NOISE GOALS<br />
Location<br />
L Aeq(15minute) Day dB<br />
L Aeq(15minute) Evening /<br />
Night dB<br />
L A1(1minute) Night dB<br />
N01 2 35 41 / 35 3 -<br />
N03 2 54 59 / 57 3 -<br />
N16 1 35 40 50<br />
N23 1 35 38 50<br />
N24 1 35 41 50<br />
Notes: 1. Criteria from Development Consent DA 305-7-2003;<br />
2. N01, and N03 are within the Zone of Affectation. Modelled noise levels from EIS are presented for these sites;<br />
and<br />
3. Seasonal modelled noise level for Winter/Not winter.<br />
12384_R01.doc<br />
Page 5
1.5 <strong>Wambo</strong> <strong>Coal</strong> Rail Spur Development Consent<br />
The WCRS consists of two Development Applications (DA’s):<br />
The <strong>Wambo</strong> Rail Loop (DA 177-8-2004); and<br />
The <strong>Wambo</strong> Rail Line (DA 235/97).<br />
The <strong>Wambo</strong> <strong>Coal</strong> Environmental Management System, Noise Monitoring Programme (Document<br />
EMP011, Rev 3, May 2007) was prepared in accordance with Schedule 4, Consent Condition 9.<br />
The Noise Monitoring Programme indicates that monitoring will be conducted for WCRS<br />
activities, and the noise levels to be used for assessment. Monitoring for noise from rail<br />
activities is undertaken at properties numbered N01 and N24 each quarter and at N25 every<br />
fifth quarter for rail pass-by noise. Rail pass-by monitoring was not undertaken during this<br />
reporting period.<br />
It should be noted that property number N22 is within the Noise Affectation Zone for the<br />
development, and is also subject to acquisition upon request, as detailed in Condition 1 of DA<br />
177-8-2004. As such, the operational noise goals or predictions do not apply directly to this<br />
property. Due to a change of ownership (the property is now owned by a mining company),<br />
monitoring is not undertaken at N22.<br />
It is also noted however that Condition 2 of DA 177-8-2004 indicates that “While the land listed<br />
in Table 1 [of Condition 1] is privately owned, the Applicant shall implement all practicable measures<br />
to ensure that the impacts of the development comply with the predictions in the SEE, and the relevant<br />
conditions in this consent, at any residence on this land, to the satisfaction of the Director-General.”<br />
Therefore, the predicted operational noise levels outlined in the Jerrys Plains <strong>Coal</strong> Terminal and<br />
Rail Line Environmental Impact Statement and Statement of Environmental Effects (CMPS&F,<br />
1997), as reproduced in Resource Strategies (2005), are referred to in this report. Compliance<br />
with the predicted levels from the EIS at this monitoring location indicates likely compliance<br />
at properties further away from the WCRS.<br />
Table 1.4 summarises relevant noise assessment criteria for the WCRS during operation.<br />
Table 1.4 OPERATIONAL NOISE GOALS, WAMBO COAL RAIL SPUR<br />
Location L Aeq Day dB L Aeq(15minute) Evening<br />
and Night dB<br />
L A1(1minute) Night dB<br />
N01 35 41 / 35 2 -<br />
N24 35 41 50<br />
Notes:<br />
1. This site is within the Zone of Affectation and so modelled noise levels from EIS are adopted as criteria; and<br />
2. Seasonal modelled noise level for Winter/Not winter.<br />
12384_R01.doc<br />
Page 6
The noise limits identified in Table 1.4 apply under meteorological conditions of:<br />
<br />
<br />
wind speeds of up to 3 m/s at 10 metres above ground level; or<br />
temperature inversion conditions of up to 3ºC/100m, and wind speeds of up to 2 m/s at<br />
10 metres above ground level.<br />
The relevant section of each consent is reproduced in Appendix A.<br />
12384_R01.doc<br />
Page 7
2 METHODOLOGY<br />
2.1 Assessment Method<br />
2.1.1 Overview<br />
Noise monitoring was conducted at the nearest residences in accordance with the<br />
Environment Protection Authority (EPA) ‘Industrial Noise Policy’ (INP) guidelines and<br />
Australian Standard AS 1055 ‘Acoustics, Description and Measurement of Environmental<br />
Noise’. The mine was operating for all monitoring. WCRS monitoring was only conducted<br />
while train loading was in progress.<br />
Meteorological data was obtained from the <strong>Wambo</strong> <strong>Coal</strong> Mine meteorological station. This<br />
allowed correlation of atmospheric parameters and measured noise levels. Ground level<br />
atmospheric condition measurement was also undertaken during attended monitoring.<br />
2.1.2 Attended Noise Monitoring<br />
Attended noise monitoring was conducted at all sites during day and night hours.<br />
Monitoring was not conducted in the evening period, as consent limits are the same for<br />
evening and night periods, and night time monitoring is considered a more suitable time to<br />
measure the source of interest. The duration of all measurements was 15 minutes.<br />
Attended monitoring is preferred to the use of loggers when determining compliance with<br />
prescribed limits; it allows an accurate determination of the contribution, if any, to measured<br />
noise levels by the source of interest (in this case WCM and / or WCRS).<br />
Weather conditions were recorded at each location during each noise level measurement.<br />
Although the consent is not specific as to where the meteorological data should be sourced,<br />
information from WCM has been used as it is measured with an elevated anemometer as is<br />
required by the consent. The anemometer at WCM is not overly distant from the monitoring<br />
locations and is considered to be representative of the general area. Wind speeds measured<br />
at 10 metres above ground are usually higher than those measured closer to ground level. In<br />
accordance with consent conditions, noise criteria only apply in wind speeds up to 3 metres<br />
per second.<br />
12384_R01.doc<br />
Page 8
3 RESULTS<br />
3.1 Attended Noise Monitoring – Quarter 3, <strong>2011</strong><br />
3.1.1 <strong>Wambo</strong> <strong>Coal</strong> Mine Noise<br />
Noise levels generated by activity at <strong>Wambo</strong> are shown in Table 3.1 and Table 3.2, where<br />
comparison of measured L Aeq(15 minutes) and L A1(1 minute) levels for WCM is made with<br />
relevant noise goals.<br />
Table 3.1 L Aeq(15 minute) dB GENERATED BY WCM AGAINST NOISE CRITERIA - QUARTER 3, <strong>2011</strong><br />
Location Date / Start Time Wind<br />
Speed<br />
(m/s)<br />
VTG 7<br />
( 0 C/100m)<br />
Criterion<br />
L Aeq(15<br />
min) dB1<br />
Winter<br />
Criterion<br />
L Aeq(15<br />
min) dB1<br />
Not winter<br />
Criterion<br />
Applies? 3<br />
<strong>Wambo</strong><br />
L Aeq(15<br />
min) dB<br />
4,5<br />
Exceedance<br />
6,8<br />
N01 2 27/09/11 00:10 0.0 3.0 41 35 N IA NA<br />
N03 2 26/09/11 22:06 0.5 3.0 59 57 N
Table 3.2 L A1(1 minute) dB GENERATED BY WCM AGAINST NOISE CRITERIA - QUARTER 3, <strong>2011</strong><br />
Location Date / Start Time Wind<br />
Speed<br />
(m/s)<br />
VTG 7<br />
( 0 C/100m)<br />
Criterion<br />
L A1(1 min)<br />
dB 1<br />
Criterion<br />
Applies? 3<br />
<strong>Wambo</strong><br />
L A1(1 min)<br />
dB 4,5<br />
Exceedance 6,8<br />
N01 2 27/09/11 00:10 0.0 3.0 NA N - NA<br />
N03 2 26/09/11 22:06 0.5 3.0 NA N - NA<br />
N16 27/09/11 01:54 0.0 3.0 50 N
3.1.2 <strong>Wambo</strong> <strong>Coal</strong> Rail Spur Noise<br />
Noise levels generated by activity associated with the <strong>Wambo</strong> <strong>Coal</strong> Rail Spur are shown in<br />
Table 3.3 and Table 3.4, where comparison of measured L Aeq(15 minutes) and L A1(1 minute) levels<br />
for WCRS is made with relevant noise goals.<br />
Table 3.3 L Aeq(15 minute) dB GENERATED BY WCRS AGAINST NOISE CRITERIA - QUARTER 3, <strong>2011</strong><br />
Location Date / Start Time Wind<br />
Speed<br />
(m/s)<br />
VTG 7<br />
( 0 C/100m)<br />
Criterion<br />
L Aeq(15<br />
min) dB1<br />
Winter<br />
Criterion<br />
L Aeq(15<br />
min) dB1<br />
Not winter<br />
Criterion<br />
Applies? 3<br />
<strong>Wambo</strong><br />
L Aeq(15<br />
min) dB<br />
4,5<br />
Exceedance<br />
6,8<br />
N01 27/09/11 00:10 0.0 3.0 41 35 N IA NA<br />
N24 26/09/11 23:15 0.1 3.0 41 41 N IA NA<br />
N01 04/10/11 14:00 1.8 -1.6 35 35 Y IA Nil<br />
N24 04/10/11 12:48 3.0 -1.8 35 35 N IA NA<br />
Notes:<br />
1. Development consent criterion;<br />
2. Monitoring location is within Zone of Affectation. EIS or SEE modelled noise level presented;<br />
3. The noise emission limits identified in the above table apply under meteorological conditions of:<br />
- Wind speeds of up to 3 m/s at 10 metres above ground level; or<br />
- Temperature inversion conditions of up to 3ºC/100m, and wind speeds of up to 2 m/s at 10 metres above<br />
ground level.<br />
4. Estimated or measured L Aeq dB attributed to WCRS;<br />
5. NM denotes WCRS audible but not measurable, IA denotes inaudible;<br />
6. NA in exceedance column means atmospheric conditions outside conditions specified in development consent and<br />
so criterion is not applicable;<br />
7. Vertical temperature gradient (VTG) calculated using sigma theta values according to INP procedures; and<br />
8. Bold and red text indicate an exceedance of relevant criterion.<br />
12384_R01.doc<br />
Page 11
Table 3.4 L A1(1 minute) dB GENERATED BY WCRS AGAINST NOISE CRITERIA - QUARTER 3, <strong>2011</strong><br />
Location Date / Start Time Wind<br />
Speed<br />
(m/s)<br />
VTG 7<br />
( 0 C/100m)<br />
Criterion<br />
L A1(1 min)<br />
dB 1<br />
Criterion<br />
Applies? 1,3<br />
<strong>Wambo</strong><br />
L A1(1 min)<br />
dB 4,5<br />
Exceedance 6,8<br />
N24 26/09/11 23:15 0.1 3.0 50 N IA NA<br />
Notes:<br />
1. Development consent criterion;<br />
2. Monitoring location is within Zone of Affectation, no EIS L A1,1min levels available;<br />
3. The noise emission limits identified in the above table apply under meteorological conditions of:<br />
- Wind speeds of up to 3 m/s at 10 metres above ground level; or<br />
- Temperature inversion conditions of up to 3ºC/100m, and wind speeds of up to 2 m/s at 10 metres above<br />
ground level.<br />
4. Estimated or measured L A1,1min dB attributed to WCM;<br />
5. NM denotes WCM audible but not measurable, IA denotes inaudible;<br />
6. NA in exceedance column means atmospheric conditions outside conditions specified in development consent and<br />
so criterion is not applicable, or, there is no applicable criterion;<br />
7. Vertical temperature gradient (VTG) calculated using sigma theta values according to INP procedures; and<br />
8. Bold and red text indicate an exceedance of relevant criterion.<br />
12384_R01.doc<br />
Page 12
3.2 Attended Noise Monitoring – Quarter 4, <strong>2011</strong><br />
3.2.1 <strong>Wambo</strong> <strong>Coal</strong> Mine Noise<br />
Noise levels generated by activity at <strong>Wambo</strong> are shown in Table 3.5 and Table 3.6, where<br />
comparison of measured L Aeq(15 minutes) and L A1(1 minute) levels for WCM is made with<br />
relevant noise goals.<br />
Table 3.5 L Aeq(15 minute) dB GENERATED BY WCM AGAINST NOISE CRITERIA - QUARTER 4, <strong>2011</strong><br />
Location Date / Start Time Wind<br />
Speed<br />
(m/s)<br />
VTG 7<br />
( 0 C/100m)<br />
Criterion<br />
L Aeq(15<br />
min) dB1<br />
Winter<br />
Criterion<br />
L Aeq(15<br />
min) dB1<br />
Not winter<br />
Criterion<br />
Applies? 3<br />
<strong>Wambo</strong><br />
L Aeq(15<br />
min) dB<br />
4,5<br />
Exceedance<br />
6,8<br />
N01 2 22/12/11 15:01 4.1 -1.6 35 35 N IA NA<br />
N03 2 15/11/11 13:48 3.1 -1.9 54 54 N IA NA<br />
N16 15/11/11 14:50 4.1 -1.8 35 35 N IA NA<br />
N23 15/11/11 15:17 4.4 -1.8 35 35 N IA NA<br />
N24 15/11/11 10:02 3.6 -1.9 35 35 N IA NA<br />
N01 2 15/12/11 02:01 0.7 4.1 41 35 N IA NA<br />
N03 2 15/12/11 01:49 0.6 4.1 59 57 N IA NA<br />
N16 14/12/11 22:27 1.5 -1.0 40 40 Y IA Nil<br />
N23 14/12/11 23:29 1.3 -1.0 38 38 Y NM Nil<br />
N24 15/12/11 02:38 0.3 4.1 41 41 N NM NA<br />
Notes:<br />
1. Development consent criterion;<br />
2. Monitoring location is within Zone of Affectation. EIS or SEE modelled noise level presented;<br />
3. The noise emission limits identified in the above table apply under meteorological conditions of:<br />
- Wind speeds of up to 3 m/s at 10 metres above ground level; or<br />
- Temperature inversion conditions of up to 3ºC/100m, and wind speeds of up to 2 m/s at 10 metres above<br />
ground level.<br />
4. Estimated or measured L Aeq dB attributed to WCM;<br />
5. NM denotes WCM audible but not measurable, IA denotes inaudible;<br />
6. NA in exceedance column means atmospheric conditions outside conditions specified in development consent and<br />
so criterion is not applicable;<br />
7. Vertical temperature gradient (VTG) calculated using sigma theta values according to INP procedures; and<br />
8. Bold and red text indicate an exceedance of relevant criterion.<br />
12384_R01.doc<br />
Page 13
Table 3.6 L A1(1 minute) dB GENERATED BY WCM AGAINST NOISE CRITERIA - QUARTER 4, <strong>2011</strong><br />
Location Date / Start Time Wind<br />
Speed<br />
(m/s)<br />
VTG 7<br />
( 0 C/100m)<br />
Criterion<br />
L A1(1 min)<br />
dB 1<br />
Criterion<br />
Applies? 3<br />
<strong>Wambo</strong><br />
L A1(1 min)<br />
dB 4,5<br />
Exceedance 6,8<br />
N01 2 15/12/11 02:01 0.7 4.1 NA N IA NA<br />
N03 2 15/12/11 01:49 0.6 4.1 NA N IA NA<br />
N16 14/12/11 22:27 1.5 -1.0 50 Y IA Nil<br />
N23 14/12/11 23:29 1.3 -1.0 50 Y
3.2.2 <strong>Wambo</strong> <strong>Coal</strong> Rail Spur Noise<br />
Noise levels generated by activity associated with the <strong>Wambo</strong> <strong>Coal</strong> Rail Spur are shown in<br />
Table 3.7 and Table 3.8, where comparison of measured L Aeq(15 minutes) and L A1(1 minute) levels<br />
for WCRS is made with relevant noise goals.<br />
Table 3.7 L Aeq(15 minute) dB GENERATED BY WCRS AGAINST NOISE CRITERIA - QUARTER 4, <strong>2011</strong><br />
Location Date / Start Time Wind<br />
Speed<br />
(m/s)<br />
VTG 7<br />
( 0 C/100m)<br />
Criterion<br />
L Aeq(15<br />
min) dB1<br />
Winter<br />
Criterion<br />
L Aeq(15<br />
min) dB1<br />
Not winter<br />
Criterion<br />
Applies? 3<br />
<strong>Wambo</strong><br />
L Aeq(15<br />
min) dB<br />
4,5<br />
Exceedance<br />
N01 22/12/11 15:01 4.1 -1.6 35 35 N IA NA<br />
N24 15/11/11 10:02 3.6 -1.9 35 35 N IA NA<br />
N01 15/12/11 02:01 0.7 4.1 41 35 N IA NA<br />
N24 15/12/11 02:38 0.3 4.1 41 41 N IA NA<br />
6,8<br />
Notes:<br />
1. Development consent criterion;<br />
2. Monitoring location is within Zone of Affectation. EIS or SEE modelled noise level presented;<br />
3. The noise emission limits identified in the above table apply under meteorological conditions of:<br />
- Wind speeds of up to 3 m/s at 10 metres above ground level; or<br />
- Temperature inversion conditions of up to 3ºC/100m, and wind speeds of up to 2 m/s at 10 metres above<br />
ground level.<br />
4. Estimated or measured L Aeq dB attributed to WCRS;<br />
5. NM denotes WCRS audible but not measurable, IA denotes inaudible;<br />
6. NA in exceedance column means atmospheric conditions outside conditions specified in development consent and<br />
so criterion is not applicable;<br />
7. Vertical temperature gradient (VTG) calculated using sigma theta values according to INP procedures; and<br />
8. Bold and red text indicate an exceedance of relevant criterion.<br />
12384_R01.doc<br />
Page 15
Table 3.8 L A1(1 minute) dB GENERATED BY WCRS AGAINST NOISE CRITERIA - QUARTER 4, <strong>2011</strong><br />
Location Date / Start Time Wind<br />
Speed<br />
(m/s)<br />
VTG 7<br />
( 0 C/100m)<br />
Criterion<br />
L A1(1 min)<br />
dB 1<br />
Criterion<br />
Applies? 1,3<br />
<strong>Wambo</strong><br />
L A1(1 min)<br />
dB 4,5<br />
Exceedance 6,8<br />
N24 15/12/11 02:38 0.3 4.1 50 N IA NA<br />
Notes:<br />
1. Development consent criterion;<br />
2. Monitoring location is within Zone of Affectation, no EIS L A1,1min levels available;<br />
3. The noise emission limits identified in the above table apply under meteorological conditions of:<br />
- Wind speeds of up to 3 m/s at 10 metres above ground level; or<br />
- Temperature inversion conditions of up to 3ºC/100m, and wind speeds of up to 2 m/s at 10 metres above<br />
ground level.<br />
4. Estimated or measured L A1,1min dB attributed to WCM;<br />
5. NM denotes WCM audible but not measurable, IA denotes inaudible;<br />
6. NA in exceedance column means atmospheric conditions outside conditions specified in development consent and<br />
so criterion is not applicable, or, there is no applicable criterion;<br />
7. Vertical temperature gradient (VTG) calculated using sigma theta values according to INP procedures; and<br />
8. Bold and red text indicate an exceedance of relevant criterion.<br />
12384_R01.doc<br />
Page 16
3.3 Attended Noise Monitoring – Quarter 1, <strong>2012</strong><br />
3.3.1 <strong>Wambo</strong> <strong>Coal</strong> Mine Noise<br />
Noise levels generated by activity at <strong>Wambo</strong> are shown in Table 3.9 and Table 3.10, where<br />
comparison of measured L Aeq(15 minutes) and L A1(1 minute) levels for WCM is made with<br />
relevant noise goals.<br />
Table 3.9 L Aeq(15 minute) dB GENERATED BY WCM AGAINST NOISE CRITERIA - QUARTER 1, <strong>2012</strong><br />
Location Date / Start Time Wind<br />
Speed<br />
(m/s)<br />
VTG 7<br />
( 0 C/100m)<br />
Criterion<br />
L Aeq(15<br />
min) dB1<br />
Winter<br />
Criterion<br />
L Aeq(15<br />
min) dB1<br />
Not winter<br />
Criterion<br />
Applies? 3<br />
<strong>Wambo</strong><br />
L Aeq(15<br />
min) dB<br />
4,5<br />
Exceedance<br />
N01 2 03/04/12 12:14 1.6 -1.9 35 35 Y NM Nil<br />
N03 2 21/03/12 10:10 0.3 -1.6 54 54 Y NM Nil<br />
N16 21/03/12 09:40 0.0 -1.0 35 35 Y IA Nil<br />
N23 21/03/12 07:50 0.2 -1.6 35 35 Y 26 Nil<br />
N24 03/04/12 13:10 0.7 -1.9 35 35 Y IA Nil<br />
N01 2 12/03/12 01:18 0.6 4.1 41 35 N NM NA<br />
N03 2 29/02/12 00:11 0.0 4.1 59 57 N 32 NA<br />
N16 29/02/12 00:40 0.0 4.1 40 40 N IA NA<br />
N23 29/02/12 01:07 0.0 4.1 38 38 N IA NA<br />
N24 12/03/12 02:09 0.9 4.1 41 41 N IA NA<br />
6,8<br />
Notes:<br />
1. Development consent criterion;<br />
2. Monitoring location is within Zone of Affectation. EIS or SEE modelled noise level presented;<br />
3. The noise emission limits identified in the above table apply under meteorological conditions of:<br />
- Wind speeds of up to 3 m/s at 10 metres above ground level; or<br />
- Temperature inversion conditions of up to 3ºC/100m, and wind speeds of up to 2 m/s at 10 metres above<br />
ground level.<br />
4. Estimated or measured L Aeq dB attributed to WCM;<br />
5. NM denotes WCM audible but not measurable, IA denotes inaudible;<br />
6. NA in exceedance column means atmospheric conditions outside conditions specified in development consent and<br />
so criterion is not applicable;<br />
7. Vertical temperature gradient (VTG) calculated using sigma theta values according to INP procedures; and<br />
8. Bold and red text indicate an exceedance of relevant criterion.<br />
12384_R01.doc<br />
Page 17
Table 3.10L A1(1 minute) dB GENERATED BY WCM AGAINST NOISE CRITERIA - QUARTER 1, <strong>2012</strong><br />
Location Date / Start Time Wind<br />
Speed<br />
(m/s)<br />
VTG 7<br />
( 0 C/100m)<br />
Criterion<br />
L A1(1 min)<br />
dB 1<br />
Criterion<br />
Applies? 3<br />
<strong>Wambo</strong><br />
L A1(1 min)<br />
dB 4,5<br />
Exceedance 6,8<br />
N01 2 12/03/12 01:18 0.6 4.1 NA N NM NA<br />
N03 2 29/02/12 00:11 0.0 4.1 NA N 45 NA<br />
N16 29/02/12 00:40 0.0 4.1 50 N IA NA<br />
N23 29/02/12 01:07 0.0 4.1 50 N 30 NA<br />
N24 12/03/12 02:09 0.9 4.1 50 N IA NA<br />
Notes:<br />
1. Development consent criterion;<br />
2. Monitoring location is within Zone of Affectation, no EIS L A1,1min levels available;<br />
3. The noise emission limits identified in the above table apply under meteorological conditions of:<br />
- Wind speeds of up to 3 m/s at 10 metres above ground level; or<br />
- Temperature inversion conditions of up to 3ºC/100m, and wind speeds of up to 2 m/s at 10 metres above<br />
ground level.<br />
4. Estimated or measured L A1,1min dB attributed to WCM;<br />
5. NM denotes WCM audible but not measurable, IA denotes inaudible “-” denotes no criterion;<br />
6. NA in exceedance column means atmospheric conditions outside conditions specified in development consent and<br />
so criterion is not applicable, or, there is no applicable criterion;<br />
7. Vertical temperature gradient (VTG) calculated using sigma theta values according to INP procedures; and<br />
8. Bold and red text indicate an exceedance of relevant criterion.<br />
12384_R01.doc<br />
Page 18
3.3.2 <strong>Wambo</strong> <strong>Coal</strong> Rail Spur Noise<br />
Noise levels generated by activity associated with the <strong>Wambo</strong> <strong>Coal</strong> Rail Spur are shown in<br />
Table 3.11 and Table 3.12, where comparison of measured L Aeq(15 minutes) and L A1(1 minute)<br />
levels for WCRS is made with relevant noise goals.<br />
Table 3.11 L Aeq(15 minute) dB GENERATED BY WCRS AGAINST NOISE CRITERIA - QUARTER 1, <strong>2012</strong><br />
Location Date / Start Time Wind<br />
Speed<br />
(m/s)<br />
VTG 7<br />
( 0 C/100m)<br />
Criterion<br />
L Aeq(15<br />
min) dB1<br />
Winter<br />
Criterion<br />
L Aeq(15<br />
min) dB1<br />
Not winter<br />
Criterion<br />
Applies? 3<br />
<strong>Wambo</strong><br />
L Aeq(15<br />
min) dB<br />
4,5<br />
Exceedance<br />
N01 03/04/12 12:14 1.6 -1.9 35 35 Y IA Nil<br />
N24 03/04/12 13:10 0.7 -1.9 35 35 Y IA Nil<br />
N01 12/03/12 01:18 0.6 4.1 41 35 N IA NA<br />
N24 12/03/12 02:09 0.9 4.1 41 41 N IA NA<br />
6,8<br />
Notes:<br />
1. Development consent criterion;<br />
2. Monitoring location is within Zone of Affectation. EIS or SEE modelled noise level presented;<br />
3. The noise emission limits identified in the above table apply under meteorological conditions of:<br />
- Wind speeds of up to 3 m/s at 10 metres above ground level; or<br />
- Temperature inversion conditions of up to 3ºC/100m, and wind speeds of up to 2 m/s at 10 metres above<br />
ground level.<br />
4. Estimated or measured L Aeq dB attributed to WCRS;<br />
5. NM denotes WCRS audible but not measurable, IA denotes inaudible;<br />
6. NA in exceedance column means atmospheric conditions outside conditions specified in development consent and<br />
so criterion is not applicable;<br />
7. Vertical temperature gradient (VTG) calculated using sigma theta values according to INP procedures; and<br />
8. Bold and red text indicate an exceedance of relevant criterion.<br />
12384_R01.doc<br />
Page 19
Table 3.12 L A1(1 minute) dB GENERATED BY WCRS AGAINST NOISE CRITERIA - QUARTER 1, <strong>2012</strong><br />
Location Date / Start Time Wind<br />
Speed<br />
(m/s)<br />
VTG 7<br />
( 0 C/100m)<br />
Criterion<br />
L A1(1 min)<br />
dB 1<br />
Criterion<br />
Applies? 1,3<br />
<strong>Wambo</strong><br />
L A1(1 min)<br />
dB 4,5<br />
Exceedance 6,8<br />
N24 12/03/12 02:09 0.9 4.1 50 N IA NA<br />
Notes:<br />
1. Development consent criterion;<br />
2. Monitoring location is within Zone of Affectation, no EIS L A1,1min levels available;<br />
3. The noise emission limits identified in the above table apply under meteorological conditions of:<br />
- Wind speeds of up to 3 m/s at 10 metres above ground level; or<br />
- Temperature inversion conditions of up to 3ºC/100m, and wind speeds of up to 2 m/s at 10 metres above<br />
ground level.<br />
4. Estimated or measured L A1,1min dB attributed to WCM;<br />
5. NM denotes WCM audible but not measurable, IA denotes inaudible;<br />
6. NA in exceedance column means atmospheric conditions outside conditions specified in development consent and<br />
so criterion is not applicable, or, there is no applicable criterion;<br />
7. Vertical temperature gradient (VTG) calculated using sigma theta values according to INP procedures; and<br />
8. Bold and red text indicate an exceedance of relevant criterion.<br />
12384_R01.doc<br />
Page 20
3.4 Attended Noise Monitoring – Quarter 2, <strong>2012</strong><br />
3.4.1 <strong>Wambo</strong> <strong>Coal</strong> Mine Noise<br />
Noise levels generated by activity at <strong>Wambo</strong> are shown in Table 3.13 and Table 3.14, where<br />
comparison of measured L Aeq(15 minutes) and L A1(1 minute) levels for WCM is made with<br />
relevant noise goals.<br />
Table 3.13 L Aeq(15 minute) dB GENERATED BY WCM AGAINST NOISE CRITERIA - QUARTER 2, <strong>2012</strong><br />
Location Date / Start Time Wind<br />
Speed<br />
(m/s)<br />
VTG 7<br />
( 0 C/100m)<br />
Criterion<br />
L Aeq(15<br />
min) dB1<br />
Winter<br />
Criterion<br />
L Aeq(15<br />
min) dB1<br />
Not winter<br />
Criterion<br />
Applies? 3<br />
<strong>Wambo</strong><br />
L Aeq(15<br />
min) dB<br />
4,5<br />
Exceedance<br />
N01 2 23/07/<strong>2012</strong> 13:13 3.6 -1.8 35 35 N IA NA<br />
N03 2 08/05/<strong>2012</strong> 13:34 3.2 -1.8 54 54 N NM NA<br />
N16 08/05/<strong>2012</strong> 14:04 3.2 -1.8 35 35 N IA NA<br />
N23 08/05/<strong>2012</strong> 13:50 3.4 -1.8 35 35 N IA NA<br />
N24 29/06/<strong>2012</strong> 13:54 2.6 -1.8 35 35 Y IA Nil<br />
N01 2 26/06/<strong>2012</strong> 22:13 0.7 -1.0 41 35 Y IA Nil<br />
N03 2 26/06/<strong>2012</strong> 22:48 1.7 -1.0 59 57 Y 46 Nil<br />
N16 26/06/<strong>2012</strong> 23:24 0.7 3.0 40 40 N 33 NA<br />
N23 26/06/<strong>2012</strong> 23:59 1.1 -1.0 38 38 Y 33 Nil<br />
N24 27/06/<strong>2012</strong> 01:01 1.6 3.0 41 41 N IA NA<br />
6,8<br />
Notes:<br />
1. Development consent criterion;<br />
2. Monitoring location is within Zone of Affectation. EIS or SEE modelled noise level presented;<br />
3. The noise emission limits identified in the above table apply under meteorological conditions of:<br />
- Wind speeds of up to 3 m/s at 10 metres above ground level; or<br />
- Temperature inversion conditions of up to 3ºC/100m, and wind speeds of up to 2 m/s at 10 metres above<br />
ground level.<br />
4. Estimated or measured L Aeq dB attributed to WCM;<br />
5. NM denotes WCM audible but not measurable, IA denotes inaudible;<br />
6. NA in exceedance column means atmospheric conditions outside conditions specified in development consent and<br />
so criterion is not applicable;<br />
7. Vertical temperature gradient (VTG) calculated using sigma theta values according to INP procedures; and<br />
8. Bold and red text indicate an exceedance of relevant criterion.<br />
12384_R01.doc<br />
Page 21
Table 3.14 L A1(1 minute) dB GENERATED BY WCM AGAINST NOISE CRITERIA - QUARTER 2, <strong>2012</strong><br />
Location Date / Start Time Wind<br />
Speed<br />
(m/s)<br />
VTG 7<br />
( 0 C/100m)<br />
Criterion<br />
L A1(1 min)<br />
dB 1<br />
Criterion<br />
Applies? 3<br />
<strong>Wambo</strong><br />
L A1(1 min)<br />
dB 4,5<br />
Exceedance 6,8<br />
N01 2 26/06/<strong>2012</strong> 22:13 0.7 -1.0 NA N IA NA<br />
N03 2 26/06/<strong>2012</strong> 22:48 1.7 -1.0 NA N 57 NA<br />
N16 26/06/<strong>2012</strong> 23:24 0.7 3.0 50 N 49 NA<br />
N23 26/06/<strong>2012</strong> 23:59 1.1 -1.0 50 Y 30 Nil<br />
N24 27/06/<strong>2012</strong> 01:01 1.6 3.0 50 N IA NA<br />
Notes:<br />
1. Development consent criterion;<br />
2. Monitoring location is within Zone of Affectation, no EIS L A1,1min levels available;<br />
3. The noise emission limits identified in the above table apply under meteorological conditions of:<br />
- Wind speeds of up to 3 m/s at 10 metres above ground level; or<br />
- Temperature inversion conditions of up to 3ºC/100m, and wind speeds of up to 2 m/s at 10 metres above<br />
ground level.<br />
4. Estimated or measured L A1,1min dB attributed to WCM;<br />
5. NM denotes WCM audible but not measurable, IA denotes inaudible “-” denotes no criterion;<br />
6. NA in exceedance column means atmospheric conditions outside conditions specified in development consent and<br />
so criterion is not applicable, or, there is no applicable criterion;<br />
7. Vertical temperature gradient (VTG) calculated using sigma theta values according to INP procedures; and<br />
8. Bold and red text indicate an exceedance of relevant criterion.<br />
12384_R01.doc<br />
Page 22
3.4.2 <strong>Wambo</strong> <strong>Coal</strong> Rail Spur Noise<br />
Noise levels generated by activity associated with the <strong>Wambo</strong> <strong>Coal</strong> Rail Spur are shown in<br />
Table 3.15 and Table 3.16, where comparison of measured L Aeq(15 minutes) and L A1(1 minute)<br />
levels for WCRS is made with relevant noise goals.<br />
Table 3.15 L Aeq(15 minute) dB GENERATED BY WCRS AGAINST NOISE CRITERIA - QUARTER 2, <strong>2012</strong><br />
Location Date / Start Time Wind<br />
Speed<br />
(m/s)<br />
VTG 7<br />
( 0 C/100m)<br />
Criterion<br />
L Aeq(15<br />
min) dB1<br />
Winter<br />
Criterion<br />
L Aeq(15<br />
min) dB1<br />
Not winter<br />
Criterion<br />
Applies? 3<br />
<strong>Wambo</strong><br />
L Aeq(15<br />
min) dB<br />
4,5<br />
Exceedance<br />
N01 23/07/<strong>2012</strong> 13:13 3.6 -1.8 35 35 N IA NA<br />
N24 29/06/<strong>2012</strong> 13:54 2.6 -1.8 35 35 Y IA Nil<br />
N01 26/06/<strong>2012</strong> 22:13 0.7 -1.0 41 35 Y IA Nil<br />
N24 27/06/<strong>2012</strong> 01:01 1.6 3.0 41 41 N IA NA<br />
6,8<br />
Notes:<br />
1. Development consent criterion;<br />
2. Monitoring location is within Zone of Affectation. EIS or SEE modelled noise level presented;<br />
3. The noise emission limits identified in the above table apply under meteorological conditions of:<br />
- Wind speeds of up to 3 m/s at 10 metres above ground level; or<br />
- Temperature inversion conditions of up to 3ºC/100m, and wind speeds of up to 2 m/s at 10 metres above<br />
ground level.<br />
4. Estimated or measured L Aeq dB attributed to WCRS;<br />
5. NM denotes WCRS audible but not measurable, IA denotes inaudible;<br />
6. NA in exceedance column means atmospheric conditions outside conditions specified in development consent and<br />
so criterion is not applicable;<br />
7. Vertical temperature gradient (VTG) calculated using sigma theta values according to INP procedures; and<br />
8. Bold and red text indicate an exceedance of relevant criterion.<br />
12384_R01.doc<br />
Page 23
Table 3.16 L A1(1 minute) dB GENERATED BY WCRS AGAINST NOISE CRITERIA - QUARTER 2, <strong>2012</strong><br />
Location Date / Start Time Wind<br />
Speed<br />
(m/s)<br />
VTG 7<br />
( 0 C/100m)<br />
Criterion<br />
L A1(1 min)<br />
Criterion<br />
Applies? 1,3<br />
<strong>Wambo</strong><br />
L A1(1 min)<br />
dB 4,5<br />
Exceedance 6,8<br />
dB 1<br />
N24 27/06/<strong>2012</strong> 01:01 1.6 3.0 50 N IA NA<br />
Notes:<br />
1. Development consent criterion;<br />
2. Monitoring location is within Zone of Affectation, no EIS L A1,1min levels available;<br />
3. The noise emission limits identified in the above table apply under meteorological conditions of:<br />
- Wind speeds of up to 3 m/s at 10 metres above ground level; or<br />
- Temperature inversion conditions of up to 3ºC/100m, and wind speeds of up to 2 m/s at 10 metres above<br />
ground level.<br />
4. Estimated or measured L A1,1min dB attributed to WCM;<br />
5. NM denotes WCM audible but not measurable, IA denotes inaudible;<br />
6. NA in exceedance column means atmospheric conditions outside conditions specified in development consent and<br />
so criterion is not applicable, or, there is no applicable criterion;<br />
7. Vertical temperature gradient (VTG) calculated using sigma theta values according to INP procedures; and<br />
8. Bold and red text indicate an exceedance of relevant criterion.<br />
12384_R01.doc<br />
Page 24
4 SUMMARY OF COMPLIANCE<br />
4.1 Summary<br />
Noise levels from WCM complied with the development consent criteria or modelled noise<br />
levels at all sites during the <strong>2011</strong>/<strong>2012</strong> attended monitoring.<br />
Noise levels from WCRS complied with the development consent criteria or modelled noise<br />
levels at all sites during the <strong>2011</strong>/<strong>2012</strong> attended monitoring. Monitoring was delayed several<br />
times during Quarter 2, <strong>2012</strong> due to train scheduling and the arrival of trains coinciding with<br />
acceptable meteorological conditions. As a result of trying to find a suitable time to<br />
undertake WCRS monitoring, the Quarter 2 <strong>2012</strong> survey was extended into July <strong>2012</strong>.<br />
It is noted that wind speeds and/or temperature inversion conditions were at levels greater<br />
than which development consent conditions would apply for WCM and WCRS activities in<br />
some instances. In all instances, the predicted EIS noise levels were met regardless.<br />
12384_R01.doc<br />
Page 25
A P P E N D I X<br />
A . D EVELOPMENT CONSENT<br />
A.1 <strong>Wambo</strong> <strong>Coal</strong> Mine Development Consent<br />
A.1.1 Relevant <strong>Wambo</strong> <strong>Coal</strong> Mine Development Consent Conditions<br />
The relevant sections of the Development Consent conditions are reproduced below:<br />
Acquisition Upon Request<br />
1. Upon receiving a written request for acquisition from the landowner of the land listed in<br />
Table 1, the Applicant shall acquire the land in accordance with the procedures in conditions 9<br />
– 11 of Schedule 5:<br />
2 – Lambkin 23A & B – Kannar<br />
13C – Skinner<br />
19A & B – Kelly<br />
31A, B, C & D – Fisher<br />
51 – Hawkes<br />
22 – Henderson 56 – Haynes<br />
Table 1: Land subject to acquisition upon request<br />
Note: For more information on the numbering and identification of properties used in this<br />
consent, see Attachment 1 of the EIS for the <strong>Wambo</strong> Development Project.<br />
NOISE<br />
Noise Impact Assessment Criteria<br />
6. The Applicant shall ensure that the noise generated by the development does not exceed the<br />
noise impact assessment criteria presented in Table 9.<br />
Day<br />
Evening/Night<br />
Night<br />
Land Number<br />
L Aeq(15 minutes)<br />
L Aeq(15 minutes)<br />
L A1(1 minute)<br />
35 41 50 94 – Curlewis<br />
35 40 50 3 - Birrell<br />
4B – Circosta<br />
15B – McGowen/Caslick<br />
16 – Cooper<br />
23C – Kannar<br />
25 – Fenwick<br />
28A & B – Garland<br />
33 – Thelander/O’Niell<br />
39 – Northcote<br />
40 – Muller<br />
254A - Algie<br />
12384_R01.doc<br />
Page A.1
Day<br />
Evening/Night<br />
Night<br />
Land Number<br />
L Aeq(15 minutes)<br />
L Aeq(15 minutes)<br />
L A1(1 minute)<br />
35 39 50 5 – Strachan<br />
6 – Merrick<br />
7 – Maizey<br />
37 – Lawry<br />
48 - Ponder<br />
35 38 50 1 – Brosi<br />
17 – Carter<br />
18 – Denney<br />
38 – Williams<br />
49 – Oliver<br />
63 – Abrocuff<br />
75 – Barnes<br />
91 – Bailey<br />
35 37 50 27 – Birralee<br />
43 – Carmody<br />
137 – Woodruff<br />
163 – Roger/Williams<br />
246 - Bailey<br />
35 36 50 13B – Skinner<br />
178 – Smith<br />
188 – Fuller<br />
262A, B & C – Moses<br />
35 35 50 All other residential or sensitive<br />
receptors, excluding the receptors<br />
listed in condition 1 above<br />
Table 9: Noise Impact Assessment Criteria dB(A)<br />
Notes:<br />
a) Noise from the development is to be measured at the most affected point or within the<br />
residential boundary, or at the most affected point within 30 metres of a dwelling<br />
(rural situations) where the dwelling is more than 30 metres from the boundary, to<br />
determine compliance with the L Aeq(15 minute) noise limits in the above table.<br />
Where it can be demonstrated that direct measurement of noise from the<br />
development is impractical, the DEC may accept alternative means of determining<br />
compliance (see Chapter 11 of the NSW Industrial Noise Policy). The modification<br />
factors in Section 4 of the NSW Industrial Noise Policy shall also be applied to the<br />
measured noise levels where applicable.<br />
b) Noise from the development is to be measured at 1 metre from the dwelling façade to<br />
determine compliance with the L A1(1 minute) noise limits in the above table.<br />
c) The noise emission limits identified in the above table apply under meteorological<br />
conditions of:<br />
• wind speeds of up to 3 m/s at 10 metres above ground level; or<br />
• temperature inversion conditions of up to 3ºC/100m, and wind speeds of up<br />
to 2 m/s at 10 metres above ground level.<br />
12384_R01.doc<br />
Page A.2
Land Acquisition Criteria<br />
7. If the noise generated by the development exceeds the criteria in Table 10, the Applicant<br />
shall, upon receiving a written request for acquisition from the landowner, acquire the land in<br />
accordance with the procedures in conditions 9 – 11 of Schedule 5.<br />
Day/Evening/Night<br />
Property<br />
L Aeq(15 minutes)<br />
43 94 – Curlewis<br />
Table 10: Land Acquisition Criteria dB(A)<br />
23C – Kannar<br />
254A - Algie<br />
40 All other residential or sensitive receptor, excluding the<br />
receptors listed in condition 1 above<br />
Note: Noise generated by the development is to be measured in accordance with the notes<br />
presented below Table 9 above.<br />
Monitoring<br />
8. The Applicant shall conduct real-time monitoring of the noise generated by the<br />
development at a minimum of four properties to the south and north-west of the site, in<br />
general accordance with the NSW Industrial Noise Policy and AS1055-1997: Acoustics –<br />
Description and Measurement of Environmental Noise.<br />
9. Before carrying out any development, the Applicant shall prepare a Noise Monitoring<br />
Program to the satisfaction of the Director-General, which includes a noise monitoring<br />
protocol for evaluating compliance with the criteria in Tables 9 & 10.<br />
12384_R01.doc<br />
Page A.3
A.2 <strong>Wambo</strong> Rail Spur Development Consent<br />
A.2.1 Relevant WCRS Development Consent Conditions<br />
The relevant noise criteria, as detailed in the Construction/Operational Noise Management Plan<br />
and Monitoring Programme (Resource Strategies, 2005), are reproduced below:<br />
DA 177-8-2004<br />
Schedule<br />
4<br />
Condition<br />
4 Construction Hours<br />
The Applicant shall ensure that all construction work<br />
is carried out from 7 am to 6 pm Monday to Saturday<br />
(inclusive) and 8 am to 6 pm Sundays and public<br />
holidays.<br />
5 Operating Hours<br />
The Applicant shall:<br />
(a) take all practicable measures to minimise train<br />
movements at the development on Friday evening<br />
(6pm-9pm) and Sunday morning (9am-12am) to the<br />
satisfaction of the Director-General.<br />
(b) report on the implementation and effectiveness of<br />
these measures to<br />
the satisfaction of the Director-General.<br />
6 The Applicant shall monitor the noise generated by<br />
the development at least four times a year at a<br />
minimum of 3 representative locations near the site,<br />
in general accordance with the NSW Industrial<br />
Noise Policy and AS1055-1997: Acoustics –<br />
Description and Measurement of<br />
Environmental.<br />
7 Before carrying out any development, the Applicant<br />
shall prepare a Noise Monitoring Program for the<br />
development to the satisfaction of the Director-<br />
General, which includes a noise monitoring protocol<br />
for evaluating compliance with the criteria in Table 2.<br />
2.1 CONSTRUCTION/OPERATION NOISE CRITERIA DA 177-8-2004<br />
The noise impact assessment criteria for construction and operation of the <strong>Wambo</strong> <strong>Coal</strong><br />
Terminal and Rail Spur (DA 177-8-2004) are presented in Table 1 for residential and<br />
sensitive receptors in the vicinity of the development.<br />
12384_R01.doc<br />
Page A.4
Table 1: Noise Impact Assessment Criteria<br />
Day<br />
LAeq (15<br />
minute) (dBA)<br />
Evening/Night<br />
LAeq (15<br />
minute) (dBA)<br />
Night<br />
LA(1 minute)<br />
(dBA)<br />
Land Number<br />
(Figure 2)<br />
35 41 50 94 Curlewis<br />
35 40 50 3 Birrell<br />
4B Circosta<br />
15 McGowen/Caslick<br />
16 Cooper<br />
25 Fenwick<br />
28 Garland<br />
33 Thelander/O’Neill<br />
39 Northcote<br />
40 Muller<br />
254 Algie<br />
35 39 50 5 Strachan<br />
6 Merrick<br />
7 Maizey<br />
37 Lawry<br />
48 Ponder<br />
35 38 50 1 Brosi<br />
17 Carter<br />
18 Denney<br />
30 Williams<br />
49 Oliver<br />
63 Abrocuff<br />
75 Barnes<br />
91 Bailey<br />
35 37 50 27 Birralee<br />
43 Carmody<br />
137 Woodruff<br />
163 Rodger/Williams<br />
246 Bailey<br />
35 36 50 13B Skinner<br />
178 Smith<br />
188 Fuller<br />
262 Moses<br />
35 35 50 All other residential or sensitive<br />
receptors, excluding the receptors<br />
listed in condition 1 (see DA 177-<br />
8-2004).<br />
Notes:<br />
a) For more information on the numbering and identification of properties used in this<br />
consent, see Attachment 1A and Attachment 1B of the SEE for the Alterations to the<br />
<strong>Wambo</strong> Development Project – Rail and Train Loading Infrastructure.<br />
b) Noise from the development is to be measured at the most affected point or within the<br />
residential boundary, or at the most affected point within 30 metres of a dwelling (rural<br />
situations) where the dwelling is more than 30 metres from the boundary, to determine<br />
12384_R01.doc<br />
Page A.5
compliance with the LAeq(15 minute) noise limits in the above table. Where it can be<br />
demonstrated that direct measurement of noise from the development is impractical, the<br />
DEC may accept alternative means of determining compliance (see Chapter 11 of the NSW<br />
Industrial Noise Policy). The modification factors in Section 4 of the NSW Industrial Noise<br />
Policy shall also be applied to the measured noise levels where applicable.<br />
c) Noise from the development is to be measured at 1 metre from the dwelling façade to<br />
determine compliance with the LA1(1 minute) noise limits in the above table.<br />
d) The noise emission limits identified in the above table apply under meteorological<br />
conditions of:<br />
• Wind speeds of up to 3 m/s at 10 metres above ground level; or<br />
• Temperature inversion conditions of up to 3ºC/100m, and wind speeds of up to 2 m/s at 10<br />
metres above ground level.<br />
2.2 RAIL PASS-BY CRITERIA<br />
The rail pass-by noise criteria for the <strong>Wambo</strong> Rail Development are as follows (DA235/97):<br />
the applicant shall ensure noise emissions from the operation of the JPRL when<br />
measured at any<br />
residence along the railway line corridor shall not exceed the following EPA<br />
criteria:<br />
(a) planning level of LAeq 24hr 55 dB(A); and<br />
(b) maximum pass-by level of LAmax 85 dB(A).<br />
It should be noted that the above criteria are consistent with the Department of Environment<br />
and Conservation’s (DEC, formerly the Environment Protection Authority [EPA])<br />
Environmental Noise Control Manual (EPA, 1994).<br />
12384_R01.doc<br />
Page A.6
27 July <strong>2012</strong><br />
<strong>Wambo</strong> <strong>Coal</strong> Pty Ltd<br />
GPO Box 5101<br />
Brisbane QLD 4001<br />
Attention:<br />
David Rankins<br />
Subject:<br />
<strong>2012</strong> <strong>AEMR</strong> Noise Summary<br />
Dear David,<br />
Please find below a summary of the continuous noise monitoring assessment for <strong>Wambo</strong> <strong>Coal</strong> Mine<br />
(WCM) for the period 1 July, <strong>2011</strong>, to 30 June, <strong>2012</strong>.<br />
July to September, <strong>2011</strong><br />
Assessment of noise impacts for the July to September, <strong>2011</strong>, monitoring period indicates that WCM<br />
complied with the noise level criteria prescribed in the <strong>Wambo</strong> <strong>Coal</strong> NMP. Review of the L A1,1minute<br />
results indicates that animal noise, road noise and meteorological influences dominate the LA1 noise<br />
environment adjacent to the WCM. Mining noise was encountered during audio review at the N21<br />
(WA) and N16 (Muller) site locations. However, this was considered to represent only the background<br />
contribution to measured noise levels rather than the transient or peak events associated with potential<br />
for sleep disturbance. It should be noted that the N16 (Muller) monitoring location is subject to<br />
cumulative mining noise impacts, and as the source of mine noise contributions could not be<br />
confirmed, exceedences could not be attributed to the WCM.<br />
Where mining noise impacts were observed, uncertainty exists in the validity of the monitoring data.<br />
While EPL 529 excludes data influenced by strong temperature inversions (lapse rates of 3 C/100m<br />
and wind speeds up to 2 m/s), the methods available to assess atmospheric stability (sigma-theta<br />
method) provide conflicting evaluation as to the validity of the noise monitoring data. Pasquill Gifford<br />
(P-G) ‘F’ class stability was commonly observed during the monitoring period, denoting temperature<br />
lapse rates of between +1.5 and +4.0 deg/C per 100m. It stands to reason that portions of the dataset<br />
monitored under ‘F’ class stability conditions would be subject to lapse rates in excess of 3.0 deg/C per<br />
100m; however, in the absence of available methods or data, the frequency of this scenario could not<br />
be determined. Consequently, all noise monitoring results observed under ‘F’ class conditions were<br />
retained in the analysis.<br />
October to December, <strong>2011</strong><br />
Assessment of continuous noise monitoring data indicated that the WCM complied with the<br />
L AeqLF,15minute noise level criteria for more than 88% of time at the N21 (WA) monitoring location and<br />
98% of the time at the N20 (Thelander) monitoring location. Following a conservative detailed analysis<br />
of the N16 (Muller) monitoring data, it was found that L AeqLF,15minute noise levels attributable to WCM<br />
operations exceeded the 40dB(A) criteria approximately 22% of the monitoring period. The measured<br />
exceedence rate attributable to all environmental noise sources at this location was approximately<br />
48%.
Mine noise was audible at both the N21 (WA) and N16 (Muller) sites; however, it was found to<br />
comprise the background noise contribution for a majority of these events. Meteorological influences<br />
were also observed to contribute to measured noise levels at these locations, and the passage of<br />
vehicles on the Golden Highway was the dominant noise impact at the N16 (Muller) monitoring<br />
location.<br />
January to March, <strong>2012</strong><br />
Measured noise levels were found to comply with the L Aeq,15minute criteria more than 90% of the time at<br />
the N21 (WA) monitoring location and 94% of the time at the N20 (Thelander) monitoring location.<br />
These results are consistent with those obtained in the previous (October to December (<strong>2011</strong>)) period.<br />
Analysis of monitoring results, including WCM meteorological station data, demonstrates that lower<br />
rates of night time temperature inversions were observed as compared to the winter months. This<br />
indicates that the WCM site may be less affected by enhanced noise propagation associated with<br />
temperature inversions in the summer months, resulting in a higher rate of compliance with the<br />
performance criteria.<br />
Results of L Aeq,15minute audio review indicate that mining noise impacts were present during the January<br />
to March (<strong>2012</strong>) period; however, environmental sources (including insects, livestock, road noise and<br />
meteorological impacts) were found to dominate the night time noise environment.<br />
April to June, <strong>2012</strong><br />
Assessment of continuous noise monitoring data indicated that the WCM complied with the<br />
L AeqLF,15minute noise level criteria for more than 83% of time at the N21 (WA) monitoring location and<br />
92% of the time at the N20 (Thelander) monitoring location. Moderate (F class) and strong (G class)<br />
temperature inversions (conditions under which enhanced noise propagation may occur) were found to<br />
be present for 36% of the night time monitoring period from April to June. These inversion events<br />
typically generate meteorological conditions under which enhanced noise propagation may occur.<br />
Comparison of the measured L AeqLF,15minute noise level result distributions indicates that noise levels<br />
above the relevant criteria may be observed with higher frequency during the winter months.<br />
Audio review suggested that mine noise was present at both the N21 (WA) and N16 (Muller) sites;<br />
however, environmental noise sources (including road noise, insects and meteorological impacts)<br />
were found to dominate the night time noise environment. The passage of vehicles on the Golden<br />
Highway was the dominant noise impact at the N16 (Muller) monitoring location. Mining noise was not<br />
observed to contribute to measured Sleep Disturbance (L A1,1minute ) noise levels above the criteria at any<br />
monitoring location during this period.<br />
Please do not hesitate to contact me if you require any additional information.<br />
Yours faithfully,<br />
Clayton Sparke<br />
Senior Environmental Scientist<br />
Advitech Pty Limited<br />
Job No.: J0110410-04<br />
Folder No.: F11891<br />
Our Ref: 11891 WCM <strong>AEMR</strong> (Noise) <strong>2012</strong> Rev0.doc<br />
WCM <strong>2011</strong> <strong>AEMR</strong> (Noise)<br />
<strong>Wambo</strong> <strong>Coal</strong> Pty Ltd<br />
11891 WCM <strong>AEMR</strong> (Noise) <strong>2012</strong> Rev0 (2)<br />
27 July <strong>2012</strong><br />
2
Appendix 2G<br />
Flora & Fauna<br />
Monitoring Results
Our Ref: PR109410:RS/TL<br />
16 December <strong>2011</strong><br />
WAMBO COAL PTY LTD<br />
PMB 1<br />
SINGLETON NSW 2330<br />
ATTENTION: TROY FAVELL<br />
Dear Troy,<br />
RE:<br />
ACACIA PENDULA POPULATION POST-UNDERMINING HEALTH<br />
INSPECTION, WAMBO MINE<br />
On 5 December <strong>2011</strong> an RPS ecologist undertook an inspection of the Acacia pendula<br />
(Weeping Myall) population adjacent to the eastern corner of RWEP C area at <strong>Wambo</strong><br />
<strong>Coal</strong> Mine. These investigations were conducted as a due diligence precaution to<br />
compare the condition of the population with regards to the health, recruitment, extent<br />
and habitat attributes subsequent to undermining by LW-4. The following letter contains<br />
the methodologies and results of the December <strong>2011</strong> field investigation.<br />
It should be noted that an initial inspection pre-undermining was undertaken in June<br />
<strong>2011</strong> to determine Acacia pendula health prior to mining occurring.<br />
This assessment aims to provide information on the health of the Acacia pendula<br />
(Weeping Myall) population after undermining by LW-4. Acacia pendula is listed within<br />
Part 2 of Schedule 1 of the Threatened Species Conservation Act 1995 (TSC Act 1995)<br />
as an Endangered Population in the Hunter Catchment.<br />
Methodology<br />
An inspection of the Acacia pendula population and habitat on the site was undertaken<br />
as follows:<br />
An Ecologist from RPS (Mr Robert Sansom, BSc (Hons)) was accompanied to<br />
the A. pendula population by Mr David Rankin from <strong>Peabody</strong> <strong>Wambo</strong> Mine.<br />
The A. pendula population was inspected and notes taken with regard to age<br />
cohorts, recruitment levels, health, infestations, senescence, as well as soil and<br />
drainage attributes.<br />
Searches were undertaken within the A. pendula habitat areas for any changes<br />
that may be attributable to subsidence.
Results<br />
The onsite population of A. pendula occupies approximately 2.5 hectares adjacent to the<br />
southern bank of North <strong>Wambo</strong> Creek. This population has been divided into two areas<br />
that have been fenced to prohibit the ingress of livestock. A (fenced) vehicular track<br />
bisects the two areas.<br />
Age Cohorts<br />
Several age cohorts were evident. These ranged from large specimens (up to 9 metres<br />
tall) to seedlings less than 0.1 metre tall with several age classes in between. At the time<br />
of the inspection the number of larger specimens were equalled or surpassed by the<br />
number of seedlings (0.1 to 1 metre) and juveniles (1 to 3 metres).<br />
Recruitment<br />
Successful recruitment is evident by the presence of numerous healthy seedlings and<br />
juvenile specimens. These new recruits were located within some small areas and are<br />
probably the progeny of a few older specimens that have had an opportunity to set seed.<br />
Health<br />
Many of the larger specimens of A. pendula have substantial small deadwood in the<br />
lower two thirds of the foliage and branches, commonly with only the uppermost third of<br />
the crown holding live foliage. It was noted during the initial (baseline) inspection in June<br />
<strong>2011</strong> that many of the larger specimens were host to a large number of parasitic<br />
mistletoe, in particular Amyema pendulum. A number of the larger specimens with<br />
multiple mistletoe infestations show very poor health or are dead.<br />
A number of A. pendula specimens were also found to be host to gall forming insects or<br />
borers as evidenced by the presence of smooth woody nodules or clumps of particulate<br />
wood on the branches of many of the A. pendula specimens.<br />
Infestations<br />
As stated above, many of the A pendula specimens within the local population have<br />
infestations of Gall forming insects and borers. Acacias in general are often known to be<br />
hosts to galls and borers, however high numbers of these can detrimentally affect the<br />
health of the plant by re-directing nutrients and weakening the physical structure of the<br />
plant.<br />
Amyema pendulum (Mistletoe) is a parasitic plant that is tolerated in small numbers,<br />
however, many of the Acacia pendula specimens that were found to be in poor health or<br />
dead were also found to be host to multiple (up to 7 or 8) mistletoes.<br />
Senescence<br />
A large number of the larger specimens (approximately 12 to 15%) have recently died<br />
and are now standing deadwood. This is a part of a natural process for a stand of<br />
2
Acacias such as these. Acacias are known as a “pioneer” species that germinate quickly<br />
within disturbed areas and have a relatively short lifespan, which can improve conditions<br />
(such as shade, wind protection, moister habitat) for other species to establish.<br />
However, it is considered that many of the observed dead specimens of Acacia pendula<br />
have succumbed to infestations of large numbers of Mistletoe.<br />
Soil<br />
The soil supporting the population of A. pendula is fine and clayey with a well<br />
established crust that incorporates mosses and lichens. The initial inspection in June<br />
<strong>2011</strong> found that the crust was broken or absent in some small areas (usually less than<br />
2m 2 ). These crustless areas are possibly due to past land management practises (such<br />
as slashing) or disturbances from livestock or tree removal. No cracks larger than 5mm<br />
wide and 20cm long were observed in the soil surface during the June <strong>2011</strong> (baseline)<br />
inspection.<br />
During the post-undermining inspection (December <strong>2011</strong>) the soil surface was relatively<br />
unchanged except for a small area (approximately 5m 2 ) which contained approximately<br />
4 interconnected surface cracks that were a maximum of 1 cm wide and 150 cm long. It<br />
is considered that these cracks may have been created by subsidence. As these cracks<br />
are relatively small and located in a fine-grained crusted, clayey topsoil it is considered<br />
that these cracks will most likely be self healing.<br />
Drainage<br />
The initial (June <strong>2011</strong>) inspection took place on a day with significant rainfall. The<br />
drainage throughout the A. pendula stand is via overland flow in the form of small<br />
rivulets and pools. The slope of the area is approximately 1% with a northerly aspect.<br />
The post undermining inspection in December <strong>2011</strong> was undertaken a few days after a<br />
significant rainfall event. The drainage within the Acacia pendula area has not<br />
significantly changed. There was evidence of the same types of small overland rivulets<br />
and pools. No areas of retained surface water were observed during the post<br />
undermining inspection. It is considered that the overland drainage within the Acacia<br />
pendula conservation area is unchanged.<br />
Conclusion<br />
The stand of Acacia pendula (Weeping Myall) within the RWEA area is generally healthy<br />
with respect to Age Classes, Recruitment, Health, Infestations and Senescence. The<br />
stand shows the typical attributes of a dynamic population which is currently selfpropagating<br />
and is likely to continue to do so provided no stochastic events impact upon<br />
the area. There are large numbers of the parasitic mistletoe Amyema pendula present<br />
on many of the Weeping Myall trees. In high numbers these mistletoes have a<br />
detrimental effect on the Weeping Myall and have most likely caused the death of some<br />
specimens.<br />
3
We trust this report proves useful for your purposes. If you have any further enquiries<br />
regarding this or other matters, please do not hesitate to contact the writer or Mr Toby<br />
Lambert (Senior Ecologist - Senior Project Manager).<br />
Yours faithfully<br />
RPS AUSTRALIA EAST PTY LTD<br />
Robert Sansom<br />
Botanist / Ecologist<br />
BSc(Hons)<br />
4
<strong>2011</strong> Annual Ecological<br />
Monitoring Report<br />
<strong>Wambo</strong> <strong>Coal</strong> Mine<br />
Prepared by:<br />
RPS<br />
241 Denison Street,<br />
Broadmeadow NSW 2292<br />
PO Box 428, HAMILTON NSW 2303<br />
T: +61 2 4961 6500<br />
F: +61 2 4961 6794<br />
E: newcastle@rpsgroup.com.au<br />
W: rpsgroup.com.au<br />
Prepared for:<br />
<strong>Wambo</strong> <strong>Coal</strong> Pty Ltd<br />
PMB 1<br />
SINGLETON NSW 2330<br />
Report No: 109410<br />
Version/Date: Final / May <strong>2012</strong><br />
rpsgroup.com.au
Document Status<br />
Review Format<br />
Issue<br />
Version Purpose of Document Orig Review<br />
Approval<br />
Date Review<br />
Date<br />
Draft V1 For Client Review A. Smith T. Lambert VD 12.01.12<br />
Final Final for Submission A. Smith P. Hillier 02.05.12 T. Lambert 03.05.12<br />
Disclaimers<br />
This document is and shall remain the property of RPS Australia East Pty Ltd. The<br />
document may only be used for the purposes for which it was commissioned and in<br />
accordance with the Terms of Engagement for the commission. Unauthorised copying or<br />
use of this document in any form whatsoever is prohibited.<br />
rpsgroup.com.au
Executive Summary<br />
RPS Australia East (RPS) was commissioned by <strong>Wambo</strong> <strong>Coal</strong> Pty Ltd (<strong>Wambo</strong>) to<br />
undertake the annual ecological monitoring program for their Remnant Woodland<br />
Enhancement Program (RWEP). The RWEP was established to offset land disturbed by<br />
open cut coal mining. HLA-Envirosciences Pty Ltd initially established the annual flora and<br />
fauna monitoring program in 2006 (HLA 2007a, b). RPS has undertaken the monitoring<br />
program in 2007 (RPS Harper Somers O’Sullivan 2007), 2008 (RPS Harper Somers<br />
O’Sullivan 2009), 2009 (RPS 2010), 2010 (RPS <strong>2011</strong>) and <strong>2011</strong> (this report).<br />
Flora monitoring identified 266 flora species across 34 flora quadrats. Based on these<br />
observations, the current management practices within the RWEP areas of <strong>Wambo</strong> <strong>Coal</strong><br />
Mine is appropriate for the conservation of flora species. Variation evident in the results<br />
from the six years of monitoring is most likely related to natural variation in species<br />
distribution, natural variation in species abundance and variation inherent in the sampling<br />
design, and not due to current management practices. There was no evidence to suggest<br />
that current management practices or mining activity was having any effect on the flora<br />
species within the RWEP areas of <strong>Wambo</strong> <strong>Coal</strong> Mine.<br />
While no Swift Parrots (Lathamus discolor) or Regent Honeyeaters (Anthochaera phrygia)<br />
were identified during targeted winter bird surveys, annual surveys for these species<br />
should continue into the future, particularly during years of heavy eucalypt blossom when<br />
either or both species may occur on <strong>Wambo</strong> <strong>Coal</strong> land.<br />
Diurnal bird monitoring identified a total of 126 bird species across 26 survey sites and<br />
opportunistically, including nine threatened species. Current management practises within<br />
the RWEP areas of <strong>Wambo</strong> <strong>Coal</strong> Mine appear to be appropriate for the conservation of<br />
bird species. Variation evident in the results across the years of monitoring is most likely<br />
related to natural variation in species diversity, natural variation in species abundance and<br />
variation inherent in the sampling design, and not to current management practises.<br />
One Powerful Owl (Ninox strenua), which is listed as Vulnerable under the NSW<br />
Threatened Species Conservation Act 1995 (TSC Act), responded during call playback<br />
surveys. Owl species targeted by call playback also included Masked Owl (Tyto<br />
novaehollandiae), Barking Owl (Ninox connivens) and Sooty Owl (Tyto tenebricosa). Due<br />
to the large home range area of the target owl species, which each have a home range in<br />
the vicinity of or greater than 1000 hectares and the relatively few (four) call playback<br />
sessions undertaken each year it is not unexpected that threatened owls species are<br />
rarely detected.<br />
Spotlighting surveys identified the Common Brushtail Possum (Trichosurus vulpecula) as<br />
the most common arboreal mammal species in RWEP areas of the <strong>Wambo</strong> <strong>Coal</strong> Mine.<br />
Across five years of annual monitoring only four arboreal mammal species have been<br />
identified. The Common Brushtail Possum was identified each year and the Sugar Glider<br />
(Petaurus breviceps) was recorded for the first time in <strong>2011</strong>. The threatened Yellow-<br />
<strong>2011</strong> Annual Ecological Monitoring Report, Final Report, May <strong>2012</strong> Page i
ellied Glider (P. australis) and Squirrel Glider (P. norfolcensis) were recorded for the first<br />
time in 2010. Both species are listed as Vulnerable under the TSC Act.<br />
Amphibian species were recorded at their highest abundance to date with 13 species<br />
being identified. Three species of reptile were recorded which is the lowest abundance<br />
from all survey years.<br />
Ten microbat species were positively identified with four being listed as Vulnerable under<br />
the TSC Act, namely the Large-eared Pied Bat (Chalinolobus dwyeri), Little Bentwing Bat<br />
(Miniopterus australis), Eastern Bentwing-bat (Miniopterus schreibersii oceanensis) and<br />
Yellow-Bellied Sheathtail-bat (Saccolarimus flaviventris).<br />
There is no evidence to suggest that current management practices or mining activities<br />
are having any negative impact on fauna species within the RWEP areas.<br />
Riparian monitoring identified Stoney Creek as being in good condition, and North <strong>Wambo</strong><br />
and South <strong>Wambo</strong> Creeks in moderate condition. Current bank erosion problem areas are<br />
a result of historic land management practises, however, in the absence of current<br />
management will continue to degrade. Subsidence from mining practices was detected<br />
along North <strong>Wambo</strong> Creek during riparian assessments. Recommendations have been<br />
made to address problem erosion areas and to undertake other management actions that<br />
would lead to increased condition scores for all three creeks.<br />
<strong>2011</strong> Annual Ecological Monitoring Report, Final Report, May <strong>2012</strong> Page ii
Contents<br />
EXECUTIVE SUMMARY<br />
I<br />
1 INTRODUCTION 1<br />
1.1 Site Location 1<br />
1.2 Qualifications and Licensing 3<br />
1.2.1 Qualifications 3<br />
1.2.2 Licensing 3<br />
1.2.3 Certification 3<br />
2 FLORA 4<br />
2.1 Methods 4<br />
2.1.1 Limitations of Flora Survey 5<br />
2.2 Results 7<br />
2.2.1 Overall Floristic Species Diversity 7<br />
2.2.2 Species Diversity within Quadrats 7<br />
2.2.3 Species Diversity within Vegetation Communities 10<br />
2.3 Discussion 12<br />
2.3.1 Species Diversity within Quadrats 12<br />
2.3.2 Introduced Species Percentage Composition 12<br />
2.3.3 Introduced Species Abundance 13<br />
2.4 Recommendations 14<br />
2.5 Conclusion 14<br />
3 FAUNA 15<br />
3.1 Methods 15<br />
3.1.1 Swift Parrot and Regent Honeyeater Winter Surveys 15<br />
3.1.2 Bird Surveys 15<br />
3.1.3 Owl and Nocturnal Fauna Call Playback 17<br />
3.1.4 Spotlighting 17<br />
3.1.5 Herpetofauna Surveys 17<br />
3.1.6 Bat Surveys 18<br />
3.2 Results 18<br />
3.2.1 Swift Parrot and Regent Honeyeater Winter Surveys 18<br />
3.2.2 Bird Surveys 18<br />
3.2.3 Owl Call Playback 22<br />
3.2.4 Spotlighting 23<br />
3.2.5 Herpetological Surveys 23<br />
3.2.6 Bat Surveys 23<br />
3.3 Discussion 24<br />
3.3.1 Swift Parrot and Regent Honeyeater Winter Surveys 24<br />
3.3.2 Bird Surveys 24<br />
3.3.3 Owl Call Playback 26<br />
<strong>2011</strong> Annual Ecological Monitoring Report, Final Report, May <strong>2012</strong> Page iii
3.3.4 Spotlighting 26<br />
3.3.5 Herpetological Surveys 26<br />
3.3.6 Bat Surveys 27<br />
3.4 Conclusion 28<br />
4 RIPARIAN MONITORING 29<br />
4.1 Methods 29<br />
4.2 Results 30<br />
4.2.1 South <strong>Wambo</strong> Creek 33<br />
4.2.2 North <strong>Wambo</strong> Creek 33<br />
4.2.3 Stoney Creek 34<br />
4.2.4 Overall Riparian Condition 35<br />
4.2.5 Annual Riparian Condition Photographs 35<br />
4.3 Discussion 35<br />
4.4 Recommendations 36<br />
4.5 Conclusion 36<br />
5 REFERENCES 37<br />
Figures<br />
Figure 1-1: <strong>Wambo</strong> <strong>Coal</strong> Mine Site Locality .................................................................................................. 2<br />
Figure 2-1: Locations of Flora Monitoring Plots ............................................................................................. 6<br />
Figure 2-2: Native and Exotic Diversity for Each Monitoring Plot .................................................................. 9<br />
Figure 2-3: Percentage of Native Diversity of Plots (2006 - <strong>2011</strong>) .............................................................. 10<br />
Figure 2-4: Average Native Species Count and Introduced Species Percentage per Vegetation<br />
Community ................................................................................................................................... 11<br />
Figure 3-1: Fauna Survey Effort .................................................................................................................. 16<br />
Figure 3-2: Number of Bird Species Recorded per Site. ............................................................................. 21<br />
Figure 3-3: Number of Sites per Species (all other species were recorded at less than four sites). .......... 22<br />
Figure 3-4: Total Number of Each Species Recorded Across All Sites (all other species were<br />
recorded with less than six individuals across all sites). .............................................................. 22<br />
Figure 4-1: Riparian Transect Condition Scores ......................................................................................... 31<br />
Figure 4-2: Riparian Section Condition Scores ........................................................................................... 32<br />
<strong>2011</strong> Annual Ecological Monitoring Report, Final Report, May <strong>2012</strong> Page iv
Tables<br />
Table 2-1:Total Number of Flora Species Recorded Each Year ................................................................... 7<br />
Table 2-2: Flora Diversity within Plots .......................................................................................................... 8<br />
Table 3-1: Number of reptile and frog species recorded over the four years of monitoring ........................ 26<br />
Table 5-1: North <strong>Wambo</strong> Creek Riparian Section Condition Scores .......................................................... 97<br />
Table 5-2: Stoney Creek Riparian Condition Scores ................................................................................... 98<br />
Table 5-3: South <strong>Wambo</strong> Creek Riparian Condition Scores ....................................................................... 99<br />
Table 5-4: <strong>2011</strong> Stoney Creek Riparian Condition Photographs Compared with 2010 Photographs ......101<br />
Table 5-5: <strong>2011</strong> South <strong>Wambo</strong> Creek Riparian Condition Photographs compared to 2010 photos.........104<br />
Table 5-6: <strong>2011</strong> North <strong>Wambo</strong> Riparian Condition Photographs compared with 2010 Photographs .......107<br />
Appendices<br />
APPENDIX A<br />
Flora Diversity Results<br />
APPENDIX B<br />
Flora Quadrat Data<br />
APPENDIX C<br />
Introduced Flora Species<br />
APPENDIX D<br />
Fauna Species List<br />
APPENDIX E<br />
Riparian Condition Assessment Field Proforma<br />
APPENDIX F<br />
Riparian Condition Scores<br />
APPENDIX G<br />
Riparian Condition Photographs<br />
APPENDIX H<br />
Staff Qualifications<br />
<strong>2011</strong> Annual Ecological Monitoring Report, Final Report, May <strong>2012</strong> Page v
1 Introduction<br />
RPS Australia East (RPS) was commissioned by <strong>Wambo</strong> <strong>Coal</strong> Pty Ltd (<strong>Wambo</strong>) to<br />
undertake the annual ecological monitoring program for their Remnant Woodland<br />
Enhancement Program (RWEP). The RWEP was established to offset land disturbed by<br />
open cut coal mining. HLA-Envirosciences Pty Ltd initially established the annual flora and<br />
fauna monitoring program in 2006. RPS has undertaken the monitoring program in 2007<br />
(RPS Harper Somers O’Sullivan 2007), 2008 (RPS Harper Somers O’Sullivan 2009),<br />
2009 (RPS 2010), 2010 (RPS <strong>2011</strong>) and <strong>2011</strong> (this report).<br />
The annual monitoring program comprises:<br />
• Flora Monitoring;<br />
• Fauna Monitoring, comprising;<br />
» Winter bird surveys targeting Swift Parrot and Regent Honeyeater;<br />
» Diurnal bird surveys;<br />
» Owl call playback surveys;<br />
» Spotlighting surveys;<br />
» Micro-bat surveys; and<br />
» Opportunistic recording of all guilds of fauna during surveys.<br />
• Riparian Condition Monitoring.<br />
1.1 Site Location<br />
<strong>Wambo</strong> is located within the Singleton Local Government Area and is approximately 15<br />
km west of the township of Singleton. The open cut workings are located in the north of<br />
the site with a mixture of pasture-covered grazing land and native vegetation comprising<br />
the remainder of the site. Figure 1-1 shows the regional location of the site.<br />
<strong>2011</strong> Annual Ecological Monitoring Report, Final Report, May <strong>2012</strong> Page 1
1.2 Qualifications and Licensing<br />
1.2.1 Qualifications<br />
The principal authors of this report were Lauren Vanderwyk, Andrew Smith and Paul<br />
Hillier, with input from Toby Lambert, Chris McLean and Rob Sansom. The document was<br />
reviewed by Toby Lambert. The academic qualifications and professional experience of all<br />
RPS ecologists involved in the project are documented in Appendix I.<br />
1.2.2 Licensing<br />
Research was conducted under the following licences:<br />
• NSW National Parks and Wildlife Service Scientific Investigation Licence S100536<br />
(Valid 31 December <strong>2012</strong>);<br />
• Animal Research Authority (Trim File No: 01/1142) issued by NSW Agriculture (Valid<br />
12 March <strong>2012</strong>);<br />
• Animal Care and Ethics Committee Certificate of Approval (Trim File No: 01/1142)<br />
issued by NSW Agriculture (Valid 12 March 2013); and<br />
• Certificate of Accreditation of a Corporation as an Animal Research Establishment<br />
(Trim File No: 01/1522 & Ref No: AW2001/014) issued by NSW Agriculture (Valid 22<br />
May 2014).<br />
1.2.3 Certification<br />
As the principal author, I, Toby Lambert make the following certification:<br />
The results presented in the report are, in the opinion of the principal author and certifier,<br />
a true and accurate account of the species recorded, or considered likely to occur within<br />
the site.<br />
Principal Author and Certifier:<br />
Toby Lambert<br />
Senior Ecologist – Senior Project Manager<br />
RPS Australia East<br />
May <strong>2012</strong><br />
<strong>2011</strong> Annual Ecological Monitoring Report, Final Report, May <strong>2012</strong> Page 3
2 Flora<br />
2.1 Methods<br />
In <strong>2011</strong>, a total of 34 permanent flora quadrats (20m x 20m) were surveyed (see Figure<br />
2-1), comprising 32 quadrats sampled in 2010 plus two new relocated quadrats in <strong>2011</strong><br />
due to a creek diversion. The vegetation surveys were conducted between late October to<br />
early December <strong>2011</strong>.<br />
The relocated quadrats were previously called V6-A1c and V6-A3, and were located<br />
north-east of and within RWEP Area C respectively. At the request of Lachlan Crawford of<br />
<strong>Wambo</strong> <strong>Coal</strong> Pty Ltd ,the quadrats were relocated to a new part Area C (V6-A1c) and<br />
within the Analogue Area east of Area C (V6-A3). These two quadrats occur within<br />
Narrow-leaf Ironbark / Grey Box / Bulloak / Honeymyrtle Forest. The replacement of these<br />
sites has meant that data can only be analysed for the <strong>2011</strong> survey for these sites.<br />
During the 2010 flora surveys, five flora plots (V1-A1, V1-A2, V1-B1, V1-B2 & V1-B3)<br />
were moved from within the channel of Wollombi Brook to the banks of the Brook as per<br />
the recommendation in the 2009 report. All of these quadrats occur within River Oak /<br />
Rough-barked Apple Forest. This has meant that data can only be analysed for the 2010<br />
and <strong>2011</strong> surveys for these sites. In addition, a new quadrat was added to RWEP Area D<br />
in 2010 bringing the total number of permanent flora quadrats in Area D to two. The new<br />
quadrat in Area D was added at the request of <strong>Wambo</strong> <strong>Coal</strong> Pty Ltd.<br />
Changes to quadrat numbers and locations were undertaken with due consideration given<br />
to obtaining improved sampling, both within individual RWEP areas, as well as within each<br />
mapped vegetation community occurring within the survey areas. As such, analysis of the<br />
data has been applied to monitoring both within quadrats and within vegetation community<br />
types.<br />
The following parameters were collected in accordance with Table 8 of the <strong>Wambo</strong> <strong>Coal</strong><br />
Flora and Fauna Management Plan:<br />
• Flora species diversity;<br />
» Total number of flora species;<br />
» Number and percent of native flora species; and<br />
» Number and percent of introduced flora species.<br />
• Flora species abundance (modified Braun-Blanquet 1-6 (Braun-Blanquet 1982)).<br />
Specimens of plant species which could not be identified within the field were collected<br />
and identified according to nomenclature in Harden (1992, 1993, 2000 & 2002).<br />
Figure 2-1 shows the location of the <strong>2011</strong> flora plots.<br />
<strong>2011</strong> Annual Ecological Monitoring Report, Final Report, May <strong>2012</strong> Page 4
2.1.1 Limitations of Flora Survey<br />
Not all flora species occurring throughout the year are likely to be detected during a<br />
survey undertaken once a year. For example cryptic orchids flower within certain seasons<br />
and cannot be detected at other times of the year. Also, vegetation structure and cover<br />
abundance was estimated visually and as a result there are likely varied levels of observer<br />
bias. This observer bias has been limited where possible by using guides and charts for<br />
measurements, where suitable.<br />
<strong>2011</strong> Annual Ecological Monitoring Report, Final Report, May <strong>2012</strong> Page 5
WARNING<br />
No part of this plan should be used<br />
for critical design dimensions.<br />
Confirmation of critical positions<br />
should be obtained from RPS Newcastle.<br />
Legend<br />
<strong>Wambo</strong> <strong>Coal</strong> Land<br />
Ownership Boundary<br />
V10-A2<br />
RWEP Areas<br />
Flora Monitoring Plot<br />
V10-A1<br />
V10-B3<br />
D<br />
V11-B1<br />
V11-B2<br />
V6-B1c<br />
V6-B4<br />
V5-B4<br />
E<br />
V6-A1c<br />
V6-B2c<br />
V1-B3<br />
V2-B2<br />
V1-B1<br />
V2-B1<br />
V5-B2<br />
V5-B1<br />
V13-B1<br />
B<br />
V9-B2<br />
V14-B1<br />
V14-A1<br />
V14-B2<br />
V6-A3<br />
V1-B2<br />
V1-A1<br />
V3-B1<br />
V5-B3<br />
A<br />
V6-B1<br />
V6-B2<br />
V6-B3<br />
V10-B1<br />
V9-B1<br />
V1-A2<br />
V2-A1<br />
0 1<br />
SCALE: 1:30,000 AT A3 SIZE<br />
2km<br />
V9-A1<br />
TITLE: FIGURE 2-1 LOCATION OF FLORA<br />
LOCATION: WAMBO COAL MINE<br />
DATUM: (GDA 94)<br />
MONITORING PLOTS<br />
PROJECTION: MGA ZONE 56<br />
DATE:<br />
PURPOSE:<br />
11/01/<strong>2012</strong><br />
REPORT FIGURE<br />
LAYOUT REF: J:\JOBS\<strong>Wambo</strong>\All Jobs\109410 <strong>Wambo</strong> AMR <strong>2011</strong>\10- Drafting\Workspaces<br />
VERSION (PLAN BY): A A3 (AS-NW)<br />
Copyright<br />
"This document and the information shown shall remain the property of RPS Australia East Pty Ltd.<br />
The document may only be used for the purpose for which it was supplied and in accordance with<br />
the terms of engagement for the commission. Unauthorised use of this document in any way is prohibited."<br />
CLIENT:<br />
JOB REF:<br />
WAMBO COAL PTY LTD<br />
109410<br />
RPS AUSTRALIA EAST PTY LTD (ABN 44 140 292 762)<br />
241 DENISON STREET BROADMEADOW PO BOX 428 HAMILTON NSW 2303<br />
T: 02 4940 4200 F: 02 4961 6794 www.rpsgroup.com.au<br />
creativepeople<br />
making a difference
2.2 Results<br />
2.2.1 Overall Floristic Species Diversity<br />
A total of 266 flora species were recorded in <strong>2011</strong>. Table 2-1 shows little overall change in<br />
the total number of species recorded within the RWEP areas and adjacent analogue sites<br />
since 2006.<br />
Table 2-1:Total Number of Flora Species Recorded Each Year<br />
Year No. of Plots<br />
Total No. of<br />
Species<br />
No. Native No. Exotics<br />
<strong>2011</strong> 34 266 210 56 (21%)<br />
2010 34 275 222 53 (19%)<br />
2009 33 249 167 82 (33%)<br />
2008 33 261 208 53 (20%)<br />
2007 31 292 233 59 (20%)<br />
2006 34 260 220 40 (15%)<br />
Appendix A shows a summary table of the results of the <strong>2011</strong> flora survey, listing the<br />
total number of species and the percentage of introduced species recorded in each<br />
quadrat. Appendix B lists the flora species recorded within each flora monitoring plot and<br />
the related Braun-Blanquet rating.<br />
The <strong>2011</strong> flora survey results are shown above as part of a comparison of data from the<br />
2006, 2007, 2008, 2009 and 2010 surveys (Table 2-1). Following is a summary of the<br />
changes in species diversity and introduced species composition across the quadrats and<br />
vegetation communities.<br />
2.2.2 Species Diversity within Quadrats<br />
Table 2-2 lists the vegetation communities sampled, total number of plants, and<br />
percentage of natives and exotic species within each flora monitoring plot. Figure 2-3<br />
illustrates the native and exotic diversity that was recorded within each flora monitoring<br />
plot.<br />
A total of 56 introduced species were recorded in <strong>2011</strong>. Fireweed (Senecio<br />
madagascariensis*) was the most frequently recorded introduced species in <strong>2011</strong> and<br />
2010, occurring in 25 and 27 quadrats respectively. Prickly Pear (Opuntia stricta var.<br />
stricta*) were recorded at 22 and 13 sites respectively in <strong>2011</strong>. Prickly Pear was observed<br />
at moderate densities in grassland areas in the western portion of RWEP area A. All<br />
individuals were less than half a metre in height and were scattered (rather than occurring<br />
in dense stands).<br />
Figure 2-2 shows that plots V1 and V2 (located along Wollombi Brook within the River<br />
Oak/Rough-barked Apple Forest and River Red Gum Woodland vegetation communities,<br />
respectively) are the two sample areas which have the highest weed infestation. This is<br />
<strong>2011</strong> Annual Ecological Monitoring Report, Final Report, May <strong>2012</strong> Page 7
similar to the results obtained in previous years. An investigation of the Braun Blanquet<br />
cover scores (Appendix B) shows that the V1 and V2 monitoring plots also have the<br />
highest overall densities of exotic species. Ground cover species, namely Heliotropium<br />
amplexicaule (Blue Heliotrope), Galenia pubescens (Galenia) and Senecio<br />
madagascariensis (Fireweed) account for the greatest densities within these areas.<br />
Table 2-2: Flora Diversity within Plots<br />
Vegetation Community<br />
Sampled<br />
River Oak / Rough-barked<br />
Apple Forest<br />
River Red Gum Woodland<br />
Yellow Box / Blakely’s Red<br />
Gum / Rough-barked Apple<br />
Forest<br />
Coast Banksia / Roughbarked<br />
Apple / Blakely’s<br />
Red Gum Forest<br />
(Warkworth Sands<br />
Woodland EEC)<br />
Narrow-leaf Ironbark / Grey<br />
Box / Bulloak / Honeymyrtle<br />
Forest<br />
Spotted Gum / Narrow-leaf<br />
Ironbark / Bulloak /<br />
Paperbark Forest<br />
Slaty Gum / Narrow-leaf<br />
Ironbark / Bulloak /<br />
Paperbark Forest<br />
Grey Gum / Narrow-leaf<br />
Ironbark / Bulloak /<br />
Honeymyrtle Forest<br />
White Mahogany / Roughbarked<br />
Apple Forest<br />
Brush Wilga/Native Olive<br />
Shrubland<br />
Flora<br />
Monitoring<br />
Plot<br />
Total<br />
No.<br />
Spp<br />
No.<br />
Native<br />
spp.<br />
%<br />
Natives<br />
No of<br />
exotic<br />
spp.<br />
%<br />
Exotics<br />
V1-A1 29 11 38 18 62<br />
V1-A2 27 11 41 16 59<br />
V1-B1 27 18 67 9 33<br />
V1-B2 23 15 65 8 35<br />
V1-B3 29 13 45 16 55<br />
V2-A1 23 7 30 16 70<br />
V2-B1 30 10 33 20 67<br />
V2-B2 32 16 50 16 50<br />
V3-B1 32 22 69 10 31<br />
V5-B1 35 26 74 9 26<br />
V5-B2 36 27 75 9 25<br />
V5-B3 31 28 90 3 10<br />
V5-B4 28 25 89 3 11<br />
V6-A1c 31 30 97 1 3<br />
V6-A3 21 21 100 0 0<br />
V6-B1 29 24 83 5 17<br />
V6-B1c 30 28 93 2 7<br />
V6-B2 36 32 89 4 11<br />
V6-B2c 36 33 92 3 8<br />
V6-B3 40 34 85 6 15<br />
V6-B4 11 8 73 3 27<br />
V9-A1 31 29 94 2 6<br />
V9-B1 40 37 93 3 8<br />
V9-B2 37 34 92 3 8<br />
V10-A1 36 31 86 5 14<br />
V10-A2 42 35 83 7 17<br />
V10-B2 33 32 97 1 3<br />
V10-B3 29 27 93 2 7<br />
V11-B1 30 28 93 2 7<br />
V11-B2 36 33 92 3 8<br />
V13-B1 59 50 85 9 15<br />
V14-A1 36 26 72 10 28<br />
V14-B1 37 31 84 6 16<br />
V14-B2 44 40 91 4 9<br />
<strong>2011</strong> Annual Ecological Monitoring Report, Final Report, May <strong>2012</strong> Page 8
Figure 2-2: Native and Exotic Diversity for Each Monitoring Plot<br />
Figure 2-3 below illustrates changes in the percentages of native species diversity within<br />
the monitoring plots. Since 2006, most plots have shown an overall small decrease in<br />
native species percentage, with the greatest decrease being within V2-B1 going from 50%<br />
native species diversity in 2006 to 33% in <strong>2011</strong>. Whilst V14-A1 also had a notable<br />
decrease across the survey seasons (16% decrease), the percentage of native species<br />
diversity remains high at 84%. One monitoring plot, namely V5-B4, has had an equally<br />
large increase in the percentage of native species diversity, with an increase of 14% since<br />
monitoring began in 2008.<br />
Only one site has been recorded as consistently reducing in native species diversity<br />
percentage from season to season, namely V10-A1, however the actual percentage of<br />
native species diversity remains high at 86% in <strong>2011</strong>. All other monitoring plots show<br />
mostly small variations in species diversity.<br />
<strong>2011</strong> Annual Ecological Monitoring Report, Final Report, May <strong>2012</strong> Page 9
Figure 2-3: Percentage of Native Diversity of Plots (2006 - <strong>2011</strong>)<br />
2.2.3 Species Diversity within Vegetation Communities<br />
Figure 2-4 shows the average native species count and introduced species percentage for each<br />
vegetation community sampled for flora monitoring. All communities are seen to peak in native<br />
species diversity in 2007 and begin to fall thereafter. The White Mahogany / Rough-barked Apple<br />
Forest community begins to recover once more in 2009 and has remained relatively constant<br />
during the 2010 and <strong>2011</strong> survey. All remaining communities begin to either recover or stabilise<br />
between the 2010 and <strong>2011</strong> surveys. All communities have shown either an average increase in<br />
native species diversity or remained relatively constant, in comparison to results collected in 2006.<br />
The percentage of introduced species diversity has also remained constant and with little<br />
fluctuation for most communities.<br />
<strong>2011</strong> Annual Ecological Monitoring Report, Final Report, May <strong>2012</strong> Page 10
Figure 2-4: Average Native Species Count and Introduced Species Percentage per<br />
Vegetation Community<br />
<strong>2011</strong> Annual Ecological Monitoring Report, Final Report, May <strong>2012</strong> Page 11
2.3 Discussion<br />
2.3.1 Species Diversity within Quadrats<br />
Variation in the number of species recorded in <strong>2011</strong> between quadrats is a factor of:<br />
• Within vegetation communities:<br />
» Differences in quadrat conditions, such as minor differences in aspect, slope, and<br />
soil type;<br />
» Inherent differences in the species composition of a single vegetation community<br />
throughout the community; and<br />
» Variation in the amount of rainfall at each quadrat.<br />
• Between vegetation communities:<br />
» The different species composition of different vegetation communities, generally<br />
as a result of different site characteristics, such as slope, aspect, soil type, etc.<br />
Variation in the number of species recorded across the five years of sampling is likely a<br />
factor of:<br />
• Seasonal conditions:<br />
» The increase in the number of species at all quadrats in 2007 is likely a result of a<br />
good season;<br />
» The general decrease in the number of species at quadrats in 2008 is likely a<br />
result of a poor season; and<br />
» Moderate to minor fluctuations in the number of species recorded in quadrats in<br />
2009, 2010 and <strong>2011</strong> are likely a result of moderate seasonal conditions.<br />
• The timing of surveys:<br />
» Cryptic species such as orchids have only a short flowering and detectable<br />
period. Surveys completed in different months or even weeks of the year are<br />
likely to detect a different range of cryptic species;<br />
» There is no evidence to suggest that the number of flora species at any quadrat<br />
are being affected by current mining practices; and<br />
» Current land management practices within the RWEP areas appear to be<br />
appropriate for the conservation of flora species diversity.<br />
2.3.2 Introduced Species Percentage Composition<br />
Variation in the introduced species percentage composition is likely due to:<br />
• Vegetation community/quadrat landform location. The three vegetation communities<br />
that recorded more than 25 percent of introduced species are all located within<br />
riparian locations where propagules (seeds and vegetative material) from weed<br />
species are easily distributed by moving water;<br />
• Variation in seasonal conditions from year to year;<br />
<strong>2011</strong> Annual Ecological Monitoring Report, Final Report, May <strong>2012</strong> Page 12
• Natural fluctuations in the abundance and distribution of introduced species from year<br />
to year; and<br />
• The timing of surveys from year to year. Annual introduced species may be detected<br />
in one month but not another.<br />
There is no evidence to suggest that the fluctuations recorded in the percentage<br />
composition of introduced species are due to any factor other than a combination of those<br />
listed above.<br />
2.3.3 Introduced Species Abundance<br />
Variation in the number of introduced species recorded in quadrats in <strong>2011</strong> is likely a<br />
result of the same factors affecting the number of all flora species, as discussed above in<br />
Section 2.3.1.<br />
• Fireweed:<br />
» The distribution of Fireweed has increased from six quadrats in 2006 to a peak of<br />
27 quadrats in 2010, but decreased to 24 quadrats in <strong>2011</strong>;<br />
» The increase in abundance is likely due to a favourable season in 2007 when the<br />
species was recorded in 21 quadrats followed by the natural spread of the<br />
species by airborne seed dispersal;<br />
» At most sites Fireweed was recorded at a low density; and<br />
» Due to the low density of Fireweed at sites where it occurs, the small size of the<br />
plant and the absence of a species specific control measure (i.e. a species<br />
specific herbicide), no control actions are currently recommended for this<br />
species.<br />
• Prickly Pear:<br />
» The distribution of Prickly Pear has remained relatively constant from 2006 to<br />
<strong>2011</strong> being recorded in 17 and 21 quadrats respectively;<br />
» At most quadrats Prickly Pear was recorded at moderately low densities;<br />
» The variation in the abundance of this weed species is likely due to natural<br />
variation in this species abundance, most likely as a result of the species<br />
interaction with the Cactoblastis moth (Cactoblastis cactorum); and<br />
» Although Prickly Pear occurs at moderate density in parts of RWEP area A<br />
(outside quadrats), no control measures are recommended as it is anticipated<br />
that the Cactoblastis moth will respond to the increased density through<br />
increased fecundity. It is expected that the density of Prickly Pear will decrease<br />
over the next two years.<br />
• Scarlet Pimpernel:<br />
» Like Fireweed, the Scarlet Pimpernel increased its distribution between 2007 and<br />
2010 from 9 to 15 quadrats respectively, however in <strong>2011</strong> a slight decrease in its<br />
distribution occurred, being recorded at 12 quadrats;<br />
» At most sites Scarlet Pimpernel was recorded at a low density; and<br />
<strong>2011</strong> Annual Ecological Monitoring Report, Final Report, May <strong>2012</strong> Page 13
» Due to the low density of Scarlet Pimpernel at sites where it occurs, the small<br />
size of the plant and the absence of a species specific control measure (i.e. a<br />
species specific herbicide), no control actions are currently recommended for this<br />
species.<br />
• Spot herbicide spraying for African Boxthorn (Lycium ferocissimum) was undertaken<br />
during 2010 along North <strong>Wambo</strong> Creek and had resulted in the death of almost all<br />
African Boxthorn plants. Assessments during <strong>2011</strong> have recorded that some African<br />
Boxthorn plants have started regrowing in some sections that were sprayed in 2010.<br />
It is recommended that secondary methods of bush regeneration be undertaken to<br />
ensure this species does not re-establish and increase its distribution across the<br />
study area.<br />
2.4 Recommendations<br />
The following recommendations are suggested to maintain the quality and diversity of<br />
flora species within the RWEP areas of <strong>Wambo</strong> <strong>Coal</strong>:<br />
• Continue the exclusion of domestic stock from RWEP areas;<br />
• Continue the annual flora monitoring program in future years; and<br />
• Undertake weed control measures wherever weed species occur at high densities<br />
(not all areas were covered during the annual monitoring program).<br />
2.5 Conclusion<br />
Current management practises within the RWEP areas of <strong>Wambo</strong> <strong>Coal</strong> Mine appear to be<br />
appropriate for the conservation of flora species. The recorded variation among the<br />
occurrence of flora species (both native and exotic) from the six years of monitoring can<br />
be possibly related to natural variation in species distribution, natural variation in species<br />
abundance and variation inherent in the sampling design, and not to current management<br />
practices. There was no evidence to suggest that current management practices or mining<br />
subsidence was having any effect on the flora species within the RWEP areas of <strong>Wambo</strong><br />
<strong>Coal</strong> Mine.<br />
<strong>2011</strong> Annual Ecological Monitoring Report, Final Report, May <strong>2012</strong> Page 14
3 Fauna<br />
Fauna surveys consisted of five targeted survey types including:<br />
• Swift Parrot (Lathamus discolor) and Regent Honeyeater (Anthochaera phrygia)<br />
winter surveys;<br />
• Diurnal bird surveys;<br />
• Nocturnal owl call playback surveys;<br />
• Spotlighting surveys; and<br />
• Anabat ‘micro-bat’ surveys.<br />
In addition to the above targeted surveys, opportunistic reptile and frog surveys were also<br />
undertaken during all other survey activities.<br />
3.1 Methods<br />
Figure 3-1 shows the locations of the fauna survey points undertaken during <strong>2011</strong>.<br />
3.1.1 Swift Parrot and Regent Honeyeater Winter Surveys<br />
Three targeted surveys for the Swift Parrot and Regent Honeyeater were undertaken on<br />
28 July, 12 August and 1 September <strong>2011</strong>. Each survey comprised a single day of survey<br />
conducted by two ecologists for a total of 16 person hours of survey per day. Survey<br />
methodology comprised:<br />
• Searches for congregations of members of the Psittacidae (Parrots, Lorikeets and<br />
Rosellas) and Meliphagidae (Honeyeaters) families to indicate the presence of feed<br />
trees;<br />
• Searches for lorikeets and observation of their movements as an indication of<br />
localised occurrences of blossoming events; and<br />
• Opportunistic searches for threatened avian species.<br />
Surveys were undertaken throughout Remnant Woodland Enhancement Program<br />
(RWEP) areas (A–C). All existing vehicle tracks were surveyed during searches for the<br />
above possible indicators of suitable habitat areas for both target species. Opportunistic<br />
surveys were also undertaken while travelling throughout other areas of <strong>Wambo</strong> <strong>Coal</strong><br />
Mine. During the surveys, special attention was given to identifying areas containing<br />
flowering eucalypt trees.<br />
3.1.2 Bird Surveys<br />
A total of 26 bird surveys were undertaken in <strong>2011</strong>. 24 sites comprise all of those<br />
surveyed in 2010, whilst two sites (13 and 15) were moved due to works associated with<br />
the North <strong>Wambo</strong> Creek Diversion (NWCD) (see Figure 3-1 for survey site locations).<br />
<strong>2011</strong> Annual Ecological Monitoring Report, Final Report, May <strong>2012</strong> Page 15
WARNING<br />
No part of this plan should be used<br />
for critical design dimensions.<br />
Confirmation of critical positions<br />
should be obtained from RPS Newcastle.<br />
Legend<br />
Owl Call Playback<br />
22/11/<strong>2011</strong><br />
30/11/<strong>2011</strong><br />
01/12/<strong>2011</strong><br />
06/12/<strong>2011</strong><br />
07/12/<strong>2011</strong><br />
Anabat Detector<br />
D<br />
E<br />
E<br />
29/11/<strong>2011</strong><br />
30/11/<strong>2011</strong><br />
01/12/<strong>2011</strong><br />
06/12/<strong>2011</strong><br />
07/12/<strong>2011</strong><br />
C<br />
Spotlighting Routes<br />
22/11/<strong>2011</strong><br />
29/11/<strong>2011</strong><br />
30/11/<strong>2011</strong><br />
01/12/<strong>2011</strong><br />
06/12/<strong>2011</strong><br />
RWEP Areas<br />
Bird Survey Plots<br />
B<br />
A<br />
TITLE: FIGURE 3-1 FAUNA SURVEY EFFORT LOCATION: WAMBO COAL MINE<br />
DATUM: (GDA 94)<br />
PROJECTION:<br />
MGA ZONE 56<br />
DATE:<br />
PURPOSE:<br />
13/01/<strong>2012</strong><br />
REPORT FIGURE<br />
LAYOUT REF: J:\JOBS\<strong>Wambo</strong>\All Jobs\109410 <strong>Wambo</strong> AMR <strong>2011</strong>\10- Drafting\Workspaces<br />
VERSION (PLAN BY):<br />
A A3 (AS-NW)<br />
Copyright<br />
"Thi s d o cu m e n t a n d th e i nformation shown shall remain the property of RPS Australia East Pty Ltd.<br />
The d o cument may only be used for the purpose for which it was supplied and in accordance with<br />
th e te rm s o f engagement for the commission. Unauthorised use of this document in any way is prohibited."<br />
CLIENT:<br />
JOB REF:<br />
WAMBO COAL PTY LTD<br />
109410<br />
RPS AUSTRALIA EAST PTY LTD (ABN 44 140 292 762)<br />
241 DENISON STREET BROADMEADOW PO BOX 428 HAMILTON NSW 2303<br />
T: 02 4940 4200 F: 02 4961 6794 www.rpsgroup.com.au<br />
creativepeople<br />
making a difference
Each site was a one hectare (100 m x 100 m) area that was surveyed for a 20 minute<br />
period. At each site the number of birds heard and observed directly was recorded.<br />
Species recorded outside the one hectare area were also recorded (although numbers<br />
could rarely be determined from calls alone).<br />
3.1.3 Owl and Nocturnal Fauna Call Playback<br />
Owl call playback surveys were conducted on five nights at four different locations (Figure<br />
3-1) enabling calls to be broadcast over those portions of the three RWEP areas<br />
considered most likely to represent potential habitat for forest owl and nocturnal fauna<br />
species. Forest owl surveys were also conducted opportunistically during spotlighting<br />
surveys. The nocturnal calls of the following species were played using a megaphone<br />
(10W rated output):<br />
• Barking Owl (Ninox connivens);<br />
• Powerful Owl (Ninox strenua);<br />
• Masked Owl (Tyto novaehollandiae);<br />
• Sooty Owl (Tyto tenebricosa);<br />
• Squirrel Glider (Petaurus norfolcensis); and<br />
• Yellow-bellied Glider (Petaurus australis).<br />
This method of survey is considered the most appropriate for the detection of large forest<br />
owls (see Kavanagh and Peak 1993, Kavanagh et al 1995) with playback being<br />
considered audible for up to one kilometre on a still night (Kavanagh and Peak 1993).<br />
After listening for five minutes, the calls of the above species were broadcast for<br />
approximately four minutes each and were separated by a listening period of two minutes.<br />
At the end of each two minute listening period a brief spotlighting scan was made of<br />
surrounding trees for owls that had approached silently. At the completion of the final<br />
species call, a listening period of five minutes was undertaken and followed by a final<br />
spotlight scan of the surrounding trees.<br />
3.1.4 Spotlighting<br />
Spotlighting was undertaken across five nights by two people for a period of three hours<br />
each night (six person hours per night). One and a half hours was undertaken on foot<br />
(predominately along vehicle tracks) and the remaining 1.5 hours was undertaken from a<br />
slow moving 4WD. See Figure 3-1 for the location of spotlighting transects.<br />
Where water bodies were encountered during spotlighting or where frog species could be<br />
heard calling in close proximity, frog searches were undertaken around the margins of<br />
suitable water bodies.<br />
3.1.5 Herpetofauna Surveys<br />
Reptile species were recorded opportunistically during all ecological surveys throughout<br />
the day and frog surveys were undertaken when water bodies were encountered during<br />
spotlighting.<br />
<strong>2011</strong> Annual Ecological Monitoring Report, Final Report, May <strong>2012</strong> Page 17
3.1.6 Bat Surveys<br />
Nocturnal bat surveys were conducted at eight sites over five nights within RWEP areas.<br />
Anabat detectors were used to record the echolocation calls of micro-bats. For each of the<br />
five nights, two Anabat detectors were set for the entire night. Figure 3-1 shows the<br />
location of the Anabat detectors. All calls were analyzed by Anna McConville who has<br />
expertise in bat call recognition.<br />
3.2 Results<br />
A total of 162 fauna species were recorded during <strong>2011</strong> surveys, including 20 mammal,<br />
126 bird, three reptile and 13 amphibian species. Appendix D lists all fauna species<br />
recorded during survey activities.<br />
3.2.1 Swift Parrot and Regent Honeyeater Winter Surveys<br />
No Swift Parrots or Regent Honeyeaters were identified during winter bird surveys.<br />
Limited eucalypt blossom was recorded on Narrow-leafed Ironbark (Eucalyptus<br />
crebra)and Forest Red Gum (Eucalyptus tereticornis)..<br />
An additional nine threatened bird species were identified during the winter surveys.<br />
Appendix D lists all the bird species recorded during each survey and Figure 3-2 shows<br />
the location of threatened species recorded during all surveys in <strong>2011</strong>.<br />
3.2.2 Bird Surveys<br />
A total of 126 bird species were recorded during opportunistic surveys and from the 26<br />
bird survey locations. Seventy eight species were recorded from the 26 survey locations<br />
alone. The <strong>2011</strong> bird survey results are shown below as part of a comparison of data from<br />
the 2008, 2009 and 2010 surveys. Unfortunately most of the 2007 bird survey data was<br />
not collated in a format that allowed comparison with the more recent surveys.<br />
Total Species Diversity<br />
A comparison of the total number of bird species recorded across the four years identified<br />
the following:<br />
• The total number of species recorded has ranged between 66 and 86 species with 86<br />
being recorded in 2007, 66 in 2008, 84 in 2009, 69 in 2010 and 78 in <strong>2011</strong>.<br />
Species Diversity within Sites<br />
A comparison of the total number of bird species recorded at each site from 2008 to <strong>2011</strong><br />
(see Figure 3-2) identified the following:<br />
• <strong>2011</strong> produced the median score (n=78) in species diversity across all surveys years<br />
to date;<br />
• The range of species recorded across all sites is between four and 28 species with an<br />
average of 7 species per site;<br />
• Six sites have shown the lowest, or equal lowest bird species richness since 2008;<br />
• Nine sites have shown the highest or equal highest bird species richness since 2008;<br />
<strong>2011</strong> Annual Ecological Monitoring Report, Final Report, May <strong>2012</strong> Page 18
and<br />
• two sites have showed a continual decline in bird species richness since 2008,<br />
namely sites 16 and 20.<br />
Species Diversity across Sites<br />
A comparison of the number of sites at which each species was recorded in <strong>2011</strong> (see<br />
Figure 3-3) identified the following:<br />
• Nine species were recorded across ten or more sites in <strong>2011</strong>. The nine species in<br />
order of highest to lowest site presence was as follows:<br />
» Rufous Whistler (Pachycephala rufiventris) (n=16);<br />
» Yellow-faced Honeyeater (Lichenostomus chrysops) (n=15);<br />
» Australian Raven (Corvus coronoides) (n=14);<br />
» Pied Currawong (Strepera graculina) (n=13);<br />
» Black-faced Cuckoo-shrike (Coracina novaehollandiae) (n=12);<br />
» Weebill (Smicrornis brevirostris) (n=11);<br />
» Superb Fairy-wren (Malurus cyaneus) (n=11);<br />
» Grey Butcherbird (Cracticus torquatus) (n=10); and<br />
» Noisy Miner (Manorina melanocephala) (n=10).<br />
• The Rufous Whistler was recorded at 16 of the 26 sites (62% of sites) in <strong>2011</strong> which<br />
is a decrease where it was detected at 21 sites in 2010, representing a decline at<br />
18% of sites.<br />
• The Rufous Whistler had the highest presence across sites than any other bird<br />
species in 2008, 2009, 2010 and <strong>2011</strong> (n=18, 21, 21 and 16 sites respectively); and<br />
• Almost half (49%) of bird recordings in <strong>2011</strong> were observed or heard at less than five<br />
sites.<br />
<strong>2011</strong> Annual Ecological Monitoring Report, Final Report, May <strong>2012</strong> Page 19
WARNING<br />
No part of this plan should be used<br />
for critical design dimensions.<br />
Confirmation of critical positions<br />
should be obtained from RPS Newcastle.<br />
<br />
Legend<br />
<strong>Wambo</strong> <strong>Coal</strong> Land<br />
Ownership Boundary<br />
RWEP Areas<br />
Threatened Species<br />
<br />
Brown Treecreeper<br />
Grey-crowned Babbler<br />
Hooded Robin<br />
D<br />
E<br />
Rail Loop<br />
Little Lorikeet<br />
Powerful Owl<br />
Speckled Warbler<br />
Varied Sitella<br />
C<br />
Bats<br />
Eastern Bentwing-bat<br />
Large-eared Pied Bat<br />
LittleBentwing-bat<br />
Yellow-bellied Sheathtail-bat<br />
<br />
B<br />
A<br />
0<br />
1<br />
2km<br />
SCALE: 1:30,000 AT A3 SIZE<br />
TITLE: FIGURE 3-2 THREATENED SPECIES LOCATIONS LOCATION: WAMBO COAL MINE<br />
DATUM: (GDA 94)<br />
PROJECTION: MGA ZONE 56<br />
DATE:<br />
PURPOSE:<br />
13/01/<strong>2012</strong><br />
REPORT FIGURE<br />
LAYOUT REF: J:\JOBS\<strong>Wambo</strong>\All Jobs\109410 <strong>Wambo</strong> AMR <strong>2011</strong>\10- Drafting\Workspaces<br />
VERSION (PLAN BY): A A3 (AS-NW)<br />
Copyright<br />
"This document and the information shown shall remain the property of RPS Australia East Pty Ltd.<br />
The document may only be used for the purpose for which it was supplied and in accordance with<br />
the terms of engagement for the commission. Unauthorised use of this document in any way is prohibited."<br />
CLIENT:<br />
JOB REF:<br />
WAMBO COAL PTY LTD<br />
109410<br />
RPS AUSTRALIA EAST PTY LTD (ABN 44 140 292 762)<br />
241 DENISON STREET BROADMEADOW PO BOX 428 HAMILTON NSW 2303<br />
T: 02 4940 4200 F: 02 4961 6794 www.rpsgroup.com.au<br />
creativepeople<br />
making a difference
Species Abundance in <strong>2011</strong><br />
This year is the third year to have included individual counts of bird species during the<br />
annual monitoring surveys. A comparison of the number of individuals recorded across all<br />
sites (see Figure 3-4) identified the following:<br />
• The Yellow-faced Honeyeater was the most abundant species, with 30 individuals<br />
recorded;<br />
• Seven species were recorded on more than 20 occasions. The seven species were<br />
the:<br />
» Yellow-faced Honeyeater (Lichenostomus chrysops) (n=30);<br />
» White-winged Chough (Corcorax melanorhamphos) (n=24).<br />
» Superb Fairy Wren (Malurus cyaneus) (n=23);<br />
» Australian Raven (Corvus coronoides) (n=22);<br />
» Pied Currawong (Strepera graculina) (n=21);<br />
» Rufous Whistler (Pachycephala rufiventris) (n=20); and<br />
» Noisy Miner (Manorina melanocephala) (n=20).<br />
• 69 species were recorded on less than ten occasions.<br />
Figure 3-2: Number of Bird Species Recorded per Site.<br />
<strong>2011</strong> Annual Ecological Monitoring Report, Final Report, May <strong>2012</strong> Page 21
Figure 3-3: Number of Sites per Species (all other species were recorded at less than four<br />
sites).<br />
Figure 3-4: Total Number of Each Species Recorded Across All Sites (all other species were<br />
recorded with less than six individuals across all sites).<br />
3.2.3 Owl Call Playback<br />
One target owl species, namely the Powerful Owl responded to the call playback of its<br />
own call. The Powerful Owl is listed as Vulnerable under the NSW Threatened Species<br />
Conservation Act 1995 (TSC Act). No other target species responded to their calls,<br />
however, a Southern Boobook Owl (Ninox novaeseelandiae) was recorded during<br />
spotlighting surveys. Three other non-threatened nocturnal birds, the Tawny Frogmouth<br />
<strong>2011</strong> Annual Ecological Monitoring Report, Final Report, May <strong>2012</strong> Page 22
(Podargus strigoides), Nankeen Night Heron (Nycticorax caledonicus) and Australian<br />
Owlet Nightjar (Aegotheles cristatus), were recorded during spotlighting surveys.<br />
3.2.4 Spotlighting<br />
Spotlighting surveys produced results from the mammal, bird and amphibian guilds. One<br />
threatened species was recorded during spotlighting surveys, namely the Grey-headed<br />
Flying-fox (Pteropus poliocephalus) listed as ‘Vulnerable’ under the TSC Act and<br />
Environment Protection and Biodiversity Conservation Act 1999 (EPBC Act). This species<br />
was recorded on two separate survey occasions.<br />
Across the five nights of spotlighting surveys, a total of nine Common Brushtail Possums<br />
(Trichosurus vulpecula) were recorded, a significant decrease from the 65 individuals that<br />
were recorded in 2010.<br />
Non-threatened species recorded during spotlighting surveys included the Eastern Grey<br />
Kangaroo (Macropus giganteus), Red-necked Wallaby (Macrpous rufogriseus), Sugar<br />
Glider (Petaurus breviceps) and Wallaroo (Macropus robustus). Two non-native species,<br />
namely the Red Fox (Vulpes vulpes) and domestic Dog (Canis lupus familiaris) were also<br />
recorded during spotlighting surveys.<br />
3.2.5 Herpetological Surveys<br />
Three reptile species were recorded opportunistically during ecological surveys in <strong>2011</strong><br />
(See Appendix D). These are the Tree Skink (Egernia striolata), Lace Monitor (Varanus<br />
varius) and Delicate Garden Skink (Lampropholis delicata).<br />
A total of 13 frog species were recorded during searches of water bodies as part of<br />
spotlighting surveys and opportunistically throughout other field surveys. Five species<br />
were commonly recorded, namely the Spotted Marsh Frog (Limnodynastes tasmaniensis),<br />
Smooth Toadlet (Uperoleia laevigata), Dwarf Green Tree Frog (Litoria fallax), Broadpalmed<br />
Frog (Litoria latopalmata) and Peron’s Tree Frog (Litoria peronii). The Ornate<br />
Burrowing Frog (Platyplectrum ornatum) was recorded once along a roadside. The<br />
remaining species were recorded infrequently during searches of water bodies.<br />
3.2.6 Bat Surveys<br />
A total of 10 microbat species were positively identified during <strong>2011</strong> surveys. Four of<br />
these species, namely the Large-eared Pied Bat (Chalinolobus dwyeri), Little Bent-wing<br />
Bat (Miniopterus australis), Eastern Bent-wing Bat (Minioprterus schreibersii oceansis)<br />
and Yellow-bellied Sheathtail-bat (Saccolaimus flaviventris) are listed as Vulnerable under<br />
the TSC Act. These species were recorded at three, one, one and three sites,<br />
respectively. The Large-eared Pied Bat is also listed as Vulnerable under the EPBC Act.<br />
There was variation in the number of calls recorded from the four threatened species with<br />
the Large-eared Pied bat being recorded 160 times, Little Bentwing Bat once, Eastern<br />
Bent-wing Bat once and Yellow-bellied Sheathtail-bat 17 times.<br />
<strong>2011</strong> Annual Ecological Monitoring Report, Final Report, May <strong>2012</strong> Page 23
An additional species, namely the Western Broad-nosed Bat (Scotorepens balstoni), was<br />
analysed as a ‘Probable’ recording (meaning that the unique call ‘signature’ could not be<br />
definitely assigned to the species) across three separate sites.<br />
3.3 Discussion<br />
3.3.1 Swift Parrot and Regent Honeyeater Winter Surveys<br />
Targeted winter bird surveys for the Swift Parrot and Regent Honeyeater during 2008,<br />
2009, 2010 and <strong>2011</strong> have failed to identify either species. Each year a limited foraging<br />
resource of few eucalypt blossoms during winter was observed, which reduced the<br />
chances of either species migrating to the area. Due to each species highly nomadic<br />
movement patterns, the failure to record either species does not suggest that they could<br />
not occur at <strong>Wambo</strong> <strong>Coal</strong> Mine. When years of heavy eucalypt blossom do occur, either<br />
species may occur in response to the presence of an increased foraging resource.<br />
3.3.2 Bird Surveys<br />
The <strong>2011</strong> survey recorded the average number of bird species, when compared to all<br />
other survey seasons, including the Common Bronzewing (Phaps chalcoptera) and Varied<br />
Sittella (Daphoenositta chrysoptera) (see Plate 1 and 2). Nine of the 26 sites recorded the<br />
highest number of bird species compared to any other year. Conversely six sites recorded<br />
their lowest species richness score since 2008, however just two of these sites have<br />
recorded decreasing numbers of bird species in the four consecutive years of data. It may<br />
be however that this decline is due to variation from a combination of a number of factors,<br />
as opposed to localised population decreases in specific bird species. The variation in the<br />
number of species recorded each year may partly be attributed to any of the below<br />
factors:<br />
• Natural variability in the number of bird species at a site during any 20 minute period;<br />
• Variability in seasonal conditions across the four years of sampling;<br />
• Variation in the number of sites sampled each year (ranged from 22 to 26);<br />
• Variability in the time of year of surveys;<br />
• Variability in the time of day of surveys; and<br />
• Observer bias. Likely variation in the skill level of observers across the four years has<br />
likely resulted in an unknown level of variability in the total number of species<br />
recorded.<br />
The variability in the number of bird species recorded at each site is likely due to a<br />
combination of the above factors and as such is a result of variability inherent in<br />
undertaking a single brief survey at each site.<br />
<strong>2011</strong> Annual Ecological Monitoring Report, Final Report, May <strong>2012</strong> Page 24
Plate 1. Male Common Bronzewing (Phaps chalcoptera)<br />
Plate 2. Varied Sittella (Daphoenositta chrysoptera). Vulnerable under the TSC Act.<br />
<strong>2011</strong> Annual Ecological Monitoring Report, Final Report, May <strong>2012</strong> Page 25
3.3.3 Owl Call Playback<br />
No threatened owl species were recorded during the 2007 and 2010 annual surveys. The<br />
Powerful Owl was recorded once in 2008 and in <strong>2011</strong> while the Masked Owl was<br />
recorded once in 2009. Due to the large home range area of the target owl species and<br />
the relatively few (four) call playback sessions undertaken each year, it is not unexpected<br />
that threatened owls species are rarely detected.<br />
The Tawny Frogmouth and Australian Owlet Nightjar were recorded during spotlighting<br />
surveys in all five years. Both species were recorded in low numbers and appear to be<br />
present at a relatively low density.<br />
3.3.4 Spotlighting<br />
Spotlighting surveys recorded one threatened species, the Grey-headed Flying-fox, and<br />
various non-threatened species during <strong>2011</strong>. There was a noticeable difference in<br />
Common Brush-tail Possum abundance between 2010 results and <strong>2011</strong> results (n=65 and<br />
n=9 respectively). This difference could be due to seasonal variability, resource availability<br />
during survey periods that limit on site presence or it could indicate an early population<br />
decline. Declines of this species have occurred across much of Australia, including a large<br />
area of the central western slopes of New South Wales, including the Pilliga forests (Kerle<br />
2004). While the declines at the study area may be due to natural declines such as<br />
predation by Powerful Owl, due to the recorded declines in other areas it is recommended<br />
that future monitoring work to continue for Common Brushtail Possum.<br />
Spotlighting surveys have shown to detect non-targeted nocturnal species such as the<br />
Australian Owlet-nightjar and Tawny Frogmouth regularly and encompass multiple fauna<br />
guilds within the results.<br />
3.3.5 Herpetological Surveys<br />
Table 3-1 shows the number of reptile and amphibian species recorded over the five<br />
years of monitoring, including the Green Tree Frog (Litoria caerulea) (Plate 3).<br />
Table 3-1: Number of reptile and frog species recorded over the four years of monitoring<br />
Year No. Of Reptile Species No. Of Frog Species<br />
2007 8 12<br />
2008 8 9<br />
2009 5 6<br />
2010 10 10<br />
<strong>2011</strong> 3 13<br />
The level of variation in the number of reptile and frog species recorded during the four<br />
years of sampling is most likely a result of variation in seasonal conditions across the<br />
years. Additionally variable weather conditions and dates of survey (months of year) are<br />
likely to have caused variation in the number of species recorded.<br />
<strong>2011</strong> Annual Ecological Monitoring Report, Final Report, May <strong>2012</strong> Page 26
Plate 3. Green Tree Frog (Litoria caerulea)<br />
3.3.6 Bat Surveys<br />
Surveys conducted in <strong>2011</strong> produced similar results to 2010 bat surveys. With 10 and 11<br />
microbat species being positively recorded in <strong>2011</strong> and 2010 respectively and both years<br />
containing four threatened species, the results are consistent. Recordings analysed as<br />
‘Probable’ included only 1 and 2 extra species for <strong>2011</strong> and 2010 respectively.<br />
Of the threatened species positively recorded the two that were recorded in both years,<br />
the Large-eared Pied Bat (Chalinolobous dwyeri) and Eastern Bent-wing Bat (Miniopterus<br />
schreibersii oceanensis), are cave dwelling species that forage in woodlands and forests.<br />
The Little Bent-wing Bat (Miniopterus australis) and Yellow-bellied Sheat-tail Bat<br />
(Saccolaimus flaviventris) were recorded in <strong>2011</strong> but not in 2010 whereas the Eastern<br />
False Pipstrelle (Falsistrellus tasmaniensis) and Eastern Freetail Bat (Mormopterus<br />
norfolkensis) were recorded in 2010 and not in <strong>2011</strong>. These species primarily roost in tree<br />
hollows or under decorticating bark and forage for insects throughout woodland and forest<br />
vegetation.<br />
Of the data that were analysed as ‘Probable’ in <strong>2011</strong>, eight species were recorded with<br />
three listed as threatened, while 2010 recorded eleven ‘Probable’ species including six<br />
threatened species.<br />
All positively recorded threatened species fall into their geographical distributions<br />
according to Law et al. (<strong>2011</strong>).<br />
<strong>2011</strong> Annual Ecological Monitoring Report, Final Report, May <strong>2012</strong> Page 27
3.4 Conclusion<br />
While no Swift Parrots or Regent Honeyeaters have been identified during targeted winter<br />
bird surveys, annual surveys for these species should continue into the future, particularly<br />
during years of heavy eucalypt blossom when either or both species may occur on<br />
<strong>Wambo</strong> <strong>Coal</strong> land.<br />
Current management practices observed within the RWEP areas of <strong>Wambo</strong> <strong>Coal</strong> Mine<br />
are appropriate for the conservation of bird species. Variation evident in the results from<br />
four to five years of monitoring is most likely related to natural variation in species<br />
diversity, natural variation in species abundance and variation inherent in the sampling<br />
design, and not to current management practises.<br />
Due to the large home range area of the target owl species and the relatively few (five)<br />
call playback sessions undertaken each year, it is not unexpected that threatened owls<br />
species are rarely detected. However, one threatened Owl, the Powerful Owl, was<br />
successfully detected during <strong>2011</strong> annual surveys.<br />
Spotlighting surveys identified the Common Brushtail Possum as the most common<br />
arboreal mammal species in RWEP areas of <strong>Wambo</strong> <strong>Coal</strong> Mine, however, there has been<br />
a noticeable decline from 2010 to <strong>2011</strong>, which may be of conservation concern due to<br />
declines in other non-urban areas (Kerle 2004). Across five years of annual monitoring<br />
only four arboreal mammal species have been identified. The Common Brushtail Possum<br />
was identified each year, the Yellow-bellied Glider and Squirrel Glider were recorded for<br />
the first time in 2010 and the Sugar Glider was recorded for the first time during <strong>2011</strong>.<br />
Amphibian recordings for <strong>2011</strong> were the highest yet, highlighting the diversity of this fauna<br />
group across the study site. Reptile abundance was lowest this year; however, there are<br />
various factors contributing to this result as discussed previously. Ongoing monitoring will<br />
allow for further observations and recordings to be made across the study site.<br />
Consistent data over two years of surveys is a positive outlook for threatened microbat<br />
species. Ongoing monitoring will provide significant data on the persistence of these<br />
species and continue to illustrate any fluctuations of species diversity across the study<br />
site.<br />
<strong>2011</strong> Annual Ecological Monitoring Report, Final Report, May <strong>2012</strong> Page 28
4 Riparian Monitoring<br />
4.1 Methods<br />
Riparian assessments were undertaken by repeating methods defined by HLA (2007)<br />
which included taking pedestrian based surveys along sections of North <strong>Wambo</strong> Creek,<br />
South <strong>Wambo</strong> Creek and Stoney Creek utilising field sheets to give an overall rating of<br />
creek health.<br />
Pedestrian based surveys were undertaken over four days including the 7th, 10th, 11th<br />
and 22nd November <strong>2011</strong>. Two types of transect were assessed for each of the three<br />
streams, these were:<br />
• Cross sectional – A marked single line transect across the width of the stream from<br />
bank to bank, hereafter referred to as ‘transects’; and<br />
• Longitudinal – An unmarked transect along the length of the creek between two<br />
transects, hereafter referred to as ‘sections’.<br />
Transect and section locations were established in the field by HLA (2007) and comprise<br />
the length of underground workings, plus at least one site beyond each end of the<br />
underground workings.<br />
Two types of riparian monitoring were undertaken – bed and bank stability monitoring, and<br />
riparian vegetation monitoring.<br />
Bed and Bank stability<br />
Bed and bank stability monitoring is undertaken by surveying consultants who undertake<br />
replicate surveys of the three creeks to measure areas of significant erosion and to<br />
identify changes related to water flow. A written assessment was completed of any areas<br />
of significant erosion, bare soil and visible subsidence along each creek line.<br />
Riparian Vegetation Monitoring<br />
The effects of subsidence and erosion on riparian vegetation were monitored by repetitive<br />
sampling of established permanent transects by assessing:<br />
• The current erosion status of transects and sections;<br />
• Photographing each transect site and any areas of significant erosion or subsidence<br />
impacts; and<br />
• Quantifying vegetative structure and species composition for each transect by:<br />
» Completing visual assessment field sheets (see Appendix E) of weighted<br />
riparian vegetation characteristics to give an overall rating. Riparian vegetation<br />
components assessed included:<br />
• Overstorey characteristics;<br />
• Understorey characteristics;<br />
<strong>2011</strong> Annual Ecological Monitoring Report, Final Report, May <strong>2012</strong> Page 29
• Ground cover characteristics;<br />
• Introduced species presence;<br />
• Feral animal activity;<br />
• Surface stability;<br />
• Riparian microhabitat presence; and<br />
• Disturbance levels.<br />
» Visual assessment field sheets were updated in 2010 and <strong>2011</strong> to remove<br />
inconsistencies in the weighting of scores. Negative attributes were given<br />
negative scores in 2010 and <strong>2011</strong>.<br />
» Due to the change in the weighting of scores in 2010 and <strong>2011</strong>, comparison<br />
between 2010 and <strong>2011</strong> results and previous results cannot be made.<br />
Field Sheet Scoring System<br />
Transects and sections are awarded different colours according to their total score<br />
condition rating. Sites ranked as poor are colour coded red, moderate as yellow, good as<br />
green, and excellent as blue. The maximum possible score is 54 and the minimum<br />
possible score is -51. Total score categories are as follows:<br />
• Greater than 33 – Excellent condition (blue);<br />
• 28 to 33 – Good condition (green);<br />
• 14 to 27 – Moderate condition (yellow);<br />
• Less than 14 – Poor condition (red).<br />
The above condition rating score ranges are not equally weighted and were determined<br />
by an assessment of the maximum possible score for each assessed component at each<br />
condition level.<br />
Poor condition sites are likely to be highly degraded and/or missing significant vegetation<br />
structural components. Active management would likely be required to improve the scores<br />
of poor condition sites. Moderate condition sites are considered relatively satisfactory and<br />
require varying degrees of land management (to be considered on a site by site basis).<br />
Good condition sites are considered in relatively good health and may only require<br />
maintenance works such as weed control. Excellent condition sites are considered<br />
unlikely to require any maintenance.<br />
4.2 Results<br />
Figures 4-1 and 4-2 show the results of the riparian condition assessments along South<br />
<strong>Wambo</strong> Creek, North <strong>Wambo</strong> Creek and Stoney Creek. Appendix F lists the individual<br />
transect and section scores for each creek line. Appendix G shows the <strong>2011</strong> photographs<br />
of each transect site.<br />
<strong>2011</strong> Annual Ecological Monitoring Report, Final Report, May <strong>2012</strong> Page 30
WARNING<br />
No part of this plan should be used<br />
for critical design dimensions.<br />
Confirmation of critical positions<br />
should be obtained from RPS Newcastle.<br />
Legend<br />
Excellent Condition<br />
Good Condition<br />
Satisfactory Condition<br />
Poor Condition<br />
Drainage Line<br />
1A<br />
2A<br />
3A<br />
4A<br />
WAMBO COAL MINE<br />
5A<br />
6A<br />
7A<br />
8A<br />
9A<br />
10A<br />
11A<br />
North North North North North North North North North North North North North North North North North North North North North North North North North <strong>Wambo</strong> <strong>Wambo</strong> <strong>Wambo</strong> <strong>Wambo</strong> <strong>Wambo</strong> <strong>Wambo</strong> <strong>Wambo</strong> <strong>Wambo</strong> <strong>Wambo</strong> <strong>Wambo</strong> <strong>Wambo</strong> <strong>Wambo</strong> <strong>Wambo</strong> <strong>Wambo</strong> <strong>Wambo</strong> <strong>Wambo</strong> <strong>Wambo</strong> <strong>Wambo</strong> <strong>Wambo</strong> <strong>Wambo</strong> <strong>Wambo</strong> <strong>Wambo</strong> <strong>Wambo</strong> <strong>Wambo</strong> <strong>Wambo</strong> Creek Creek Creek Creek Creek Creek Creek Creek Creek Creek Creek Creek Creek Creek Creek Creek Creek Creek Creek Creek Creek Creek Creek Creek Creek<br />
12A<br />
13A<br />
14A<br />
15A<br />
1C<br />
2C<br />
3C<br />
4C<br />
Wollombi Brook<br />
Stoney Stoney Stoney Stoney Stoney Stoney Stoney Stoney Stoney Stoney Stoney Stoney Stoney Stoney Stoney Stoney Stoney Stoney Stoney Stoney Stoney Stoney Stoney Stoney Stoney Creek Creek Creek Creek Creek Creek Creek Creek Creek Creek Creek Creek Creek Creek Creek Creek Creek Creek Creek Creek Creek Creek Creek Creek Creek<br />
5C<br />
4B<br />
5B<br />
1B<br />
2B<br />
3B<br />
South South <strong>Wambo</strong> <strong>Wambo</strong> Creek<br />
Creek<br />
0 1<br />
SCALE: 1: 25,000 AT A4 SIZE<br />
2km<br />
Copyright<br />
"This document and the information shown shall remain the property of<br />
RPS Australia East Pty Ltd. The document may only be used for the purpose<br />
for which it was supplied and in accordance with the terms of engagement for<br />
the commission. Unauthorised use of this document in any way is prohibited."<br />
TITLE: FIGURE 4-1 SURVEY TRANSECT LOCATION: WAMBO<br />
DATUM: (GDA 94)<br />
LOCATIONS<br />
MGA ZONE 56<br />
PROJECTION:<br />
DATE:<br />
PURPOSE:<br />
10/01/<strong>2012</strong><br />
REPORT FIGURE<br />
LAYOUT REF:<br />
J:\JOBS\<strong>Wambo</strong>\All Jobs\109410 <strong>Wambo</strong><br />
AMR <strong>2011</strong>\10- Drafting\Workspaces<br />
VERSION (PLAN BY): A A4 (AS-NW)<br />
CLIENT:<br />
JOB REF:<br />
WAMBO COAL PTY LTD<br />
109410<br />
RPS AUSTRALIA EAST PTY LTD (ABN 44 140 292 762)<br />
241 DENISON STREET BROADMEADOW PO BOX 428 HAMILTON NSW 2303<br />
T: 02 4940 4200 F: 02 4961 6794 www.rpsgroup.com.au
4.2.1 South <strong>Wambo</strong> Creek<br />
South <strong>Wambo</strong> Creek was dominated by moderate transect and section condition scores.<br />
Transects<br />
The five transects along South <strong>Wambo</strong> Creek were in moderate condition. Data from 2010<br />
showed two sites in the poor condition category whereas results from <strong>2011</strong> have improved<br />
to all be considered as moderate. Moderate condition transects generally consist of:<br />
• A low sparse understorey layer containing some weed species;<br />
• A moderately diverse canopy layer;<br />
• A species poor ground cover layer with increasing areas of bare soil and decreasing<br />
areas of foliage cover;<br />
• The presence of rabbits;<br />
• A lack of disturbance factors;<br />
• The presence of minor stream bank erosion and minor sedimentation evidence; and<br />
• The presence of some riparian microhabitat features.<br />
Sections<br />
Three out of four sections along South <strong>Wambo</strong> Creek were found to be in moderate<br />
condition with the fourth being in good condition. South <strong>Wambo</strong> Creek condition scores<br />
were typically characterised by:<br />
• A moderately species diverse canopy layer;<br />
• A low and sparse understorey layer containing some weed species;<br />
• A relatively poor species ground cover layer with increasing areas of bare soil and<br />
decreasing areas of foliage cover;<br />
• A high diversity of weeds;<br />
• The presence of rabbits;<br />
• The presence of some riparian microhabitat features; and<br />
• A lack of other disturbance factors.<br />
4.2.2 North <strong>Wambo</strong> Creek<br />
North <strong>Wambo</strong> Creek was dominated by moderate transect and section condition scores.<br />
Transects<br />
Thirteen of the 15 transects along North <strong>Wambo</strong> Creek were found to be in moderate<br />
condition. One transect was in excellent condition with a score of 34 while the remaining<br />
transect was in poor condition with a score of only four. North <strong>Wambo</strong> Creek transect<br />
condition scores were typically characterised by:<br />
• A mature but species poor canopy of moderate density;<br />
• A sparse and short ground cover layer;<br />
<strong>2011</strong> Annual Ecological Monitoring Report, Final Report, May <strong>2012</strong> Page 33
• A relatively high number of weed species;<br />
• Some areas of gully and stream erosion;<br />
• The presence of rabbits at some sites; and<br />
• The presence of some riparian microhabitat features.<br />
North <strong>Wambo</strong> Creek Transect 4 was in poor condition scoring only four. Transect 4 lacked<br />
both canopy and understorey layers and was essentially a grassland containing many<br />
weed species. However, while scoring only four, Transect 4 had high ground cover and<br />
lacked any areas of erosion and most disturbance factors (rabbits were present).<br />
Sections<br />
The sections along North <strong>Wambo</strong> Creek were almost evenly divided between moderate<br />
and good condition (n=8 and n=6 respectively). North <strong>Wambo</strong> Creek transect moderate<br />
condition scores were typically characterised by:<br />
• A mature canopy of moderate species diversity and density;<br />
• Some weed species in the understorey;<br />
• A complete ground cover of grasses, although containing some weed species;<br />
• The presence of rabbits at some sites;<br />
• Some areas of gully and stream erosion; and<br />
• The presence of some riparian microhabitat features.<br />
In comparison to the moderate condition sites the good and excellent sections along North<br />
<strong>Wambo</strong> Creek typically showed:<br />
• An reduced presence of weed species in the canopy, understorey and ground cover<br />
layers; and<br />
• A higher presence of riparian microhabitat features.<br />
4.2.3 Stoney Creek<br />
Stoney Creek comprised excellent transect and section scores where sites were within<br />
remnant forest vegetation, and good and moderate scores for sites adjacent to or lacking<br />
remnant forest vegetation.<br />
Transects<br />
Stoney Creek transect scores ranged from excellent in the upper reaches of the creek line<br />
to moderate along the middle section of the creek line with the lower more disturbed parts<br />
of the creek line being in good condition. The presence of a significant canopy layer, a<br />
general lack of weed species and the absence of feral animals were the key differences<br />
between the excellent scoring transects and those considered to be good and moderate<br />
along Stoney Creek. While the condition score varied, all transects along Stoney Creek<br />
lacked areas of erosion.<br />
<strong>2011</strong> Annual Ecological Monitoring Report, Final Report, May <strong>2012</strong> Page 34
Sections<br />
Stoney Creek sections scores also ranged from excellent in the upper reaches of the<br />
creek line to good and moderate along the lower more disturbed parts of the creek line.<br />
Excellent scores resulted from an increased number of ground cover species, the<br />
presence of a litter layer and an absence of feral animal species. Three of the four<br />
sections along Stoney Creek recorded minor levels of erosion.<br />
4.2.4 Overall Riparian Condition<br />
The overall condition of the riparian sites based on average calculations is moderate and<br />
good condition. Stoney Creek is identified as being in good condition while both North<br />
<strong>Wambo</strong> Creek and South <strong>Wambo</strong> Creek are in moderate condition.<br />
4.2.5 Annual Riparian Condition Photographs<br />
In <strong>2011</strong> four photographs were taken at each riparian transect, with individual<br />
photographs showing the left bank, right bank, upstream channel and downstream<br />
channel. Appendix G shows the photographs from the <strong>2011</strong> riparian condition<br />
assessment. Riparian condition photographs during previous years were varied in their<br />
location, typically showing areas of problem erosion.<br />
4.3 Discussion<br />
Both South <strong>Wambo</strong> and North <strong>Wambo</strong> creeks are historically deeply eroded creek lines,<br />
up to four to five metres deep in some parts. Stoney Creek is a shallow narrow creek in<br />
the upper sections and a wide and historically deeply eroded creek in the lower parts.<br />
Past land management practices (presumably land clearing during European settlement)<br />
have resulted in all three creeks being present as deeply eroded channels. Today all three<br />
are essentially grass covered channels with scattered or remnant tree cover and some<br />
areas of minor or moderate erosion.<br />
All three creeks contain some scattered areas of active erosion typically present as<br />
eroding or collapsing banks. These areas of erosion and collapsing banks do not appear<br />
to be a result of current land management practices however there is little evidence of<br />
current land management practices to reduce or eliminate the erosion that is occurring.<br />
Where possible, remedial works to repair eroded banks or tree planting to help stabilise<br />
banks, should be undertaken.<br />
Two common causes for reductions in condition scores were the presence of weeds and<br />
the presence of rabbits. Selective spraying of Lycium ferocissimum (African Boxthorn) and<br />
Olea europaea subspecies cuspidata (African Olive) had been undertaken extensively<br />
throughout <strong>2011</strong>. However, these species are continuing to germinate and spread<br />
throughout the riparian areas. In addition, a large percentage of the ground cover<br />
vegetation is composed of introduced exotic species. While these species appear to be<br />
outcompeting native ground cover species, they provide protection for the soil from<br />
erosion and should only be removed when successional native species are planted and<br />
have become established.<br />
<strong>2011</strong> Annual Ecological Monitoring Report, Final Report, May <strong>2012</strong> Page 35
Management to control the number and presence of rabbits along the creeks would<br />
increase the stability of banks and result in increased condition scores.<br />
Impacts from mining subsidence were found along North <strong>Wambo</strong> creek. Rock formations<br />
at the base of the creek bed experienced both compression and expansion as a result of<br />
subsidence. Natural fault lines within the rock as well as solid rock segments experienced<br />
expansion within a range of 6–20 mm.<br />
4.4 Recommendations<br />
Implementation of the following recommendations would improve the condition scores of<br />
North <strong>Wambo</strong> Creek, South <strong>Wambo</strong> Creek and Stoney Creek:<br />
• Where appropriate, undertake remediation works at sites of significant bank erosion;<br />
• Where remediation works are likely to cause more damage than good, plant<br />
seedlings of local tree species around erosion areas to stabilise banks and assist in<br />
the prevention of future erosion;<br />
• Prevent or limit livestock access to North <strong>Wambo</strong> Creek and Stoney Creek;<br />
• Undertaken rabbit control measures along all three creeks; and<br />
• Undertake a weed management program that uses successional techniques that do<br />
not leave areas of bare soil.<br />
4.5 Conclusion<br />
Riparian monitoring identified Stoney Creek as being in good condition, and North <strong>Wambo</strong><br />
and South <strong>Wambo</strong> Creeks in moderate condition. Current bank erosion problem areas are<br />
a result of historic land management practises however in the absence of current<br />
management will continue to degrade. Subsidence has also been recorded during <strong>2011</strong><br />
annual assessments. Recommendations have been made to address problem erosion<br />
areas and to undertake other management actions that would lead to increased condition<br />
scores for all three creeks.<br />
<strong>2011</strong> Annual Ecological Monitoring Report, Final Report, May <strong>2012</strong> Page 36
5 References<br />
Braun-Blanquet, J. (1982). Plant Sociology: The Study of Plant Communities. McGraw Hill<br />
Publishers, New York.<br />
Harden, G. (ed) (1992). Flora of New South Wales, Volume 3. New South Wales<br />
University Press, NSW.<br />
Harden, G. (ed) (1993). Flora of New South Wales, Volume 4. New South Wales<br />
University Press, NSW.<br />
Harden, G. (ed) (2000). Flora of New South Wales, Volume 1. Revised edition. New South<br />
Wales University Press, NSW.<br />
Harden, G. (ed) (2002). Flora of New South Wales, Volume 2. Revised edition. New South<br />
Wales University Press, NSW.<br />
HLA Envirosciences (2007). Riparian Vegetation and Bed and Bank Stability Monitoring<br />
<strong>Wambo</strong> <strong>Coal</strong>. An unpublished Report prepared for <strong>Wambo</strong> <strong>Coal</strong> Pty Limited, May<br />
2007.<br />
HLA Envirosciences (2007b). Terrestrial Fauna Survey, An unpublished report prepared<br />
for <strong>Wambo</strong> <strong>Coal</strong> Pty Ltd, May 2007.<br />
Kearle, A. (2004). A cautionary tale: decline of the common brushtail possum Trichosurus<br />
vulpecula and common ringtail possum Pseudocheirus peregrinus in the woodlands<br />
of the western slopes and plains of New South Wales, in ‘The Biology of Australian<br />
Possums and Gliders’, (eds R. Goldingay and S. Jackson), pp. 71-84, Surrey Beaty,<br />
Sydney.<br />
Kavanagh, R., and Peake, P. (1993) Survey procedures for nocturnal forest birds: an<br />
evaluation of the variability in census results due to temporal factors, weather and<br />
technique. In ‘Australian Raptor Studies’ (ed. P Olsen), pp. 86-100, Australasian<br />
Raptor Association, RAOU, Melbourne.<br />
Kavanagh, R., Debus, S., Tweedie, T. and Webster, R. (1995) Distribution of nocturnal<br />
forest birds and mammals in north-eastern New South Wales: relationships with<br />
environmental variables and management history, Wildlife Research 22, 359–377.<br />
Law. B., Eby. P., Lunney. D. and Lumsden. L. (Eds.) (<strong>2011</strong>). The Biology and<br />
Conservation of Australasian Bats. Royal Zoological Society of New South Wales,<br />
Australia.<br />
RPS Harper Somer’s O’Sullivan (2007). Annual Ecological Monitoring Report – <strong>Wambo</strong><br />
<strong>Coal</strong> Mine, Singleton, NSW. Report prepared for <strong>Wambo</strong> <strong>Coal</strong> Pty Ltd.<br />
<strong>2011</strong> Annual Ecological Monitoring Report, Final Report, May <strong>2012</strong> Page 37
RPS Harper Somer’s O’Sullivan (2009). Annual Ecological Monitoring Report for 2008 –<br />
<strong>Wambo</strong> <strong>Coal</strong> Mine, Singleton, NSW. Report prepared for <strong>Wambo</strong> <strong>Coal</strong> Pty Ltd.<br />
RPS (2010). 2009 Annual Ecological Monitoring Report – <strong>Wambo</strong> <strong>Coal</strong> Mine, Singleton,<br />
NSW. Report prepared for <strong>Wambo</strong> <strong>Coal</strong> Pty Ltd.<br />
RPS (<strong>2011</strong>). 2010 Annual Ecological Monitoring Report- <strong>Wambo</strong> <strong>Coal</strong> Mine, Singleton,<br />
NSW. Report prepared for <strong>Wambo</strong> <strong>Coal</strong> Pty Ltd. January <strong>2011</strong>.<br />
Simpson, K., and Day, N. (2010). Field Guide to the Birds of Australia. Penguin Books,<br />
Australia.<br />
Tyler, M.J. and Knight, F. (<strong>2011</strong>). Field Guide to the Frogs of Australia. Revised Edition.<br />
CSIRO Publishing, Australia.<br />
Van Dyk, S. and Strahan, R. (eds) (2008). The Mammals of Australia. New Holland<br />
Publishers, Australia.<br />
Wilson, S. and Swan, G. (2010). A Complete Guide to Reptiles of Australia. New Holland<br />
Publishers, Australia.<br />
<strong>2011</strong> Annual Ecological Monitoring Report, Final Report, May <strong>2012</strong> Page 38
Appendix A<br />
Flora Diversity Results<br />
<strong>2011</strong> Annual Ecological Monitoring Report, Final Report, May <strong>2012</strong> Page 39
Table 1: Flora Diversity Within Plots<br />
Vegetation Community Sampled<br />
River Oak / Rough-barked Apple Forest<br />
River Red Gum Woodland<br />
Yellow Box / Blakely’s Red Gum / Roughbarked<br />
Apple Forest<br />
Coast Banksia / Rough-barked Apple /<br />
Blakely’s Red Gum Forest (Warkworth<br />
Sands Woodland EEC)<br />
Narrow-leaf Ironbark / Grey Box / Bulloak<br />
/ Honeymyrtle Forest<br />
Spotted Gum / Narrow-leaf Ironbark /<br />
Bulloak / Paperbark Forest<br />
Slaty Gum / Narrow-leaf Ironbark / Bulloak<br />
/ Paperbark Forest<br />
Grey Gum / Narrow-leaf Ironbark / Bulloak<br />
/ Honeymyrtle Forest<br />
White Mahogany / Rough-barked Apple<br />
Forest<br />
Brush Wilga/Native Olive Shrubland<br />
Flora<br />
Monitoring<br />
Plot<br />
Total<br />
No.<br />
Spp<br />
No.<br />
Native<br />
spp.<br />
%<br />
Natives<br />
No of<br />
exotic<br />
spp.<br />
%<br />
Exotics<br />
V1-A1 29 11 38 18 62<br />
V1-A2 27 11 31 16 59<br />
V1-B1 27 18 67 9 33<br />
V1-B2 23 15 65 8 35<br />
V1-B3 29 13 45 16 55<br />
V2-A1 23 7 31 16 69<br />
V2-B1 30 10 33 20 67<br />
V2-B2 32 16 50 16 50<br />
V3-B1 32 22 69 10 31<br />
V5-B1 35 26 74 9 26<br />
V5-B2 36 27 75 9 25<br />
V5-B3 31 28 90 3 10<br />
V5-B4 28 25 92 3 8<br />
V6-A1c 31 30 97 1 3<br />
V6-A3 21 21 100 0 0<br />
V6-B1 29 24 83 5 17<br />
V6-B1c 30 28 93 2 7<br />
V6-B2 36 32 89 4 11<br />
V6-B2c 36 33 92 3 8<br />
V6-B3 40 34 85 6 15<br />
V6-B4 11 8 73 3 27<br />
V9-A1 31 29 94 2 6<br />
V9-B1 40 37 92 3 8<br />
V9-B2 37 34 92 3 8<br />
V10-A1 36 31 86 5 14<br />
V10-A2 42 35 83 7 17<br />
V10-B2 33 32 97 1 3<br />
V10-B3 29 27 93 2 7<br />
V11-B1 30 28 93 2 7<br />
V11-B2 36 33 92 3 8<br />
V13-B1 59 50 85 9 15<br />
V14-A1 36 26 72 10 28<br />
V14-B1 37 31 84 6 16<br />
V14-B2 44 40 91 4 9<br />
<strong>2011</strong> Annual Ecological Monitoring Report, Final Report, May <strong>2012</strong> Page 40
Table 2: Number of Flora Species Recorded Each Year<br />
Vegetation Community Sampled<br />
River Oak / Rough-barked Apple<br />
Forest<br />
River Red Gum Woodland<br />
Yellow Box / Blakely’s Red Gum /<br />
Rough-barked Apple Forest<br />
Coast Banksia / Rough-barked<br />
Apple / Blakely’s Red Gum Forest<br />
(Warkworth Sands Woodland EEC)<br />
Narrow-leaf Ironbark / Grey Box /<br />
Bulloak / Honeymyrtle Forest<br />
Spotted Gum / Narrow-leaf Ironbark<br />
/ Bulloak / Paperbark Forest<br />
Slaty Gum / Narrow-leaf Ironbark /<br />
Bulloak / Paperbark Forest<br />
Grey Gum / Narrow-leaf Ironbark /<br />
Bulloak / Honeymyrtle Forest<br />
White Mahogany / Rough-barked<br />
Apple Forest<br />
Brush Wilga/Native Olive Shrubland<br />
Flora<br />
Monitoring<br />
Plot<br />
2006 2007 2008 2009 2010 <strong>2011</strong><br />
V1-A1 9 29 11 41 31 29<br />
V1-A2 18 29 27 29 28 27<br />
V1-B1 29 35 13 18 9 27<br />
V1-B2 18 23 6 12 3 23<br />
V1-B3 20 29 9 17 26 29<br />
V2-A1 22 32 25 19 21 23<br />
V2-B1 22 31 33 29 28 30<br />
V2-B2 32 34 38 42 28 32<br />
V3-B1 29 51 45 26 19 32<br />
V5-B1 33 44 38 35 37 35<br />
V5-B2 27 44 38 38 34 36<br />
V5-B3 37 38 36 43 31 31<br />
V5-B4 32 33 30 28<br />
V6-A1c 25 44 39 36 34 31<br />
V6-A3 35 54 41 21 29 21<br />
V6-B1 31 46 44 38 29 29<br />
V6-B1c 32 43 40 38 39 30<br />
V6-B2 36 49 46 36 26 36<br />
V6-B2c 24 44 36 33 36 36<br />
V6-B3 33 51 46 34 37 40<br />
V6-B4 25 17 20 11<br />
V9-A1 23 41 39 41 27 31<br />
V9-B1 39 39 34 35 39 40<br />
V9-B2 33 40 37 34 37 37<br />
V10-A1 27 40 39 36 37 36<br />
V10-A2 28 46 43 41 43 42<br />
V10-B2 39 55 44 46 45 33<br />
V10-B3 23 29<br />
V11-B1 26 33 29 29 35 30<br />
V11-B2 38 50 43 38 35 36<br />
V13-B1 46 67 64 56 63 59<br />
V14-A1 40 54 59 34 36 36<br />
V14-B1 30 48 49 26 36 37<br />
V14-B2 35 58 48 39 43 44<br />
<strong>2011</strong> Annual Ecological Monitoring Report, Final Report, May <strong>2012</strong> Page 41
Table 3: Changes in the Number of Species Recorded<br />
Vegetation Community<br />
Sampled<br />
River Oak / Rough-barked<br />
Apple Forest<br />
River Red Gum Woodland<br />
Yellow Box / Blakely’s Red<br />
Gum / Rough-barked Apple<br />
Forest<br />
Coast Banksia / Rough-barked<br />
Apple / Blakely’s Red Gum<br />
Forest (Warkworth Sands<br />
Woodland EEC)<br />
Narrow-leaf Ironbark / Grey<br />
Box / Bulloak / Honeymyrtle<br />
Forest<br />
Spotted Gum / Narrow-leaf<br />
Ironbark / Bulloak / Paperbark<br />
Forest<br />
Slaty Gum / Narrow-leaf<br />
Ironbark / Bulloak / Paperbark<br />
Forest<br />
Grey Gum / Narrow-leaf<br />
Ironbark / Bulloak /<br />
Honeymyrtle Forest<br />
White Mahogany / Roughbarked<br />
Apple Forest<br />
Brush Wilga/Native Olive<br />
Shrubland<br />
Flora<br />
Monitoring<br />
Plot<br />
2007 2008 2009 2010 <strong>2011</strong><br />
Total<br />
Change<br />
V1-A1 20 -18 30 -10 -2 20<br />
V1-A2 11 -2 2 -1 -1 9<br />
V1-B1 6 -22 5 -9 18 -2<br />
V1-B2 5 -17 6 -9 20 5<br />
V1-B3 9 -20 8 9 3 9<br />
V2-A1 10 -7 -6 2 2 1<br />
V2-B1 9 2 -4 -1 2 8<br />
V2-B2 2 4 4 -14 4 0<br />
V3-B1 22 -6 -19 -7 13 3<br />
V5-B1 11 -6 -3 2 -2 2<br />
V5-B2 17 -6 0 -4 2 9<br />
V5-B3 1 -2 7 -12 0 -6<br />
V5-B4 1 -3 -2 -4<br />
V6-A1c 19 -5 -3 -2 -3 6<br />
V6-A3 19 -13 -20 8 -8 -14<br />
V6-B1 15 -2 -6 -9 0 -2<br />
V6-B1c 11 -3 -2 1 -9 -2<br />
V6-B2 13 -3 -10 -10 10 0<br />
V6-B2c 20 -8 -3 3 0 12<br />
V6-B3 18 -5 -12 3 3 7<br />
V6-B4 -8 3 -9 -14<br />
V9-A1 18 -2 2 -14 4 8<br />
V9-B1 0 -5 1 4 1 1<br />
V9-B2 7 -3 -3 3 0 4<br />
V10-A1 13 -1 -3 1 -1 9<br />
V10-A2 18 -3 -2 2 -1 14<br />
V10-B2 16 -11 2 -1 -12 -6<br />
V10-B3 N/A 6 6<br />
V11-B1 7 -4 0 6 -5 4<br />
V11-B2 12 -7 -5 -3 1 -2<br />
V13-B1 21 -3 -8 7 -4 13<br />
V14-A1 14 5 -25 2 0 -4<br />
V14-B1 18 1 -23 10 1 7<br />
V14-B2 23 -10 -9 4 1 9<br />
<strong>2011</strong> Annual Ecological Monitoring Report, Final Report, May <strong>2012</strong> Page 42
Table 4: Percentage Change in Introduced Species<br />
Vegetation Community Sampled<br />
River Oak / Rough-barked Apple<br />
Forest<br />
River Red Gum Woodland<br />
Yellow Box / Blakely’s Red Gum /<br />
Rough-barked Apple Forest<br />
Coast Banksia / Rough-barked<br />
Apple / Blakely’s Red Gum Forest<br />
(Warkworth Sands Woodland EEC)<br />
Narrow-leaf Ironbark / Grey Box /<br />
Bulloak / Honeymyrtle Forest<br />
Spotted Gum / Narrow-leaf Ironbark<br />
/ Bulloak / Paperbark Forest<br />
Slaty Gum / Narrow-leaf Ironbark /<br />
Bulloak / Paperbark Forest<br />
Grey Gum / Narrow-leaf Ironbark /<br />
Bulloak / Honeymyrtle Forest<br />
White Mahogany / Rough-barked<br />
Apple Forest<br />
Brush Wilga/Native Olive Shrubland<br />
Flora<br />
Monitoring<br />
Plot<br />
2007 2008 2009 2010 <strong>2011</strong> Average<br />
V1-A1 11 -10 14 -14 17 4<br />
V1-A2 18 5 -15 -2 9 3<br />
V1-B1 9 -16 -5 0 0 -2<br />
V1-B2 4 -10 17 -17 2 -1<br />
V1-B3 5 -23 2 30 1 3<br />
V2-A1 -3 0 -3 -1 17 2<br />
V2-B1 5 1 -1 13 -1 3<br />
V2-B2 -3 2 5 -5 7 1<br />
V3-B1 0 7 0 -5 5 1<br />
V5-B1 6 -1 -6 -10 13 0<br />
V5-B2 8 -4 1 -1 2 1<br />
V5-B3 0 0 1 -6 7 0<br />
V5-B4 -10 -5 -2 -6<br />
V6-A1c 5 -2 7 -2 -9 0<br />
V6-A3 16 -2 -7 4 -14 -1<br />
V6-B1 3 2 5 1 0 2<br />
V6-B1c -6 3 1 -1 -3 -1<br />
V6-B2 2 5 -4 2 0 1<br />
V6-B2c -3 1 0 -1 3 0<br />
V6-B3 17 -5 -3 -1 4 2<br />
V6-B4 -4 -2 17 4<br />
V9-A1 3 3 0 -3 -1 0<br />
V9-B1 0 0 0 2 3 1<br />
V9-B2 0 2 1 -1 3 1<br />
V10-A1 1 3 0 3 3 2<br />
V10-A2 -4 9 -1 1 1 1<br />
V10-B2 2 0 -1 1 -2 0<br />
V10-B3 N/A -2 -2<br />
V11-B1 -1 0 4 -1 1 1<br />
V11-B2 11 0 -9 1 2 1<br />
V13-B1 10 1 1 -3 4 3<br />
V14-A1 14 -3 -2 1 6 3<br />
V14-B1 13 0 -19 -1 13 1<br />
V14-B2 13 -4 -7 7 -3 1<br />
<strong>2011</strong> Annual Ecological Monitoring Report, Final Report, May <strong>2012</strong> Page 43
Appendix B<br />
Flora Quadrat Data<br />
<strong>2011</strong> Annual Ecological Monitoring Report, Final Report, May <strong>2012</strong> Page 44
Plot: V1-A1<br />
Flora Species<br />
Braun Blanquet<br />
Cover ('11)<br />
Casuarina cunninghamiana subsp. cunninghamiana 4<br />
Ehrharta erecta* 4<br />
Galenia pubescens* 4<br />
Bothriochloa decipiens -<br />
Austrostipa ramosissima 2<br />
Bromus catharticus 1<br />
Cerastium glomeratum* 2<br />
Cheilanthes distans -<br />
Echinopogon caespitosus var. caespitosus -<br />
Echium plantagineum* 2<br />
Einadia hastata 2<br />
Euchiton involucratus -<br />
Heliotropium amplexicaule* 2<br />
Lolium rigidum* 1<br />
Oxalis radicosa 2<br />
Pavonia hastata* 2<br />
Petrorhagia nanteuilii 2<br />
Plantago lanceolata* 2<br />
Rumex acetosella 1<br />
Senecio madagascariensis* 2<br />
Acacia decurrens 1<br />
Anagallis arvensis* 1<br />
Commelina cyanea -<br />
Conyza sumatrensis* 1<br />
Hypochaeris radicata* 1<br />
Juncus usitatus 1<br />
Microlaena stipoides 1<br />
Opuntia aurantiaca* 1<br />
Phragmites australis 1<br />
Verbena rigida 2<br />
Bromus diandrus 2<br />
Cynodon dactylon 4<br />
Sonchus oleraceus 1<br />
Oenothera glazioviana 1<br />
<strong>2011</strong> Annual Ecological Monitoring Report, Final Report, May <strong>2012</strong> Page 45
Plot: V1-A2<br />
Flora Species<br />
Braun Blanquet<br />
Cover ('11)<br />
Acacia decurrens 4<br />
Casuarina cunninghamiana subsp. cunninghamiana 4<br />
Ehrharta erecta* 4<br />
Galenia pubescens* 4<br />
Cynodon dactylon 3<br />
Echium plantagineum* 3<br />
Austrostipa ramosissima 2<br />
Calystegia marginata 2<br />
Cerastium glomeratum 2<br />
Heliotropium amplexicaule* 2<br />
Lolium rigidum* 2<br />
Oxalis radicosa 2<br />
Petrorhagia nanteuilii 2<br />
Senecio madagascariensis* 2<br />
Silene gallica* 2<br />
Anagallis arvensis* 1<br />
Bromus catharticus* 1<br />
Cayratia clematidea 1<br />
Dodonaea viscosa subsp. cuneata 1<br />
Leptospermum sp. -<br />
Lomandra longifolia -<br />
Lycium ferocissimum* 1<br />
Pavonia hastata* 1<br />
Phragmites australis 1<br />
Rumex brownii 1<br />
Sonchus oleraceus* 1<br />
Sonchus oleraceus* 1<br />
Verbascum virgatum* 1<br />
Gomphocarpus fruticosis 1<br />
<strong>2011</strong> Annual Ecological Monitoring Report, Final Report, May <strong>2012</strong> Page 46
Plot: V1-B1<br />
Flora Species<br />
Braun Blanquet<br />
Cover ('11)<br />
Entolasia marginata 6<br />
Breynia oblongifolia 3<br />
Cardiospermum grandiflorum* 3<br />
Cerastium glomeratum* 2<br />
Clematis glycinoides 2<br />
Stephania japonica 2<br />
Wahlenbergia luteola -<br />
Oplismenus aemulus 2<br />
Solanum nigrum* 1<br />
Cardiospermum grandiflorum* 3<br />
Leptospermum sp. 4<br />
Heliotropium amplexicaule 4<br />
Casuarina cunninghamiana 3<br />
Lomandra longifolia 2<br />
Verbascum virgatum 1<br />
Chloris truncata 3<br />
Oxalis sp. 3<br />
Rumex brownii 2<br />
Opuntia stricta 1<br />
Plantago lanceolata 2<br />
Microlaena stipoides 2<br />
Grevillea robusta 3<br />
Stephania japonica 2<br />
Phragmites australis 1<br />
Backhousia myrtifolia 1<br />
Sonchus oleraceus 2<br />
Sida corrugata 2<br />
Cynodon dactylon 2<br />
Cheilanthes sieberi ssp. sieberi 1<br />
Anagallis arvensis 1<br />
Acacia parramattensis 1<br />
<strong>2011</strong> Annual Ecological Monitoring Report, Final Report, May <strong>2012</strong> Page 47
Plot: V1-B2<br />
Flora Species<br />
Braun Blanquet<br />
Cover ('11)<br />
Ehrharta erecta* 5<br />
Dichelachne micrantha 1<br />
Euchiton involucratus 1<br />
Heliotropium amplexicaule 2<br />
Galenia pubescens 2<br />
Aristida ramosissima 2<br />
Rubus parvifolius 2<br />
Casuarina cunninghamiana 4<br />
Melaleuca sp. 2<br />
Oplismenus aemulus 3<br />
Acacia parramattensis 1<br />
Cooba 1<br />
Sida corrugata 4<br />
Phragmites australis 2<br />
Backhousia myrtifolia 1<br />
Echinopogon ovatus 1<br />
Plantago lanceolata 2<br />
Wahlenbergia sp. 2<br />
Chrysocephalum apiculatum 2<br />
Rumex brownii 2<br />
Senecio madagascariensis 2<br />
Echium plantagineum* 2<br />
Cerastium glomeratum 2<br />
Oxalis sp. 1<br />
Verbascum thapsus* 2<br />
<strong>2011</strong> Annual Ecological Monitoring Report, Final Report, May <strong>2012</strong> Page 48
Plot: V1-B3<br />
Flora Species<br />
Braun Blanquet<br />
Cover ('11)<br />
Leptospermum sp. 6<br />
Bromus catharticus* 4<br />
Heliotropum amplexicaule* 4<br />
Acacia parramattensis 3<br />
Casuarina cunninghamiana subsp. cunninghamiana 3<br />
Anagallis arvensis* 2<br />
Apium leptophyllum* -<br />
Austrostipa verticillata 2<br />
Briza major* 2<br />
Crassula sieberiana subsp. sieberiana 2<br />
Echinopogon caespitosus 2<br />
Echium plantagineum* 2<br />
Euchiton involucratus 2<br />
Hypochaeris radicata* 2<br />
Oenothera stricta* 2<br />
Pavonia hastata* 2<br />
Petrorhagia nanteuilii -<br />
Cheilanthes distans -<br />
Chrysocephalum apiculatum 1<br />
Galenia pubescens* 1<br />
Opuntia stricta* 2<br />
Oxalis radicosa 1<br />
Salvia vebenacea* -<br />
Senecio madagascariensis* 1<br />
Spartothamnella juncea -<br />
Trifolium campestre* 1<br />
Rumex brownii 1<br />
Commelina cyanea 1<br />
Oplismenus aemulus 2<br />
Entolasia marginata 1<br />
Sonchus oleraceus 1<br />
Paspalum urvillei 1<br />
Microlaena stipoides 2<br />
Briza subaristata 2<br />
Cardiospermum grandiflorum 3<br />
Leptospermum sp. 6<br />
Bromus catharticus* 4<br />
Heliotropum amplexicaule* 4<br />
<strong>2011</strong> Annual Ecological Monitoring Report, Final Report, May <strong>2012</strong> Page 49
Plot: V2 - A1<br />
Flora Species<br />
Braun Blanquet<br />
Cover ('11)<br />
Cynodon dactylon 4<br />
Richardia humistrata* 4<br />
Petrorhagia nanteuilii* 3<br />
Plantago lanceolata* 3<br />
Anagallis arvensis* 2<br />
Briza minor* 2<br />
Cerastium glomeratum* 2<br />
Dichelachne micrantha 2<br />
Eucalyptus camaldulensis (dead) 2<br />
Oenothera stricta* 2<br />
Oxalis radicosa 2<br />
Rumex crispus* 2<br />
Senecio madagascariensis* 2<br />
Setaria gracilis* 2<br />
Silene gallica 2<br />
Acacia decurrens 1<br />
Cheilanthes sieberi subsp. sieberi 1<br />
Chrysocephalum apiculatum 1<br />
Eragrostis leptostachya 1<br />
Facelis retusa 1<br />
Verbena rigida* 1<br />
<strong>2011</strong> Annual Ecological Monitoring Report, Final Report, May <strong>2012</strong> Page 50
Plot: V2-B1<br />
Flora Species<br />
Braun Blanquet<br />
Cover ('11)<br />
Galenia pubescens* 5<br />
Heliotropium amplexicaule* 5<br />
Acacia decurrens 4<br />
Eucalyptus camaldulensis 4<br />
Senecio madagascariensis* 3<br />
Briza minor*<br />
Cheilanthes sieberi subsp. sieberi 2<br />
Einadia hastata 1<br />
Lolium perenne* 2<br />
Opuntia stricta var. stricta* 2<br />
Oxalis radicosa 3<br />
Panicum effusum 2<br />
Pavonia hastata* 2<br />
Petrorhagia nanteuilii* 2<br />
Setaria gracilis* 2<br />
Sida rhombifolia* 2<br />
Vulpia myuros* 2<br />
Amyema pendula 1<br />
Anagallis arvensis* 2<br />
Austrostipa ramosissima 1<br />
Cerastium glomeratum* 1<br />
Opuntia aurantica* 1<br />
Plantago lanceolata* 1<br />
Senecio quadrentata* 1<br />
Solanum nigrum*<br />
Sonchus oleraceus* 1<br />
Verbascum virgatum* 1<br />
Hypochaeris radicata* 1<br />
Cynodon dactylon 3<br />
Austrostipa sp. 1<br />
Acetosella vulgaris 2<br />
Centaurium erythraea 2<br />
Trifolium arvense* 1<br />
<strong>2011</strong> Annual Ecological Monitoring Report, Final Report, May <strong>2012</strong> Page 51
Plot: V2-B2<br />
Flora Species<br />
Braun Blanquet<br />
Cover ('11)<br />
Microlaena stipoides var. stipoides 4<br />
Acacia filicifolia 3<br />
Cerastium glomeratum* 3<br />
Eucalyptus camaldulensis 3<br />
Exocarpos strictus 3<br />
Heliotropium amplexicaule* 3<br />
Pavonia hastata* 3<br />
Anagallis arvensis* 2<br />
Briza minor* -<br />
Cheilanthes sieberi 2<br />
Cynodon dactylon 2<br />
Dichondra repens 2<br />
Einadia hastata 2<br />
Galenia pubescens* 2<br />
Opuntia stricta var. stricta* 2<br />
Oxalis radicosa 2<br />
Petrorhagia nanteuilii* 2<br />
Plantago debilis 2<br />
Plantago lanceolata* 2<br />
Senecio madagascariensis* 2<br />
Wahlenbergia communis 2<br />
Chrysocephalum apiculatum 1<br />
Cynoglossum australe -<br />
Dianella revoluta 1<br />
Glycine clandestina 1<br />
Notelaea microcarpa var. microcarpa 1<br />
Olea europaea* 1<br />
Rumex acetosella * 1<br />
Bromus molliformis 1<br />
Setaria pumila 1<br />
Aristida ramosa 1<br />
Verbena rigida 1<br />
Briza subaristata 1<br />
Sonchus oleraceus 2<br />
<strong>2011</strong> Annual Ecological Monitoring Report, Final Report, May <strong>2012</strong> Page 52
Plot: V3-B1<br />
Flora Species<br />
Braun Blanquet<br />
Cover ('11)<br />
Cynodon dactylon 4<br />
Juncus mollis 4<br />
Melaleuca thymifolia 1<br />
Eucalyptus blakelyi 3<br />
Eucalyptus melliodora 3<br />
Cirsium vulgare* 1<br />
Gamochaeta spicata* 2<br />
Pavonia hastata* 2<br />
Senecio madagascariensis* 2<br />
Wahlenbergia gracilis 2<br />
Cyperus gunnii 1<br />
Digitaria porrecta<br />
Eucalyptus crebra 1<br />
Juncus subsecundus<br />
Lepidium africanum* 2<br />
Lomandra multiflora subsp. multiflora 1<br />
Notelaea microcarpa var. microcarpa 1<br />
Oxalis radicosa 1<br />
Vittadinia sp. 1<br />
Glycine clandestina 1<br />
Dichondra repens 1<br />
Centaurium erythraea* 2<br />
Austrostipa sp. 1<br />
Aristida ramosa 3<br />
Hypochaeris radicata 2<br />
Glycine tabacina 2<br />
Euchiton gymnocephalus 1<br />
Plantago lanceolata 1<br />
Cheilanthes sieberi 1<br />
Cymbopogon refractus 1<br />
Heliotropium amplexicaule 1<br />
Cyclospermum leptophyllum* 1<br />
Fimbristylis dichotoma 2<br />
Tricoryne elatior 2<br />
Microtis sp. 1<br />
<strong>2011</strong> Annual Ecological Monitoring Report, Final Report, May <strong>2012</strong> Page 53
Plot: V5-B1<br />
Flora Species<br />
Braun Blanquet<br />
Cover ('11)<br />
Angophora floribunda 4<br />
Pteridium esculentum 4<br />
Pimelea linifolia subsp. linifolia 2<br />
Anagallis arvensis* 2<br />
Aristida ramosa 2<br />
Breynia oblongifolia 2<br />
Einadia hastata 2<br />
Glycine clandestina 2<br />
Glycine clandestina<br />
Hibbertia linearis 2<br />
Hibbertia obtusifolia 2<br />
Hypochoeris radicata* 2<br />
Imperata cylindrica var. major 3<br />
Lomandra longifolia -<br />
Oxalis radicosa 2<br />
Panicum sp. 2<br />
Senecio madagascariensis* 2<br />
Wahlenbergia communis 2<br />
Acacia filicifolia 1<br />
Anagallis arvensis subsp. caerulea* 1<br />
Aristida ramosa 1<br />
Aristida vagans 1<br />
Austrostipa pubescens 1<br />
Banksia integrifolia subsp. integrifolia 2<br />
Brachyloma daphnoides 1<br />
Cyperus polystachyos 1<br />
Eucalyptus tereticornis 1<br />
Euchiton involucratus 1<br />
Galenia pubescens 1<br />
Glycine tabacina 1<br />
Hibiscus heterophyllus -<br />
Juncus continuus 1<br />
Lagenifera stipitata 1<br />
Lomandra multiflora subsp. multiflora 1<br />
Opuntia aurantiaca* -<br />
Opuntia stricta var. stricta* 2<br />
Verbena bonariensis 1<br />
Conyza sumatrensis 1<br />
Exocarpos cupressiformis 1<br />
Taraxacum officinale 1<br />
<strong>2011</strong> Annual Ecological Monitoring Report, Final Report, May <strong>2012</strong> Page 54
Plot: V5-B2<br />
Flora Species<br />
Braun Blanquet<br />
Cover ('11)<br />
Angophora floribunda 5<br />
Microlaena stipoides 5<br />
Pteridium esculentum 4<br />
Banksia integrifolia subsp. integrifolia 3<br />
Breynia oblongifolia 3<br />
Dichondra repens 3<br />
Lomandra longifolia 3<br />
Dianella longifolia 2<br />
Dichelachne micrantha 2<br />
Einadia hastata 2<br />
Imperata cylindrica var. major 3<br />
Juncus mollis 2<br />
Lomandra multiflora subsp. multiflora 2<br />
Melinus repens* 2<br />
Oxalis radicosa 2<br />
Themeda australis 2<br />
Acacia filicifolia -<br />
Brachychiton populneus subsp. populneus 1<br />
Cheilanthes sieberi -<br />
Conyza bonariensis* 1<br />
Cyclospermum leptophyllum* 1<br />
Dianthus armeria* 1<br />
Euchiton involucratus 1<br />
Gahnia aspera 2<br />
Galenia pubescens* 1<br />
Glycine clandestina 1<br />
Hibbertia linearis 1<br />
Lomandra filiformis subsp. filiformis 1<br />
Notelaea microcarpa var. microcarpa 1<br />
Opuntia aurantiaca* -<br />
Opuntia stricta var. stricta* 1<br />
Petrorhagia nanteuilii -<br />
Solanum nigrum* 1<br />
Themeda australis 1<br />
Sonchus oleraceus 1<br />
Pimelea linifolia 1<br />
Tagetes minuta 2<br />
Cynodon dactylon 1<br />
Oplismenus aemulus 1<br />
Hibbertia obtusifolia 1<br />
Veronica plebeia 1<br />
<strong>2011</strong> Annual Ecological Monitoring Report, Final Report, May <strong>2012</strong> Page 55
Plot: V5-B3<br />
Flora Species<br />
Braun Blanquet<br />
Cover ('11)<br />
Lomandra longifolia 4<br />
Acacia filicifolia 3<br />
Allocasuarina luehmannii 3<br />
Aristida vagans 2<br />
Angophora floribunda 2<br />
Aristida ramosa 2<br />
Banksia integrifolia subsp. integrifolia 2<br />
Cynodon dactylon 2<br />
Dianella longifolia 2<br />
Einadia hastata 2<br />
Euchiton involucratus 2<br />
Grevillea montana 2<br />
Hibbertia linearis 2<br />
Lomandra multiflora subsp. multiflora -<br />
Notelaea microcarpa var. microcarpa 2<br />
Pimelea linifolia 2<br />
Pteridium esculentum 2<br />
Austrostipa scabra -<br />
Brachyloma daphnoides 1<br />
Chrysocephalum apiculatum 1<br />
Conospermum ellipticum 1<br />
Dianella revoluta var. revoluta 1<br />
Eragrostis leptostachya -<br />
Eucalyptus tereticornis 1<br />
Grevillea arenaria subsp. arenaria 1<br />
Isopogon anemonifolius 3<br />
Opuntia stricta var. stricta* 1<br />
Persoonia linearis 1<br />
Wahlenbergia communis -<br />
Wahlenbergia gracilis -<br />
Glycine clandestina 1<br />
Melinus repens* 1<br />
Oxalis sp. 2<br />
Themeda australis 2<br />
Breynia oblongifolia 1<br />
Hypochaeris radicata 1<br />
Lomandra sp. 2<br />
Oplismenus aemulus 2<br />
<strong>2011</strong> Annual Ecological Monitoring Report, Final Report, May <strong>2012</strong> Page 56
Plot: V5-B4<br />
Flora Species<br />
Braun Blanquet<br />
Cover ('11)<br />
Angophora floribunda 4<br />
Melinis repens* 4<br />
Allocasuarina littoralis 3<br />
Aristida ramosa 3<br />
Hibbertia linearis 3<br />
Aristida vagans 2<br />
Cheilanthes sieberi 2<br />
Chrysocephalum apiculatum 2<br />
Cynodon dactylon 3<br />
Glycine tabacina<br />
Hypochaeris radicata* 2<br />
Juncus mollis 2<br />
Laxmannia gracilis<br />
Lomandra filiformis subsp. coriacea 2<br />
Lomandra multiflora subsp. multiflora 1<br />
Pimelea linifolia 1<br />
Acacia filicifolia 1<br />
Allocasuarina luehmannii 1<br />
Amyema congener subsp. congener<br />
Banksia integrifolia subsp. integrifolia 1<br />
Brachyloma daphnoides 1<br />
Cymbopogon refractus<br />
Dianella longifolia 1<br />
Dichelachne crinita 1<br />
Entolasia stricta<br />
Eragrostis brownii<br />
Glycine clandestina 1<br />
Opuntia stricta var. stricta* 2<br />
Oxalis radicosa 1<br />
Wahlenbergia communis 2<br />
Notelaea microcarpa 1<br />
Lomandra confertifolia 2<br />
Commelina cyanea 1<br />
Zornia dyctiocarpa 1<br />
<strong>2011</strong> Annual Ecological Monitoring Report, Final Report, May <strong>2012</strong> Page 57
Plot: V6-A1c<br />
Flora Species<br />
Braun Blanquet<br />
Cover ('11)<br />
Dodonaea viscosa subsp. cuneata -<br />
Eucalyptus crebra 4<br />
Melaleuca decora -<br />
Notelaea microcarpa var. microcarpa 3<br />
Aristida vagans -<br />
Austrostipa scabra subsp. falcata 3<br />
Brachycome multifida -<br />
Cheilanthes distans 3<br />
Cymbopogon refractus 1<br />
Desmodium brachypodum 2<br />
Eucalyptus moluccana 2<br />
Lomandra confertifolia subsp. pallida -<br />
Opuntia stricta var. stricta* 1<br />
Spartothamnella juncea 2<br />
Vittadinia sulcata 2<br />
Amyema congener subsp. congener -<br />
Amyema pendulum -<br />
Breynia oblongifolia -<br />
Calotis lappulacea -<br />
Choretrum candollei 1<br />
Desmodium varians 2<br />
Dichondra repens 2<br />
Einadia hastata 1<br />
Einadia nutans -<br />
Eragrostis leptostachya -<br />
Eremophila debilis -<br />
Glycine tabacina 1<br />
Lomandra multiflora subsp. multiflora -<br />
Olearia elliptica 4<br />
Pavonia hastata* -<br />
Petrorhagia nanteuilii* -<br />
Senecio madagascariensis* -<br />
Sida corrugata -<br />
Solanum stelligerum -<br />
Eucalyptus dawsonii 1<br />
Austrodanthonia fulva 2<br />
Bursaria spinosa 2<br />
Cheilanthes sieberi 1<br />
Calotis lappulacea 1<br />
Austrostipa verticillata 2<br />
Commelina cyanea 1<br />
Glycine clandestina 1<br />
Allocasuarina luehmannii 1<br />
Plantago debilis 1<br />
Gahnia aspera 1<br />
Oxalis radicata 1<br />
Poa sieberiana 2<br />
Scutellaria humilis 1<br />
Brunoniella pumilio 2<br />
<strong>2011</strong> Annual Ecological Monitoring Report, Final Report, May <strong>2012</strong> Page 58
Plot: V6-A3<br />
Flora Species<br />
Braun Blanquet<br />
Cover ('11)<br />
Eucalyptus moluccana 4<br />
Allocasuarina luehmannii 3<br />
Cymbopogon refractus -<br />
Einadia nutans -<br />
Enchylaena tomentosa 2<br />
Eremophila debilis -<br />
Amyema pendulum -<br />
Anagallis arvensis* -<br />
Aristida ramosa 3<br />
Aristida vagans -<br />
Brunoniella australis 2<br />
Calotis hispidula 2<br />
Cheilanthes sieberi 1<br />
Chloris ventricosa -<br />
Cyperus polystachyos 2<br />
Dianella longifolia -<br />
Dichelachne crinita -<br />
Glycine clandestina 1<br />
Lomandra filiformis subsp. filiformis -<br />
Lomandra multiflora -<br />
Melaleuca decora -<br />
Oxalis chnoodes -<br />
Sclerolaena muricata -<br />
Senecio madagascariensis* -<br />
Sida rhombifolia* -<br />
Solanum campanulatum -<br />
Solanum stelligerum -<br />
Sporobolus elongatus -<br />
Trifolium subterraneum* -<br />
Glycine tabacina 2<br />
Desmodium varians 2<br />
Themeda australis 2<br />
Commelina cyanea 1<br />
Austrostipa verticillata 2<br />
Austrodanthonia fulva 1<br />
Daviesia genistifolia 4<br />
Acacia amblygona 2<br />
Chrysocephalum apiculatum 2<br />
Acacia implexa 1<br />
Wahlenbergia communis 1<br />
Dianella revoluta 1<br />
Brachycome angustifolia 2<br />
<strong>2011</strong> Annual Ecological Monitoring Report, Final Report, May <strong>2012</strong> Page 59
Plot: V6-B1<br />
Flora Species<br />
Braun Blanquet<br />
Cover ('11)<br />
Melaleuca decora 4<br />
Allocasuarina luehmannii 3<br />
Cheilanthes sieberi subsp. sieberi 2<br />
Dichondra repens 3<br />
Eucalyptus moluccana 3<br />
Calotis lappulacea 2<br />
Cheilanthes distans 2<br />
Einadia hastata 1<br />
Lomandra confertifolia subsp. pallida 1<br />
Lomandra filiformis 1<br />
Opuntia stricta* 1<br />
Oxalis radicosa 2<br />
Vittadinia sulcata 2<br />
Acacia amblygona 1<br />
Chloris ventricosa 1<br />
Crassula sieberiana -<br />
Cymbopogon refractus 1<br />
Cynodon dactylon 2<br />
Dianella revoluta var. revoluta 1<br />
Eragrostis brownii 1<br />
Eucalyptus crebra 1<br />
Heliotropium amplexicaule* 2<br />
Notelaea microcarpa var. microcarpa 1<br />
Opuntia aurantica* 1<br />
Senecio madagascariensis* 1<br />
Sporobolus creber* 1<br />
Veronica plebia 1<br />
Wahlenbergia communis -<br />
Wahlenbergia gracilis -<br />
Desmodium varians 2<br />
Sonchus oleraceus 1<br />
Cyperus. sp 1<br />
<strong>2011</strong> Annual Ecological Monitoring Report, Final Report, May <strong>2012</strong> Page 60
Plot: V6-B1c<br />
Flora Species<br />
Braun Blanquet<br />
Cover ('11)<br />
Allocasuarina luehmannii 4<br />
Austrostipa scabra subsp. scabra 4<br />
Eucalyptus crebra 4<br />
Melaleuca decora 4<br />
Olearia elliptica 4<br />
Acacia binervia -<br />
Bursaria spinosa 2<br />
Cymbopogon refractus 2<br />
Desmodium brachypodum 2<br />
Dodonaea viscosa subsp. cuneata 1<br />
Goodenia rotundifolia 2<br />
Notelaea microcarpa var. microcarpa 1<br />
Acacia amblygona -<br />
Acacia doratoxylon -<br />
Aristida vagans 1<br />
Arthropodium milleflorum 1<br />
Austrodanthonia fulva 1<br />
Bertya oleifolia 1<br />
Breynia oblongifolia -<br />
Cheilanthes distans -<br />
Cheilanthes sieberi subsp. sieberi 1<br />
Chloris divaricata -<br />
Choretrum candollei 1<br />
Crassula sieberiana 1<br />
Desmodium varians 1<br />
Dianella prunina -<br />
Dianella revoluta var. revoluta 1<br />
Fimbristylis dichotoma 1<br />
Lomandra confertifolia subsp. pallida -<br />
Lomandra filiformis subsp. coriacea 1<br />
Lomandra multiflora subsp. multiflora -<br />
Macrozamia flexuosa 1<br />
Opuntia stricta var. stricta* 2<br />
Panicum effusum* -<br />
Pavonia hastata* -<br />
Plantago debilis 1<br />
Senecio madagascariensis* 1<br />
Sida corrugata 1<br />
Veronica plebeia 1<br />
Glycine tabacina 1<br />
Eragrostis sp 1<br />
Xanthosia tridentata 1<br />
<strong>2011</strong> Annual Ecological Monitoring Report, Final Report, May <strong>2012</strong> Page 61
Plot: V6-B2<br />
Flora Species<br />
Braun Blanquet<br />
Cover ('11)<br />
Eucalyptus moluccana 4<br />
Melaleuca decora 4<br />
Olearia elliptica 4<br />
Dichondra repens 3<br />
Aristida ramosa 2<br />
Brachychiton populneus subsp. populneus 2<br />
Calotis lappulacea 2<br />
Chloris ventricosa 2<br />
Einadia hastata 2<br />
Notelaea microcarpa var. microcarpa 2<br />
Spartothamnella juncea 2<br />
Vittadinia sulcata 2<br />
Allocasuarina luehmannii 1<br />
Austrodanthonia ramosissima 1<br />
Austrostipa scabra 1<br />
Caesia parviflora 1<br />
Calotis cuneata 2<br />
Cheilanthes distans 1<br />
Cheilanthes sieberi 1<br />
Lomandra confertifolia subsp. pallida 1<br />
Lomandra filiformis subsp. filiformis -<br />
Opuntia aurantiaca* 1<br />
Opuntia stricta var. stricta* 1<br />
Panicum effusum 1<br />
Plantago debilis 1<br />
Senecio madagascariensis* 2<br />
Cirsium vulgare 2<br />
Gamochaeta coarctata 2<br />
Pratia purpurascens 2<br />
Cymbopogon refractus 2<br />
Desmodium varians 1<br />
Themeda australis 2<br />
Entolasia stricta 1<br />
Aristida vagans 1<br />
Desmodium brachypodum 1<br />
Notodanthonia longifolia 1<br />
Breynia oblongifolia 1<br />
<strong>2011</strong> Annual Ecological Monitoring Report, Final Report, May <strong>2012</strong> Page 62
Plot: V6-B2c<br />
Flora Species<br />
Braun<br />
Blanquet Cover<br />
('11)<br />
Eucalyptus crebra 4<br />
Allocasuarina luehmannii 3<br />
Acacia amblygona 2<br />
Aristida vagans 2<br />
Austrodanthonia fulva 2<br />
Cymbopogon refractus 2<br />
Dianella revoluta var. revoluta 2<br />
Dichondra repens 2<br />
Eremophila debilis 2<br />
Eucalyptus moluccana 2<br />
Lomandra multiflora subsp. multiflora 2<br />
Notelaea microcarpa var. microcarpa 2<br />
Senecio madagascariensis* 2<br />
Acacia doratoxylon 1<br />
Acacia longifolia 1<br />
Brunoniella australis 1<br />
Cheilanthes distans 1<br />
Cheilanthes sieberi subsp. sieberi 1<br />
Chrysocephalum apiculatum 1<br />
Cyperus gracilis -<br />
Desmodium varians 1<br />
Dianella longifolia 1<br />
Dianella prunina 1<br />
Dillwynia acicularis 1<br />
Einadia hastata 1<br />
Einadia nutans 1<br />
Glycine clandestina 1<br />
Glycine tabacina -<br />
Lomandra filiformis subsp. coriacea 1<br />
Olearia elliptica 1<br />
Opuntia stricta var. stricta* 1<br />
Panicum effusum 1<br />
Paspalidium distans 1<br />
Vittadinia sulcata 1<br />
Wahlenbergia communis 1<br />
Wahlenbergia gracilis -<br />
Sida corrugata 1<br />
Cirsium vulgare 1<br />
Stackhousia viminea 1<br />
Melaleuca decora 1<br />
<strong>2011</strong> Annual Ecological Monitoring Report, Final Report, May <strong>2012</strong> Page 63
Plot: V6-B3<br />
Flora Species<br />
Braun Blanquet<br />
Cover ('11)<br />
Dichondra repens 4<br />
Cynodon dactylon 3<br />
Eucalyptus moluccana 3<br />
Melaleuca decora 3<br />
Allocasuarina luehmannii 2<br />
Aristida ramosa 2<br />
Austrostipa pubescens 2<br />
Austrostipa verticillata 2<br />
Cheilanthes distans 2<br />
Cheilanthes sieberi subsp. sieberi 2<br />
Chloris truncata 1<br />
Desmodium brachypodum 2<br />
Einadia hastata 2<br />
Eucalyptus crebra 2<br />
Heliotropium amplexicaule* 2<br />
Oxalis radicosa 1<br />
Senecio madagascariensis* 1<br />
Senecio quadridentatus 1<br />
Solanum prinophyllum 2<br />
Acacia salicina 1<br />
Aristida ramosa 1<br />
Aristida vagans 1<br />
Arthropodium milleflorum 1<br />
Asperula conferta -<br />
Austrostipa scabra subsp. scabra 1<br />
Brunoniella australis 1<br />
Calotis cuneifolia 1<br />
Calotis lappulacea 1<br />
Carex inversa 2<br />
Chloris ventricosa 1<br />
Cymbopogon refractus 1<br />
Desmodium varians 1<br />
Lomandra longifolia 1<br />
Opuntia aurantiaca* 1<br />
Opuntia stricta var. stricta* 1<br />
Vittadinia sulcata 1<br />
Wahlenbergia gracilis -<br />
Glycine tabacina 1<br />
Cirsium vulgare 1<br />
Cyclospermum leptophyllum* 1<br />
Euchiton gymnocephalus 1<br />
Commelina cyanea 1<br />
Cyperus sp. 2<br />
<strong>2011</strong> Annual Ecological Monitoring Report, Final Report, May <strong>2012</strong> Page 64
Plot: V6-B4<br />
Flora Species<br />
Braun Blanquet<br />
Cover ('11)<br />
Allocasuarina luehmannii 5<br />
Aristida ramosa 3<br />
Amyema linophyllum -<br />
Aristida vagans -<br />
Cheilanthes sieberi subsp. sieberi 2<br />
Lomandra confertifolia subsp. pallida -<br />
Austrodanthonia fulva -<br />
Chrysocephalum apiculatum -<br />
Cynodon dactylon 2<br />
Dianella revoluta var. revoluta -<br />
Einadia hastata -<br />
Glycine clandestina -<br />
Laxmannia gracilis -<br />
Lomandra filiformis subsp. filiformis -<br />
Lomandra multiflora subsp. multiflora -<br />
Melaleuca decora 1<br />
Opuntia stricta var. stricta* 2<br />
Pimelea linifolia subsp. linifolia -<br />
Senecio madagascariensis* -<br />
Wahlenbergia gracilis 1<br />
Commelina cyanea 1<br />
Sonchus oleraceus 1<br />
Oxalis radicata 1<br />
Opuntia aurantiaca* 1<br />
<strong>2011</strong> Annual Ecological Monitoring Report, Final Report, May <strong>2012</strong> Page 65
Plot: V9-A1<br />
Flora Species<br />
Braun Blanquet<br />
Cover ('11)<br />
Allocasuarina luehmannii 5<br />
Dodonaea viscosa subsp. cuneata 4<br />
Melaleuca decora 4<br />
Corymbia maculata 3<br />
Entolasia stricta 3<br />
Eucalyptus crebra 3<br />
Acacia gunnii 2<br />
Aristida vagans 2<br />
Cheilanthes distans -<br />
Cheilanthes sieberi subsp. sieberi 2<br />
Cyperus gracilis 2<br />
Dianella revoluta var. revoluta 2<br />
Indigofera australis 2<br />
Opuntia stricta var. stricta* 3<br />
Senecio madagascariensis* 2<br />
Acacia browneii 1<br />
Acacia implexa 1<br />
Aristida ramosa 1<br />
Crassula sieberiana 1<br />
Cymbopogon refractus 1<br />
Einadia hastata 1<br />
Eragrostis benthamii 1<br />
Eragrostis leptostachya 1<br />
Glycine tabacina 1<br />
Goodenia rotundifolia 1<br />
Lomandra filiformis subsp. filiformis 1<br />
Oxalis chnoodes 1<br />
Dichondra repens 2<br />
Echinopogon caespitosus 2<br />
Juncus continuus 1<br />
Oplismenus aemulus 2<br />
Glycine clandestina 1<br />
<strong>2011</strong> Annual Ecological Monitoring Report, Final Report, May <strong>2012</strong> Page 66
Plot: V9-B1<br />
Flora Species<br />
Braun Blanquet<br />
Cover ('11)<br />
Melaleuca decora 4<br />
Aristida vagans 3<br />
Bursaria spinosa 3<br />
Choretrum candollei 3<br />
Corymbia maculata 3<br />
Eucalyptus crebra 3<br />
Eucalyptus punctata 3<br />
Acacia binervia 2<br />
Dianella prunina 2<br />
Exocarpos strictus 2<br />
Goodenia rotundifolia 2<br />
Indigofera australis 2<br />
Olearia elliptica 2<br />
Wahlenbergia communis 2<br />
Aristida ramosa 1<br />
Breynia oblongifolia 1<br />
Centaurium spicatum 1<br />
Cheilanthes sieberi subsp. sieberi 1<br />
Cymbopogon refractus 1<br />
Cyperus polystachyos -<br />
Dendrophthoe vitellina 1<br />
Desmodium brachypodum 1<br />
Desmodium varians 1<br />
Dianella revoluta var. revoluta 1<br />
Dichondra repens 1<br />
Dodonaea viscosa subsp. cuneata 2<br />
Glycine tabacina 1<br />
Hibbertia obtusifolia 1<br />
Imperata cylindrica 1<br />
Lomandra filiformis subsp. coriacea 1<br />
Lomandra multiflora subsp. multiflora 1<br />
Macrozamia reducta 1<br />
Opuntia stricta 1<br />
Persoonia linearis 1<br />
Pomaderris ferruginea -<br />
Pratia purpurascens 1<br />
Senecio madagascariensis* 1<br />
Sigesbeckia orientalis spp. orientalis* 1<br />
Wahlenbergia gracilis 1<br />
Glycine clandestina 1<br />
Hypericum gramineum 1<br />
Pomax umbellata 1<br />
<strong>2011</strong> Annual Ecological Monitoring Report, Final Report, May <strong>2012</strong> Page 67
Plot: V9-B2<br />
Flora Species<br />
Braun Blanquet<br />
Cover ('11)<br />
Allocasuarina luehmannii 3<br />
Corymbia maculata 3<br />
Dodonaea viscosa subsp. cuneata 3<br />
Olearia elliptica 3<br />
Acacia amblygona 2<br />
Aristida ramosa 2<br />
Aristida vagans 2<br />
Bursaria spinosa 3<br />
Cheilanthes sieberi subsp. sieberi 2<br />
Dianella revoluta var. revoluta 2<br />
Eucalyptus crebra 2<br />
Goodenia rotundifolia -<br />
Grevillea montana -<br />
Lomandra confertifolia subsp. pallida 2<br />
Lomandra filiformis subsp. filiformis 2<br />
Macrozamia reducta 2<br />
Pultenaea spinosa 2<br />
Austrodanthonia fulva 1<br />
Austrostipa scabra subsp. scabra 1<br />
Conyza sumatrensis 1<br />
Cymbopogon refractus 1<br />
Daviesia ulicifolia subsp. ulicifolia 1<br />
Desmodium brachypodum 1<br />
Desmodium varians 1<br />
Einadia hastata 1<br />
Gahnia aspera -<br />
Glycine clandestina 2<br />
Hardenbergia violacea 1<br />
Lomandra multiflora 1<br />
Maytenus silvestris 1<br />
Notelaea microcarpa var. microcarpa 1<br />
Opuntia stricta var. stricta* 1<br />
Oxalis chnoodes 2<br />
Senecio madagascariensis* 1<br />
Solanum stelligerum 1<br />
Spartothamnella juncea 1<br />
Wahlenbergia communis 1<br />
Oxylobium cordifolium 2<br />
Anisopogon avenaceus 1<br />
Goodenia hederacea 2<br />
<strong>2011</strong> Annual Ecological Monitoring Report, Final Report, May <strong>2012</strong> Page 68
Plot: V1--A1<br />
Flora Species<br />
Braun Blanquet<br />
Cover ('11)<br />
Melaleuca decora 5<br />
Bursaria spinosa 3<br />
Eucalyptus dawsonii 3<br />
Aristida vagans 2<br />
Cheilanthes distans 2<br />
Cheilanthes sieberi subsp. sieberi -<br />
Crassula sieberiana 2<br />
Dichondra repens 2<br />
Eragrostis leptostachya 2<br />
Eucalyptus crebra 2<br />
Lomandra filiformis subsp. coriacea 2<br />
Notelaea microcarpa var. microcarpa 2<br />
Vittadinia cuneata var. cuneata 2<br />
Acacia amblygona 1<br />
Acacia binervia 1<br />
Amyema gaudichaudii 1<br />
Anagallis arvensis* 1<br />
Austrostipa ramosissima 1<br />
Austrostipa scabra var. scabra 1<br />
Brachychiton discolor -<br />
Calotis cuneifolia 1<br />
Calotis lappulacea 1<br />
Chloris ventricosa 1<br />
Dianella longifolia -<br />
Einadia hastata 1<br />
Eremophila debilis 1<br />
Gahnia aspera 1<br />
Gamochaeta spicata 1<br />
Glycine clandestina -<br />
Lomandra multiflora subsp. multiflora -<br />
Olearia elliptica 1<br />
Opuntia aurantiaca* 2<br />
Pavonia hastata* 1<br />
Senecio madagascariensis* 1<br />
Veronica plebeia 1<br />
Vittadinia sulcata 1<br />
Wahlenbergia communis 1<br />
Desmodium varians 1<br />
Allocasuarina luehmannii 2<br />
Notodanthonia longifolia 2<br />
Cassinia aculeata 2<br />
Amyema gaudichaudii 2<br />
<strong>2011</strong> Annual Ecological Monitoring Report, Final Report, May <strong>2012</strong> Page 69
Plot: V1--A2<br />
Flora Species<br />
Braun Blanquet<br />
Cover ('11)<br />
Cassinia cunninghamii 4<br />
Bursaria spinosa 3<br />
Eucalyptus crebra 3<br />
Acacia amblygona 2<br />
Anagallis arvensis* 2<br />
Aristida ramosa 2<br />
Austrostipa scabra var. scabra 2<br />
Cheilanthes sieberi subsp. sieberi 2<br />
Crassula sieberiana 2<br />
Cynodon dactylon 2<br />
Goodenia rotundifolia 2<br />
Melaleuca decora 3<br />
Wahlenbergia communis 2<br />
Acacia binervia 1<br />
Anagallis arvensis 2<br />
Aristida vagans 1<br />
Austrodanthonia tenuior 1<br />
Breynia oblongifolia 1<br />
Centaurium erythraea* 1<br />
Choretrum candollei 2<br />
Conyza sumatrensis 1<br />
Cyclospermum leptophyllum* 1<br />
Cymbopogon refractus -<br />
Desmodium varians 1<br />
Dianella revoluta var. revoluta 1<br />
Dichondra repens 2<br />
Einadia hastata 1<br />
Eragrostis brownii 1<br />
Eragrostis leptostachya 1<br />
Gahnia aspera 1<br />
Gamochaeta spicata* 1<br />
Glycine tabacina 1<br />
Grevillea montanum 1<br />
Hibbertia obtusifolia 1<br />
Hypochaeris radicata* 1<br />
Lomandra confertifolia subsp. pallida 1<br />
Lomandra filiformis subsp. coriacea 1<br />
Panicum effusum 1<br />
Senecio madagascariensis* 1<br />
Setaria gracilis* -<br />
Solanum stelligerum 1<br />
Veronica plebia 1<br />
Notodanthonia longifolia 1<br />
Allocasuarina luehmannii 2<br />
Glycine clandestina 2<br />
<strong>2011</strong> Annual Ecological Monitoring Report, Final Report, May <strong>2012</strong> Page 70
Plot: V1--B1<br />
Flora Species<br />
Braun Blanquet<br />
Cover ('11)<br />
Acacia binervia 3<br />
Aristida ramosa 2<br />
Aristida vagans 3<br />
Bursaria spinosa var. spinosa 4<br />
Cheilanthes sieberi subsp. sieberi 3<br />
Choretrum candollei 2<br />
Clematis aristata 1<br />
Corymbia maculata 3<br />
Desmodium varians 2<br />
Dianella prunina 2<br />
Dichondra repens 2<br />
Dodonaea viscosa subsp. cuneata 3<br />
Eucalyptus crebra 2<br />
Eucalyptus punctata 2<br />
Exocarpos cupressiformis 2<br />
Gamochaeta coarctata* 1<br />
Glycine tabacina 1<br />
Goodenia rotundifolia 2<br />
Hibbertia obtusifolia 2<br />
Indigofera australis 1<br />
Lomandra multiflora 1<br />
Macrozamia reducta 1<br />
Melaleuca decora 3<br />
Notelaea microcarpa var. microcarpa 2<br />
Olearia elliptica 2<br />
Oplismenus aemulus 1<br />
Persoonia linearis 2<br />
Pomaderris ferruginea 2<br />
Pomax umbellata 1<br />
Pratia purpurascens 1<br />
Schenkia spicata 2<br />
Wahlenbergia communis 2<br />
Wahlenbergia gracilis 1<br />
Acacia binervia -<br />
Amyema gaudichaudii -<br />
Austrodanthonia fulva -<br />
Breynia oblongifolia -<br />
Cheilanthes distans -<br />
Acacia doratoxylon -<br />
Aristida ramosissima -<br />
Arthropodium milleflorum -<br />
Brachycome sp -<br />
Correa reflexa -<br />
Cyperus polystachyos -<br />
Desmodium brachypodum -<br />
Dianella revoluta var. revoluta -<br />
Einadia hastata -<br />
Eremophila debilis -<br />
Glycine tabacina -<br />
Lomandra filiformis subsp. filiformis -<br />
Panicum simile -<br />
<strong>2011</strong> Annual Ecological Monitoring Report, Final Report, May <strong>2012</strong> Page 71
Plot: V1--B3<br />
Flora Species<br />
Braun Blanquet<br />
Cover ('11)<br />
Aristida vagans 3<br />
Aristida ramosa 2<br />
Chloris truncata 2<br />
Eucalyptus dawsonii 3<br />
Cheilanthes sieberi subsp. sieberi -<br />
Dichondra repens 2<br />
Dodonaea viscosa subsp. cuneata 2<br />
Lomandra longifolia -<br />
Opuntia stricta var. stricta* 2<br />
Vittadinia sulcata 2<br />
Acacia falciformis 1<br />
Arthropodium milleflorum 1<br />
Bursaria spinosa 2<br />
Calotis lappulacea 1<br />
Cheilanthes distans 2<br />
Desmodium varians 1<br />
Dianella revoluta var. revoluta -<br />
Goodenia rotundifolia -<br />
Lomandra filiformis subsp. filiformis 1<br />
Microlaena stipoides 1<br />
Senecio madagascariensis* 1<br />
Wahlenbergia gracilis 1<br />
Notelaea microcarpa 3<br />
Notodanthonia longifolia 1<br />
Olearia elliptica 1<br />
Acacia linifolia 3<br />
Acacia implexa 1<br />
Austrodanhonia fulva 2<br />
Austrostipa ramosissima 2<br />
Gahnia aspera 2<br />
Themeda australis 1<br />
Chloris truncata 3<br />
Sida corrugata 1<br />
<strong>2011</strong> Annual Ecological Monitoring Report, Final Report, May <strong>2012</strong> Page 72
Plot: V11-B1<br />
Flora Species<br />
Braun Blanquet<br />
Cover ('11)<br />
Dodonaea viscosa subsp. cuneata 5<br />
Eucalyptus punctata 4<br />
Allocasuarina luehmannii 3<br />
Bursaria spinosa 3<br />
Choretrum candollei 3<br />
Eucalyptus crebra 3<br />
Melaleuca decora 3<br />
Acacia amblygona 2<br />
Aristida vagans 2<br />
Goodenia rotundifolia 2<br />
Leucopogon muticus -<br />
Notelaea microcarpa var. microcarpa 1<br />
Olearia elliptica 2<br />
Opuntia stricta var. stricta* 2<br />
Amyema pendulum 1<br />
Austrodanthonia fulva 1<br />
Breynia oblongifolia -<br />
Cassinia uncata 1<br />
Cheilanthes sieberi subsp. sieberi 1<br />
Desmodium brachypodum 1<br />
Dianella prunina 1<br />
Dianella revoluta -<br />
Einadia nutans 1<br />
Entolasia stricta 2<br />
Eragrostis brownii 1<br />
Exocarpos stricta -<br />
Glycine clandestina 1<br />
Grevillea montana 1<br />
Lepidosperma laterale -<br />
Lomandra filiformis subsp. coriacea 1<br />
Lomandra multiflora subsp. multiflora 1<br />
Panicum effusum -<br />
Senecio madagascariensis* 1<br />
Sida corrugata 1<br />
Veronica plebeia 1<br />
Austrostipa ramosissima 1<br />
<strong>2011</strong> Annual Ecological Monitoring Report, Final Report, May <strong>2012</strong> Page 73
Plot: V11-B2<br />
Flora Species<br />
Braun Blanquet<br />
Cover ('11)<br />
Eucalyptus crebra 4<br />
Acacia binervia 3<br />
Bursaria spinosa 3<br />
Entolasia stricta 3<br />
Eucalyptus punctata 3<br />
Goodenia rotundifolia 3<br />
Melaleuca decora 3<br />
Olearia elliptica 3<br />
Aristida vagans 2<br />
Austrostipa ramosissima 2<br />
Choretrum candollei 2<br />
Gahnia aspera 2<br />
Lomandra filiformis subsp. coriacea 2<br />
Persoonia linearis 2<br />
Pomax umbellata -<br />
Allocasuarina luehmannii 1<br />
Amyema pendulum 1<br />
Austrostipa scabra subsp. scabra 1<br />
Brunoniella australis 1<br />
Cheilanthes sieberi subsp. sieberi 1<br />
Cymbopogon refractus -<br />
Dianella prunina 1<br />
Dianella revoluta -<br />
Eragrostis leptostachya 1<br />
Glycine clandestina 1<br />
Gomphocarpus fruticosus* 1<br />
Lepidosperma laterale 1<br />
Leucopogon muticus 1<br />
Lomandra longifolia 1<br />
Lomandra multiflora subsp. multiflora 1<br />
Notelaea microcarpa var. microcarpa 1<br />
Opuntia stricta var. stricta* 1<br />
Panicum effusum 1<br />
Veronica plebeia 1<br />
Wahlenbergia gracilis 1<br />
Grevillea montana 2<br />
Breynia oblongifolia 1<br />
Acacia maidenii 1<br />
Senecio madagascariensis 1<br />
<strong>2011</strong> Annual Ecological Monitoring Report, Final Report, May <strong>2012</strong> Page 74
Plot: V13-B1<br />
Flora Species<br />
Braun Blanquet<br />
Cover ('11)<br />
Acacia binervia 3<br />
Angophora floribunda 3<br />
Bertya oleifolia 3<br />
Gahnia aspera 3<br />
Anagallis arvensis* 2<br />
Austrostipa ramosissima 3<br />
Breynia oblongifolia 2<br />
Callistemon linearis 2<br />
Calotis lappulacea 2<br />
Carex inversa 2<br />
Centaurium tenuiflorum* 2<br />
Cheilanthes distans 2<br />
Conyza sumatrensis* 2<br />
Desmodium varians 2<br />
Dichondra repens 2<br />
Eucalyptus acmenoides 2<br />
Eucalyptus crebra 2<br />
Juncus mollis 1<br />
Oplismenus aemulus 2<br />
Pimelea latifolia subsp. hirsuta 2<br />
Pomaderris ferruginea 3<br />
Acacia decurrens 1<br />
Adiantum aethiopicum 1<br />
Adiantum hispidulum var. hispidulum 1<br />
Alchornea ilicifolia -<br />
Anagallis arvensis 2<br />
Bursaria spinosa 1<br />
Calystegia marginata 1<br />
Cassinia aculeata 1<br />
Cayratia clematidea 1<br />
Chrysocephalum apiculatum 1<br />
Claoxylon australe 1<br />
Cynodon dactylon 1<br />
Dianella prunina 1<br />
Eucalyptus tereticornis 1<br />
Gamochaeta spicata 2<br />
Geijera salicifolia var. latifolia 1<br />
Glochidion ferdinandi var. ferdinandi 1<br />
Hibiscus heterophyllus subsp. heterophyllus 2<br />
Hypochaeris radicata* 1<br />
Lepidosperma laterale -<br />
Notelaea longifolia 1<br />
Notelaea ovata 1<br />
Olearia elliptica 1<br />
Oxalis chnoodes 1<br />
Pandorea baileyana -<br />
Phyllanthus gunnii 1<br />
Pittosporum multiflorum 1<br />
Plantago debilis 1<br />
Podolobium ilicifolium -<br />
Pratia purpurascens 1<br />
Rubus parvifolius 1<br />
<strong>2011</strong> Annual Ecological Monitoring Report, Final Report, May <strong>2012</strong> Page 75
Plot: V13-B1<br />
Flora Species<br />
Braun Blanquet<br />
Cover ('11)<br />
Senecio madagascariensis* 1<br />
Sida corrugata 1<br />
Sigesbeckia orientalis ssp. orientalis* 2<br />
Stephania japonica var. discolor 1<br />
Taraxacum officinale 1<br />
Trema tomentosa -<br />
Vernonia cinerea var. cinerea 1<br />
Veronica plebeia 1<br />
Viola hederacea 1<br />
Vulpia myuros* 1<br />
Wahlenbergia gracilis 1<br />
Bursaria spinosa 1<br />
Einadia hastata 2<br />
Plot: V14-A1<br />
Flora Species<br />
Braun Blanquet<br />
Cover ('11)<br />
Notelaea microcarpa var. microcarpa 5<br />
Brachychiton populneus subsp. populneus 3<br />
Geijera salicifolia var. salicifolia 3<br />
Acacia salicina 2<br />
Anagallis arvensis* 2<br />
Conyza sumatrensis* 2<br />
Dichondra repens 2<br />
Eremophila debilis 2<br />
Sida corrugata 2<br />
Spartothamnella juncea 2<br />
Acacia doratoxylon 1<br />
Brunoniella australis 1<br />
Calotis lappulacea 1<br />
Capsella bursa-pastoris 1<br />
Cheilanthes distans -<br />
Cheilanthes sieberi 1<br />
Chloris ventricosa 1<br />
Cymbopogon refractus 1<br />
Desmodium brachypodum 1<br />
Einadia hastata 1<br />
Einadia nutans 1<br />
Glycine tabacina 1<br />
Gnaphalium coarctatum* 1<br />
Gomphocarpus fruiticosus* 1<br />
Indigofera australis 1<br />
Olearia elliptica 1<br />
Oxalis radicosa 1<br />
Pavonia hastata* 1<br />
Petrorhagia nanteuilii* -<br />
Plantago debilis 1<br />
Senecio madagascariensis* 1<br />
Solanum stelligerum 1<br />
Trifolium dubium* 1<br />
<strong>2011</strong> Annual Ecological Monitoring Report, Final Report, May <strong>2012</strong> Page 76
Plot: V14-A1<br />
Flora Species<br />
Braun Blanquet<br />
Cover ('11)<br />
Veronica plebeia -<br />
Vittadinia sulcata -<br />
Wahlenbergia gracilis 1<br />
Sonchus oleraceus 1<br />
Urtica incisa 1<br />
Trifolium arvense* 1<br />
Geranium homeanum 1<br />
Plot: V14-B1<br />
Flora Species<br />
Braun Blanquet<br />
Cover ('11)<br />
Aristida ramosa 3<br />
Geijera salicifolia var. salicifolia 4<br />
Cheilanthes distans 3<br />
Notelaea microcarpa var. microcarpa 3<br />
Acacia salicina 2<br />
Olearia elliptica 2<br />
Vittadinia sulcata 2<br />
Acacia falcata 1<br />
Anagallis arvensis 1<br />
Austrostipa ramosissima 2<br />
Austrostipa scabra subsp. scabra 1<br />
Bertya oleifolia 1<br />
Bursaria spinosa 1<br />
Calotis lappulacea 1<br />
Chloris ventricosa 2<br />
Crassula sieberiana 1<br />
Cymbopogon refractus 1<br />
Desmodium brachypodium 1<br />
Dianella longifolia 1<br />
Dichondra repens 1<br />
Einadia hastata 1<br />
Einadia nutans 1<br />
Eucalyptus albens 1<br />
Gahnia aspera 1<br />
Gamochaeta coarctata 1<br />
Lomandra filiformis subsp. filiformis -<br />
Lomandra multiflora subsp. multiflora 1<br />
Oxalis chnoodes 1<br />
Plantago debilis 2<br />
Senecio madagascariensis* 2<br />
Sida corrugata 1<br />
Solanum stelligerum 1<br />
Spartothamnella juncea 1<br />
Themeda australis 1<br />
Veronica plebeia 1<br />
Wahlenbergia stricta 1<br />
Cyclospermum leptophyllum 1<br />
Gamochaeta sp. 1<br />
Conyza sumatrensis 1<br />
<strong>2011</strong> Annual Ecological Monitoring Report, Final Report, May <strong>2012</strong> Page 77
Plot: V14-B1<br />
Flora Species<br />
Braun Blanquet<br />
Cover ('11)<br />
Sigesbeckia orientalis 1<br />
Plot: V14-B2<br />
Flora Species<br />
Braun Blanquet<br />
Cover ('11)<br />
Notelaea microcarpa var. microcarpa 5<br />
Aristida ramosa 4<br />
Geijera salicifolia var. salicifolia 4<br />
Eucalyptus crebra 3<br />
Olearia elliptica 3<br />
Vittadinia sulcata 2<br />
Austrostipa ramosissima 2<br />
Bursaria spinosa 2<br />
Desmodium brachypodum 2<br />
Desmodium varians 2<br />
Dianella prunina 2<br />
Dichondra repens 2<br />
Einadia hastata 2<br />
Eragrostis leptostachya 2<br />
Glycine tabacina 2<br />
Spartothamnella juncea 1<br />
Veronica plebeia 2<br />
Amyema congener subsp. congener 1<br />
Arthropodium milleflorum 1<br />
Breynia oblongifolia 1<br />
Calotis lappulacea 1<br />
Cerastium glomeratum* 1<br />
Cheilanthes distans 1<br />
Cheilanthes sieberi subsp. sieberi 1<br />
Chloris ventricosa -<br />
Cirsium vulgare* -<br />
Cymbopogon refractus 1<br />
Dianella revoluta var. revoluta 1<br />
Dodonaea viscosa subsp. cuneata 1<br />
Einadia nutans 1<br />
Eucalyptus albens 1<br />
Gahnia aspera 1<br />
Geranium solanderi 1<br />
Gomphocarpus fruticosus* 1<br />
Lomandra filiformis subsp. filiformis 1<br />
Opuntia stricta var. stricta* 1<br />
Oxalis chnoodes 1<br />
Panicum effusum 1<br />
Plantago debilis -<br />
Senecio madagascariensis* -<br />
Sida corrugata 1<br />
Solanum stelligerum 1<br />
Sporobolus elongatus 1<br />
Commelina cyanea 3<br />
Cyclospermum leptophyllum 2<br />
<strong>2011</strong> Annual Ecological Monitoring Report, Final Report, May <strong>2012</strong> Page 78
Plot: V14-B2<br />
Flora Species<br />
Braun Blanquet<br />
Cover ('11)<br />
Microlaena stipoides 2<br />
Cypress sp<br />
Euchiton gymnocephalus 2<br />
Scutellaria humilis 2<br />
<strong>2011</strong> Annual Ecological Monitoring Report, Final Report, May <strong>2012</strong> Page 79
Appendix C<br />
Introduced Flora Species<br />
<strong>2011</strong> Annual Ecological Monitoring Report, Final Report, May <strong>2012</strong> Page 80
Table 1: Introduced Species Frequency of Occurrence<br />
Scientific Name Common Name 2006 2007 2008 2009 2010 <strong>2011</strong><br />
Senecio madagascariensis* Fireweed 8 22 21 29 27 25<br />
Opuntia stricta var. stricta* Prickly Pear 23 20 19 17 20 22<br />
Anagallis arvensis* Scarlet Pimpernel 9 15 10 16 16 13<br />
Heliotropium amplexicaule* Blue Heliotrope 7 7 7 1 6 11<br />
Sonchus oleraceus* - 3 10<br />
Hypochaeris radicata* Cat’s Ear 1 6 10 8 5 9<br />
Cerastium glomeratum* - 4 7 8<br />
Galenia pubescens* Galenia 6 3 4 3 7 8<br />
Conyza sumatrensis* - 5 8<br />
Gamochaeta coarctata* - 5 8<br />
Pavonia hastata* Pavonia 6 6 6 7 8<br />
Cyclospermum leptophyllum* - 2 7<br />
Plantago lanceolata* Lamb’s Tongue 3 8 5 6 7<br />
Opuntia aurantiaca* Tiger Pear 8 9 6 2 6 6<br />
Petrorhagia nanteuilii * - 4 5 2 5 5<br />
Echium plantagineum* - 3 4<br />
Cirsium vulgare* Scotch Thistle 8 7 3 2 4<br />
Verbascum virgatum* Twiggy Mullein 1 3 2 4<br />
Centaurium erythraea* - 1 4<br />
Gomphocarpus fruticosus*<br />
Narrow Leaf Cotton<br />
Bush<br />
2 5 1 4<br />
Bromus catharticus* Prairie Grass 5 3 3<br />
Ehrharta erecta* Panic Veldt Grass 2 3 2 2 3 3<br />
Acetosella vulgaris* - 2 3<br />
Verbena rigida* Veined Verbena 2 2 1 3 2 3<br />
Melinis repens* Red Natal Grass 1 1 3<br />
Sigesbeckia orientalis* - 3<br />
Briza subaristata* - 3<br />
Setaria gracilis* Slender Pigeon Grass 2 5 1 5 3 2<br />
Solanum nigrum* Black Nightshade 3 1 2 3 2<br />
Lolium rigidum* Stiff Ryegrass 3 1 2 2 2<br />
Oenothera stricta* Evening Primrose 3 1 2 2<br />
Silene gallica* French Catchfly 1 2 2 2<br />
Vulpia myuros* - 2 2<br />
Cardiospermum grandiflorum* - 1 1 2<br />
Taraxacum officinale* Dandelion 5 2<br />
Trifolium arvense* Haresfoot Clover 2 2<br />
Sida rhombifolia* Paddy’s Lucerine 8 9 6 6 2 1<br />
Briza maxima* - 1 1<br />
Centaurium tenuiflorum* Common Centaury 2 5 2 1 1 1<br />
Dianthus armeria* - 1 1<br />
Lepidium africanum* Peppercress 1 1 1 1 1<br />
Lolium perenne* - 1 1<br />
Lycium ferocissimum* African Boxthorn 1 1 1<br />
Olea europaea* - 2 1 1<br />
Richardia humistrata* - 2 1 1<br />
Rumex crispus* Curled Dock 1 2 1 1 1 1<br />
Trifolium campestre* - 1 1<br />
Trifolium dubium* Yellow Suckling Clover 2 2 1 1 1<br />
Verbena bonariensis* Purple Top 1 2 1 1<br />
Tagetes minuta* Stinking Roger 3 1 2 1<br />
Capsella bursa-pastoris* Shepherds purse 1<br />
Setaria pumila* - 1<br />
Paspalum urvillei* - 1<br />
<strong>2011</strong> Annual Ecological Monitoring Report, Final Report, May <strong>2012</strong> Page 81
Scientific Name Common Name 2006 2007 2008 2009 2010 <strong>2011</strong><br />
Lepidium africanum* - 1<br />
Facelis retusa* - 1<br />
Bromus molliformis* Soft Brome 1<br />
Anagallis arvensis var. caerulea* Blue Pimpernel 1<br />
Apium leptophyllum* Slender Celery 8 8 5 1 0<br />
Conyza bonariensis* Tall Fleabane 2 7 8 3 1 0<br />
Salvia verbenaca* Vervain 2 1 1 0<br />
Senecio quadridentatus* Cotton Fireweed 2 1 1 0<br />
Trifolium subterraneum* - 1 0<br />
Ageratina riparia* Crofton Weed 3 1 0<br />
Aira cupaniana* Silvery Hairgrass 1 0<br />
Arenaria leptoclados*<br />
Lesser Thyme-leaved<br />
Sandwort<br />
2 1 0<br />
Asparagus plumosus*<br />
Climbing Asparagus<br />
Fern<br />
3 2 0<br />
Bidens pilosa* Farmer’s Friend 5 3 3 3 0<br />
Bidens subalternans* Greater Beggar's Tick 6 0<br />
Brassica fruticulosa* Twiggy Turnip 1 0<br />
Brassica juncea* Chinese Mustard 2 0<br />
Briza minor* Shivery Grass 4 1 2 4 0<br />
Bromus sterilis* Sterile Brome 6 0<br />
Cotoneaster pannosus* Cotoneaster 1 1 1 0<br />
Cyperus aggreatus* - 10 1 0<br />
Cyperus tenellus* - 1 0<br />
Echinochloa crus-galli* Barnyard Grass 1 0<br />
Emex australis* Double Gee 2 1 0<br />
Gamochaeta americana* Cudweed 1 5 3 0<br />
Gamochaeta spaericum* Cudweed 5 4 0<br />
Hydrocotyle bonariensis* Pennywort 1 1 2 0<br />
Hyperichum perforatum* St John’s Wort 1 0<br />
Juncus acutus* Spiny Rush 3 7 3 1 0<br />
Lepidium bonariense* Peppercress 1 9 3 1 0<br />
Modiola caroliniana* Red Mallow Flower 1 1 0<br />
Myrsiphyllum asparagoides* Florist's Smilax 1 0<br />
Oxalis latifolia* - 1 0<br />
Panicum diffusum* - 1 0<br />
Paronychia brasiliana* Brazilian Whitlow 1 0<br />
Pennisetum clandestinum* Kikuyu 2 1 1 0<br />
Polycarpon tetraphyllum* Four-leaved Allseed 1 3 0<br />
Portulaca oleracea* Pigweed 2 1 0<br />
Raphanus raphanistrum* - 1 0<br />
Richardia brasiliensis* White Eye 2 1 2 0<br />
Richardia humistrata* - 2 2 2 2 0<br />
Rumex brownii* Swamp Dock 3 3 0<br />
Salix alba var. alba* White Willow 1 0<br />
Silybum marianum* Variegated Thistle 1 1 0<br />
Solanum prinophyllum* - 5 0<br />
Soliva sessilis* Jojo 1 0<br />
Solvia pterosperma* Bindii 1 0<br />
Sonchus oleraceus* Common Sowthistle 2 12 6 9 0<br />
Sporobolus africanus* Parramatta Grass 1 0<br />
Sporobolus creber* Slender Rat’s tail grass 1 0<br />
Stellaria media* Chickweed 2 1 0<br />
Xanthium italicum* - 1 0<br />
<strong>2011</strong> Annual Ecological Monitoring Report, Final Report, May <strong>2012</strong> Page 82
Appendix D<br />
Fauna Species List<br />
<strong>2011</strong> Annual Ecological Monitoring Report, Final Report, May <strong>2012</strong> Page 83
Fauna Species List<br />
Family sequencing and taxonomy follow for each fauna class:<br />
• Birds – Simpson and Day (2010)<br />
• Reptiles – Wilson and Swan (2010)<br />
• Amphibians – Tyler and Knight (<strong>2011</strong>)<br />
• Mammals - Van Dyck and Strahan (ed) (2008)<br />
Appendix Key<br />
Symbol Meaning<br />
= Species Detected<br />
# = number of individuals recorded<br />
A = recorded outside one hectare bird survey area<br />
* = Introduced species<br />
(CE) = Species listed under TSC Act as Critically Endangered<br />
(E) = Species listed under TSC Act as Endangered<br />
(V) = Species listed under TSC Act as Vulnerable<br />
(CE*) = Species listed under the EPBC Act as Critically Endangered<br />
(E*) = Species listed under the EPBC Act as Endangered<br />
(V*) = Species listed under the EPBC Act as Vulnerable<br />
(M*) = Species listed under the EPBC Act as Migratory<br />
D = ‘Definite’ level of identification during Anabat echolocation analysis<br />
P = ‘Probable’ level of identification during Anabat echolocation analysis<br />
Po = ‘Possible’ level of identification during Anabat echolocation analysis<br />
Data Source<br />
1 to 26 = Bird monitoring plot number<br />
X = recorded during 28/06/<strong>2011</strong> Swift Parrot and Regent Honeyeater survey<br />
Y = recorded during 12/07/<strong>2011</strong> Swift Parrot and Regent Honeyeater survey<br />
Z = recorded during 01/08/<strong>2011</strong> Swift Parrot and Regent Honeyeater survey<br />
Opp. = Opportunistically recorded<br />
F&F = Recorded during nocturnal spotlighting, frog surveys or Anabat surveys<br />
<strong>2011</strong> Annual Ecological Monitoring Report, Final Report, May <strong>2012</strong> Page 84
Family Scientific Name Common Name 1 2 3 4 5 6 7 8 9 10 11 12 13 14 15 16 17 18 19 20 21 22 23 24 25 26 X Y Z Opp. F&F<br />
Birds<br />
Chenonetta jubata Australian Wood Duck (M*) 1 <br />
Anatidae<br />
Anas gracilis Grey Teal <br />
Anas superciliosa Pacific Black Duck <br />
Hieraaetus morphnoides Little Eagle (V, M*) 1<br />
Aquila audax Wedge-tailed Eagle (M) <br />
Accipiridae Circus assimilis Spotted Harrier (V) <br />
Elanus axillaris Black-shouldered Kite <br />
Accipiter fasciatus Brown Goshawk <br />
Aegothelidae Aegotheles cristatus Australian Owlet-nightjar <br />
Ardea modesta Eastern Great Egret (M*) <br />
Ardea intermedia Intermediate Egret <br />
Ardeidae<br />
Ardea pacifica White-necked (Pacific) Heron <br />
Egretta novaehollandiae White-faced Heron <br />
Nycticorax caledonicus Nankeen Night Heron <br />
Rallidae<br />
Porphyrio porphyrio Purple Swamphen 1 <br />
Gallirallus philippensis Buff-banded Rail <br />
Podicipedidae Tachybaptus novaehollandiae Australiasian Grebe <br />
Phaps chalcoptera Common Bronzewing 1 <br />
Ocyphaps lophotes Crested Pigeon 1 <br />
Columbidae Geopelia striata Peaceful Dove 1<br />
Geopelia humeralis Bar-shouldered Dove 1 2 <br />
Leucosarcia picata Wonga Pigeon 1 <br />
Eulophus roseicapillus Galah 2 4 2 <br />
Cacatuidae Cacatua galerita Sulphur-crested Cockatoo 1 3 3 1 1 1 <br />
Calyptorhynchus funereus Yellow-tailed Black Cockatoo <br />
Phalacrocoracidae<br />
Microcarbo melanoleucos Little Pied Cormorant <br />
Phalacrocorax carbo Great Cormorant <br />
Glossopsitta pusilla Little Lorikeet (V) 2 2 2 2 1 2 <br />
Platycercus eximius Eastern Rosella 1 3 <br />
Psittacidae Platycercus elegans Crimson Rosella <br />
Psephotus haematonotus Red-rumped Parrot 2 3 <br />
Alisterus scapularis Australian King Parrot <br />
Cacomantis flabelliformis Fan-tailed Cuckoo 1 1 1 <br />
Chalcites basalis Horsefield’s Bronze-Cuckoo <br />
Cacomantis pallidus Pallid Cuckoo <br />
Cuculidae<br />
Cacomantis variolosus Brush Cuckoo 1<br />
Chalcites lucidus Shining Bronze-Cuckoo 1 1<br />
Eudynamys orientalis Eastern Koel 1 1 1 1 1 1 1 1 <br />
Scythrops novaehollandiae Channel-billed Cuckoo 1 1 2 1 1 <br />
Halcyonidae<br />
Dacelo novaeguineae Laughing Kookaburra 1 1 1 1 <br />
Todiramphus sanctus Sacred Kingfisher 2 2 1 1 1 1<br />
Meropidae Merops ornatus Rainbow Bee-eater (M*) 1 2 1 1 <br />
Coraciidae Eurystomus orientalis Dollarbird 1 1 1 2 <br />
<strong>2011</strong> Annual Ecological Monitoring Report, Final Report, May <strong>2012</strong> Page 85
Family Scientific Name Common Name 1 2 3 4 5 6 7 8 9 10 11 12 13 14 15 16 17 18 19 20 21 22 23 24 25 26 X Y Z Opp. F&F<br />
Climacteridae<br />
Cormobates leucophaea White-throated Treecreeper 1 1 1 1 1 <br />
Climacteris picumnus Brown Treecreeper (V) 1 <br />
Maluridae<br />
Malurus cyaneus Superb Fairy-wren 3 1 2 2 1 2 2 1 3 4 2 <br />
Malurus lamberti Variegated Fairy-wren <br />
Pardalotus punctatus Spotted Pardalote 2 <br />
Paradalotus striatus Striated Pardalote 1 1 1 2 1 2 1 <br />
Sericornis frontalis White-browed Scrubwren 4 <br />
Chthonicola sagittata Speckled Warbler (V) 1 1 1 <br />
Smicrornis brevirostris Weebill 1 1 1 3 1 2 1 1 3 1 1 <br />
Gerygone mouki Brown Gerygone 1<br />
Pardalotidae Gerygone albogularis White-throated Gerygone 1 1 <br />
Gerygone fusca Western Gerygone 1 2 1 <br />
Acanthiza lineata Striated Thornbill <br />
Acanthiza pusilla Brown Thornbill 4 1 1 4 1 5 <br />
Acanthiza reguloides Buff-rumped Thornbill 3 2 3 3 <br />
Acanthiza chrysorrhoa Yellow-rumped Thornbill <br />
Acanthiza nana Yellow Thornbill 4 5 2 2 1 2 <br />
Anthochaera carunculata Red Wattlebird 1 2 <br />
Acanthorhynchus tenuirostris Eastern Spinebill <br />
Meliphaga lewinii Lewin’s Honeyeater <br />
Plectrhyncha lanceolata Striped Honeyeater 3 2 2 1 1 <br />
Philemon corniculatus Noisy Friarbird 2 2 2 2 1 1 1 1 <br />
Manorina melanocephala Noisy Miner 3 1 2 2 3 3 2 1 2 1 <br />
Manorina melanophrys Bell Miner <br />
Lichenostomus chrysops Yellow-faced Honeyeater 2 1 2 1 2 2 4 1 3 4 1 1 2 2 2 <br />
Meliphagidae Lichenostomus melanops Yellow-tufted Honeyeater 3 <br />
Lichenostomus leucotis White-eared Honeyeater 2<br />
Acanthagenys rufogularis Spiney-cheeked Honeyeater <br />
Lichenostomus penicillatus White-plumed Honeyeater 1 3 <br />
Melithreptus brevirostris Brown-headed Honeyeater 1 1 <br />
Melithreptus lunatus White-naped Honeyeater 1 1 2 <br />
Phylidonyris niger White-cheeked Honeyeater 3<br />
Myzomela sanguinolenta Scarlet Honeyeater 1 3 3 1 1 2 <br />
Lichenostomus fuscus Fuscous Honeyeater <br />
Eopsaltriidae Microeca fascinans Jacky Winter 2 1<br />
Eupetidae Psophodes olivaceus Eastern Whipbird <br />
Eopsaltria australis Eastern Yellow Robin 3 1 1 1 1 1 1 1<br />
Petroicidae<br />
Melanodryas cucullata<br />
cucullata<br />
Hooded Robin (V) <br />
Petroica rosea Rose Robin <br />
Pomatostomidae Pomatostomus temporalis Grey-crowned Babbler (V) 2 4 3 <br />
Neosittidae Daphoenositta chrysoptera Varied Sittella (V) 1 <br />
Falcunculus frontatus Crested Shrike-tit 2<br />
Pachycephalidae Pachycephala rufiventris Rufous Whistler 1 1 1 1 1 1 1 1 1 1 2 1 2 1 3 1 <br />
Pachycephala pectoralis Golden Whistler <br />
<strong>2011</strong> Annual Ecological Monitoring Report, Final Report, May <strong>2012</strong> Page 86
Family Scientific Name Common Name 1 2 3 4 5 6 7 8 9 10 11 12 13 14 15 16 17 18 19 20 21 22 23 24 25 26 X Y Z Opp. F&F<br />
Colluricincla harmonica Grey Shrike-thrush 1 1 1 1 1 1 1 <br />
Myiagra rubecula Leaden Flycatcher 2<br />
Monarchidae Myiagra inquieta Restless Flycatcher 3 1<br />
Grallina cyanoleuca Magpie-lark 2 1<br />
Rhipiduridae<br />
Rhipidura albiscarpa Grey Fantail 1 1 1 2 1 2 1 1 1 <br />
Rhipidura leucophyrs Willie Wagtail 1 1 1 1 1 <br />
Coracina novaehollandiae Black-faced Cuckoo-shrike 1 1 2 1 1 1 1 1 1 1 2 1 <br />
Campephagidae Coracina tenuirostris Cicadabird 2<br />
Lalage sueurii White-winged Triller 1<br />
Oriolidae Oriolus sagittatus Olive-backed Oriole 1 1 1 1 1 <br />
Artamus cyanopterus Dusky Woodswallow 1 1<br />
Cracticus torquatus Grey Butcherbird 1 2 2 1 1 1 1 1 1 1 <br />
Artamidae Cracticus nigrogularis Pied Butcherbird 1 <br />
Cracticus tibicen Australian Magpie 1 2 1 1 1 1 1 1 1 <br />
Strepera graculina Pied Currawong 2 1 1 2 1 1 2 3 3 2 1 1 1 <br />
Corvidae Corvus coronoides Australian Raven 5 2 4 1 1 1 1 1 1 1 1 1 1 1 <br />
Cororacidae Corcorax melanorhamphos White-winged Chough 3 5 10 2 4 <br />
Charadriidae<br />
Vanellus miles Masked Lapwing <br />
Elseyornis melanops Black-fronted Dotterel <br />
Estrildidae<br />
Neochmia temporalis Red-browed Finch 2 3 <br />
Taeniopygia bichenovii Double-barred Finch <br />
Nectariniidae Dicaeum hirundinaceum Mistletoebird 1 1 1 1 1 <br />
Hirundinidae<br />
Hirundo neoxena Welcome Swallow 1 <br />
Petrochelidon ariel Fairy Martin 4 2 <br />
Sylviidae Acrocephalus australis Australian Reed Warbler 2 <br />
Megaluridae Cincloramphus mathewsi Rufous Songlark 2 1 1 <br />
Zosteropidae Zosterops lateralis Silvereye 1 1<br />
Falco cenchroides Nankeen Kestrel <br />
Falconidae Falco berigora Brown Falcon <br />
Falco peregrinus Peregrine Falcon <br />
Cisticolidae Cisticola exilis Golden-headed Cisticola <br />
Motacillidae Anthus novaeseelandiae Australasian Pipit <br />
Phasianidae<br />
Coturnix ypsilophora Brown Quail <br />
Coturnix pectoralis Stubble Quail <br />
Podargidae Podargus strigoides Tawny Frogmouth <br />
Recurvirostridae Himantopus himantopus Black-winged Stilt <br />
Strigidae<br />
Ninox strenua Powerful Owl (V) <br />
Ninox novaeseelandiae Southern Boobook <br />
Sturnidae Sturnus tristis Common Myna <br />
Mammals<br />
Vombatidae Vombatus ursinus Common Wombat <br />
Petauridae Petaurus breviceps Sugar Glider <br />
Phalangeridae Trichosurus vulpecula Common Brushtail Possum <br />
Macropodidae Macropus giganteus Eastern Grey Kangaroo <br />
<strong>2011</strong> Annual Ecological Monitoring Report, Final Report, May <strong>2012</strong> Page 87
Family Scientific Name Common Name 1 2 3 4 5 6 7 8 9 10 11 12 13 14 15 16 17 18 19 20 21 22 23 24 25 26 X Y Z Opp. F&F<br />
Macropus robustus Common Wallaroo <br />
Macropus rufogriseus Red-necked Wallaby <br />
Wallabia bicolour Swamp Wallaby <br />
Pteropodidae Pteropus poliocephalus Grey-headed Flying-fox (V) <br />
Emballonuridae Saccolaimus flaviventris Yellow-bellied Sheath-tail Bat D<br />
Rhinolophidae Rhinolophus megaphyllus Eastern Horseshoe-bat D<br />
Austronomous australis White-striped Freetail Bat D<br />
Molossidae Mormopterus sp. 2 D<br />
Mormopterus sp.4 Southern Freetail-bat D<br />
Miniopterus australis Little Bentwing-bat (V) D<br />
Miniopterus schreibersii Common Bentwing-bat (V) D<br />
Vespertilionidae Chalinolobus dwyeri Large-eared Pied Bat (V, V*) D<br />
Chalinolobus gouldii Gould’s Wattled Bat D<br />
Chalinolobus morio Chocolate Wattled Bat D<br />
Vespertilionidae Scotorepens balstoni Inland Broad-nosed Bat P<br />
Canidae<br />
Vulpes vulpes Red Fox* <br />
Canis lupus familiaris* Dog* <br />
Frogs<br />
Myobatrachidae<br />
Hylidae<br />
Crinia signifera Common Froglet <br />
Limnodynastes dumerilli subsp.<br />
dumerilli<br />
Banjo Frog <br />
Platyplectrum ornatum Ornate Burrowing Frog <br />
Limnodynastes tasmaniensis Spotted Grass Frog <br />
Uperoleia laevigata Smooth Toadlet <br />
Litoria caerulea Green Tree Frog <br />
Litoria chloris Red-eyed Tree Frog <br />
Litoria dentata Bleating Tree Frog <br />
Litoria fallax Eastern Dwarf Tree Frog <br />
Litoria latopalmata Broad-palmed Frog <br />
Litoria peronii Peron’s Tree Frog <br />
Litoria tyleri Tyler’s Tree Frog <br />
Litoria wilcoxii Stone Creek Frog <br />
Reptiles<br />
Egernia striolata Tree Skink <br />
Scincidae<br />
Lampropholis delicata Delicate Garden Skink <br />
Varanidae Varanus Varius Lace Monitor <br />
<strong>2011</strong> Annual Ecological Monitoring Report, Final Report, May <strong>2012</strong> Page 88
Appendix E<br />
Riparian Condition Assessment Field Proforma<br />
<strong>2011</strong> Annual Ecological Monitoring Report, Final Report, May <strong>2012</strong><br />
Page 89
Site ID: ____________________ Date: ___________________ Job Number: __ ____________<br />
Recorder: ____________________ GPS: E_________________ N__________________ Waypoint Name: __________<br />
Photo Numbers: N:_________ S:__________ E:__________ W:__________<br />
Site Location: North <strong>Wambo</strong> Creek South <strong>Wambo</strong> Creek Stoney Creek Waterfall Creek<br />
Landform Morphological Type: Crest Mid slope Lower Slope Flat<br />
Landform Pattern: Precipitous Steep Gently Inclined Gentle<br />
TOTAL TRANSECT<br />
SCORE: ________<br />
Blue (Excellent) = >33<br />
Green (Good) = 28 - 33<br />
Amber (Average) = 14 - 27<br />
Red (Poor) = 30<br />
(3)<br />
Total PFC of weed<br />
species in canopy<br />
>70<br />
(-3)<br />
30-70<br />
(-2)<br />
1-30<br />
(-1)<br />
0<br />
(0)<br />
Number of O/S species<br />
0<br />
(0)<br />
1-2<br />
(1)<br />
2-5<br />
(2)<br />
>5<br />
(3)<br />
Reproductive stage of<br />
majority of native<br />
overstorey<br />
Seedling<br />
(0)<br />
Juvenile (too young<br />
to reproduce)<br />
(1)<br />
Mixture of juvenile<br />
and mature<br />
(2)<br />
Mature<br />
(3)<br />
Native Vegetation<br />
Recruitment<br />
Nil<br />
(0)<br />
Fruit present (on<br />
ground or on tree)<br />
(1)<br />
Fruit and seedlings<br />
present<br />
(2)<br />
Fruit, seedlings<br />
and juveniles<br />
present<br />
(3)<br />
List of dominant species (3-5)<br />
<strong>2011</strong> Annual Ecological Monitoring Report, Final Report, May <strong>2012</strong> Page 90
Understorey (shrub<br />
layer)<br />
(Score)<br />
Comments<br />
Average height of<br />
understorey species (m)<br />
3<br />
(3)<br />
Total PFC incl weeds<br />
0<br />
(0)<br />
1-30<br />
(1)<br />
30-70<br />
(2)<br />
>70<br />
(3)<br />
Total PFC of weed<br />
species in understorey<br />
>70<br />
(-3)<br />
30-70<br />
(-2)<br />
1-30<br />
(-1)<br />
0<br />
(0)<br />
Number of O/S species<br />
0<br />
(0)<br />
1-2<br />
(1)<br />
2-5<br />
(2)<br />
>5<br />
(3)<br />
List of dominant species (3-5)<br />
Ground Cover (Score) Comments<br />
Average ground cover<br />
height (cm)<br />
0<br />
(0)<br />
1-10<br />
(1)<br />
11-50<br />
(2)<br />
51-100<br />
(3)<br />
Leaf litter depth (cm)<br />
0<br />
(0)<br />
10<br />
(3)<br />
Leaf litter cover (%)<br />
75<br />
(3)<br />
Bare Soil cover (%)<br />
>75<br />
(0)<br />
50-75<br />
(1)<br />
20-50<br />
(2)<br />
75<br />
(-3)<br />
50-75<br />
(-2)<br />
20-50<br />
(-1)<br />
20<br />
(3)<br />
List of dominant species (3-5)<br />
<strong>2011</strong> Annual Ecological Monitoring Report, Final Report, May <strong>2012</strong> Page 91
Introduced Species (Score) Comments<br />
Number of weed species<br />
in all strata<br />
>5<br />
(-3)<br />
3-5<br />
(-2)<br />
1-2<br />
(-1)<br />
nil<br />
(0)<br />
List of dominant weed species (3-5)<br />
Feral animal activity (Score) Comments<br />
Rabbits<br />
Active Warrens<br />
(-3)<br />
Scat mounds<br />
(-2)<br />
Soil Disturbance<br />
(-1)<br />
Nil<br />
(0)<br />
Pigs<br />
Confirmed<br />
Sighting<br />
(-3)<br />
Soil Disturbance<br />
(-2)<br />
Tracks / Scats<br />
(-1)<br />
Nil<br />
(0)<br />
Dogs / Foxes<br />
Confirmed<br />
Sighting<br />
(-3)<br />
Scats<br />
(-2)<br />
Tracks only<br />
(-1)<br />
Nil<br />
(0)<br />
Other<br />
Confirmed<br />
Sighting (-3)<br />
Scats<br />
(-2)<br />
Tracks only<br />
(-1)<br />
Nil<br />
(0)<br />
<strong>2011</strong> Annual Ecological Monitoring Report, Final Report, May <strong>2012</strong> Page 92
Surface Stability (Score) Comments<br />
Topsoil<br />
Nil<br />
(0)<br />
Exposed / shallow<br />
(1)<br />
Stable<br />
(2)<br />
Stable and<br />
organic content<br />
present<br />
(3)<br />
Mass Movement<br />
(slumping)<br />
Severe<br />
(-3)<br />
Moderate<br />
(-2)<br />
Minor<br />
(-1)<br />
Nil<br />
(0)<br />
Sheet or Rill Erosion<br />
Severe<br />
(-3)<br />
Moderate<br />
(-2)<br />
Minor<br />
(-1)<br />
Nil<br />
(0)<br />
Gully Erosion (>0.3m<br />
deep)<br />
Severe<br />
(-3)<br />
Moderate<br />
(-2)<br />
Minor<br />
(-1)<br />
Nil<br />
(0)<br />
Stream Bank and/or<br />
Tunnel Erosion<br />
Severe<br />
(-3)<br />
Moderate<br />
(-2)<br />
Minor<br />
(-1)<br />
Nil<br />
(0)<br />
Soil Compaction<br />
Severe<br />
(-3)<br />
Moderate<br />
(-2)<br />
Minor<br />
(-1)<br />
Nil<br />
(0)<br />
Sedimentation evidence<br />
(ie from upslope erosion<br />
/ construction works /<br />
sed fences not<br />
maintained etc<br />
Severe<br />
(-3)<br />
Moderate<br />
(-2)<br />
Minor<br />
(-1)<br />
Nil<br />
(0)<br />
<strong>2011</strong> Annual Ecological Monitoring Report, Final Report, May <strong>2012</strong> Page 93
Riparian Microhabitat (Score) Comments<br />
Water Presence<br />
Nil<br />
(0)<br />
Ephemeral Puddles<br />
or Stream<br />
(1)<br />
Dam<br />
(2)<br />
Perennial Stream<br />
(3)<br />
Rocks<br />
Nil<br />
(0)<br />
Scattered small<br />
rocks various sizes<br />
(1)<br />
Large rocks of<br />
various sizes<br />
(2)<br />
Boulders partially<br />
emerging, various<br />
sizes<br />
(3)<br />
Timber<br />
Nil<br />
(0)<br />
Scattered twigs,<br />
sticks<br />
(1)<br />
Scattered logs<br />
(2)<br />
Dead standing<br />
trees OR in<br />
stream snags<br />
(fallen timber)<br />
(3)<br />
Disturbance (Score) Comments<br />
Rubbish<br />
Frequent Building<br />
and/or mining<br />
debris<br />
(-3)<br />
Scattered rural litter<br />
(eg car body)<br />
(-2)<br />
Scattered domestic<br />
litter (bagged rubbish,<br />
tires etc)<br />
(-1)<br />
Nil<br />
(0)<br />
Unauthorised Access<br />
Evidence of largescale<br />
clearing<br />
(-3)<br />
Small scale damage<br />
- broken limbs,<br />
vehicle tracks<br />
(-2)<br />
Broken gates,<br />
padlocks<br />
(-1)<br />
Nil<br />
(0)<br />
Other<br />
Severe<br />
(-3)<br />
Moderate<br />
(-2)<br />
Minor<br />
(-1)<br />
Nil<br />
(0)<br />
<strong>2011</strong> Annual Ecological Monitoring Report, Final Report, May <strong>2012</strong> Page 94
Appendix F<br />
Riparian Condition Scores<br />
<strong>2011</strong> Annual Ecological Monitoring Report, Final Report, May <strong>2012</strong> Page 95
Overstorey<br />
Understorey<br />
Ground Cover<br />
Introduced<br />
Species<br />
Feral Animals<br />
Surface<br />
Stability<br />
Riparian<br />
Microhabitat<br />
Disturbance<br />
Table 1: North <strong>Wambo</strong> Creek Riparian Transect Condition Scores<br />
North <strong>Wambo</strong> Creek Transect<br />
1A 2A 3A 4A 5A 6A 7A 8A 9A 10A 11A 12A 13A 14A 15A<br />
Average Height 2 3 3 0 2 2 3 2 2 3 3 1 3 3 3<br />
Total PFC 1 1 3 0 1 1 2 2 1 3 2 1 2 2 2<br />
Total PFC of Weeds Only 0 0 0 0 0 0 0 0 0 0 0 0 0 0 0<br />
Number of Overstorey<br />
Species<br />
1 1 2 0 1 1 1 1 2 2 1 1 1 2 1<br />
Reproductive Stage 2 2 2 0 2 2 2 1 2 2 2 0 2 2 2<br />
Native Vegetation<br />
Recruitment<br />
2 2 1 0 1 3 3 3 3 3 3 3 3 3 3<br />
Average Height 1 1 1 0 2 1 2 2 1 1 3 1 1 3 2<br />
Total PFC Incl. Weeds 1 1 1 0 1 1 1 1 1 1 1 1 1 1 1<br />
Total PFC of Weeds Only 0 0 -1 0 0 0 -1 0 0 -1 0 0 -1 -1 0<br />
Native Vegetation<br />
Recruitment<br />
0 1 0 0 3 0 2 3 3 3 2 3 2 1 2<br />
Average Height 2 2 2 3 2 2 2 2 2 2 2 2 2 2 1<br />
Leaf Litter Depth 1 1 1 1 0 1 1 1 1 1 1 0 0 0 1<br />
Leaf Letter Cover 0 0 0 0 0 0 0 0 0 0 1 0 0 0 0<br />
Bare Soil Cover 3 3 3 3 3 3 3 2 3 3 3 2 3 3 3<br />
Total PFC Incl. Weeds 3 3 3 3 3 3 3 2 3 3 2 2 3 3 3<br />
Total PFC of Weed<br />
Species<br />
-1 -2 -2 -3 -1 0 -1 0 0 -1 0 0 0 -1 0<br />
Number of Groundcover<br />
Species<br />
2 2 2 1 1 2 2 1 2 2 2 2 2 2 2<br />
Number of Weed Species -3 -3 -3 -2 -3 -3 -3 -3 -3 -2 -3 -2 -3 -3 -3<br />
Rabbits -2 -3 -3 0 -3 -3 -1 -1 -1 -1 -1 -1 -1 -3 0<br />
Pigs 0 0 0 0 0 0 0 0 0 0 0 0 0 0 0<br />
Dogs/Foxes 0 0 0 0 0 0 0 0 0 0 -2 0 0 -3 0<br />
Other 0 0 0 0 0 0 0 0 0 0 0 0 0 0 0<br />
Top Soil 3 3 3 3 3 3 3 2 3 3 3 3 3 3 3<br />
Mass Movement 0 0 0 0 0 0 -1 -1 0 0 0 -2 0 0 0<br />
Sheet or Rill Erosion 0 0 0 0 0 0 -1 0 0 0 0 0 0 0 0<br />
Gully Erosion 0 -1 -1 0 -2 0 0 0 0 0 0 -2 0 0 0<br />
Stream Bank 0 0 0 0 -2 0 -2 -1 0 0 0 0 0 -2 0<br />
Soil Compaction 0 0 0 0 0 0 0 0 0 0 0 0 0 0 0<br />
Sedimentation Evidence 0 0 0 -1 0 0 0 0 0 0 0 0 0 0 0<br />
Water Presence 0 0 0 1 0 0 1 1 1 1 1 0 1 1 3<br />
Rocks 0 0 0 0 1 0 0 2 0 0 0 0 0 0 2<br />
Timber 1 1 1 0 0 0 1 1 0 0 1 0 2 1 3<br />
Rubbish 0 0 0 0 0 0 0 0 0 0 0 0 0 0 0<br />
Unauthorised Access 0 0 0 0 0 0 0 0 0 0 0 0 0 0 0<br />
Other 0 0 0 0 0 0 0 0 0 0 0 0 0 0 0<br />
Score 19 18 18 9 15 19 22 23 26 28 27 15 26 19 34<br />
Condition M M M P M M M M M M M M M M E<br />
<strong>2011</strong> Annual Ecological Monitoring Report, Final Report, May <strong>2012</strong> Page 96
Overstorey<br />
Understorey<br />
Ground Cover<br />
Introduced<br />
Species<br />
Feral Animals<br />
Surface<br />
Stability<br />
Riparian<br />
Microhabitat<br />
Disturbance<br />
Table 5-1: North <strong>Wambo</strong> Creek Riparian Section Condition Scores<br />
North <strong>Wambo</strong> Creek Transect<br />
1N 2N 3N 4N 5N 6N 7N 8N 9N 10N 11N 12N 13N 14N<br />
Average Height 3 3 3 2 3 3 2 3 3 3 3 3 3 3<br />
Total PFC 2 2 2 1 2 2 2 3 3 2 2 2 3 2<br />
Total PFC of Weeds Only 0 0 -1 -1 -1 -1 -1 -1 -1 -1 -1 0 0 0<br />
Number of Overstorey<br />
Species<br />
2 1 2 1 2 2 2 3 3 2 2 1 1 2<br />
Reproductive Stage 2 2 2 2 2 2 2 2 2 2 2 2 2 2<br />
Native Vegetation<br />
Recruitment<br />
3 3 1 1 2 3 3 3 3 3 3 3 3 3<br />
Average Height 2 2 2 2 2 3 1 2 2 1 1 2 2 3<br />
Total PFC Incl. Weeds 1 1 1 1 1 1 1 1 1 1 1 1 1 1<br />
Total PFC of Weeds Only 0 -1 0 -1 -1 0 -1 0 -1 -1 -1 -1 -1 -1<br />
Native Vegetation<br />
Recruitment<br />
3 2 1 1 1 3 3 3 3 3 1 3 3 2<br />
Average Height 2 3 3 3 2 2 2 2 2 3 2 2 2 2<br />
Leaf Litter Depth 1 1 1 0 0 1 1 1 1 1 1 1 1 1<br />
Leaf Letter Cover 0 0 0 0 0 0 0 0 0 0 0 0 0 0<br />
Bare Soil Cover 3 3 3 3 3 3 3 3 3 3 3 3 3 3<br />
Total PFC Incl. Weeds 3 3 3 3 3 3 3 3 3 3 3 3 3 3<br />
Total PFC of Weed<br />
Species<br />
-1 -1 -2 -1 -1 -1 -1 -1 0 -1 -1 0 0 -1<br />
Number of Groundcover<br />
Species<br />
0 2 2 2 2 2 2 3 3 2 2 2 2 2<br />
Number of Weed Species -3 -3 -3 -3 -3 -3 -3 -3 -3 -3 -3 -3 -3 -3<br />
Rabbits -3 -2 -3 -3 -3 -2 -2 -2 0 0 0 0 0 0<br />
Pigs 0 0 0 0 0 0 0 0 0 0 0 0 0 0<br />
Dogs/Foxes 0 0 0 0 0 0 -2 -3 -1 -1 0 0 -3 0<br />
Other 0 0 0 0 0 0 0 0 0 0 0 0 0 0<br />
Top Soil 3 3 3 3 3 3 3 3 3 3 3 3 3 3<br />
Mass Movement 0 0 0 0 0 0 0 0 0 0 0 0 0 0<br />
Sheet or Rill Erosion 0 0 0 0 0 0 0 0 0 0 0 0 0 0<br />
Gully Erosion -1 0 0 -3 -2 0 -1 0 0 -2 -2 0 0 0<br />
Stream Bank 0 -1 0 0 -1 -1 -1 0 -1 0 -2 -2 -2 -2<br />
Soil Compaction 0 0 0 0 0 0 0 0 0 0 0 0 0 0<br />
Sedimentation Evidence 0 0 -2 0 0 0 0 0 0 0 -1 0 0 0<br />
Water Presence 1 1 1 1 1 1 1 1 1 1 1 1 1 1<br />
Rocks 1 1 1 1 1 0 2 2 0 0 0 0 0 0<br />
Timber 2 3 2 0 1 2 3 3 3 1 3 3 3 3<br />
Rubbish 0 0 0 0 0 0 0 0 0 0 0 0 0 0<br />
Unauthorised Access 0 0 0 0 0 0 0 0 0 0 0 0 0 0<br />
Other 0 0 0 0 0 0 0 0 0 0 0 0 0 0<br />
Score 26 28 22 15 19 28 24 31 32 25 22 29 27 29<br />
Condition M G M M M G M G G M M G M G<br />
<strong>2011</strong> Annual Ecological Monitoring Report, Final Report, May <strong>2012</strong> Page 97
Overstorey<br />
Understorey<br />
Ground Cover<br />
Table 5-2: Stoney Creek Riparian Condition Scores<br />
Transect<br />
Section<br />
1C 2C 3C 4C 5C 1T 2T 3T 4T<br />
Average Height 3 3 2 3 3 3 3 3 3<br />
Total PFC 3 3 1 2 1 3 2 2 2<br />
Total PFC of Weeds Only 0 0 -1 0 0 0 -1 -1 0<br />
Number of Overstorey Species 3 2 1 2 2 3 3 3 2<br />
Reproductive Stage 2 2 0 2 2 2 2 2 2<br />
Native Vegetation Recruitment 3 3 0 2 3 3 3 3 1<br />
Average Height 3 3 3 3 3 3 2 3 2<br />
Total PFC Incl. Weeds 2 2 1 2 1 2 1 1 2<br />
Total PFC of Weeds Only 0 0 0 -1 0 0 0 0 0<br />
Native Vegetation Recruitment 3 3 2 3 3 3 3 3 3<br />
Average Height 2 2 2 2 2 3 2 2 2<br />
Leaf Litter Depth 1 1 1 1 1 1 1 1 1<br />
Leaf Letter Cover 1 2 0 0 0 1 1 0 0<br />
Bare Soil Cover 2 2 3 3 3 3 3 3 3<br />
Total PFC Incl. Weeds 1 1 3 1 2 3 3 2 3<br />
Total PFC of Weed Species 0 0 0 -1 -1 0 0 -1 -1<br />
Number of Groundcover Species 3 2 3 2 2 3 3 2 2<br />
Introduced Species Number of Weed Species -2 -2 -3 -3 -3 -2 -3 -3 -3<br />
Rabbits 0 0 -2 -1 -1 0 -1 -3 -3<br />
Feral Animal Activity<br />
Pigs 0 0 0 0 0 0 0 0 0<br />
Dogs/Foxes 0 0 0 0 0 0 0 0 0<br />
Other 0 0 0 0 0 0 0 0 0<br />
Top Soil 3 3 3 3 3 3 3 3 3<br />
Mass Movement 0 0 0 0 0 0 0 0 0<br />
Sheet or Rill Erosion 0 0 0 0 0 0 0 0 0<br />
Surface Stability Gully Erosion 0 0 0 0 0 0 -2 -1 -1<br />
Stream Bank 0 0 0 0 0 0 -2 -1 -2<br />
Soil Compaction 0 0 0 0 0 0 0 0 0<br />
Sedimentation Evidence 0 0 0 0 0 0 0 0 0<br />
Water Presence 0 1 0 0 0 1 1 1 1<br />
Riparian Microhabitat Rocks 2 2 0 1 1 2 2 2 2<br />
Timber 3 3 1 2 3 3 2 2 3<br />
Rubbish 0 0 0 -2 0 0 0 0 0<br />
Disturbance<br />
Unauthorised Access 0 0 0 0 0 0 0 0 0<br />
Other 0 0 0 0 0 0 0 0 0<br />
Score 38 38 20 26 30 43 31 28 27<br />
Condition E E M M G E E G M<br />
<strong>2011</strong> Annual Ecological Monitoring Report, Final Report, May <strong>2012</strong> Page 98
Overstorey<br />
Understorey<br />
Ground Cover<br />
Table 5-3: South <strong>Wambo</strong> Creek Riparian Condition Scores<br />
Transect<br />
Section<br />
1B 2B 3B 4B 5B 1S 2S 3S 4S<br />
Average Height 1 3 2 2 2 3 3 2 3<br />
Total PFC 2 2 1 2 1 2 2 2 2<br />
Total PFC of Weeds Only 1 0 0 -1 0 0 0 0 0<br />
Number of Overstorey Species 1 2 2 2 1 2 2 2 2<br />
Reproductive Stage 2 2 2 2 2 2 2 2 2<br />
Native Vegetation Recruitment 2 3 2 3 2 3 3 3 3<br />
Average Height 0 0 0 1 0 1 2 1 1<br />
Total PFC Incl. Weeds 0 0 0 1 0 1 1 1 1<br />
Total PFC of Weeds Only 0 0 0 -1 0 -1 0 0 -1<br />
Native Vegetation Recruitment 0 0 0 3 0 2 2 2 1<br />
Average Height 2 2 2 2 2 2 2 2 2<br />
Leaf Litter Depth 0 1 0 1 0 1 1 1 1<br />
Leaf Letter Cover 0 1 0 0 0 0 0 0 0<br />
Bare Soil Cover 3 3 3 3 3 3 3 3 3<br />
Total PFC Incl. Weeds 3 3 3 3 3 3 3 3 3<br />
Total PFC of Weed Species 0 0 0 0 0 0 -1 -1 0<br />
Number of Groundcover Species 1 1 1 1 2 1 2 2 2<br />
Introduced Species Number of Weed Species -2 -3 -2 -2 -2 -3 -3 -3 -3<br />
Rabbits -1 -1 -2 -1 0 -2 -3 -2 -1<br />
Feral Animal Activity<br />
Pigs 0 0 0 0 0 0 0 0 0<br />
Dogs/Foxes 0 0 0 0 0 -1 0 0 0<br />
Other 0 0 0 0 0 0 0 0 0<br />
Top Soil 3 3 3 3 3 3 3 3 3<br />
Mass Movement 0 0 0 0 -1 0 0 0 0<br />
Sheet or Rill Erosion 0 0 0 0 0 0 0 0 0<br />
Surface Stability Gully Erosion 0 0 0 0 0 0 0 0 0<br />
Stream Bank -2 -1 -1 -1 -1 -1 -1 -1 -1<br />
Soil Compaction 0 0 0 0 0 0 0 0 0<br />
Sedimentation Evidence -1 -1 -1 -1 -1 -1 -1 -1 -1<br />
Water Presence 1 1 0 0 0 3 3 1 0<br />
Riparian<br />
Rocks<br />
Microhabitat<br />
0 0 1 2 0 0 2 2 2<br />
Timber 0 1 0 2 2 3 2 3 2<br />
Rubbish 0 0 0 0 0 0 0 0 0<br />
Disturbance Unauthorised Access 0 0 0 0 0 0 0 0 0<br />
Other 0 0 0 0 0 0 0 0 0<br />
Score 16 22 16 26 18 26 29 27 26<br />
Condition M M M M M M G M M<br />
<strong>2011</strong> Annual Ecological Monitoring Report, Final Report, May <strong>2012</strong> Page 99
Appendix G<br />
Riparian Condition Photographs<br />
<strong>2011</strong> Annual Ecological Monitoring Report, Final Report, May <strong>2012</strong> Page 100
Table 5-4: <strong>2011</strong> Stoney Creek Riparian Condition Photographs Compared with 2010 Photographs<br />
Transect Left Bank 1 Upstream 2 Right Bank 1 Downstream 2<br />
1C <strong>2011</strong><br />
1C 2010<br />
2C <strong>2011</strong><br />
2C 2010<br />
<strong>2011</strong> Annual Ecological Monitoring Report, Final Report, May <strong>2012</strong> Page 101
Transect Left Bank 1 Upstream 2 Right Bank 1 Downstream 2<br />
3C <strong>2011</strong><br />
3C 2010<br />
4C <strong>2011</strong><br />
4C 2010<br />
<strong>2011</strong> Annual Ecological Monitoring Report, Final Report, May <strong>2012</strong> Page 102
Transect Left Bank 1 Upstream 2 Right Bank 1 Downstream 2<br />
5C <strong>2011</strong><br />
5C 2010<br />
<strong>2011</strong> Annual Ecological Monitoring Report, Final Report, May <strong>2012</strong> Page 103
Table 5-5: <strong>2011</strong> South <strong>Wambo</strong> Creek Riparian Condition Photographs compared to 2010 photos<br />
Transect Left Bank 1 Upstream 2 Right Bank 1 Downstream 2<br />
1B <strong>2011</strong><br />
1B 2010<br />
2B <strong>2011</strong><br />
<strong>2011</strong> Annual Ecological Monitoring Report, Final Report, May <strong>2012</strong> Page 104
Transect Left Bank 1 Upstream 2 Right Bank 1 Downstream 2<br />
2B 2010<br />
3B <strong>2011</strong><br />
3B 2010<br />
4B <strong>2011</strong><br />
<strong>2011</strong> Annual Ecological Monitoring Report, Final Report, May <strong>2012</strong> Page 105
Transect Left Bank 1 Upstream 2 Right Bank 1 Downstream 2<br />
4B 2010<br />
5B <strong>2011</strong><br />
5B 2010<br />
1 = Bank side was assessed while looking upstream. Left and right bank photos were taken from any position along the transect that allowed as<br />
much as possible of the bank to be contained within the photograph.<br />
2 = Upstream and downstream photographs were taken while standing in the centre of the creek channel.<br />
<strong>2011</strong> Annual Ecological Monitoring Report, Final Report, May <strong>2012</strong> Page 106
Table 5-6: <strong>2011</strong> North <strong>Wambo</strong> Riparian Condition Photographs compared with 2010 Photographs<br />
Transect Left Bank 1 Upstream 2 Right Bank 1 Downstream 2<br />
1A <strong>2011</strong><br />
1A 2010<br />
2A <strong>2011</strong><br />
2A 2010<br />
<strong>2011</strong> Annual Ecological Monitoring Report, Final Report, May <strong>2012</strong> Page 107
Transect Left Bank 1 Upstream 2 Right Bank 1 Downstream 2<br />
3A <strong>2011</strong><br />
3A 2010<br />
4A <strong>2011</strong><br />
4A 2010<br />
<strong>2011</strong> Annual Ecological Monitoring Report, Final Report, May <strong>2012</strong> Page 108
Transect Left Bank 1 Upstream 2 Right Bank 1 Downstream 2<br />
5A <strong>2011</strong><br />
5A 2010<br />
6A <strong>2011</strong><br />
6A 2010<br />
<strong>2011</strong> Annual Ecological Monitoring Report, Final Report, May <strong>2012</strong> Page 109
Transect Left Bank 1 Upstream 2 Right Bank 1 Downstream 2<br />
7A <strong>2011</strong><br />
7A 2010<br />
8A <strong>2011</strong><br />
8A 2010<br />
<strong>2011</strong> Annual Ecological Monitoring Report, Final Report, May <strong>2012</strong> Page 110
Transect Left Bank 1 Upstream 2 Right Bank 1 Downstream 2<br />
9A <strong>2011</strong><br />
9A 2010<br />
10A<br />
<strong>2011</strong><br />
10A<br />
2010<br />
<strong>2011</strong> Annual Ecological Monitoring Report, Final Report, May <strong>2012</strong> Page 111
Transect Left Bank 1 Upstream 2 Right Bank 1 Downstream 2<br />
11A<br />
<strong>2011</strong><br />
11A<br />
2010<br />
12A<br />
<strong>2011</strong><br />
12A<br />
2010<br />
<strong>2011</strong> Annual Ecological Monitoring Report, Final Report, May <strong>2012</strong> Page 112
Transect Left Bank 1 Upstream 2 Right Bank 1 Downstream 2<br />
13A<br />
<strong>2011</strong><br />
13A<br />
2010<br />
14A<br />
<strong>2011</strong><br />
14A<br />
2010<br />
<strong>2011</strong> Annual Ecological Monitoring Report, Final Report, May <strong>2012</strong> Page 113
Transect Left Bank 1 Upstream 2 Right Bank 1 Downstream 2<br />
15A<br />
<strong>2011</strong><br />
15A<br />
2010<br />
1 = Bank side was assessed while looking upstream. Left and right bank photos were taken from any position along the transect that allowed as<br />
much as possible of the bank to be contained within the photograph.<br />
2 = Upstream and downstream photographs were taken while standing in the centre of the creek channel.<br />
<strong>2011</strong> Annual Ecological Monitoring Report, Final Report, May <strong>2012</strong> Page 114
Appendix H<br />
Staff Qualifications<br />
<strong>2011</strong> Annual Ecological Monitoring Report, Final Report, May <strong>2012</strong> Page 115
Curriculum Vitae<br />
TOBY LAMBERT<br />
Principal Ecologist<br />
Newcastle, NSW<br />
Bachelor of Environmental Science, University of Newcastle, 1993 - 1996<br />
Accredited BioBanking Assessor, Tafe NSW – Ryde, 2009<br />
NSW Driver’s Licence (Class C)<br />
OH&S Induction Training (Green Card)<br />
NPWS Scientific Investigation Licence and NSW Animal Ethics Research Authority<br />
AREAS OF EXPERTISE:<br />
Toby has over fifteen years experience in undertaking and managing a diverse array of ecological and<br />
environmental surveys and assessments. As a Principal Ecologist, he supervises all facets of flora and fauna<br />
assessment and related reports: planning, supervision of field and reporting staff, project scheduling, budget<br />
management, liaising with clients and Government departments and providing advice of all kinds. He has also been<br />
called upon to prepare expert evidence for matters at the NSW Land and Environment Court. Toby has<br />
produced ecological and environmental documentation for private and public projects ranging in complexity. These<br />
include a number of wind farms throughout Australia and New Zealand, coal mines and a range of infrastructure<br />
projects within the Hunter region. Toby has also managed ecological master planning for residential projects in<br />
Sydney, the Central Coast and the Hunter. Toby’s fields of expertise are Environmental Impact Assessment and<br />
mediation, flora, fauna and habitat survey method, design and identification, detailed understanding of legislation<br />
and threatened species issues, terrestrial fauna surveys and project management. He has experience in conducting<br />
comprehensive fauna surveys and preparing related documentation in a broad array of environments throughout<br />
New South Wales, with most projects located in the greater Sydney area, Mid-West, Blue Mountains, Central<br />
Coast, Hunter and Forster / Great Lakes regions. Toby has also undertaken ecological projects in Western<br />
Australia, Queensland, the ACT and New Zealand.<br />
SELECTED PROJECT EXPERIENCE:<br />
Ecology<br />
Centennial <strong>Coal</strong> - Environmental Project Manager for consultancy works to Centennial <strong>Coal</strong> covering a broad<br />
range of disciplines, but primarily focussed on ecological impact assessments, monitoring and management at<br />
numerous coal mines in the Mid-West, western Blue Mountains and Lake Macquarie NSW.<br />
<strong>Peabody</strong> <strong>Energy</strong> Australia - Senior Project Manager for project specific and ongoing monitoring<br />
requirements for <strong>Wambo</strong> <strong>Coal</strong> Mine at Warkworth in the Upper Hunter Valley, Toby liases directly with the<br />
Environmental Manager of the mine in relation to requirements to fulfil consent conditions for the ongoing<br />
development and operation of the project.<br />
Allco Wind <strong>Energy</strong> - This involved undertaking fauna surveys for a 100 turbine wind farm on the North<br />
Island of New Zealand and coordinating other ecological specialists to prepare an ecological impact assessment<br />
for submission to Taranaki Council. Aspects included regular liason with the Department of Conservation<br />
regarding issues of significance, survey methodology, and mitigation and management measures to protect<br />
significant ecological features. Local bird groups were also involved and Toby was involved in the public<br />
consultation sessions.<br />
Stockland Wallarah Peninsula - This Lake Macquarie, NSW project required a multi-disciplinary approach<br />
to an innovative residential proposal on environmentally sensitive land. Project management of, and participation<br />
in, a large and diverse planning team were major features of this work. Toby was a pivotal member of the<br />
rpsgroup.com.au
Curriculum Vitae<br />
- CONTINUED -<br />
project management team that provided the detailed ecological input and advice that was required from the<br />
early stages of the planning process to the point of submission to determining authorities. The proposal<br />
required sophisticated and creative impact assessment and reporting. Toby made a major contribution to the<br />
production of a series of comprehensive ecological reports that ensured the ecological integrity of the site was<br />
maintained in the post-development landscape.<br />
Hunter Economic Zone Industrial Estate - Project Manager for the environmental component of the<br />
development of the Hunter Economic Zone industrial estate at Kurri Kurri, to be the largest industrial estate in<br />
NSW.<br />
PREVIOUS EXPERIENCE:<br />
Senior Project Manager - Cumberland Ecology, Epping 2005<br />
Duties included flora and fauna surveying and survey design; overseeing and contribution to the preparation of<br />
complex ecological and environmental reports for both small and large projects; flora and fauna surveying and<br />
survey design; liaison with both the private sector and federal, state and local government departments.<br />
Principal Consultant / Co-Founder - Keystone Ecological, Kariong 2004 - 2005<br />
Preparation and development of Keystone Ecological Flora and Fauna Impact Assessment report format;<br />
development of client database, including organisation of promotional material, logo design and customer relations;<br />
administration including preparation of quotes and invoices and organising accounts and BAS statements; Flora and<br />
fauna surveying and survey design; along with Anabat II Data Analysis.<br />
Project Manager - Ecology - Conacher Travers Environmental, Somersby 1998 - 2004<br />
Supervision of flora and fauna survey design; report quality control; production of technical reports such as Review<br />
of Environmental Factors, Flora & Fauna Assessments, Statement of Environmental Effects, Species Impact<br />
Statements and Plans of Management, Land and Environment Court Evidence preparation, EPBC Act Referrals and<br />
Preliminary Information preparation; Flora & fauna surveying; liaison with Department of Environment and<br />
Conservation, Department of Environment and Heritage, Department of Infrastructure, Planning and Natural<br />
Resources, Department of Agriculture, Local Governments and private clients; Anabat II Data Analysis; Water<br />
Testing; Data Recording and Statistical Analysis.<br />
Volunteer for Green and Golden Bell Frog Survey - Australian Museum, North Avoca 1999 - 2001<br />
Survey and searches for the endangered species Green & Golden Bell Frog; assisting in weighing, measuring and<br />
micro-chipping frogs for on-going research purposes.<br />
Environmental Scientist - Australian Defence Industries (ADI), St Marys 1998<br />
Bore Water Sampling; statistical analysis of test results; and report production.<br />
Environmental Scientist - Anne Clements & Associates, North Sydney 1997<br />
Field Assistant to Botanist and data recording.<br />
Research Assistant - University of Newcastle 1996<br />
Initiation of design of final year project for Biology Dept; research into fire regimes on species composition &<br />
regeneration in open woodland; use of advanced scientific equipment including infra red gas analyser in the field,<br />
and replication of experiments using computer database; theoretical knowledge on soils, nutrient cycles &<br />
vegetation types.<br />
MEMBERSHIPS & ACHIEVEMENTS:<br />
Ecological Consultants Association of NSW (ECA) – Council Member<br />
Newcastle Green Drinks for Environmental Professionals organising committee<br />
rpsgroup.com.au
Curriculum Vitae<br />
PAUL HILLIER<br />
Senior Ecologist<br />
Newcastle, NSW<br />
Bachelor of Environmental Science (Environmental Management)<br />
NSW Driver’s Licence (Class C)<br />
OH&S Induction Training (Green Card)<br />
Senior First Aid<br />
Dive Master (PADI Scuba Diver)<br />
AREAS OF EXPERTISE:<br />
Paul has broad range of Ecological Assessment reporting experience from 7 years of professional ecological work<br />
both in Australia and abroad. Project experience has primarily included a range of flora and fauna assessment<br />
disciplines as required by a wide range of corporate and domestic client requirements. Paul has been employed<br />
both within the private and public sector, providing a strong knowledge and understanding of the role of both<br />
developers and government in legislation and planning.<br />
Paul has the majority of his experience within the consultancy industry, primarily focussing on the preparation of<br />
Flora and Fauna Assessments, Environmental Assessments, Environmental Impact Statements, Review of<br />
Environmental Factors and Statement of Environmental Effects. Paul has experience with targeted threatened flora<br />
and fauna surveys, including a strong knowledge of Geographic Information Systems mapping and analyses.<br />
SELECTED PROJECT EXPERIENCE:<br />
Ecology<br />
• Ecological Constraints Master Plan – Huntlee, Singleton and Cessnock, NSW (2007-2010)<br />
• Ecosystem Function Analysis – <strong>Wambo</strong> <strong>Coal</strong>, Singleton NSW (2010).<br />
• Ecological Assessment Report – White Rock Wind Farm, Glen Innes, NSW (<strong>2011</strong>).<br />
PREVIOUS EXPERIENCE:<br />
Ecological Records Officer – West Yorkshire Ecology (2007-2009)<br />
Duties included collection and collation of ecological records from across West Yorkshire, United Kingdom;<br />
Preparation of fee proposals for ecological services; GIS/ spatial analysis and database management; Database<br />
searches and reporting; Liaison with client, stakeholder groups, state and local governing bodies; Review of local<br />
planning applications and consequent consultations to local councils.<br />
Ecologist – Harper Somers O’Sullivan (2004-2006)<br />
Duties included flora and fauna surveying and survey design; overseeing and contribution to the preparation of<br />
complex ecological and environmental reports for both small and large projects; liaison with both the private<br />
sector and federal, state and local government department.<br />
MEMBERSHIPS & ACHIEVEMENTS:<br />
• For Australian Wildlife Needing Aid (FAWNA), NSW Australia<br />
rpsgroup.com.au
Curriculum Vitae<br />
ROB SANSOM<br />
Botanist/Ecologist<br />
Newcastle, NSW<br />
Bachelor of Science (Hons), University of New England<br />
AREAS OF EXPERTISE:<br />
Robert has over eleven years experience in undertaking a diverse array of ecological and environmental surveys<br />
and assessments. Rob has also produced or sourced background information on ecological and environmental<br />
matters for use by expert witnesses in support of clients in the NSW Land and Environment Court.<br />
Rob’s fields of special competence are Threatened Flora species searches; Threatened Flora, Vegetation and<br />
Bushland Management Plans; delineation and GPS plotting of Vegetation Community boundaries; and species /<br />
community / wetland monitoring surveys and reporting.<br />
• Environmental and ecological impact assessment, monitoring and reporting<br />
• Terrestrial flora and habitat survey design, execution, analysis and reporting<br />
• Spatial mapping of vegetation and threatened flora species using differentially corrected<br />
• GPS accurate to less than 1 metre<br />
• Understanding of threatened species legislation, issues and requirements<br />
• Bushland and vegetation management planning and monitoring<br />
• Threatened Flora Management Plans and Monitoring<br />
• Bushfire Threat Assessments<br />
• Production of a wide variety of reports and assessments<br />
• Targeted threatened flora surveys<br />
• Flora identification and habitat assessment<br />
• Delineation and GPS mapping of vegetation community boundaries<br />
• Ecological Community quality assessments and reports<br />
• Experience in PATN Statistical package<br />
SELECTED PROJECT EXPERIENCE:<br />
Mining<br />
• Angus Place – Flora and Fauna Impact Assessment for proposed longwall mining. Includes vegetation surveys,<br />
Community Mapping, Flora Species Identification and assessment under the NSW Threatened Species<br />
Conservation Act 1995, (TSC Act 1995) and the Commonwealth Environment Protection and Biodiversity<br />
Conservation Act 1999, (EPBC Act 1999).<br />
• Bulga Mine Refuelling Facility – Flora and Fauna Impact Assessment including field survey, vegetation<br />
community mapping, flora species identification, writing of Flora and Fauna Assessment to address the<br />
requirements of the TSC Act (1995) and the EPBC Act (1999).<br />
Infrastucture<br />
• Transgrid - Mangrove Mountain – Targeted searches for threatened flora species (Tetratheca glandulosa and<br />
Prostanthera junonis) prior to regular maintenance of high voltage power line easements, mark-up and mapping of<br />
locations, population extent and counts.<br />
• Transgrid - Bulga – Targeted searches for threatened flora species and endangered ecological communities<br />
prior to regular maintenance of high voltage power line easements, mark-up and mapping of locations and<br />
extent. Flora and Fauna Assessment to address the requirements of the TSC Act (1995) and the EPBC Act<br />
(1999).<br />
rpsgroup.com.au
Curriculum Vitae<br />
- CONTINUED -<br />
• Wallarah Peninsula – Searches for Threatened species (Tetratheca juncea, Syzygium paniculatum and Grevillea<br />
parviflora) for proposed water supply and sewer lines.<br />
Monitoring<br />
• Karuah – Annual monitoring flora and fauna surveys and reporting for a Hard Rock Quarry and Processing<br />
Plant.<br />
• <strong>Wambo</strong> <strong>Coal</strong> Mine – 2 yrs annual surveys and field works associated with Landscape Function Analysis (LFA)<br />
of rehabilitated areas.<br />
Vegetation Management<br />
• Cliftleigh – Vegetation Management Plan for riparian / constructed wetland area associated with large<br />
residential development.<br />
• Cessnock – Vegetation Management Plan for proposed residential development and upgrade to golf course.<br />
• Newnes Junction – Flora and Fauna Management Plan for proposed sand extraction quarry.<br />
PREVIOUS EXPERIENCE:<br />
Botanist – Conacher Travers Pty Ltd<br />
(12 years)<br />
Involved in the production of a wide assortment of ecological reports such as Flora and Fauna Assessments (FFA),<br />
Environmental Impact Assessments (EIS), Review of Environmental Factors (REF), Bush Fire Assessments (BFA)<br />
Vegetation Management Plans (VMP), Annual Monitoring Reports (AMR) and Species Impact Statements (SIS).<br />
Responsible for flora surveys, vegetation community mapping, flora species identification and flora input into<br />
reports. Also responsible for acquiring ecological data and maintaining this data to the most up-to-date status.<br />
Botanist – Conacher Environmental Group<br />
(1 1 / 2 years)<br />
Small Project coordinator; Botanist; Data acquisition, management, manipulation and Statistical analysis. Production<br />
of a a wide variety of Reports such as FFAs, BFAs, EIS, REFs, VMPs AMR, and SIS.<br />
Botanist / Ecologist – RPS Australia East Pty Ltd<br />
(1 year)<br />
Undertaking flora and fauna field surveys, Monitoring, Land Function Analysis (LFA) and a wide variety of reports<br />
for various purposes and types of clients.<br />
MEMBERSHIPS & ACHIEVEMENTS:<br />
• OH&S Induction Training (Green Card)<br />
• NPWS Scientific Investigation Licence<br />
• NSW Animal Ethics Research Authority<br />
• Planning for Bushfire Prone Areas (Short course)<br />
• Trimble Short Course – Using Trimble Hand-held GPS Datalogger with Terrasync software and desktop<br />
Pathfinder Software.<br />
• Erosion and Sediment Control – Fundamentals of Erosion and Sediment Control (Short course)<br />
rpsgroup.com.au
Curriculum Vitae<br />
ANDREW SMITH<br />
Field Ecologist<br />
Newcastle, NSW<br />
Ph.D. (Avian Population Ecology), Bachelor of Science in Environmental Biology (Sub-major: Wildlife Ecology)<br />
NSW Driver’s Licence (Class C), 4WD Training<br />
White Card (OH&S Induction Training)<br />
Remote and Senior First Aid<br />
Waterways Authority Boating Licence<br />
AREAS OF EXPERTISE:<br />
Andrew has over 10 years experience in Environmental Science with a wide range of industry groups. His skills<br />
include project design, data collection, statistical analysis and presentation of scientific data (both written and oral<br />
communication). Andrew has produced a number of ecological reports for the private sector and as peerreviewed<br />
scientific publications. Recently, Andrew used his knowledge Australian birds to create migration route<br />
maps of a large number of bush birds that move seasonal along south-eastern Australia.<br />
SELECTED PROJECT EXPERIENCE:<br />
ENVIRONMENT<br />
Flora and fauna identification and habitat assessment<br />
Targeted threatened flora and fauna surveys<br />
Delineation and mapping of vegetation communities<br />
Endangered Ecological Community (EEC) assessment<br />
Experience with GPS/GIS for project design and mapping<br />
Conducting Field Surveys for Flora, Fauna and Habitat Identification<br />
Report Preparation including Fauna and Flora Assessments<br />
Ecological Monitoring and Reporting<br />
Vegetation Management Plan Reporting<br />
Understanding of environmental legislation<br />
PREVIOUS EXPERIENCE:<br />
Research Officer – Birds Australia (2010)<br />
Andrew was employed on the Great Eastern Ranges Initiative project: movements and landscape connectivity. The<br />
project was funded of the Department of Environment, Climate Change and Water, NSW. Primarily, he mapped<br />
the movements and migration routes of several bird species along south-eastern Australia, including the Swift<br />
Parrot, Regent Honeyeater, Flame Robin and Scarlet Robin.<br />
Scientific Officer – Department of Industry and Investment (2009)<br />
Andrew was employed under Dr Rod Kavanagh to perform over 100 bird surveys over a large area on the midnorth<br />
coast of NSW. This work was performed to help develop a broad scale biological diversity monitoring<br />
strategy.<br />
rpsgroup.com.au
Curriculum Vitae<br />
- CONTINUED -<br />
Ph.D Candidate – Australian White Ibis: University of Technology, Sydney (2005–2009)<br />
Andrew investigated the population ecology of the Australia White Ibis (Threskiornis molucca) in the urban<br />
environment. Andrew compiled detailed information on the breeding, feeding, movement and population dynamics<br />
of ibis which is critical for the longer term sustainable management of this species.<br />
Technical Officer – University of Technology, Sydney (2007–2009)<br />
Andrew was employed to help run the practical components for a number of environmental subjects: Wildlife<br />
Ecology, Animal Behaviour and Physiology, and Catchment Ecosystems. His role mainly involved teaching students<br />
a wide range of wildlife surveying techniques.<br />
MEMBERSHIPS & ACHIEVEMENTS:<br />
Ecological Consultants Association of NSW (ECA)<br />
NSW, Royal Zoological Society (RZS)<br />
Birdlife Australia<br />
Australia Bird Study Association<br />
Landscape Functional Analysis Training<br />
rpsgroup.com.au
Appendix 3<br />
Summary of<br />
Environmental Incidents
<strong>Wambo</strong> <strong>Coal</strong> Pty Limited <strong>AEMR</strong> <strong>2011</strong>-<strong>2012</strong><br />
Summary of Environmental Incidents<br />
1 July <strong>2011</strong> - 30 June <strong>2012</strong><br />
NO<br />
DATE<br />
RECEIVED<br />
AREA<br />
RESPONSIBLE<br />
CAT.<br />
1 20/9/<strong>2011</strong> Projects - Daracon 1<br />
ISSUE<br />
Excessive dust generation from Project works<br />
NWCD<br />
ACTION TAKEN<br />
Vegetation had been cleared over the previous week,<br />
exposing bulldust on high wind day.<br />
Very windy day – wind speed between 8am and 4pm<br />
on 20/9/<strong>2011</strong> was 9.5m/s @ 280 degrees (WNW).<br />
More formalised assessment of dust potential, and<br />
modification of operations in response to climatic<br />
conditions (as put into practice on the high wind day).<br />
Introduction of a second water cart. Currently a<br />
smaller subcontractor’s cart is being used, while a<br />
second (or, if required, third) large water cart is being<br />
sourced and prepared for use.<br />
Establishment of a second water refill standpipe, to<br />
provide greater flexibility in water cart refilling, and<br />
ensure greater watering coverage.<br />
Modification of refill standpipes to prevent the<br />
recurrence of the refilling difficulties caused by the<br />
strong wind gusts on the day of the incident.<br />
Identification of topsoil material with high dust<br />
potential (i.e. bulldust), and the prioritised<br />
management (stripping, stockpiling and stockpile<br />
revegetation) of that material, as permitted by<br />
prevailing weather conditions. Once the topsoil<br />
material has been stripped, stockpiled and<br />
revegetated, it is expected that the underlying clay<br />
material will represent a much lesser dust risk.<br />
• Implementation of processes for the regular<br />
inspection of the project site, closer assessment of<br />
dust monitoring results, and provision of timely<br />
feedback to the project contractors.<br />
2 6/10/<strong>2011</strong> Projects - Daracon 1 Creek line Disturbance<br />
<br />
<br />
<br />
Authorisation (DA approval) had been obtained to<br />
clear ground for construction of NWC Diversion.<br />
Vegetation clearance and ground disturbance had<br />
occurred prematurely for entire area of flood bund<br />
section of creek, causing unnecessary disturbance,<br />
and increasing erosion/ sedimentation risk.<br />
Section of impacted creek line to be revegetated. Turf<br />
Appendix 3: Summary of Environmental Incidents
<strong>Wambo</strong> <strong>Coal</strong> Pty Limited <strong>AEMR</strong> <strong>2011</strong>-<strong>2012</strong><br />
NO<br />
DATE<br />
RECEIVED<br />
AREA<br />
RESPONSIBLE<br />
CAT.<br />
ISSUE<br />
<br />
<br />
ACTION TAKEN<br />
being laid in creek bed and spray mulch on disturbed<br />
creek banks.<br />
Additional sediment control structures, including<br />
sediment pond, being installed for wider project<br />
disturbance area.<br />
Communication to project supervisors and toolbox<br />
talk to project workforce, about importance of<br />
maintaining the integrity of sediment/ erosion control<br />
measures.<br />
3 10/11/<strong>2011</strong> Downer EDI 1 Small spill in fuel farm<br />
4 28/12/<strong>2011</strong> Downer EDI 1 Excessive dust Generation<br />
5 21/01/<strong>2012</strong> Downer EDI 1 Diesel Fuel Leak<br />
<br />
<br />
<br />
<br />
<br />
<br />
<br />
<br />
<br />
<br />
<br />
Approx. 50L diesel was released into the fuel farm<br />
bunded area when an operator failed to turn off the<br />
valve prior to removing the hose.<br />
No contaminated soil or water, the fuel will be<br />
pumped out of the bund and disposed with the waste<br />
oil.<br />
Open cut areas not of operational necessity were<br />
closed off to heavy vehicle traffic to reduce watering<br />
footprint.<br />
Grading works are ongoing to remove the layer of<br />
loose surface dust and generally improve road/ramp<br />
surface conditions.<br />
Toolbox talks given to operators regarding driving to<br />
conditions, including slowing down in dry and/or<br />
windy conditions to reduce wheel generated dust.<br />
The Downer EDI Standard Work Practice (SWP) for<br />
Dust Control is being updated to improve operational<br />
response to dusty conditions.<br />
Approximately 600 litres of fuel was leaked from a<br />
punctured hose on a D10T Dozer while ripping a<br />
ramp in Montrose Open Cut<br />
The leak was quickly reported to OCE and Workshop.<br />
As the dozer was operating within the Blast Exclusion<br />
Zone the OCE requested that it move to a safe<br />
location outside of the zone before shutting down<br />
Once out of the blast area, the Dozer was isolated<br />
and absorbent materials placed around to contain the<br />
leak.<br />
Contaminated soil to be Bio-remediated once the<br />
dozer is repaired and moved away from the spill site.<br />
The operator was disciplined and retrained in the<br />
Appendix 3: Summary of Environmental Incidents
<strong>Wambo</strong> <strong>Coal</strong> Pty Limited <strong>AEMR</strong> <strong>2011</strong>-<strong>2012</strong><br />
NO<br />
DATE<br />
RECEIVED<br />
AREA<br />
RESPONSIBLE<br />
CAT.<br />
ISSUE<br />
6 05/03/<strong>2012</strong> <strong>Wambo</strong> 2 South <strong>Wambo</strong> Dam Overflow<br />
7 30/03/<strong>2012</strong> Downer Blasting 2 Vibration & fume Event<br />
8 4/05/<strong>2012</strong> Downer EDI 1 Excessive dust generation in open cut<br />
Appendix 3: Summary of Environmental Incidents<br />
<br />
<br />
<br />
<br />
<br />
<br />
<br />
<br />
<br />
<br />
<br />
<br />
ACTION TAKEN<br />
correct operation of the dozer for the given task.<br />
A discharge to ground occurred at <strong>Wambo</strong> <strong>Coal</strong><br />
Mine, when mine water overflowed from South<br />
<strong>Wambo</strong> Dam (the dam) via the dam spillway.<br />
Once the faulty water level sensor was noticed in the<br />
last week of February, a new sensor was ordered and<br />
pumping to the dam was halted (pumping from the<br />
dam continued to transfer mine water for licenced<br />
discharge).<br />
Once the discharge was noticed, minor earthworks<br />
were conducted on the dam spillway to halt the<br />
discharge, and reduce the risk of further discharge.<br />
A replacement probe for the dam water level sensor,<br />
which was on order at the time of the discharge, has<br />
been installed and calibrated to ensure accurate<br />
recording and reporting of dam water level.<br />
Earthworks are planned to ensure the spillway is<br />
reinstated in accordance with the dam design.<br />
Two shots on 30 March <strong>2012</strong> generated ground<br />
vibration and overpressure.<br />
The shots generated airborne dust and visible NOx<br />
fumes. Both shots were observed, and visible NOx<br />
fumes remained and dissipated onsite; however,<br />
airborne dust may have left site.<br />
The pre-blast checklist has been modified to include<br />
a Blast Fumes Checklist, which records pre-blast<br />
conditions that may contribute to visible NOx fumes,<br />
and post-blast NOx fumes observations and rating.<br />
<strong>Wambo</strong> has installed an additional blast monitoring<br />
station approximately 2km to the southwest of the<br />
existing BM05 (Muller) monitor, to ensure blast<br />
overpressure and ground vibration levels experienced<br />
at residences in that vicinity are accurately<br />
represented by those measured at BM05.<br />
Report sent to EPA – Recommendations/Outcomes<br />
pending<br />
Dust observed from haul trucks in Montrose and<br />
Bates Pits during open cut inspection.<br />
Immediately following the inspection, haul trucks<br />
were instructed to reduce speed until additional<br />
watercarts were made available.<br />
The two remaining watercarts were repaired and
<strong>Wambo</strong> <strong>Coal</strong> Pty Limited <strong>AEMR</strong> <strong>2011</strong>-<strong>2012</strong><br />
NO<br />
DATE<br />
RECEIVED<br />
AREA<br />
RESPONSIBLE<br />
CAT.<br />
ISSUE<br />
9 19/05/<strong>2012</strong> Downer EDI 1 Hydraulic Oil Leak<br />
10 21/05/<strong>2012</strong> <strong>Wambo</strong> 1 Drill site established on unapproved site<br />
11 21/05/<strong>2012</strong> <strong>Wambo</strong> 2 C11 Dam Seepage<br />
<br />
<br />
<br />
<br />
<br />
<br />
<br />
<br />
<br />
<br />
<br />
<br />
<br />
<br />
ACTION TAKEN<br />
made operational, with four watercarts operating by<br />
3.30pm that day.<br />
Shift supervisors have been reminded of their duty to<br />
report and address dust generating conditions, as per<br />
the Downer EDI Mining Standard Work Practice -<br />
Dust Management (SWP 1021).<br />
On Monday 07 May, operations were modified, in<br />
accordance with SWP 1021, due to dry, windy<br />
conditions.<br />
Driller noticed oil coming from rig during operation.<br />
Immediately shut down and isolated machine.<br />
Then proceeded to contain spill using provided spill<br />
kit materials.<br />
Maintenance inspection and testing was carried out<br />
by Onedrill<br />
Contractors accidentally established drill site at a<br />
location on <strong>Wambo</strong> owned land in<br />
The error arose through confusion between this site<br />
and another nearby site that had been approved.<br />
Environmental Dpt spoke with both the Geologists<br />
and Contractors to ensure correct Surface<br />
Disturbance permit process of site approval and<br />
establishment are being followed.<br />
Identified that flow of documentation was not<br />
reaching all personnel involved directly in setting up<br />
the site which allowed for the wrong site to be<br />
established.<br />
All personnel involved are now to receive a copy of<br />
relevant documents. Supervisor must physically visit<br />
the site with the personnel.<br />
A discharge to ground occurred at <strong>Wambo</strong> <strong>Coal</strong><br />
Mine, when mine water seeped through spoil from<br />
C11Dam (the dam) onto a neighbouring mine’s land.<br />
The discharge was first noticed on the 21 May <strong>2012</strong>.<br />
Diesel pump installed in C11 to pump down water<br />
level<br />
Farm dam on United land reinstated to catch<br />
seepage. Sediment control placed downstream.<br />
Vacuum truck used to recover seepage water from<br />
downstream of farm dam.<br />
Appendix 3: Summary of Environmental Incidents
Appendix 4<br />
Register of Community<br />
Complaints
<strong>Wambo</strong> <strong>Coal</strong> Pty Ltd <strong>AEMR</strong> <strong>2011</strong>-<strong>2012</strong><br />
Number<br />
Date<br />
(d/m/yr)<br />
Complainant<br />
ID#<br />
1 29/07/<strong>2011</strong> 2 Noise<br />
<strong>Peabody</strong> <strong>Wambo</strong> <strong>Coal</strong> - Complaint Register - July <strong>2011</strong><br />
Type - Primary Receiving Officer Action Taken<br />
Lachlan Crawford (OEH<br />
Hotline)<br />
<strong>Peabody</strong> <strong>Wambo</strong> <strong>Coal</strong> - Complaint Register – August <strong>2011</strong><br />
Complaint logged. Investigated. Noise consent<br />
exceeded, likely due to environmental<br />
conditions. No further action<br />
Number<br />
Date<br />
(d/m/yr)<br />
Complainant<br />
ID#<br />
Type - Primary<br />
Type -<br />
Secondary<br />
2 05/8/<strong>2011</strong> 1 Noise Dust<br />
Receiving Officer<br />
Lachlan Crawford (OEH<br />
Hotline/DOPI by phone)<br />
3 15/8/<strong>2011</strong> 1 Water discharge Troy Favell<br />
Action Taken<br />
Complaint logged. Investigated.<br />
Noise source not identified, no<br />
operations occurring within<br />
described area. Complainant<br />
contacted by WCPL staff. No further<br />
action<br />
Complaint logged. Investigated.<br />
Discharge point capped. No further<br />
action<br />
Number<br />
Date<br />
(d/m/yr)<br />
Complainant<br />
ID#<br />
4 13/09/<strong>2011</strong> 1 Noise<br />
<strong>Peabody</strong> <strong>Wambo</strong> <strong>Coal</strong> - Complaint Register – September <strong>2011</strong><br />
Type - Primary Receiving Officer Action Taken<br />
Lachlan Crawford (OEH<br />
Hotline/DOPI by phone)<br />
5 14/09/<strong>2011</strong> 11 Dust Lachlan Crawford<br />
Complaint logged. Investigated.<br />
Complainant contacted by WCPL<br />
staff. No further action<br />
Complaint logged. Investigated.<br />
Operations modified to reduce<br />
future dust production.<br />
Complainant contacted by WCPL<br />
Staff. No further action.<br />
Appendix 4: Summary of Community Complaints
<strong>Wambo</strong> <strong>Coal</strong> Pty Ltd <strong>AEMR</strong> <strong>2011</strong>-<strong>2012</strong><br />
<strong>Peabody</strong> <strong>Wambo</strong> <strong>Coal</strong> - Complaint Register – October <strong>2011</strong><br />
Number<br />
Date<br />
(d/m/yr)<br />
Complainant<br />
ID#<br />
Type - Primary Receiving Officer Action Taken<br />
<strong>Peabody</strong> <strong>Wambo</strong> <strong>Coal</strong> - Complaint Register – November <strong>2011</strong><br />
Number<br />
Date<br />
(d/m/yr)<br />
Complainant<br />
ID#<br />
Type -<br />
Primary<br />
Receiving Officer<br />
6 16/11/<strong>2011</strong> 12 Noise Lachlan Crawford<br />
7 18/11/<strong>2011</strong> 12 Noise Lachlan Crawford<br />
8 19/11/<strong>2011</strong> 6 Noise Lachlan Crawford<br />
Action Taken<br />
Complaint logged. Investigated. Complainant<br />
contacted by WCPL staff. No further action.<br />
Complaint logged. Investigated. Within noise<br />
compliance levels. Complainant contacted by<br />
WCPL staff. No further action taken.<br />
Complaint logged. Investigated. Within noise and<br />
blast compliance t levels. Complainant contacted<br />
by WCPL staff. No further action taken.<br />
Number<br />
Date<br />
(d/m/yr)<br />
Complainant<br />
ID#<br />
<strong>Peabody</strong> <strong>Wambo</strong> <strong>Coal</strong> - Complaint Register – December <strong>2011</strong><br />
Type -<br />
Primary<br />
Receiving Officer<br />
Action Taken<br />
9 18/12/<strong>2011</strong> 12 Noise Lachlan Crawford<br />
Complaint logged. Investigated. Noise within<br />
compliance levels. Operations modified with aim<br />
of reducing noise. Complainant contacted by<br />
WCPL staff. No further action.<br />
10 23/12/<strong>2011</strong> 13<br />
Blast – Nox<br />
Fumes<br />
Troy Favell<br />
Complaint logged. Investigated. Blast outcome<br />
was considered most favourable due to ground<br />
conditions. Complainant contacted by WCPL staff/<br />
No further action.<br />
11 28/12/<strong>2011</strong> 11 Dust Lachlan Crawford Complaint logged. Investigated. Identified all<br />
Appendix 4: Summary of Community Complaints
<strong>Wambo</strong> <strong>Coal</strong> Pty Ltd <strong>AEMR</strong> <strong>2011</strong>-<strong>2012</strong><br />
12 30/12/<strong>2011</strong> 6 Noise Troy Favell<br />
available water carts were in use throughout open<br />
cut. Investigating further options. Complainant<br />
contacted by WCPL staff. No further action.<br />
Complaint logged. Investigated. Noise within<br />
compliance levels. Complainant contacted by<br />
WCPL staff. No further action.<br />
Number<br />
Date (d/m/yr)<br />
Complainant<br />
ID#<br />
<strong>Peabody</strong> <strong>Wambo</strong> <strong>Coal</strong> - Complaint Register - January <strong>2012</strong><br />
Type - Primary Receiving Officer Action Taken<br />
13 7/01/<strong>2012</strong> 12 Noise Lachlan Crawford<br />
14 8/01/<strong>2012</strong> 14 Noise Lachlan Crawford<br />
15 13/01/<strong>2012</strong> 12 Noise Lachlan Crawford<br />
16 16/01/<strong>2012</strong> 12 Noise Lachlan Crawford<br />
17 28/01/<strong>2012</strong> 12 Noise Lachlan Crawford<br />
18 29/01/<strong>2012</strong> 12 Noise Lachlan Crawford<br />
19 29/01/<strong>2012</strong> 2 Noise Lachlan Crawford (OEH Hotline)<br />
Complaint logged. Investigated. Noise within<br />
DA approved consent criteria. Complainant<br />
contacted by WCPL staff. No further action.<br />
Complaint logged. Investigated, operational<br />
changes reviewed Complainant contacted by<br />
WCPL staff. No further action.<br />
Complaint logged. Investigated. Noise within<br />
DA approved consent criteria. Complainant<br />
contacted by WCPL staff. No further action.<br />
Complaint logged. Investigated. Noise within<br />
DA approved consent criteria. Complainant<br />
contacted by WCPL staff. No further action<br />
Complaint logged. Investigated. Noise within<br />
DA approved consent criteria. Complainant<br />
contacted by WCPL staff. No further action<br />
Complaint logged. Investigated. Noise within<br />
DA approved consent criteria. Complainant<br />
contacted by WCPL staff. No further action<br />
Complaint logged. Investigated. Noise within<br />
DA approved consent criteria. Complainant<br />
contacted by WCPL staff. No further action<br />
Appendix 4: Summary of Community Complaints
Number<br />
Date<br />
(d/m/yr)<br />
Complainant<br />
ID#<br />
<strong>Wambo</strong> <strong>Coal</strong> Pty Ltd <strong>AEMR</strong> <strong>2011</strong>-<strong>2012</strong><br />
<strong>Peabody</strong> <strong>Wambo</strong> <strong>Coal</strong> - Complaint Register - February <strong>2012</strong><br />
Type - Primary Receiving Officer Action Taken<br />
20 5/02/<strong>2012</strong> 12 Noise Lachlan Crawford<br />
21 5/02/<strong>2012</strong> 2 Noise Lachlan Crawford (OEH Hotline)<br />
22 8/02/<strong>2012</strong> 3 Noise Lachlan Crawford (OEH Hotline)<br />
23 9/02/<strong>2012</strong> 13 Noise Lachlan Crawford<br />
24 10/02/<strong>2012</strong> 3 Other Lachlan Crawford<br />
25 11/02/<strong>2012</strong> 6 Noise Lachlan Crawford<br />
26 12/02/<strong>2012</strong> 12 Noise Lachlan Crawford<br />
27 15/02/<strong>2012</strong> 12 Noise Lachlan Crawford<br />
28 16/02/<strong>2012</strong> 2 Noise Lachlan Crawford (OEH Hotline)<br />
29 17/02/<strong>2012</strong> 2 Noise Lachlan Crawford (OEH Hotline)<br />
Complaint logged. Investigated. Noise within DA<br />
approved consent criteria. Complainant<br />
contacted by WCPL staff. No further action<br />
Complaint logged. Investigated. Noise within DA<br />
approved consent criteria. Complainant<br />
contacted by WCPL staff. No further action<br />
Complaint logged. Investigated. Noise within DA<br />
approved consent criteria. Complainant<br />
contacted by WCPL staff. No further action<br />
Complaint logged. Investigated. Noise within DA<br />
approved consent criteria. Complainant<br />
contacted by WCPL staff. No further action<br />
Electric fence not replaced on private resident<br />
property. Contractors contacted. New procedural<br />
guidelines to enter private residence property<br />
implemented, Private resident contacted &<br />
consulted on procedure<br />
Complaint logged. Investigated. Noise within DA<br />
approved consent criteria. Complainant<br />
contacted by WCPL staff. No further action<br />
Complaint logged. Investigated. Noise within DA<br />
approved consent criteria. Complainant<br />
contacted by WCPL staff. No further action<br />
Complaint logged. Investigated. Noise within DA<br />
approved consent criteria. Complainant<br />
contacted by WCPL staff. No further action<br />
Complaint logged. Investigated. Noise within DA<br />
approved consent criteria. Complainant<br />
contacted by WCPL staff. No further action<br />
Complaint logged. Investigated. Noise within DA<br />
approved consent criteria. Complainant<br />
contacted by WCPL staff. No further action.<br />
Appendix 4: Summary of Community Complaints
<strong>Wambo</strong> <strong>Coal</strong> Pty Ltd <strong>AEMR</strong> <strong>2011</strong>-<strong>2012</strong><br />
30 22/02/<strong>2012</strong> 2 Noise Lachlan Crawford (OEH Hotline)<br />
31 22/02/<strong>2012</strong> 12 Noise Lachlan Crawford<br />
32 23/02/<strong>2012</strong> 12 Noise Lachlan Crawford<br />
33 23/02/<strong>2012</strong> 2 Noise Lachlan Crawford (OEH Hotline)<br />
34 23/02/<strong>2012</strong> 2 Noise Lachlan Crawford (OEH Hotline)<br />
35 24/02/<strong>2012</strong> 12 Noise Lachlan Crawford<br />
36 25/02/<strong>2012</strong> 12 Noise Lachlan Crawford<br />
37 26/02/<strong>2012</strong> 2 Noise Lachlan Crawford (OEH Hotline)<br />
38 26/02/<strong>2012</strong> 1 Noise<br />
Lachlan Crawford (OEH<br />
Hotline/DOPI by phone)<br />
Complaint logged. Investigated. Noise within DA<br />
approved consent criteria. Complainant<br />
contacted by WCPL staff. No further action<br />
Complaint logged. Investigated. Noise within DA<br />
approved consent criteria. Complainant<br />
contacted by WCPL staff. No further action<br />
Complaint logged. Investigated. Noise within DA<br />
approved consent criteria. Complainant<br />
contacted by WCPL staff. No further action<br />
Complaint logged. Investigated. Noise within DA<br />
approved consent criteria. Complainant<br />
contacted by WCPL staff. No further action<br />
Complaint logged. Investigated. Noise within DA<br />
approved consent criteria. Complainant<br />
contacted by WCPL staff. No further action<br />
Complaint logged. Investigated. Noise within DA<br />
approved consent criteria. Complainant<br />
contacted by WCPL staff. No further action<br />
Complaint logged. Investigated. Noise within DA<br />
approved consent criteria. Complainant<br />
contacted by WCPL staff. No further action<br />
Complaint logged. Investigated. Noise within DA<br />
approved consent criteria. Complainant<br />
contacted by WCPL staff. No further action<br />
Complaint logged. Investigated. Possible<br />
meteorological enhancement. Complainant<br />
contacted by WCPL staff. No further action<br />
Number<br />
Date<br />
(d/m/yr)<br />
Complainant<br />
ID#<br />
<strong>Peabody</strong> <strong>Wambo</strong> <strong>Coal</strong> - Complaint Register - March <strong>2012</strong><br />
Type - Primary Receiving Officer Action Taken<br />
39 4/03/<strong>2012</strong> 2 Noise Lachlan Crawford (OEH Hotline)<br />
Complaint logged. Investigated. Noise within DA<br />
approved consent criteria. Complainant<br />
contacted by WCPL staff. No further action<br />
40 4/03/<strong>2012</strong> 15 Noise Lachlan Crawford (DOPI by Complaint logged. Investigated. Possible<br />
Appendix 4: Summary of Community Complaints
<strong>Wambo</strong> <strong>Coal</strong> Pty Ltd <strong>AEMR</strong> <strong>2011</strong>-<strong>2012</strong><br />
phone)<br />
41 11/03/<strong>2012</strong> 12 Noise Lachlan Crawford<br />
42 16/03/<strong>2012</strong> 3 Other Lachlan Crawford<br />
Blast - Nox<br />
43 23/03/<strong>2012</strong> 16<br />
Fumes<br />
Lachlan Crawford<br />
44 25/03/<strong>2012</strong> 3 Noise Lachlan Crawford<br />
45 25/03/<strong>2012</strong> 6 Noise Lachlan Crawford<br />
46 29/03/<strong>2012</strong> 2 Noise Lachlan Crawford (EPA Hotline)<br />
47 29/03/<strong>2012</strong> 17 Noise Lachlan Crawford<br />
48 30/03/<strong>2012</strong> 18<br />
49 30/03/<strong>2012</strong> 19<br />
50 30/03/<strong>2012</strong> 20<br />
Blast - vibration<br />
and fumes<br />
Blast - vibration<br />
and fumes<br />
Blast - vibration<br />
and fumes<br />
Lachlan Crawford<br />
Lachlan Crawford<br />
Lachlan Crawford<br />
meteorological enhancement. Complainant<br />
contacted by WCPL staff. No further action<br />
Complaint logged. Investigated. Noise within DA<br />
approved consent criteria. Complainant<br />
contacted by WCPL staff. No further action<br />
Private resident notified <strong>Wambo</strong> of contractor<br />
feeding horse. Contractor advised that under no<br />
circumstances are livestock to be approached.<br />
Procedural protocols put in place. Private<br />
landowner contacted<br />
Complaint logged. Complainant contacted by<br />
WCPL staff. No further action<br />
Complaint logged. Investigated. Noise within DA<br />
approved consent criteria. Complainant<br />
contacted by WCPL staff. No further action<br />
Complaint logged. Investigated. Noise within DA<br />
approved consent criteria. Complainant<br />
contacted by WCPL staff. No further action<br />
Complaint logged. Investigated. Noise within DA<br />
approved consent criteria. Complainant<br />
contacted by WCPL staff. No further action<br />
Complaint logged. Investigated. Noise within DA<br />
approved consent criteria. Complainant<br />
contacted by WCPL staff. No further action<br />
Complaint logged. Investigated. Blast within DA<br />
approved consent criteria. Complainant<br />
contacted by WCPL staff. No further action<br />
Complaint logged. Investigated. Blast within DA<br />
approved consent criteria. Complainant<br />
contacted by WCPL staff. No further action<br />
Complaint logged. Investigated. Blast within DA<br />
approved consent criteria. Complainant<br />
contacted by WCPL staff. No further action<br />
Appendix 4: Summary of Community Complaints
Number<br />
Date<br />
(d/m/yr)<br />
Complainant<br />
ID#<br />
<strong>Wambo</strong> <strong>Coal</strong> Pty Ltd <strong>AEMR</strong> <strong>2011</strong>-<strong>2012</strong><br />
<strong>Peabody</strong> <strong>Wambo</strong> <strong>Coal</strong> - Complaint Register - April <strong>2012</strong><br />
Type - Primary Receiving Officer Action Taken<br />
51 5/04/<strong>2012</strong> 3 Noise Lachlan Crawford<br />
52 6/04/<strong>2012</strong> 12 Noise Lachlan Crawford<br />
53 6/04/<strong>2012</strong> 21 Noise Lachlan Crawford<br />
54 11/04/<strong>2012</strong> 22 Noise Lachlan Crawford<br />
55 13/04/<strong>2012</strong> 25 Blast vibration Lachlan Crawford<br />
56 20/04/<strong>2012</strong> 12 Noise Lachlan Crawford<br />
57 21/04/<strong>2012</strong> 12 Noise Lachlan Crawford<br />
58 27/04/<strong>2012</strong> 12 Noise Lachlan Crawford<br />
59 28/04/<strong>2012</strong> 23 Noise Troy Favell<br />
Complaint logged. Investigated. Discussions held<br />
with operators to modify procedures. Complainant<br />
contacted by WCPL staff. No further action<br />
Complaint logged. Investigated. Noise within DA<br />
approved consent criteria. Complainant contacted by<br />
WCPL staff. No further action<br />
Complaint logged. Investigated. Noise within DA<br />
approved consent criteria. Complainant contacted by<br />
WCPL staff. No further action<br />
Complaint logged. Investigated. Complainant<br />
contacted by WCPL staff. No further action<br />
Complaint logged. Investigated. Blast within DA<br />
approved consent criteria. Complainant contacted by<br />
WCPL staff.<br />
Complaint logged. Investigated. Noise within DA<br />
approved consent criteria. Complainant contacted by<br />
WCPL staff. No further action<br />
Complaint logged. Investigated. Noise within DA<br />
approved consent criteria. Complainant contacted by<br />
WCPL staff. No further action<br />
Complaint logged. Investigated. Noise within DA<br />
approved consent criteria. Complainant contacted by<br />
WCPL staff. No further action<br />
Complaint logged. Investigated. Noise within DA<br />
approved consent criteria. Complainant contacted by<br />
WCPL staff.<br />
Appendix 4: Summary of Community Complaints
Number<br />
Date<br />
(d/m/yr)<br />
Complainant<br />
ID#<br />
<strong>Wambo</strong> <strong>Coal</strong> Pty Ltd <strong>AEMR</strong> <strong>2011</strong>-<strong>2012</strong><br />
<strong>Peabody</strong> <strong>Wambo</strong> <strong>Coal</strong> - Complaint Register – May <strong>2012</strong><br />
60 1/05/<strong>2012</strong> 12 Noise Troy Favell<br />
Type - Primary Receiving Officer Action Taken<br />
61 2/05/<strong>2012</strong> 3 Noise Lachlan Crawford<br />
62 2/05/<strong>2012</strong> 2 Noise<br />
63 2/05/<strong>2012</strong> 2 Noise<br />
64 3/05/<strong>2012</strong> 2 Noise - Drill<br />
Lachlan Crawford (EPA<br />
Hotline)<br />
Lachlan Crawford (EPA<br />
Hotline)<br />
Lachlan Crawford (EPA<br />
Hotline)<br />
65 3/05/<strong>2012</strong> 12 Noise Lachlan Crawford<br />
66 3/05/<strong>2012</strong> 6 Noise Lachlan Crawford<br />
67 4/05/<strong>2012</strong> 24 Blast fumes Lachlan Crawford<br />
68 9/05/<strong>2012</strong> 2 Noise<br />
69 10/05/<strong>2012</strong> 2 Noise<br />
Lachlan Crawford (EPA<br />
Hotline)<br />
Lachlan Crawford (EPA<br />
Hotline)<br />
70 12/05/<strong>2012</strong> 3 Noise Lachlan Crawford<br />
Complaint logged. Investigated. Noise within DA<br />
approved consent criteria. Complainant contacted by<br />
WCPL staff. No further action<br />
Complaint logged. Investigated. Possible meteorological<br />
enhancement. Complainant contacted by WCPL staff.<br />
No further action<br />
Complaint logged. Investigated. Noise within DA<br />
approved consent criteria. Complainant contacted by<br />
WCPL staff. No further action<br />
Complaint logged. Investigated. Noise within DA<br />
approved consent criteria. Complainant contacted by<br />
WCPL staff. No further action<br />
Complaint logged. Investigated. Noise within DA<br />
approved consent criteria. Complainant contacted by<br />
WCPL staff. No further action<br />
Complaint logged. Investigated. Noise within DA<br />
approved consent criteria. Complainant contacted by<br />
WCPL staff. No further action<br />
Complaint logged. Investigated. Noise within DA<br />
approved consent criteria. Complainant contacted by<br />
WCPL staff. No further action<br />
Complaint logged. Investigated. Complainant contacted<br />
by WCPL staff. No further action<br />
Complaint logged. Investigated. Noise within DA<br />
approved consent criteria. Complainant contacted by<br />
WCPL staff. No further action<br />
Complaint logged. Investigated. Noise within DA<br />
approved consent criteria. Possible meteorological<br />
enhancement Complainant contacted by WCPL staff. No<br />
further action<br />
Complaint logged. Investigated. Noise within DA<br />
approved consent criteria. Possible meteorological<br />
Appendix 4: Summary of Community Complaints
<strong>Wambo</strong> <strong>Coal</strong> Pty Ltd <strong>AEMR</strong> <strong>2011</strong>-<strong>2012</strong><br />
71 15/05/<strong>2012</strong> 2 Noise - Drill<br />
Lachlan Crawford (EPA<br />
Hotline)<br />
72 16/05/<strong>2012</strong> 26 Noise Lachlan Crawford<br />
73 16/05/<strong>2012</strong> 1 Noise<br />
74 17/05/<strong>2012</strong> 2 Noise<br />
75 17/05/<strong>2012</strong> 2 Noise<br />
Lachlan Crawford (EPA<br />
Hotline)<br />
Lachlan Crawford (EPA<br />
Hotline)<br />
Lachlan Crawford (EPA<br />
Hotline)<br />
76 19/05/<strong>2012</strong> 3 Noise Lachlan Crawford<br />
77 21/05/<strong>2012</strong> 2 Noise<br />
Lachlan Crawford (EPA<br />
Hotline)<br />
78 31/05/<strong>2012</strong> 18 Blast (vibration) Lachlan Crawford<br />
79 31/05/<strong>2012</strong> 2 Noise<br />
Lachlan Crawford (EPA<br />
Hotline)<br />
enhancement Complainant contacted by WCPL staff. No<br />
further action<br />
Complaint logged. Investigated. Possible meteorological<br />
enhancement. Complainant contacted by WCPL staff.<br />
No further action<br />
Complaint logged. Investigated. Noise within DA<br />
approved consent criteria. Possible meteorological<br />
enhancement. Complainant contacted by WCPL staff.<br />
No further action<br />
Complaint logged. Investigated. Noise within DA<br />
approved consent criteria. Possible meteorological<br />
enhancement Complainant contacted by WCPL staff. No<br />
further action<br />
Complaint logged. Investigated. Noise outside DA<br />
approved consent criteria. Possible meteorological<br />
enhancement Complainant contacted by WCPL staff. No<br />
further action<br />
Complaint logged. Investigated. Noise within DA<br />
approved consent criteria. Possible meteorological<br />
enhancement Complainant contacted by WCPL staff. No<br />
further action<br />
Complaint logged. Investigated. Noise within DA<br />
approved consent criteria. Possible meteorological<br />
enhancement Complainant contacted by WCPL staff. No<br />
further action<br />
Complaint logged. Investigated. Noise within DA<br />
approved consent criteria. Possible meteorological<br />
enhancement Complainant contacted by WCPL staff. No<br />
further action<br />
Complaint logged. Investigated. Vibration within DA<br />
approved consent criteria. Complainant contacted by<br />
WCPL staff. No further action<br />
Complaint logged. Investigated. Noise within DA<br />
approved consent criteria. Possible meteorological<br />
enhancement Complainant contacted by WCPL staff. No<br />
further action<br />
Appendix 4: Summary of Community Complaints
Number<br />
Date<br />
(d/m/yr)<br />
Complain<br />
ant ID#<br />
<strong>Wambo</strong> <strong>Coal</strong> Pty Ltd <strong>AEMR</strong> <strong>2011</strong>-<strong>2012</strong><br />
<strong>Peabody</strong> <strong>Wambo</strong> <strong>Coal</strong> -Complaint Register - June <strong>2012</strong><br />
Type - Primary Receiving Officer Action Taken<br />
80 13/06/<strong>2012</strong> 27 Noise Troy Favell<br />
81 14/06/<strong>2012</strong> 19 Blast (vibration) Lachlan Crawford<br />
82 14/06/<strong>2012</strong> 13 Noise Lachlan Crawford<br />
Complaint logged. Investigated. Noise within DA<br />
approved consent criteria. Possible meteorological<br />
enhancement Complainant contacted by WCPL staff.<br />
No further action<br />
Complaint logged. Investigated. Vibration within DA<br />
approved consent criteria. Complainant contacted by<br />
WCPL staff. No further action<br />
Complaint logged. Investigated. Noise within DA<br />
approved consent criteria. Possible meteorological<br />
enhancement Complainant contacted by WCPL staff.<br />
No further action<br />
Appendix 4: Summary of Community Complaints
Appendix 5<br />
Rehabilitation Plan
Appendix 6<br />
Environmental Audit<br />
Responses