Annual Report 2011-12 - Public Transport Authority - The Western ...
Annual Report 2011-12 - Public Transport Authority - The Western ...
Annual Report 2011-12 - Public Transport Authority - The Western ...

Create successful ePaper yourself
Turn your PDF publications into a flip-book with our unique Google optimized e-Paper software.
<strong>Annual</strong> <strong>Report</strong> <strong>2011</strong>-<strong>12</strong><br />
Supporting Our Community
Contents<br />
Cover<br />
Part of the PTA’s<br />
public art installation<br />
at Mount Lawley<br />
Station.<br />
Glossary of terms 2<br />
PTA year at a glance 3<br />
An introduction to your <strong>Annual</strong> <strong>Report</strong> 4<br />
Organisational chart 7<br />
Overviews 8<br />
Chief Executive Officer 8<br />
Managing Director 10<br />
Transperth <strong>12</strong><br />
Regional Town Bus Services 32<br />
School Bus Services 36<br />
Transwa 40<br />
Network and Infrastructure 48<br />
Major Projects Unit 52<br />
Infrastructure Planning and Land Services 56<br />
Strategic Asset Management Development 60<br />
PTA people 62<br />
Executive profiles 66<br />
Compliance, audits and reporting 72<br />
Compliance statements 79<br />
Service and financial achievements 80<br />
Electoral Act 1907 – Section 175ZE 88<br />
Explanation of major capital<br />
expenditure variations <strong>2011</strong>-<strong>12</strong> 90<br />
Independent audit opinion 92<br />
Audited Key Performance Indicators 94<br />
Financial statements 1<strong>12</strong><br />
Certification of financial statements 113<br />
Statement of comprehensive income 114<br />
Statement of financial position 115<br />
Statement of changes in equity 116<br />
Statement of cash flows 117<br />
Notes to the financial statements 118
To the Hon. Troy Buswell MLA<br />
Minister for <strong>Transport</strong><br />
In accordance with Section 63 of the<br />
Financial Management Act 2006, I submit<br />
for your information and presentation to<br />
Parliament the <strong>Annual</strong> <strong>Report</strong> of the <strong>Public</strong><br />
<strong>Transport</strong> <strong>Authority</strong> of <strong>Western</strong> Australia for<br />
the year ended 30 June 20<strong>12</strong>. <strong>The</strong> <strong>Annual</strong><br />
<strong>Report</strong> has been prepared in accordance<br />
with the provisions of the Financial<br />
Management Act 2006.<br />
Reece Waldock<br />
Chief Executive Officer<br />
1
Glossary of terms<br />
AM<br />
AMP<br />
ASL<br />
CAT<br />
Asset Management<br />
Asset Management Plan<br />
Acceptable Service Level<br />
Central Area Transit<br />
OTR<br />
PCL<br />
PMP<br />
PPTA<br />
On-time running<br />
Perth City Link<br />
Prevention Maintenance Program<br />
Perth <strong>Public</strong> <strong>Transport</strong> Area<br />
Category B<br />
Circle<br />
Route<br />
Incident that may have the potential to<br />
cause a serious accident.<br />
A high-frequency bus service<br />
connecting major shopping centres,<br />
universities, schools and colleges.<br />
CMR<br />
CNG<br />
CRM<br />
DAIP<br />
EEV<br />
FTZ<br />
GPS<br />
HSE<br />
IPLS<br />
Central Monitoring Room<br />
Compressed Natural Gas<br />
Composite Rate Model<br />
Disability Access and Inclusion Plan<br />
Enhanced Environmentally-friendly<br />
Vehicle<br />
Free Transit Zone<br />
Global Positioning System<br />
Health, Safety and Environment<br />
Infrastructure Planning and<br />
Land Services<br />
PSA<br />
PSM<br />
PTA<br />
RTBS<br />
SBS<br />
TOD<br />
TRIS<br />
TTO<br />
UWA<br />
Property Street Addresses<br />
Passenger Satisfaction Monitor<br />
<strong>Public</strong> <strong>Transport</strong> <strong>Authority</strong> of<br />
<strong>Western</strong> Australia<br />
Regional Town Bus Services<br />
School Bus Services (PTA branch)<br />
Transit Oriented Development<br />
Transperth Route Information System<br />
Transperth Train Operations<br />
(PTA division)<br />
University of <strong>Western</strong> Australia<br />
Farepaying<br />
boardings<br />
Initial<br />
boardings<br />
Passenger<br />
place<br />
kilometres<br />
Service<br />
kilometres<br />
Covers only those people, standard<br />
fare or concession, who pay (either<br />
by tagging on or by the purchase of<br />
a cash ticket) as they enter the system.<br />
Fare-paying boardings, plus free travel<br />
on passes, free travel on CAT services<br />
in Perth, Fremantle and Joondalup<br />
and free travel on services within the<br />
Perth FTZ.<br />
<strong>The</strong> average seat capacity multiplied<br />
by the kilometres travelled while<br />
in service.<br />
<strong>The</strong> kilometres travelled while<br />
in service.<br />
LTI<br />
N&I<br />
NMR<br />
OMI<br />
ORS<br />
OSH<br />
Lost-Time Injury<br />
Network and Infrastructure<br />
(PTA division)<br />
New MetroRail (former PTA division)<br />
Office of Multicultural Interests<br />
Office of Rail Safety<br />
Occupational Safety and Health<br />
WAGRC<br />
Acceptable<br />
Service<br />
Level (ASL)<br />
Category A<br />
<strong>Western</strong> Australian Government<br />
Railways Commission (PTA<br />
predecessor)<br />
Is defined as an hourly service during<br />
the day with at least three trips,<br />
IE at 20-minute intervals, in the peak<br />
flow direction in the morning and<br />
afternoon peaks.<br />
Incident causing serious injury, death,<br />
or significant damage.<br />
Total<br />
boardings<br />
Fare-paying boardings, plus free travel<br />
on passes, free travel on CAT services<br />
in Perth, Fremantle and Joondalup and<br />
free travel on services within the Perth<br />
FTZ, plus transfers between services.<br />
2 <strong>Public</strong> <strong>Transport</strong> <strong>Authority</strong> <strong>Annual</strong> <strong>Report</strong> <strong>2011</strong>-<strong>12</strong>
PTA year at a glance<br />
Boardings<br />
Transperth total boardings up six per cent<br />
to 144.13 million.<br />
Transwa total boardings up 0.7 per cent<br />
to 449,804.<br />
28,800 students carried by<br />
School Bus Services each day.<br />
SmartRider share of all fare-paying trips at<br />
71.2 per cent.<br />
<strong>The</strong>re was an 8.5 per cent increase in<br />
Transperth bus service kilometres, reflecting<br />
the first instalment of a substantial five-year<br />
boost in operational funding.<br />
Passenger Satisfaction<br />
Passenger Satisfaction Monitor showed<br />
85.5 per cent of Transperth customers and<br />
90 per cent of Transwa customers are happy<br />
with the overall quality of services.<br />
Customer satisfaction percentage for SmartRider<br />
in mid-high 90s.<br />
Expenditure/Revenue<br />
Transperth expenditure rose 6.5 per cent<br />
to $779.2m and fare revenue rose 13 per cent<br />
to $176.1m.<br />
Transwa expenditure rose 0.6 per cent to<br />
$46.51m and fare revenue rose 7.2 per cent<br />
to $11.22m.<br />
Bus service kilometres (operational funding)<br />
increased 8.5 per cent to 58.09m.<br />
New Facilities<br />
More than 2600 new car parking bays built<br />
at stations on the Mandurah and Joondalup lines.<br />
Deliveries started of new<br />
environmentally-friendly Volvo buses<br />
under the new 10-year contract.<br />
Completed construction of a new Central<br />
Monitoring Room, to incorporate bus<br />
operations as well as rail, and a Video<br />
Surveillance Office.<br />
Upgrades/Maintenance<br />
716 “orange” school buses (77 per cent<br />
of contracted fleet) now have seat belts<br />
and 815 (88 per cent) have air conditioning.<br />
Employees<br />
1462 people employed as at June 30.<br />
Green<br />
Transperth’s online greenhouse gas savings<br />
calculator uses travel information to calculate<br />
greenhouse gas savings when using public<br />
transport instead of a private vehicle.<br />
Charity<br />
More than $<strong>12</strong>0,000 raised by the PTA and its<br />
employees for charity<br />
3
An introduction<br />
to your <strong>Annual</strong><br />
<strong>Report</strong><br />
<strong>The</strong> <strong>Public</strong> <strong>Transport</strong> <strong>Authority</strong> of <strong>Western</strong> Australia (PTA) is<br />
responsible for the operation of all bus, train and ferry public<br />
transport services in the greater metropolitan area under the<br />
Transperth brand. It also operates public transport services in<br />
regional centres, operates road coach and rail passenger<br />
services to regional areas under the Transwa brand, and<br />
administers and manages School Bus Services (SBS).<br />
In addition to operating these transport services,<br />
the PTA is responsible for designing, building and<br />
maintaining public transport infrastructure and for<br />
protecting the long-term viability of <strong>Western</strong> Australia’s<br />
rail corridor and railway infrastructure.<br />
<strong>The</strong> PTA delivers public transport services seven days<br />
a week and in some cases up to 24 hours a day.<br />
As at June 30 20<strong>12</strong>, the PTA had 1462 employees<br />
spread across the metropolitan area, from Nowergup<br />
in the north to Mandurah in the south and Midland<br />
in the east, as well as in major regional centres such<br />
as Albany, Bunbury, Esperance, Geraldton and<br />
Kalgoorlie. <strong>The</strong> PTA also provides a substantial amount<br />
of its services and works projects using contractors<br />
and therefore has significant contract management<br />
functions.<br />
Our vision<br />
To make public transport the number one choice<br />
for connecting people and places.<br />
Our values<br />
• Respect – We value and respect our customers,<br />
suppliers and each other.<br />
• Recognition – We recognise each other for<br />
achievement, initiative and innovation.<br />
• Integrity – We are honest and ethical.<br />
• Safety – We are committed to safety and<br />
protecting your future.<br />
• Sustainability – We consider the long-term<br />
impact of everything we do – economic,<br />
social and environmental.<br />
Our purpose<br />
To provide safe, customer-focussed, efficient and<br />
cost-effective transport services.<br />
4 <strong>Public</strong> <strong>Transport</strong> <strong>Authority</strong> <strong>Annual</strong> <strong>Report</strong> <strong>2011</strong>-<strong>12</strong>
In this report, the PTA fulfils its reporting obligation<br />
by identifying the relevant strategic outcomes and<br />
its contribution to them in <strong>2011</strong>-<strong>12</strong> through:<br />
• operational reports which show the effectiveness<br />
and efficiency of our transport services (<strong>12</strong>-47).<br />
• compliance reports (72-77).<br />
• audited key performance indicators report (94-111).<br />
• audited financial report (1<strong>12</strong>-160).<br />
Measuring effectiveness<br />
and efficiency<br />
To honour the Government’s vision for <strong>Western</strong><br />
Australia, the PTA has targeted two outcomes:<br />
1. An accessible, reliable and safe public<br />
transport system.<br />
2. Protection of the long-term functionality of the rail<br />
corridor and railway infrastructure.<br />
During morning peak, the<br />
Mandurah Line (through South Perth)<br />
and the Joondalup Line (past Lake<br />
Monger) each carry the equivalent<br />
of four lanes of freeway traffic.<br />
Indicators of success in achieving the first of these<br />
outcomes are based on patronage and service<br />
provision, accessibility, reliability, customer satisfaction,<br />
safety and cost efficiency.<br />
For the second outcome, success results from quality<br />
management of the railway corridor and residual issues<br />
of the rail freight network, which was leased to private<br />
sector operators in 2000.<br />
Customer Service Charter<br />
<strong>The</strong> PTA is a customer service-oriented organisation,<br />
responsible for the delivery of efficient and sustainable<br />
passenger transport services to the public. It operates<br />
under the following Customer Service Charter:<br />
• <strong>The</strong> PTA is committed to providing a quality<br />
passenger transport service to the public.<br />
• Our bus, train and ferry staff and contractors are<br />
focussed on delivering safe and reliable services.<br />
• Our staff and contractors will treat customers in a<br />
respectful and professional manner.<br />
• Our buses, trains, ferries and facilities will be clean<br />
and well presented.<br />
• Current information about all PTA services will be<br />
available from customer service staff, brochures,<br />
timetables, our call centres and our website.<br />
• <strong>The</strong> PTA will plan and review passenger transport<br />
services in consultation with the community to get<br />
the best results.<br />
• <strong>The</strong> PTA will plan and provide transport systems<br />
that respect the environment and improve<br />
sustainability.<br />
To help us improve our services we maintain an<br />
InfoLine for feedback, 13 62 13, and our websites,<br />
www.pta.wa.gov.au, www.transperth.wa.gov.au or<br />
www.transwa.wa.gov.au for specific PTA business.<br />
5
PTA and Dismantle working<br />
together in a bicycle recycling<br />
community engagement program.<br />
6 <strong>Public</strong> <strong>Transport</strong> <strong>Authority</strong> <strong>Annual</strong> <strong>Report</strong> <strong>2011</strong>-<strong>12</strong>
Organisational<br />
chart<br />
Chief Executive<br />
Officer<br />
Reece Waldock<br />
Managing Director<br />
Mark Burgess<br />
General Manager<br />
Transperth Train<br />
Operations<br />
Pat Italiano<br />
General Manager<br />
Network and<br />
Infrastructure<br />
Kim Stone<br />
Executive Director<br />
Transperth System,<br />
Regional and School<br />
Bus Services<br />
Martin White<br />
General Manager<br />
Transwa<br />
Tim Woolerson<br />
Executive<br />
Director Finance<br />
and Contracts<br />
Kevin Kirk<br />
Executive<br />
Director Safety and<br />
Strategic Development<br />
David Browne<br />
Executive Director<br />
People and<br />
Organisational<br />
Development<br />
Brian Appleby<br />
Executive Director<br />
Strategic Asset<br />
Management and<br />
Development<br />
Hugh Smith<br />
Executive Director<br />
Major Projects<br />
Ross Hamilton<br />
Executive Director<br />
Infrastructure Planning<br />
and Land Services<br />
Peter Martinovich<br />
Manager<br />
Corporate<br />
Communications<br />
David Hynes<br />
For more information on the executive<br />
team please refer to the Executive<br />
Profiles on pages 66-70 of this report.<br />
7
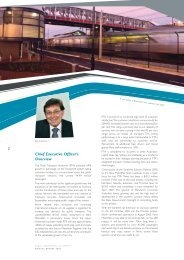
Chief Executive<br />
Officer’s<br />
overview<br />
<strong>Western</strong> Australia has firmly established itself in the last <strong>12</strong> months<br />
as leading the nation, in terms of economic and population growth.<br />
Our State is going through a period of significant transformation<br />
and a sustainable and integrated transport network is integral<br />
to maintaining this growth in the long-term.<br />
As the landscape changes, the <strong>Transport</strong> portfolio<br />
– Department of <strong>Transport</strong>, Main Roads WA and <strong>Public</strong><br />
<strong>Transport</strong> <strong>Authority</strong> – continues to play a key role in<br />
connecting people and places, providing linkages<br />
between land and sea, moving freight and providing<br />
essential services to the <strong>Western</strong> Australian community.<br />
In the heart of the city, major projects such as<br />
Elizabeth Quay and Perth City Link will positively<br />
change the form and function of the city. <strong>The</strong>se<br />
forward-thinking developments will also change the<br />
way people travel to and within the city in the short,<br />
medium and long-term.<br />
In metropolitan Perth and further afield, the <strong>Transport</strong><br />
portfolio is developing a series of strategic plans and<br />
projects to manage congestion and a rapidly-growing<br />
population, complement major developments and keep<br />
our State moving. <strong>The</strong>se initiatives will ensure <strong>Western</strong><br />
Australia has a sustainable and integrated transport<br />
system by delivering balanced transport solutions,<br />
which will benefit metropolitan and regional road<br />
users, public transport patrons, cyclists, pedestrians<br />
and industry.<br />
<strong>The</strong> <strong>Public</strong> <strong>Transport</strong> <strong>Authority</strong> is a key part of this mix<br />
and – with the Perth City Link project, the extension<br />
of the Joondalup Line to Butler, and a major role in<br />
the proposed stadium development at Burswood<br />
– the organisation’s position is becoming even<br />
more important.<br />
Looking back over the past year, I am especially<br />
proud of the increased collaboration and strengthened<br />
relationships between the <strong>Transport</strong> portfolio and other<br />
lead Government agencies. I commend the many<br />
teams and individuals who are working together<br />
to deliver on these long-term infrastructure priorities<br />
and provide the best transport solutions.<br />
In summary, we must look ahead and consider<br />
the bigger picture, where our State is a world class<br />
destination and an even better place to live. From ports<br />
to pedestrians, we are under scrutiny to get transport<br />
right, and that is exactly what we plan to do.<br />
Reece Waldock<br />
Chief Executive Officer, PTA<br />
Director General, <strong>Transport</strong> Portfolio<br />
8 <strong>Public</strong> <strong>Transport</strong> <strong>Authority</strong> <strong>Annual</strong> <strong>Report</strong> <strong>2011</strong>-<strong>12</strong>
Managing<br />
Director’s<br />
overview<br />
Since the <strong>Public</strong> <strong>Transport</strong> <strong>Authority</strong> came into being in July<br />
2003 patronage, particularly on our Transperth trains, has been<br />
increasing steadily – building on sustained patronage gains since<br />
the late 1990s.<br />
<strong>The</strong>re was a massive jump after the Mandurah Line<br />
came on stream but, even without that big influx of<br />
new passengers, the numbers were marching<br />
ahead strongly.<br />
Driven by the continuing resources boom, WA’s<br />
population has continued to grow – and so has the<br />
take-up of public transport. This year marked a turning<br />
point: the number of people living in and around<br />
Perth has reached the stage where road congestion,<br />
especially at peak, has become a major talking point.<br />
While our love affair with the car will never really be<br />
over, more and more people are becoming aware<br />
that a strong, vibrant – and well-supported – public<br />
transport system is critical if Perth, and the State as<br />
a whole, is to successfully transition to the next stage<br />
of its development.<br />
This was painfully obvious early this year when, for<br />
a couple of short periods, parts of our train system<br />
ground to a halt – and the city was badly affected.<br />
<strong>Public</strong> transport has become an essential service in<br />
the community. We keep Perth moving ... literally.<br />
When you take all our services into account –<br />
Transperth, Transwa and our regional and school bus<br />
operations – the PTA provides more than 17,000 train,<br />
bus, coach and ferry trips on an average weekday,<br />
with services spread out all over the State.<br />
During the two hour morning peak in the metropolitan<br />
area alone, we take almost 170,000 people to work,<br />
school and university, to the shops, to medical and<br />
other appointments, to visit friends and relatives.<br />
Over the course of a full weekday, there are almost<br />
600,000 public transport boardings in Perth.<br />
A significant number of these trips are taken<br />
at concession rates (including the 50c student<br />
concession) and many of them are completely free<br />
of charge. A significant proportion of these particular<br />
travellers are seniors and pensioners, whose free<br />
off-peak travel trips topped eight million in <strong>2011</strong>-<strong>12</strong>.<br />
As always, this information is explained in considerable<br />
detail in the annual report. But, impressive as these<br />
numbers may be (and we think they are pretty<br />
impressive), there is much more to the PTA than figures<br />
and statistics. You need look no further than our name,<br />
<strong>Public</strong> <strong>Transport</strong> <strong>Authority</strong>, to realise that we are about<br />
people – not just WA’s tax-paying public, who are<br />
effectively our shareholders ... and not just<br />
the hundreds of thousands of people who rely on<br />
our services every day ... but also about 1460 people<br />
who work for the PTA (and 4300-plus contractor staff)<br />
providing our services and the support structures<br />
which keep them running.<br />
10 <strong>Public</strong> <strong>Transport</strong> <strong>Authority</strong> <strong>Annual</strong> <strong>Report</strong> <strong>2011</strong>-<strong>12</strong>
While public transport is now truly a “triple bottom line”<br />
investment, offering substantial economic, social and<br />
environmental returns, the PTA also makes a conscious<br />
effort to be a good corporate citizen in other ways.<br />
This year, these included:<br />
• An updated version of 2009-10’s popular I Give<br />
Two Hoots campaign to help improve the amenity<br />
of our services by highlighting behaviour that<br />
annoys customers and encouraging positive<br />
behaviour<br />
• Introducing new Volvo buses which are several<br />
years ahead of emission standard requirements<br />
• A high-profile social media (and some cinema<br />
advertising) campaign called Trains Move Faster<br />
Than You – an offshoot of our successful Right<br />
Track and Stay Off the Tracks community education<br />
programs – to improve pedestrian crossing safety<br />
awareness<br />
• A commitment to trial (early in 2013) a Volvo<br />
B5RH hybrid bus, which will operate on electric<br />
only, diesel only or a combination of both,<br />
depending on conditions and energy requirements<br />
• Get on Board presentations delivered to a broad<br />
range of community groups<br />
• An ongoing commitment to make all our services<br />
and infrastructure as universally accessible as<br />
possible.<br />
I also want to highlight the commitment of the<br />
people who work for us and with us, who are also<br />
very aware of our role in the community and are<br />
active and willing participants in various charities<br />
and community activities.<br />
Prime among these charities is Radio Lollipop, which<br />
has been supported by the PTA (and, before that,<br />
Transperth) since 1995. With great support from<br />
our bus contractors, more than $80,000 was raised<br />
this year to help brighten the lives of sick WA children<br />
in hospitals.<br />
Movember was another well-supported charity<br />
– 38 PTA “Mo Bro’s” took part and more than<br />
$14,000 was raised. We chomped on Anzac biscuits<br />
to support Legacy, sold 65 Roses for the Cystic<br />
Fibrosis Foundation and helped our people take part<br />
in such community events as City to Surf and the<br />
Freeway Bike Hike (as well as providing extensive<br />
transport services for these events).<br />
With direct and indirect support from the PTA, our<br />
people raised more than $<strong>12</strong>0,000 for charity in<br />
<strong>2011</strong>-<strong>12</strong>. Other beneficiaries, many of which were<br />
nominated and championed by PTA staffers,<br />
included Breast Cancer WA, Schools for East Africa,<br />
the Salvation Army, Activ and the Heart Foundation.<br />
At a time when public transport is more important<br />
than ever, when we are facing increasing patronage<br />
as well as some major expansions, the quality people<br />
who make up the PTA mean that we are well placed<br />
to continue successfully meeting the challenges ahead.<br />
Mark Burgess<br />
Managing Director, PTA<br />
11
Transperth<br />
Transperth is the brand and operating name of the public transport<br />
system in the greater metropolitan area of Perth.<br />
Snapshots<br />
It consists of a bus network, a fully-electrified urban<br />
train system and a ferry service. It is managed by the<br />
Transperth branch of the Transperth System, Regional<br />
and School Bus Services (SBS) division and covers<br />
key functions such as system planning, bus service<br />
delivery, passenger information services, ticketing<br />
and bus fleet procurement.<br />
Transperth bus and ferry services are provided under<br />
commercial contract arrangements; train services are<br />
provided under an internal service level agreement by<br />
the PTA’s Transperth Train Operations (TTO) division.<br />
Passenger information is provided through Transperth<br />
InfoCentres, the Transperth InfoLine service and the<br />
Transperth website. All InfoCentres are operated<br />
under contract by Serco.<br />
Boardings<br />
• Total boardings rose six per cent to 144.13 million.<br />
• SmartRider accounted for 71.2 per cent of<br />
system-wide initial boardings.<br />
• OTR for ferry services was 96.7 per cent, for trains<br />
94.6 per cent and for buses 79.1 per cent.<br />
• <strong>The</strong> proportion of residences in the greater metro<br />
area within walking distance of acceptable-level<br />
Transperth services is a record 84.6 per cent.<br />
Revenue/Expenditure<br />
• Total expenditure rose 6.5 per cent to $779.2<br />
million; fare revenue rose 13 per cent to $176.1m.<br />
• Bus service kilometres (operational funding)<br />
increased 8.5 per cent to 58.09m.<br />
<strong>12</strong> <strong>Public</strong> <strong>Transport</strong> <strong>Authority</strong> <strong>Annual</strong> <strong>Report</strong> <strong>2011</strong>-<strong>12</strong><br />
Safety<br />
• Daytime safety perceptions were again in the very<br />
high 90s (per cent) on board and at the stop or<br />
station; night figures were mixed – significantly<br />
better at 96 and 97 per cent (respectively, waiting<br />
and on board) than 2010-11 for the ferry, but<br />
down slightly at 68 and 72 per cent (train and bus,<br />
respectively) at the stop/station and 72 and 79 per<br />
cent on board.<br />
Passenger satisfaction<br />
• PSM showed that 85.5 per cent of our customers<br />
across the system are happy with the quality of<br />
Transperth services.<br />
• Customer satisfaction levels for SmartRider in<br />
the mid to high 90s.<br />
Seniors<br />
• Seniors and pensioners made 8.108 million<br />
off-peak free journeys, 6.1 per cent more than<br />
in 2010-11.<br />
Upgrades/Maintenance<br />
• Started a major upgrade of infrastructure and<br />
way-finding signage at stations.<br />
• Continued to upgrade accessibility: 52.9 per cent<br />
of our stations now have independent access for<br />
people with disabilities and parents with prams<br />
(with staff on hand at the other stations); and 80<br />
per cent of our buses have low-floor accessibility.<br />
PTA in the community<br />
• Free late-night weekend trains (4am on Saturday<br />
and Sundays) were trialed from November through<br />
to the end of April, after which the late Friday<br />
service was dropped but the late Saturday<br />
(Sunday morning) service extended for <strong>12</strong> months.<br />
Green<br />
• Deliveries started of new Euro5 EEV buses<br />
(enhanced environmentally-friendly vehicles with<br />
emissions between Euro5 and the more stringent<br />
Euro6) under the new (five plus five-year) contract<br />
with Volvo.
Objectives and outcomes<br />
Objective<br />
Continue to pursue patronage growth, high passenger<br />
satisfaction and a high level of on-time running<br />
Further improvements to bus services<br />
Encourage public transport use<br />
Continue to improve information provided to<br />
passengers<br />
Ensure that adequate public transport services to<br />
major events across the metropolitan are planned<br />
and funded<br />
Improve security for all users of Transperth services<br />
Increase capacity in the B-series railcars<br />
Outcome<br />
• Continuing the trend of the past <strong>12</strong> years, patronage increased in <strong>2011</strong>-<strong>12</strong> – total boardings by<br />
six per cent and cash and SmartRider initial boardings by 6.9 per cent<br />
• <strong>The</strong> level of overall customer satisfaction (averaged over all modes) increased to 85.5 per cent,<br />
from 84.4 per cent in <strong>2011</strong><br />
• Train and ferry OTR were down slightly but remained high at 94.6 per cent and 96.7 per cent respectively,<br />
but bus OTR slipped 7.1 per cent to 79.1 per cent<br />
• New services to Ashby, Tapping, Aveley, Baldivis North and Alkimos<br />
• Major improvements on Wanneroo Road, Landsdale, Clarkson, Whitfords and Joondalup Line feeder<br />
services<br />
• Improvements to services on Alexander Drive, Cambridge Street, Beaufort Street<br />
• Improvements to services to UWA, Curtin University, Belmont, Cannington, Ellenbrook, Balcatta,<br />
Two Rocks, Claremont, Mirrabooka, Canning Vale, Bull Creek, Willetton, Leederville, Osborne Park,<br />
Glendalough, Scarborough, Greenwood, Warwick, Whitfords, Joondalup and Mandurah<br />
• <strong>The</strong> Get on Board presentation was delivered to community groups to encourage public transport use<br />
• Work continued on a workplace program for employers who wish to encourage staff to use public<br />
transport to work<br />
• Installed new ticketing InfoCubes to provide train passengers with improved ticketing information<br />
• Signage at a number of stations improved as part of a general upgrade<br />
• An excellent level of public transport usage to/from major events was achieved. A new five-year agreement<br />
was signed with the WA Football Commission to provide special events services at Patersons Stadium<br />
• <strong>The</strong> new CMR monitors CCTV footage from all Transperth stations<br />
• Modifications were made to the internal seating in B-series railcars<br />
13
Key service measures<br />
Patronage and services<br />
Patronage is reported in three categories:<br />
• Cash and SmartRider initial boardings – cash<br />
boardings, SmartRider paid boardings and free<br />
travel on SmartRider<br />
• Total initial boardings – cash and SmartRider initial<br />
boardings plus free travel on FTZ (free transit zone)<br />
services and on CAT (central area transit) services<br />
in Perth, Fremantle and Joondalup and on the<br />
Midland Shuttle service<br />
• Total boardings – all initial boardings plus<br />
transfer boardings.<br />
Patronage on the Transperth system recorded a<br />
significantly higher rate of growth in <strong>2011</strong>-<strong>12</strong> than in<br />
the previous two years. Cash and SmartRider initial<br />
boardings increased by 6.9 per cent (compared with<br />
increases of 2.5 per cent in 2010-11 and 1.6 per cent<br />
in 2009-10). Total boardings grew by six per cent<br />
(3.3 per cent and 2.2 per cent previously).<br />
Free travel by seniors and pensioners accounted for<br />
8.108 million total boardings, up 6.1 per cent from<br />
2010-11’s 7.642m. Initial boardings increased<br />
4.8 per cent to 4.961m.<br />
Since 2007-08, total boardings have increased<br />
32.5 per cent to 144.130m while cash and SmartRider<br />
initial boardings added have 26.6 per cent to 86.393m.<br />
Transperth: Patronage (millions)<br />
160<br />
<strong>12</strong>0<br />
80<br />
40<br />
0<br />
108.793<br />
68.231<br />
<strong>12</strong>8.784<br />
131.629<br />
135.975<br />
144.130<br />
77.605 78.852 80.817 86.393<br />
2007-08 2008-09 2009-10 2010-11 <strong>2011</strong>-<strong>12</strong><br />
Total boardings<br />
Cash and SmartRider initial boardings<br />
Passenger place kilometres represent the total<br />
passenger carrying capacity of the Transperth bus,<br />
train and ferry network. This metric is based on service<br />
kilometres and the average capacity of the fleet.<br />
Transperth: Passenger place kilometres (millions)<br />
15000<br />
<strong>12</strong>000<br />
9000<br />
6000<br />
3000<br />
0<br />
8243.3<br />
9337.0<br />
10,138.4 10,579.9 11,552.2<br />
2007-08 2008-09 2009-10 2010-11 <strong>2011</strong>-<strong>12</strong><br />
Total capacity provided by Transperth increased by<br />
40.1 per cent between 2007-08 and <strong>2011</strong>-<strong>12</strong>, with<br />
the main contributors being the expansion of the train<br />
system to Clarkson and Thornlie, the introduction<br />
of three and six-car trains and the opening of the<br />
Mandurah Line. As a result, rail passenger place<br />
kilometres increased by 56.3 per cent to 7192.7m<br />
between 2007-08 and <strong>2011</strong>-<strong>12</strong>.<br />
In the past, the contribution of the bus system to the<br />
total capacity increase has been relatively modest.<br />
However, bus passenger place kilometres increased<br />
significantly this year following an 8.5 per cent jump<br />
in funding for service kilometres.<br />
14 <strong>Public</strong> <strong>Transport</strong> <strong>Authority</strong> <strong>Annual</strong> <strong>Report</strong> <strong>2011</strong>-<strong>12</strong>
Access to public transport: Proportion of Property<br />
Street Addresses in the Perth <strong>Public</strong> <strong>Transport</strong><br />
Area within 500m of a Transperth stop providing<br />
an acceptable level of service<br />
100%<br />
80%<br />
60%<br />
40%<br />
20%<br />
0%<br />
78.3% 81.1% 82.9% 83.8% 84.6%<br />
2008 2009 2010 <strong>2011</strong> 20<strong>12</strong><br />
<strong>The</strong> proportion of PSAs (property street addresses) in<br />
the PPTA (Perth public transport area) within walking<br />
distance (500 metres) of a Transperth stop or station<br />
providing an ASL (acceptable service level) continued<br />
to edge higher. An ASL is defined as a 20-minute or<br />
better service in the peak-flow direction during the<br />
peak, and at least hourly through the core of the day.<br />
Transperth uses GPS (global positioning system) data<br />
to determine the exact location of all bus stops and<br />
train stations. Access to these facilities is measured<br />
against other spatial and scheduling data – in this<br />
case PSAs and service timetables.<br />
In 20<strong>12</strong>, 84.6 per cent of PSAs were within 500m of<br />
an ASL Transperth stop, compared with 83.8 per cent<br />
previously. <strong>The</strong> total number of PSAs in the PPTA was<br />
906,184 compared with 876,549 in <strong>2011</strong>.<br />
Since 2008, the number of PSAs within walking<br />
distance of an ASL stop has increased by<br />
19.4 per cent, from 641,610 to 766,276.<br />
Reliability<br />
Transperth: Service reliability by mode<br />
Proportion of services meeting on-time targets<br />
82.6%<br />
2007-08 90.3%<br />
99.2%<br />
84.5%<br />
2008-09 94.7%<br />
98.4%<br />
85.5%<br />
2009-10 95.9%<br />
98.4%<br />
85.1%<br />
2010-11 95.7%<br />
99.2%<br />
79.1%<br />
<strong>2011</strong>-<strong>12</strong> 94.6%<br />
96.7%<br />
0% 20% 40% 60% 80% 100%<br />
Bus Train Ferry<br />
Transperth bus and ferry OTR is measured by the<br />
GPS <strong>Report</strong>er functionality of the SmartRider ticketing<br />
system, while train OTR is measured through the train<br />
control system. <strong>The</strong>se technology-based monitoring<br />
methods allow more precise data-gathering than<br />
the physical checks and manual observations used<br />
previously. Based on specified reliability criteria, the<br />
OTR targets for the three modes are for 85 per cent<br />
(bus), 95 per cent (train) and 98 per cent (ferry). In the<br />
year under review, on average 79.1 per cent of bus<br />
services, 94.6 per cent of train services, and<br />
96.7 per cent of ferry services arrived on time.<br />
15
Passenger satisfaction<br />
An independent market research firm commissioned<br />
by Transperth carries out the annual Passenger<br />
Satisfaction Monitor (PSM) to assess the level of<br />
satisfaction/dissatisfaction among passengers in<br />
regard to various aspects of Transperth services.<br />
Overall satisfaction with the quality of service on<br />
Transperth bus, train and ferry operations (calculated<br />
as the weighted average across all modes) increased<br />
slightly in 20<strong>12</strong>. Bus and train satisfaction increased<br />
but there was a slight reduction in the level of<br />
satisfaction with the ferry service.<br />
Transperth: Level of overall customer satisfaction<br />
100%<br />
80%<br />
60%<br />
40%<br />
82.4% 85.4% 85.8% 84.4% 85.5%<br />
Passenger safety<br />
<strong>The</strong> PSM assesses customer perceptions of safety<br />
during the day and at night, both waiting for and<br />
aboard the (bus/train/ferry) service. Virtually all<br />
passengers feel safe aboard our services during<br />
the day.<br />
Transperth: Proportion of respondents who<br />
generally feel safe on board during the day<br />
98.0%<br />
2008 98.0%<br />
99.0%<br />
98.0%<br />
2009 98.0%<br />
99.0%<br />
98.0%<br />
2010 98.0%<br />
99.0%<br />
99.0%<br />
<strong>2011</strong> 98.0%<br />
100%<br />
99.0%<br />
20<strong>12</strong> 99.0%<br />
99.0%<br />
0% 20% 40% 60% 80% 100%<br />
Bus Train Ferry<br />
20%<br />
0%<br />
2008 2009 2010 <strong>2011</strong> 20<strong>12</strong><br />
16 <strong>Public</strong> <strong>Transport</strong> <strong>Authority</strong> <strong>Annual</strong> <strong>Report</strong> <strong>2011</strong>-<strong>12</strong>
PTA in the Community<br />
In November 2010, the PTA signed a contract with Volvo Bus Australia<br />
for the supply and delivery of 650 low-floor buses – which will enable the<br />
PTA to update and modernise its bus fleet for operation within the Perth<br />
metropolitan area.<br />
<strong>The</strong> benefits also flow through to regional<br />
communities as buses cascade from the<br />
Transperth fleet to the regions, enabling them<br />
to upgrade their services with more modern<br />
and more accessible vehicles.<br />
Volvo is subcontracting the manufacture of<br />
the bus body to local manufacturer Volgren<br />
Australia, which will build the bus bodies at<br />
its manufacturing facility in Malaga. Deliveries<br />
started in <strong>2011</strong>-<strong>12</strong>, when a total of 81 Volvos<br />
(68 rigid chassis and 13 articulated or “bendy”<br />
buses) entered service with Transperth.<br />
<strong>The</strong> deal between the Volvo Group and the PTA<br />
is a five-year contract with the option to extend<br />
by a further five years. Its estimated value is<br />
about $400 million over the full ten-year period.<br />
Currently, more than 80 per cent of Transperth’s<br />
fleet of <strong>12</strong>46 buses are low-floor, accessible<br />
and air conditioned. <strong>The</strong> new Volvo buses will<br />
be used to replace older, high-floor buses within<br />
the fleet to maintain the excellent accessibility<br />
standards of public transport within the Perth<br />
metropolitan area, and also to provide the<br />
travelling public with the most modern buses<br />
on the road.<br />
All buses delivered will be of EEV (enhanced<br />
environmentally-friendly vehicles) emission<br />
standard or better. EEV is the most stringent<br />
of emission standards commercially available.<br />
<strong>The</strong>se vehicles have significantly reduced<br />
levels of both greenhouse gas emissions and<br />
particulate matter with the added bonus of<br />
enhanced fuel efficiency.<br />
17
Efficiency<br />
In <strong>2011</strong>-<strong>12</strong>, the average total cost of providing<br />
Transperth services increased by 1.8 per cent to<br />
$0.544 per passenger kilometre, compared with<br />
$0.534 in 2010-11. Total system cost rose 6.5 per cent<br />
while passenger kilometres rose 4.6 per cent.<br />
Transperth: Total cost per passenger kilometre<br />
(Passenger kilometres: Average trip length to<br />
2007-08 based on zonal distribution of tickets; from<br />
2008-09 based on SmartRider tag-on/tag-off data)<br />
$1.000<br />
$0.800<br />
$0.600<br />
$0.400<br />
$0.200<br />
$0.000<br />
$0.781<br />
$0.533 $0.526 $0.534 $0.544<br />
2007-08 2008-09 2009-10 2010-11 <strong>2011</strong>-<strong>12</strong><br />
<strong>The</strong> most significant change over the past few years<br />
has been a 31.8 per cent cost reduction ($0.781 down<br />
to $0.533) from 2007-08 to 2008-09. This reflects a<br />
change in the way the average trip length is determined<br />
in calculating passenger kilometres.<br />
Transperth: Revenue ($ millions)<br />
Until 2007-08, the average (bus and train) trip length<br />
$800<br />
$667.89 $691.17 $731.79 $779.19 Total revenue<br />
was based on the zonal distribution of ticket sales and<br />
validations. From 2008-09, SmartRider tag-on/tag-off<br />
data has provided a precise basis for the calculation<br />
$250<br />
as it accurately records the length of each SmartRider<br />
journey (including individual legs and transfers).<br />
$191.74<br />
$200<br />
<strong>The</strong> average SmartRider trip length is then applied<br />
$169.49<br />
to cash fares. Estimated trip lengths are applied to<br />
$152.22 $155.66 $176.06<br />
boardings on bus services in the FTZ, and on CAT and $150 $131.06<br />
Midland Shuttle services. (Interestingly, recalculating the<br />
$155.85<br />
2007-08 figure using SmartRider-based data generates<br />
$135.26 $141.74<br />
a total cost per passenger kilometre of $0.535,<br />
31.6 per cent lower than the reported figure of $0.781.)<br />
Expenditure and revenue<br />
Transperth: Expenditure ($ millions)<br />
$100<br />
$50<br />
$116.49<br />
$1,000<br />
$0<br />
2007-08 2008-09 2009-10 2010-11 <strong>2011</strong>-<strong>12</strong><br />
$600<br />
$400<br />
$200<br />
$0<br />
$569.11<br />
$427.98<br />
$479.94<br />
2007-08 2008-09 2009-10 2010-11 <strong>2011</strong>-<strong>12</strong><br />
Total expenditure<br />
Operating expenditure<br />
$499.<strong>12</strong><br />
$523.95<br />
$566.47<br />
Total expenditure on Transperth services rose<br />
6.5 per cent to $779.186m. Operating expenditure<br />
(excluding capital charges) rose 8.1 per cent from<br />
$523.948m in 2010-11, to $566.474m; capital charges<br />
(interest and depreciation) rose 2.3 per cent from<br />
$207.842m to $2<strong>12</strong>.7<strong>12</strong>m.<br />
Across the modes, bus total costs increased by<br />
9.6 per cent and operating costs by 10.3 per cent;<br />
train total costs increased 3.6 per cent and operating<br />
costs 5.3 per cent; and ferry total costs increased<br />
6.7 per cent and operating costs 7.5 per cent.<br />
18 <strong>Public</strong> <strong>Transport</strong> <strong>Authority</strong> <strong>Annual</strong> <strong>Report</strong> <strong>2011</strong>-<strong>12</strong>
<strong>The</strong> increase in system costs in <strong>2011</strong>-<strong>12</strong> was due<br />
mainly to:<br />
• Increased labour cost on both bus and train<br />
services<br />
• Higher fuel cost on buses and increased railcar<br />
energy cost<br />
• <strong>The</strong> addition of 4.5 million service kilometres<br />
(an increase of 8.5 per cent) to total bus service<br />
kilometres operated during the year<br />
• One-off mobilisation cost for the start-up of the<br />
new train maintenance contract combined with the<br />
close-out of the existing works<br />
• An increase in payments under the bus patronage<br />
incentive model of 10.5 per cent compared with<br />
2010-11 due to patronage growth.<br />
Transperth’s rising revenue trend continued. Total<br />
revenue (which includes income such as advertising<br />
and rent as well as fares) increased 13.1 per cent to<br />
$191.739m and fare revenue was up 13 per cent at<br />
$176.059m. In addition to revenue from cash and<br />
SmartRider boardings, fare revenue includes full<br />
or part funding for CAT services, contributions for<br />
the provision of specific bus services, revenue from<br />
joint ticketing for special events (where the public<br />
transport fare is included in the price of the event<br />
ticket), Commonwealth funding for concession travel<br />
by interstate seniors and income from the sale of<br />
SmartRider cards.<br />
Though the schedule introduced in July <strong>2011</strong> increased<br />
fares by an overall average of 2.6 per cent (standard<br />
fares by an average of 3.2 per cent and concession<br />
fares by an average one per cent), the increase in<br />
fare revenue was due mainly to significant growth in<br />
fare-paying boardings (cash boardings, SmartRider<br />
paid boardings, and boardings on NightRider and<br />
special event services), which rose seven per cent<br />
to 81.262m. <strong>The</strong> increase on our buses was<br />
7.5 per cent (to 42.360m), the highest rate of growth<br />
since 2000-01. On our trains, despite a <strong>12</strong>.4 per cent<br />
drop in special event boardings, fare-paying boardings<br />
went up 6.6 per cent (to 38.544m), but the ferry<br />
number slipped 2.4 per cent (to 317,000).<br />
This generated revenue of $73.491m (up <strong>12</strong>.5 per cent)<br />
on buses, $100.536m (up 13.2 per cent) on trains, and<br />
$474,000 (up 2.2 per cent) for the ferry service.<br />
Review of performance<br />
Reliability<br />
Trains<br />
<strong>The</strong> service reliability target for Transperth trains is for<br />
95 per cent of services to arrive within four minutes<br />
of the scheduled time. Until 2006-07, this tolerance<br />
margin was three minutes. It changed in 2007-08 to<br />
take account of longer rail services with increased<br />
journey times, and to ensure national consistency<br />
in reliability measures.<br />
In <strong>2011</strong>-<strong>12</strong>, on average 94.6 per cent of train<br />
services met the target compared with 95.7 per cent<br />
in 2010-11. <strong>The</strong> slip reflects a significant increase in<br />
the level of construction work being completed on<br />
and around the urban rail network including that for<br />
the Perth City Link project, several high-profile and<br />
extended unplanned closures, and an unusually high<br />
weather impact, including lightning strikes and speed<br />
restrictions due to very hot or very wet weather.<br />
Buses<br />
Transperth buses aim never to leave a terminus or<br />
travel through a mid-way timing point early, and for<br />
85 per cent of services to arrive within four minutes of<br />
the scheduled time. Reliability is monitored through a<br />
random sample of about one per cent of trips in each<br />
bus contract area (this is a substantial number, given<br />
that there are more than 13,000 bus trips on a typical<br />
weekday) using SmartRider’s GPS <strong>Report</strong>er function.<br />
This provides an accurate assessment of bus on-time<br />
performance. No other public transport jurisdiction in<br />
Australia has the technology or capacity to provide<br />
this level of precision in checking bus services.<br />
This year our buses fell short of the target: on<br />
average, 79.1 per cent of services operated within<br />
the four-minute tolerance. This was 7.1 per cent below<br />
2010-11. <strong>The</strong> biggest factor affecting bus service<br />
reliability was the disruption caused by road works<br />
in a big number of locations in the metropolitan area.<br />
GPS <strong>Report</strong>er helps identify under-performing services<br />
which, after a careful review, can be re-scheduled to<br />
ensure improved performance.<br />
Ferries<br />
<strong>The</strong> <strong>2011</strong>-<strong>12</strong> service reliability target for our ferry<br />
service was for 98 per cent of services to arrive<br />
within three minutes of the scheduled time.<br />
On average, 96.7 per cent of services met the<br />
target (99.2 per cent in 2010-11).<br />
19
Trends in patronage<br />
Not only did patronage continue to increase, there was<br />
a significantly higher rate of growth in <strong>2011</strong>-<strong>12</strong>.<br />
• Total boardings (fare-paying boardings, free travel<br />
and transfers) increased six per cent from<br />
135.975 million in 2010-11, to 144.130m<br />
• Cash and SmartRider initial boardings (fare-paying<br />
boardings and SmartRider-based free travel<br />
excluding free train travel within the FTZ) rose<br />
6.9 per cent from 80.817m to 86.393m<br />
• System-wide fare-paying boardings rose seven<br />
per cent from 75.929m to 81.262m.<br />
All cash and SmartRider initial boardings are recorded<br />
accurately on the Transperth ticketing system.<br />
SmartRider also records transfers accurately and this<br />
data provides a reliable model to estimate transfers<br />
for cash passengers.<br />
In <strong>2011</strong>-<strong>12</strong>, SmartRider accounted for 71.2 per cent<br />
of cash and SmartRider initial boardings (including free<br />
train travel within the FTZ), compared with 70.4 per<br />
cent in 2010-11.<br />
On a per-capita basis, public transport use in the Perth<br />
metropolitan area (including the City of Mandurah)<br />
was 55.0 total initial boardings a year in <strong>2011</strong>-<strong>12</strong>,<br />
(comprising fare-paying boardings and all free travel)<br />
compared with 53.8 previously.<br />
Marketing the services<br />
In <strong>2011</strong>-<strong>12</strong>, the Transperth Information and Event<br />
Services team successfully undertook a wide range<br />
of initiatives:<br />
• Continued with the popular I Give Two Hoots<br />
campaign launched in 2009-10 to improve courtesy<br />
among passengers by highlighting behaviour that<br />
annoys our customers, such as playing loud music,<br />
not moving away from train doors, and trying<br />
to board a train when passengers are still trying<br />
to alight<br />
• Launched the campaign Get Home Before Sunrise,<br />
featuring vampires, to market the new late-night<br />
weekend train services<br />
• Introduced new ticketing InfoCubes to provide<br />
passengers on the train system with improved<br />
ticketing information<br />
• Installed blue bikes on the top of bike shelters to<br />
make it easier for cyclists to identify lock-up facilities<br />
for bikes at stations<br />
• Improved signage at several stations as part of a<br />
system-wide upgrade to improve the visibility of<br />
key components of infrastructure, such as lifts<br />
• Continued to provide service disruption information<br />
to passengers across all modes of public transport<br />
(a key service, given a significant increase in the<br />
number of disruptions due to work on the Perth<br />
City Link and Butler Station projects as well as<br />
infrastructure maintenance)<br />
• Continued to keep passengers updated on service<br />
changes, particularly with the introduction of<br />
additional bus kilometres<br />
• Continued to deliver Get on Board presentations<br />
to a broad range of community groups<br />
• Progressed a program for employers who want<br />
to encourage staff to use public transport to get<br />
to work<br />
• Continued to work with major event organisers<br />
to ensure the efficient and effective provision of<br />
special event services – a new, five-year agreement<br />
was signed with the West Australian Football<br />
Commission to provide special event services<br />
for events at Patersons Stadium.<br />
Disability access<br />
Transperth aims to provide universal access to all<br />
its services for the wider community – including the<br />
elderly, people with disabilities and parents with prams.<br />
This year, further progress was made.<br />
Trains<br />
All Transperth trains are universally accessible.<br />
<strong>The</strong> key issues for our rail system are access to the<br />
station for people with varying disabilities, and whether<br />
the gap between train and platform meets accessibility<br />
standards.<br />
At balance date, 37 stations (52.9 per cent of a total<br />
70) provided independent access for people with<br />
disabilities and parents with prams. In 2007-08,<br />
the figure was 49.3 per cent (34 of 69 stations).<br />
At the other stations, passengers are helped by<br />
PTA customer service staff when required.<br />
20 <strong>Public</strong> <strong>Transport</strong> <strong>Authority</strong> <strong>Annual</strong> <strong>Report</strong> <strong>2011</strong>-<strong>12</strong>
Independent<br />
access*<br />
Partial access**<br />
Limited access** Total stations<br />
2007-08 34 25 10 69 # 49.3<br />
2008-09 36 25 9 70 51.4<br />
2009-10 36 25 9 70 51.4<br />
2010-11 37 24 9 70 52.9<br />
<strong>2011</strong>-<strong>12</strong> 37 24 9 70 52.9<br />
Percentage<br />
providing<br />
independent<br />
access<br />
* Complies with the Disability Standards for Accessible <strong>Public</strong> <strong>Transport</strong> and Guidelines under the Disability<br />
Discrimination Act, 1992<br />
** Assistance available from Transperth customer service staff<br />
# Perth Underground Station included in Perth Station in 2007-08, identified as a separate station from 2008-09<br />
Buses<br />
Transperth continued its long-term program to increase<br />
the number of accessible buses in its fleet with the<br />
purchase of 90 new low-floor vehicles. As at June 30,<br />
we operated 995 accessible buses (80 per cent of a<br />
<strong>12</strong>46-vehicle fleet), compared with 905 (77.4 per cent<br />
of 1170) a year earlier.<br />
Because preference is given to operating accessible<br />
buses whenever possible, most off-peak buses<br />
are accessible. In the peak, both accessible and<br />
non-accessible buses are fully committed. <strong>The</strong> number<br />
of service trips operated by accessible buses has<br />
increased over the past five years – this year,<br />
57.2 per cent of trips (2.342 million of a total 4.097m)<br />
were operated by accessible buses, compared with<br />
47.2 per cent in 2010-11.<br />
Transperth continued its Bus Stop Accessibility Works<br />
Program with approximately 600 bus stops upgraded<br />
to meet the requirements of the Federal Disability<br />
Standards for Accessible <strong>Public</strong> <strong>Transport</strong>. Upgrades<br />
typically involve the construction of a concrete<br />
passenger boarding area at correct kerb height,<br />
installation of tactile ground surface indicators and,<br />
if necessary, installation of footpath connections (to a<br />
maximum three metres) to the existing local footpath<br />
network. Since the program was introduced in January<br />
2010, about 1400 bus stops have been upgraded.<br />
Ferries<br />
Transperth’s ferry services are provided by two<br />
accessible vessels. <strong>The</strong> MV Phillip Pendal (which came<br />
into service in May 2009) does the bulk of the work and<br />
MV Shelley Taylor-Smith is available when required.<br />
<strong>The</strong> Barrack Street jetty in Perth meets the Federal<br />
standard. Though the Mends Street jetty in South Perth<br />
was already accessible for people in wheelchairs, the<br />
existing ramps were further improved during the year.<br />
SmartRider project and system ticketing<br />
Transperth’s SmartRider ticketing system continues to<br />
improve on its success, and lead Australia in smartcard<br />
ticketing technology. <strong>The</strong> 20<strong>12</strong> PSM showed a very<br />
high level of satisfaction among SmartRider users:<br />
97 per cent of bus passengers, 96 per cent of train<br />
passengers and 94 per cent of ferry passengers.<br />
In <strong>2011</strong>-<strong>12</strong>, SmartRider accounted for 71.2 per cent<br />
of cash and SmartRider initial boardings system-wide.<br />
Trains recorded the highest level of use with 72.3 per<br />
cent (previously 71.2 per cent), including free travel<br />
within the FTZ. Buses edged up to 70.5 (70) per cent,<br />
and ferries 39.7 (36.5) per cent.<br />
Complementing the SmartRider system, Transperth<br />
has installed state-of-the-art ticket vending machines<br />
at all train stations and ferry jetties to provide a cash<br />
alternative for passengers.<br />
21
Transperth trains<br />
<strong>The</strong> TTO division operates an electrified suburban train<br />
system with more than 1045 services on an average<br />
weekday, and more than 6640 weekly services.<br />
<strong>The</strong> system covers 173.1km of track with 70 stations<br />
on five lines, and a fleet of 234 railcars which can be<br />
coupled in configurations of two, three, four or six-car<br />
trains. <strong>The</strong> train network consists of the Joondalup<br />
Line (33.2km), the Fremantle Line (19km), the Midland<br />
Line (16km), the Armadale/Thornlie Line (30.5km,<br />
and a 3km spur line to Thornlie), and the Mandurah<br />
Line (71.4km).<br />
<strong>The</strong> year’s developments<br />
• Completed the installation of the platform detection<br />
system on A-series railcars – this promotes<br />
passenger safety as railcar doors will not open<br />
where there is no platform<br />
• Launched the new Central Monitoring Room (CMR)<br />
to significantly improve security for all Transperth<br />
patrons<br />
• Provided rail services for CHOGM and many other<br />
special events<br />
• Started a new railcar maintenance contract with<br />
EDI Rail Bombardier <strong>Transport</strong>ation (Maintenance)<br />
Pty Ltd (EDI-BT)<br />
• Implemented a number of operational changes to<br />
facilitate work on the Perth City Link project to sink<br />
the Fremantle Line<br />
• Carried out modification of the internal seating<br />
arrangement in B-series railcars to increase<br />
capacity<br />
• Conducted a trial of 4am weekend train services.<br />
In the year under review, the train network operated<br />
14.965 million service kilometres, up 4.6 per cent<br />
from 14.307m in 2010-11. Total capacity increased<br />
5.2 per cent from 6838.7m passenger place<br />
kilometres in 2010-11, to 7192.7m.<br />
Cost of the service<br />
In <strong>2011</strong>-<strong>12</strong>, the total cost of providing Transperth train<br />
services, including annual capital charges, was up<br />
3.6 per cent at $392.857 million (previously<br />
$379.175m). <strong>Annual</strong> capital charges (interest and<br />
depreciation) increased 1.1 per cent to<br />
$153.943m ($152.288m).<br />
Train operating costs increased by 5.3 per cent to<br />
$293.914m ($226.887m), due mainly to:<br />
• Increased labour costs – more transit officers and<br />
additional cost for customer service<br />
• An increase (about four per cent) in electricity costs<br />
• One-off mobilisation cost for the start-up of the new<br />
maintenance contract combined with the close-out<br />
of the existing works.<br />
Patronage<br />
Transperth trains: Patronage (millions)<br />
2007-08<br />
2008-09<br />
2009-10<br />
2010-11<br />
28.458<br />
42.636<br />
35.243<br />
54.750<br />
36.284<br />
56.409<br />
37.884<br />
58.868<br />
40.355<br />
<strong>2011</strong>-<strong>12</strong><br />
63.030<br />
0 15 30 45 60 75<br />
Cash and SmartRider initial boardings<br />
Total boardings<br />
Patronage on Transperth train services increased for<br />
the ninth year in succession – total boardings increased<br />
7.1 per cent to 63.030m. This compares with increase<br />
of 4.4 per cent in 2010-11 and three per cent in<br />
2009-10. Total boardings on the Armadale Line<br />
increased by 4.4 per cent, on the Fremantle Line by<br />
5.9 per cent, the Joondalup Line by seven per cent,<br />
the Mandurah Line by 9.6 per cent, and the Midland<br />
Line by 4.9 per cent.<br />
22 <strong>Public</strong> <strong>Transport</strong> <strong>Authority</strong> <strong>Annual</strong> <strong>Report</strong> <strong>2011</strong>-<strong>12</strong>
Cash and SmartRider initial boardings on the train<br />
network (excluding free travel within the FTZ) rose<br />
6.5 per cent to 40.355m, and fare-paying boardings<br />
rose 6.6 per cent to 38.584m. This compares with<br />
an increase of 4.4 per cent in 2010-11 and a decline<br />
0.5 per cent in 2009-10 following the introduction of<br />
free travel for seniors and pensioners. In <strong>2011</strong>-<strong>12</strong>,<br />
boardings on special event services fell <strong>12</strong>.4 per cent<br />
to 1.<strong>12</strong>4m.<br />
Seniors, aged and disability pensioners used their free<br />
travel entitlement to complete 2.606m total boardings<br />
on trains, an increase of 4.3 per cent from 2.499m in<br />
2010-11.<br />
On a per kilometre basis, the train network recorded<br />
an improvement due to patronage increasing faster<br />
than service kilometres (which went up 4.6 per cent to<br />
14.965m). Total boardings per service kilometre rose<br />
2.4 per cent from 4.11 in 2010-11, to 4.21 while cash<br />
and SmartRider initial boardings per service kilometre<br />
went up by 1.8 per cent to 2.697 from 2.648.<br />
PTA in the Community<br />
<strong>The</strong> PTA carried 1,938,410 people to<br />
special events around Perth including<br />
CHOGM, ANZAC services, the Royal Show<br />
and multiple concerts and sporting events.<br />
Of those, 644,790 were patrons going to and<br />
from AFL matches.<br />
23
Passenger satisfaction<br />
<strong>The</strong> 20<strong>12</strong> Transperth PSM showed that 89 per cent<br />
of our rail customers are satisfied overall with the train<br />
system, compared with 88 per cent in <strong>2011</strong>.<br />
Transperth trains: Level of overall customer<br />
satisfaction<br />
100%<br />
80%<br />
60%<br />
40%<br />
20%<br />
0%<br />
90% 89%<br />
93%<br />
88%<br />
89%<br />
2008 2009 2010 <strong>2011</strong> 20<strong>12</strong><br />
<strong>The</strong> improvement reflects actions taken to address<br />
passenger concerns with overcrowding, which had<br />
led to a slide in satisfaction in <strong>2011</strong>, and was achieved<br />
despite passengers still facing some inconvenience<br />
due to works at Perth Station.<br />
In 20<strong>12</strong>, “time waiting for a connecting bus” replaced<br />
“access to ticket purchase facilities” in the top 10<br />
list. “Availability of seats,” the second most important<br />
characteristic in <strong>2011</strong>, dropped to fifth and was<br />
replaced by “cleanliness on board.”<br />
Significantly, the satisfaction rating for most service<br />
characteristics remained high, though some were<br />
marginally lower than in <strong>2011</strong>.<br />
Service characteristic Importance rating % Satisfaction (dissatisfaction) rating %<br />
<strong>2011</strong> 20<strong>12</strong> <strong>2011</strong> 20<strong>12</strong><br />
Cost of fares 75 72 61 (11) 58 (13)<br />
Cleanliness on board 62 67 91 (3) 92 (3)<br />
Punctuality 61 67 94 (2) 93 (3)<br />
Speed of the trip 67 61 92 (2) 94(2)<br />
Availability of seats 70 60 72 (19) 71 (21)<br />
Service frequency<br />
peak times 51 52 77 (13) 76 (14)<br />
Service frequency<br />
weekdays 55 48 82 (7) 83 (7)<br />
Time waiting for a<br />
connecting bus 38 68 (18)<br />
<strong>The</strong> importance rating of the key service characteristics<br />
of Transperth’s train services (other than passenger<br />
safety) and the level of satisfaction/dissatisfaction<br />
for each key service characteristic are shown in the<br />
following table.<br />
24 <strong>Public</strong> <strong>Transport</strong> <strong>Authority</strong> <strong>Annual</strong> <strong>Report</strong> <strong>2011</strong>-<strong>12</strong>
Passenger safety<br />
<strong>The</strong> 20<strong>12</strong> PSM asked train users: How safe do you<br />
generally feel from personal interference or threat from<br />
other passengers? <strong>The</strong> following graph shows the<br />
proportion of respondents who always or usually feel<br />
safe at specified times/locations.<br />
Transperth trains: Customer perception of safety<br />
2008<br />
2009<br />
2010<br />
<strong>2011</strong><br />
20<strong>12</strong><br />
98%<br />
78%<br />
96%<br />
68%<br />
98%<br />
76%<br />
97%<br />
66%<br />
98%<br />
75%<br />
98%<br />
70%<br />
98%<br />
76%<br />
99%<br />
72%<br />
99%<br />
72%<br />
98%<br />
68%<br />
0% 20% 40% 60% 80% 100%<br />
Continuing a well-established trend, virtually all<br />
rail patrons feel safe during the day. However, the<br />
proportion of passengers who feel safe on board at<br />
night fell from 76 to 72 per cent and the night station/<br />
interchange figure fell from 72 to 68 per cent.<br />
<strong>The</strong> PTA is committed to ensuring that passengers<br />
feel safe on the train network. To help achieve this<br />
aim, digitised CCTV footage from all train stations is<br />
monitored at the new CMR, a state-of-the-art facility<br />
which is manned 24 hours a day, seven days a week.<br />
During the year, an independent review of the security<br />
arrangements on the rail network was carried out by<br />
an independent consultant. <strong>The</strong> review found that<br />
the existing arrangement where the PTA, utilising transit<br />
officers and contractors, is responsible for security is<br />
the ideal model.<br />
Major initiatives for 20<strong>12</strong>-13<br />
• Provide operational expertise for the Perth City Link<br />
project and the extension of the Joondalup Line<br />
to Butler<br />
• Continue recruitment of staff to service customer<br />
needs on the system<br />
• Plan for the acceptance and commissioning of the<br />
next order of 45 railcars (15 three-car sets) starting<br />
in late 2013<br />
• Provide input for car park extensions across the<br />
network.<br />
On-board (day)<br />
At station/<br />
interchange (day)<br />
On-board (night)<br />
At station/<br />
interchange (night)<br />
<strong>The</strong> level of greenhouse gas<br />
emissions from public transport<br />
is about a third that of private cars.<br />
25
Transperth buses<br />
Transperth’s bus services are divided into geographic<br />
contract areas which are periodically subject to<br />
competitive tender. This year, the contract areas of<br />
Kalamunda, Belmont and Fremantle-Cockburn were<br />
re-tendered as two separate contracts (Kalamunda<br />
and Fremantle). <strong>The</strong> new contracts come into force in<br />
October 20<strong>12</strong> and will reduce the number of contracts<br />
from <strong>12</strong> to 11.<br />
As at June 30, <strong>12</strong> contracts were operated by three<br />
contractors.<br />
• Path Transit: Morley.<br />
• Swan Transit: Belmont, Canning, Claremont,<br />
Kalamunda, Marmion, Midland (including Midland<br />
Shuttle), and Southern River.<br />
• Southern Coast Transit: Fremantle-Cockburn<br />
(including Fremantle CAT), Joondalup (including<br />
Joondalup CAT), Rockingham-Mandurah, and the<br />
Perth CAT contract.<br />
In <strong>2011</strong>-<strong>12</strong>, the Transperth bus system operated<br />
291 standard timetabled bus routes and 352 school<br />
routes. On a typical weekday this involved operating<br />
13,858 standard and 351 school service trips.<br />
Accessible buses are always used on 161 of the<br />
standard routes. A bus service frequency of 15 minutes<br />
or better is provided all day on most major corridors,<br />
with higher frequencies in peak periods.<br />
<strong>The</strong> year’s developments<br />
In <strong>2011</strong>-<strong>12</strong>, Transperth started implementing a<br />
five-year service kilometre growth program, which<br />
allowed significant improvements to be made to<br />
many services:<br />
• Increased frequency, better peak, off-peak,<br />
after-hours and weekend services on Wanneroo<br />
Road, Flinders Street and Beaufort Street, between<br />
Cannington and Murdoch via Thornlie, and on<br />
Route 34<br />
• Introduction of new route 35 in South Perth<br />
• Increased service frequency, better off-peak and<br />
weekend services on Mirrabooka feeder routes<br />
• Significant improvements in the Morley, Mirrabooka,<br />
Ballajura, Alexander Heights and Warwick areas on<br />
Routes 344 and 371<br />
• Improvements to Joondalup Line feeder bus<br />
services<br />
• Additional peak period trips and more consistent<br />
headways on Alexander Drive, Cambridge Street,<br />
Scarborough Beach Road, and to Belmont on<br />
Route 37<br />
• Additional peak period trips and more consistent<br />
headways on services to Curtin University and the<br />
University of <strong>Western</strong> Australia<br />
• New routes to Ashby, Tapping, Aveley, Baldivis<br />
North, Landsdale, Balcatta, Greenwood and<br />
between Mirrabooka and Stirling<br />
• Extension of existing routes to Alkimos and<br />
Aubin Grove<br />
• Introduction of the new Mandurah Shuttle service<br />
• Investment in routes across the network to improve<br />
reliability and legibility.<br />
At balance date, the Transperth bus fleet of<br />
<strong>12</strong>46 buses was made up of 695 diesel and<br />
551 CNG buses. During the year we took delivery<br />
of 90 new low-floor buses. A new contract will deliver<br />
650 diesel buses over a 10-year period.<br />
<strong>The</strong> fleet includes 151 buses (<strong>12</strong>.1 per cent) which<br />
conform with the Euro5 emissions standard and<br />
502 (40.3 per cent) Euro4s. Euro5 allows for emissions<br />
of 1.5 gm/kWh carbon monoxide, 0.46 gm/kWh<br />
hydrocarbons, 2.0 g/kWh nitrogen oxides and<br />
2.02 gm/kWh of particulate matter. <strong>The</strong> Volvo buses<br />
meet the Euro5 EEV standard – they are “enhanced<br />
environmentally-friendly vehicles” with emissions<br />
between Euro5 and the more stringent Euro6<br />
(expected to be the standard by around 2015).<br />
Safety audits and monitoring of Transperth bus<br />
contractors continued in line with standard AS<br />
4801-OSH Management Systems. Each depot<br />
was audited at least once with other documented<br />
site visits throughout the year. <strong>The</strong>se regular audits<br />
and inspections have resulted in improved safety<br />
management systems and safety focus and ensured<br />
that contractors’ LTI (lost time injury) rate continued<br />
to be well below the industry standard.<br />
• Swan Transit was re-certified to AS4801 in February<br />
20<strong>12</strong>, valid to February 2015. Its current LTI rate is<br />
8.0. Swan has also been certified as compliant with<br />
ISO 14001 Environmental Management Systems<br />
valid to December 20<strong>12</strong>.<br />
26 <strong>Public</strong> <strong>Transport</strong> <strong>Authority</strong> <strong>Annual</strong> <strong>Report</strong> <strong>2011</strong>-<strong>12</strong>
• Path Transit was re-certified to AS4801 in August<br />
2009 valid to August 20<strong>12</strong> and has achieved the<br />
WorkSafe Platinum Award. Its current LTI rate is<br />
8.52. Path has also been certified as compliant with<br />
ISO 14001 Environmental Management Systems,<br />
valid to December 20<strong>12</strong>.<br />
• Southern Coast Transit (SCT) was re-certified to<br />
AS4801 in January <strong>2011</strong> valid to January 2014 and<br />
has also achieved the WorkSafe Platinum Award. Its<br />
current LTI rate is 6.19. SCT has also been certified<br />
as compliant with ISO 14001 Environmental<br />
Management Systems, valid to January 2014.<br />
A special booth has been provided in each major<br />
contract area to ensure that spray painting is carried<br />
out in a safe environment. Commissioning has yet to<br />
be completed.<br />
In addition to the contractors’ drug and alcohol testing<br />
program, Transperth has provided funds to enable<br />
testing for synthetic cannabinoids, (Kronic). Testing has<br />
been introduced on a trial basis for six months.<br />
Cost of the service<br />
<strong>The</strong> total cost of operating Transperth bus services<br />
in <strong>2011</strong>-<strong>12</strong> was $385.533 million, up 9.6 per cent from<br />
$351.869m in 2010-11. Operating costs rose<br />
10.3 per cent to $326.844m from $296.395m, while<br />
annual capital charges (interest and depreciation) rose<br />
5.8 per cent to $58.689m from $55.474m.<br />
<strong>The</strong> increase in operating cost was due to:<br />
• Fuel (diesel and compressed natural gas) cost<br />
increase of about 14 per cent following the<br />
introduction of 4.54m additional service kilometres<br />
• Higher bus driver wages – two per cent in July <strong>2011</strong><br />
and another two per cent in January 20<strong>12</strong><br />
• A 10.5 per cent increase in payments under the<br />
patronage incentive model.<br />
Patronage<br />
Transperth buses: Patronage (millions)<br />
2007-08<br />
2008-09<br />
2009-10<br />
2010-11<br />
39.360<br />
65.694<br />
41.963<br />
73.550<br />
42.235<br />
74.756<br />
42.590<br />
76.636<br />
45.703<br />
<strong>2011</strong>-<strong>12</strong><br />
80.626<br />
0 20 40 60 80 100<br />
Cash and SmartRider initial boardings<br />
Total boardings<br />
In <strong>2011</strong>-<strong>12</strong>, total boardings on Transperth bus services<br />
rose 5.2 per cent to 80.626 million. <strong>The</strong> previous year’s<br />
increase was 2.5 per cent. Cash and SmartRider<br />
initial boardings were up 7.3 per cent at 45.703m<br />
– a significantly bigger increase than the 0.8 per cent<br />
recorded in 2010-11. Fare-paying boardings increased<br />
7.5 per cent to 42.360m. (<strong>The</strong> lower rate of increase<br />
in total boardings reflects a downward revision of the<br />
estimate of Perth CAT boardings.)<br />
Seniors, aged and disability pensioners used their free<br />
travel entitlement to complete 5.473m total boardings,<br />
seven per cent more than in 2010-11.<br />
While all contract areas achieved increases in total<br />
boardings, areas with the highest rates of growth were<br />
Claremont (10.8 per cent), Midland (9.7 per cent),<br />
Rockingham (8.3 per cent), Canning (7.9 per cent),<br />
Morley (7.8 per cent), and Belmont (7.1 per cent).<br />
Boardings on special event services increased<br />
11.1 per cent to 137,621.<br />
Road congestion, particularly in peak periods in Perth,<br />
continues to impact on service reliability and may affect<br />
patronage on Transperth bus services.<br />
<strong>The</strong> higher patronage reflected the expansion of bus<br />
services made possible by the 8.5 per cent increase<br />
in service kilometres from 53.551 million in 2010-11,<br />
to 58.091m. However, average boardings fell.<br />
Total boardings per service kilometre fell three<br />
per cent to 1.39 from 1.43 in 2010-11.<br />
27
Passenger satisfaction<br />
Transperth buses: Level of overall customer<br />
satisfaction<br />
100%<br />
80%<br />
78%<br />
83% 81% 83%<br />
82%<br />
60%<br />
40%<br />
20%<br />
0%<br />
2008 2009 2010 <strong>2011</strong> 20<strong>12</strong><br />
<strong>The</strong> 20<strong>12</strong> PSM showed that 83 per cent of Transperth<br />
bus users were satisfied overall with the system,<br />
compared with 82 per cent in <strong>2011</strong>.<br />
Transperth’s total boardings<br />
increased by six per cent in <strong>2011</strong>-<strong>12</strong>.<br />
<strong>The</strong> importance rating of the key service characteristics<br />
(other than passenger safety) and their respective<br />
levels of satisfaction/dissatisfaction are shown in the<br />
accompanying table. In most cases, the ratings show<br />
little change from <strong>2011</strong>. A significant exception was<br />
in respect of “shelter provided at the bus stop” which<br />
showed a decrease in the satisfaction rating and an<br />
increase in the dissatisfaction rating. In the case of<br />
“cost of fares” both the satisfaction and dissatisfaction<br />
rating showed a slight improvement.<br />
28 <strong>Public</strong> <strong>Transport</strong> <strong>Authority</strong> <strong>Annual</strong> <strong>Report</strong> <strong>2011</strong>-<strong>12</strong>
Service characteristic Importance rating (%) Satisfaction (dissatisfaction) rating (%)<br />
<strong>2011</strong> 20<strong>12</strong> <strong>2011</strong> 20<strong>12</strong><br />
Punctuality 68 68 81 (10) 81 (8)<br />
Cost of fares 63 66 62 (10) 64 (9)<br />
Shelter provided<br />
at the bus stop 59 60 77 (15) 74 (17)<br />
Cleanliness on board 52 57 94 (2) 94 (1)<br />
Service frequency<br />
weekdays 56 56 72 (17) 71 (17)<br />
Speed of the trip 48 51 92 (3) 92 (3)<br />
Availability of seats 54 50 89 (6) 90 (6)<br />
Service frequency<br />
peak times 47 49 73 (16) 76 (15)<br />
Passenger safety<br />
In the 20<strong>12</strong> PSM, bus users were asked: “How safe do<br />
you generally feel from personal interference or threat<br />
from other passengers?” <strong>The</strong> accompanying graph<br />
shows the proportion of respondents who “always/<br />
usually feel safe” at specified times/locations on the<br />
bus network.<br />
Transperth buses: Customer perception<br />
of safety<br />
2008<br />
2009<br />
2010<br />
<strong>2011</strong><br />
20<strong>12</strong><br />
98%<br />
78%<br />
94%<br />
63%<br />
98%<br />
82%<br />
97%<br />
68%<br />
98%<br />
79%<br />
96%<br />
70%<br />
99%<br />
82%<br />
97%<br />
73%<br />
99%<br />
79%<br />
97%<br />
72%<br />
0% 20% 40% 60% 80% 100%<br />
On-board (day)<br />
At station/<br />
interchange (day)<br />
On-board (night)<br />
At station/<br />
interchange (night)<br />
29
As is the case with trains, virtually all bus patrons feel<br />
safe during the day. <strong>The</strong> ratings for feeling safe on<br />
board and at stops/and interchanges at night were<br />
79 per cent and 72 per cent respectively, down on<br />
the previous year’s levels.<br />
Transperth has introduced extensive security<br />
measures in response to concerns about personal<br />
safety expressed by passengers who use our buses<br />
and facilities at night. <strong>The</strong> new CMR monitors CCTV<br />
footage from all bus stations 24/7.<br />
Major initiatives for 20<strong>12</strong>-13<br />
• Significantly upgrade services by introducing the<br />
next batch of additional bus service kilometres.<br />
Improvements have been prioritised thus:<br />
−−<br />
Services which cannot pick up additional<br />
passengers due to overloading<br />
−−<br />
Key transport corridors identified by PTA which<br />
provide access between key primary and<br />
secondary centres to help achieve the planned<br />
land use outcomes proposed by the Department<br />
of Planning in Directions 2031<br />
−−<br />
New urban areas developing on the fringes of the<br />
metropolitan area<br />
• Commence trial of the diesel-electric hybrid bus<br />
Transperth ferries<br />
Two Transperth ferries (MV Phillip Pendal and<br />
MV Shelley Taylor-Smith) operate between the city<br />
(Barrack Street) and South Perth (Mends Street)<br />
providing 80 services on an average weekday from<br />
September to April, and 60 on an average weekday<br />
from May to August.<br />
Patronage<br />
<strong>The</strong> ferry service represents only a very small<br />
proportion of Transperth system patronage (less than<br />
0.5 per cent). Fluctuations in the tourism market have<br />
a significant impact on ferry boardings, about half of<br />
which are accounted for by tourists.<br />
In <strong>2011</strong>-<strong>12</strong>, total boardings on ferry increased by<br />
0.6 per cent to 474,000.<br />
Transperth ferries: Patronage (millions)<br />
2007-08<br />
2008-09<br />
2009-10<br />
2010-11<br />
0.413<br />
0.464<br />
0.399<br />
0.484<br />
0.333<br />
0.464<br />
0.342<br />
0.471<br />
0.335<br />
<strong>2011</strong>-<strong>12</strong><br />
0.474<br />
0.0 0.1 0.2 0.3 0.4 0.5 0.6<br />
Cash and SmartRider initial boardings<br />
Total boardings<br />
Passenger satisfaction<br />
Transperth Ferries: Level of overall customer<br />
satisfaction<br />
100%<br />
80%<br />
60%<br />
40%<br />
20%<br />
0%<br />
97% 96% 96% 96% 95%<br />
2008 2009 2010 <strong>2011</strong> 20<strong>12</strong><br />
<strong>The</strong> 20<strong>12</strong> PSM continued a long-established<br />
trend with a very high proportion of passengers<br />
expressing satisfaction with the ferry service overall.<br />
<strong>The</strong> importance rating of the key service characteristics<br />
(other than passenger safety) and their respective levels<br />
of satisfaction are shown in the accompanying table.<br />
30 <strong>Public</strong> <strong>Transport</strong> <strong>Authority</strong> <strong>Annual</strong> <strong>Report</strong> <strong>2011</strong>-<strong>12</strong>
Service characteristic Importance rating (%) Satisfaction (dissatisfaction) rating (%)<br />
<strong>2011</strong> 20<strong>12</strong> <strong>2011</strong> 20<strong>12</strong><br />
Cost of the fare 80 79 84 (0) 83 (3)<br />
Cleanliness on board 73 69 99 (0) 99 (0)<br />
Service frequency<br />
weekdays 50 64 79 (7) 69 (16)<br />
Speed of the trip 53 60 98 (0) 99 (0)<br />
Shelter at the jetty 60 57 78 (14) 84 (8)<br />
Punctuality 61 56 98 (0) 99 (1)<br />
Availability of seats 52 55 98 (1) 100 (0)<br />
Access to ticket<br />
purchase facilities 48 45 94 (0) 76 (<strong>12</strong>)<br />
Passenger safety<br />
In the PSM, ferry users were asked “How safe do you<br />
generally feel from personal interference or threat from<br />
other passengers?” <strong>The</strong> accompanying graph shows<br />
the proportion of respondents who “always/usually”<br />
feel safe at specified times/locations.<br />
Transperth Ferries: Customer perception of safety<br />
2008<br />
2009<br />
2010<br />
<strong>2011</strong><br />
20<strong>12</strong><br />
99%<br />
91%<br />
99%<br />
91%<br />
99%<br />
100%<br />
99%<br />
97%<br />
99%<br />
94%<br />
99%<br />
88%<br />
100%<br />
89%<br />
100%<br />
86%<br />
99%<br />
97%<br />
99%<br />
96%<br />
75% 80% 85% 90% 95% 100%<br />
On-board (day)<br />
At jetty (day)<br />
On-board (night)<br />
At jetty (night)<br />
Results again showed that almost all ferry passengers<br />
feel safe onboard and at the jetty during the day, and<br />
the 20<strong>12</strong> survey recorded a significant improvement<br />
in the proportion of users who also felt safe at night.<br />
A CCTV camera system has been installed on the<br />
two vessels. It is continuously monitored to ensure<br />
passenger safety and security of the vessels when<br />
operations have ceased.<br />
31
Regional Town<br />
Bus Services<br />
Through its Regional Town Bus Services (RTBS) branch, the PTA<br />
manages bus services in 14 major regional towns in rural WA,<br />
and seven inter-town regional bus services – four in the Pilbara<br />
and one each in the Gascoyne, Goldfields and Mid West regions.<br />
Snapshots<br />
• Manages bus services in 14 towns in country WA,<br />
plus seven inter-town regional services.<br />
• TransGoldfields services were contracted out in<br />
October <strong>2011</strong>.<br />
Upgrades/Maintenance<br />
• <strong>The</strong> PTA began redevelopment of the<br />
Bunbury depot.<br />
New facilities<br />
• <strong>The</strong> number of buses in the RTBS<br />
fleet grew to 151.<br />
• <strong>The</strong> number of low-floor accessible buses in<br />
regional areas increased to 67.<br />
• <strong>The</strong> Bunbury fleet was purchased.<br />
• Depot land was purchased in Albany.<br />
• 20 accessible bus stops were introduced in<br />
Bunbury.<br />
32 <strong>Public</strong> <strong>Transport</strong> <strong>Authority</strong> <strong>Annual</strong> <strong>Report</strong> <strong>2011</strong>-<strong>12</strong><br />
Objectives and outcomes<br />
Objective<br />
Conduct field visits and audit all<br />
contractors’ performance and<br />
passenger boardings<br />
Continue with a programmed<br />
approach to reviewing regional<br />
bus services<br />
Develop solutions for regional<br />
transport problems in<br />
consultation with local<br />
communities<br />
Pursue cost-effective service<br />
outcomes<br />
Patronage growth<br />
Outcome<br />
• Audits conducted in Albany, Busselton, Broome, Bunbury,<br />
Dunsborough, Esperance, Karratha, Kalgoorlie and Port Hedland<br />
• Service reviews undertaken in Bunbury and Busselton<br />
• Community consultation and information sessions held in Bunbury to<br />
inform residents of changes to local public transport services and seek<br />
feedback<br />
• Installation of new bus stop embayment facilities on Chapman Road<br />
at the Northgate Shopping Centre in Geraldton to address safety<br />
concerns<br />
• 20 accessible bus stops introduced in Bunbury, as part of the<br />
Regional Bus Stop Accessibility program<br />
• Kalgoorlie bus services successfully contracted out from<br />
October <strong>2011</strong> at a substantial cost saving to Government<br />
• Purchase of the Bunbury bus fleet (27 buses) finalised with Veolia<br />
<strong>Transport</strong>, to facilitate full PTA ownership and enable open market<br />
competition when the Bunbury contract is retendered in 2014-15<br />
• Land in Albany purchased for future bus depot<br />
• Bunbury bus depot redevelopment started; completion due in 20<strong>12</strong>-13<br />
• Creation of more legible services by using Trans branding on all<br />
RTBS-owned fleet, and rollout of bus stops consistent with<br />
Transperth style guide<br />
• Re-aligning of services to meet areas of highest patronage and demand<br />
• Increase in patronage on both intra-town and inter-town services
<strong>The</strong> year’s developments<br />
A new fleet replacement program was developed,<br />
based around rolling out ex-Transperth low-floor<br />
(accessible) buses to regional areas, with a view<br />
to reducing the average age of regional buses and<br />
increasing the percentage of low-floor vehicles.<br />
This includes sufficient low-floor and air conditioned<br />
vehicles to operate timetabled town bus services.<br />
<strong>The</strong> program ensures that the regional bus fleet meets<br />
Federal disability access standards, and passenger<br />
comfort continues to improve.<br />
This year, the RTBS fleet grew from 143 to<br />
151 vehicles with the total number of PTA-owned<br />
buses increasing from 81 to 115 and the number of<br />
low-floor accessible buses increasing from 64 to 67.<br />
Highlights included:<br />
• <strong>The</strong> new Dunsborough depot was completed<br />
• <strong>The</strong> PTA acquired the existing privately-owned<br />
Bunbury bus depot in May <strong>2011</strong>, and<br />
redevelopment of the depot is well progressed<br />
• Bunbury town bus services were renumbered with<br />
unique route numbers to facilitate the incorporation<br />
of Bunbury services into the Transperth Information<br />
Centre’s database (IPTIS) and to allow the<br />
development of a regional services Journey Planner<br />
(currently being tested)<br />
• Concepts for a new regional services website were<br />
developed and testing has started with a view to<br />
launching in the current financial year – providing<br />
a much-improved level of passenger information<br />
services<br />
• CCTV was trialed on eight TransGeraldton vehicles<br />
in response to the high level of incidents in<br />
2010-<strong>2011</strong> – early results are promising.<br />
<strong>The</strong> rollout of Trans branding has been very effective<br />
in lifting the profile of public transport in regional WA.<br />
Albany will be the next town to receive the upgrade<br />
(and SmartRider ticketing).<br />
Service audits of contractors in Albany, Busselton,<br />
Broome, Bunbury, Dunsborough, Esperance,<br />
Kalgoorlie, Karratha and Port Hedland were carried<br />
out. <strong>The</strong>se aim to assess service effectiveness<br />
and the accuracy of record-keeping for patronage,<br />
occupational safety and other operational data.<br />
34 <strong>Public</strong> <strong>Transport</strong> <strong>Authority</strong> <strong>Annual</strong> <strong>Report</strong> <strong>2011</strong>-<strong>12</strong>
Cost of the service<br />
<strong>The</strong> cost of operating regional town bus services<br />
rose 10.2 per cent from $15.7 million in 2010-11,<br />
to $17.3m. <strong>The</strong> cost of intra-town services rose<br />
10.1 per cent from $14.9m to $16.4m, while the<br />
inter-town services cost increased 17.4 per cent<br />
from $776,493 to $911,876.<br />
Patronage data<br />
Intra-town<br />
2007-08<br />
2008-09<br />
2009-10<br />
2010-11<br />
2.275<br />
1.999<br />
2.355<br />
2.082<br />
2.466<br />
2.083<br />
2.411<br />
2.017<br />
2.417<br />
<strong>2011</strong>-<strong>12</strong><br />
2.064<br />
0.0 0.5 1.0 1.5 2.0 2.5<br />
Total boardings (millions)<br />
Fare paying boardings (millions)<br />
Inter-town<br />
2007-08<br />
2008-09<br />
2009-10<br />
2010-11<br />
<strong>2011</strong>-<strong>12</strong><br />
5767<br />
8081<br />
6368<br />
6532<br />
8610<br />
0 2000 4000 6000 8000 10,000<br />
Total/Fare Paying boardings<br />
Patronage<br />
Total RTBS boardings increased by 0.3 per cent from<br />
2.418m in 2010-11, to 2.426m. Fare-paying boardings<br />
increased 2.4 per cent from 2.024m to 2.073m.<br />
Intra-town bus service total boardings rose<br />
0.2 per cent to 2.417m while fare-paying boardings<br />
increased 2.3 per cent to 2.064m; on inter-town<br />
services, boardings (total and fare-paying) increased<br />
31.8 per cent to 8610.<br />
Passenger consultation<br />
Typically, passenger consultation sessions are<br />
undertaken before major service changes. Passenger<br />
consultation and information sessions were held in<br />
Bunbury in May <strong>2011</strong>, before the service changes<br />
were implemented.<br />
Planned major initiatives for 20<strong>12</strong>-13<br />
• GPS data validation of all bus stops in the Albany<br />
public transport area including, where necessary,<br />
the installation of new stops (for future SmartRider,<br />
and to facilitate Google Transit web-based<br />
journey planning)<br />
• <strong>The</strong> purchase of 29 new Volvo buses to be<br />
exchanged for current Transperth fleet, to be<br />
rolled out into regional town fleets<br />
• Redevelopment of the Bunbury bus depot<br />
• Implementation of onboard CCTV, duress alarms<br />
and two-way radio systems to enhance the safety<br />
of the TransBunbury fleet.<br />
• Introduction of a new TransRegional website,<br />
improving web-based and contact centre service<br />
for regional passengers.<br />
• Major service reviews scheduled for<br />
20<strong>12</strong>-13 include:<br />
−−<br />
Review of Geraldton bus services, with a<br />
view to increasing service frequency on<br />
well-patronised routes, coordinating services<br />
for better connections<br />
−−<br />
Review of Bunbury bus services to align services<br />
with public transport demand centres, increase<br />
frequency, and extend services to Millbridge<br />
−−<br />
Service improvements and community<br />
consultation in Kalgoorlie, to extend services<br />
to the Prospector station and introduce services<br />
to the new College of TAFE.<br />
35
School Bus<br />
Services<br />
Snapshots<br />
• Network of 707 school buses servicing mainstream<br />
schools, 118 servicing special education facilities.<br />
• OTR, based on arriving less than 10 minutes before<br />
school starts and leaving less than 10 minutes after<br />
it finishes, was higher at 99 per cent.<br />
• Services (mainly contracted orange school buses)<br />
accessed each school day by 28,800 students.<br />
Upgrades/Maintenance<br />
• As at June 30, 716 school buses (77.4 per cent of<br />
the contracted fleet) were fitted with seat belts, and<br />
815 (88.1 per cent of the fleet) had air conditioning.<br />
<strong>The</strong> PTA sets the policy and entitlement framework, provides<br />
system support and manages the contract arrangements of<br />
more than 800 orange school bus services around the State.<br />
<strong>The</strong>se buses provide access to school for students in<br />
rural areas, picking them up from the farm gate (where<br />
appropriate) as well as providing access to schools in<br />
the metropolitan area for students attending special<br />
education facilities. Responsibility for the management<br />
of these services rests with the School Bus Services<br />
(SBS) branch.<br />
At balance date, the school bus network was made<br />
up of 707 school bus contracts servicing mainstream<br />
schools and 118 servicing special education facilities.<br />
Around the State, these services were accessed each<br />
school day by 28,800 students.<br />
Where eligible students could not be accommodated<br />
on a school bus, their parents/carers were paid a<br />
conveyance allowance to offset the cost of getting their<br />
children to the nearest appropriate school.<br />
Cost of the service<br />
<strong>The</strong> cost of the school bus program, including payment<br />
of conveyance allowance, was $103.1 million in<br />
<strong>2011</strong>-<strong>12</strong>. Administration and corporate on-costs<br />
took the total to $109.6 million.<br />
All orange school buses are operated by private<br />
contractors. <strong>The</strong>re are three contract types.<br />
• Composite Rate Model (CRM) contracts (20-30<br />
years in duration) – 688 contracts (688 services).<br />
• Fixed-term contracts (1-15 year tendered terms<br />
since 1995) – <strong>12</strong>8 contracts (<strong>12</strong>8 services).<br />
• Regional School Bus cluster contracts – nine<br />
contracts (107 services).<br />
<strong>The</strong> CRM is an average-cost model which was<br />
implemented in January 2004. <strong>The</strong> cost elements of<br />
the payment model are reviewed over a three-year<br />
cycle by an independent review panel.<br />
Description of services<br />
<strong>The</strong> average cost per contract kilometre rose seven<br />
per cent this year, reflecting increases in the fixed<br />
and variable cost components of contract school bus<br />
operations. This includes the associated costs with the<br />
phased introduction of air conditioning and automatic<br />
transmission on contract school buses and the<br />
expansion of the cluster contract arrangements.<br />
<strong>The</strong> service reliability measure covers rural mainstream<br />
services and Education Support services in the<br />
metropolitan area, and is based on an arrival time<br />
of less than 10 minutes before school starts and a<br />
departure time of less than 10 minutes after school<br />
finishes. In <strong>2011</strong>-<strong>12</strong>, service reliability was 99 per cent<br />
(97 per cent previously). SBS also processed 4735<br />
conveyance allowance claims for eligible recipients;<br />
and 9.822m conveyance kilometres<br />
were travelled, costing $1.93m.<br />
36 <strong>Public</strong> <strong>Transport</strong> <strong>Authority</strong> <strong>Annual</strong> <strong>Report</strong> <strong>2011</strong>-<strong>12</strong>
Objectives and outcomes<br />
OBJECTIVE<br />
Provide transport assistance for eligible students to<br />
attend their nearest government or non-government<br />
school offering the appropriate year of study<br />
Ensure the transport assistance provided to students<br />
is appropriate, cost-effective, safe and fair in its<br />
application<br />
Ensure all service contracts are managed effectively<br />
and efficiently in accordance with agreements<br />
made between the Minister, the PTA and individual<br />
contractors and/or their representatives<br />
<strong>The</strong> year’s developments<br />
Due to the impending release of the Independent<br />
Review Panel (IRP) report on the School Bus Services<br />
Composite Rate Model Contract, all fixed-term contract<br />
tendering was suspended by Government, and only<br />
<strong>12</strong>-month contract rollovers for existing contracts and<br />
new services were authorised.<br />
While a number of new services were deferred to<br />
20<strong>12</strong>-13, the following interim services were<br />
implemented to ensure that the needs of eligible<br />
students were met:<br />
• A new Education Support service for College Row<br />
in Bunbury<br />
• New services to Wyndham, Ngalapita Bidijul,<br />
Bindoon Northam, Geraldton Park Falls and<br />
Merredin Town Service.<br />
OUTCOME<br />
• Currently operating 825 orange school bus<br />
contracts or paying a conveyance allowance to<br />
entitled students at a total cost of $103.1 million<br />
• Continued to manage the introduction of seat belts<br />
on government-funded school buses.<br />
• Conducted two safety inspections on every school<br />
bus in the fleet<br />
• Reviewed special education bus routes in<br />
metropolitan Perth and regional towns.<br />
• Reviewed school bus routes that serve the fringes<br />
of metropolitan Perth<br />
<strong>The</strong> report of the IRP, chaired by Mr Haydn Lowe,<br />
was released in November <strong>2011</strong>.<br />
In April 20<strong>12</strong> the Government said it would deliver<br />
on its long-term commitment of maintaining the<br />
traditional orange school bus industry by introducing<br />
an evergreen contract. <strong>The</strong> evergreen contract will<br />
allow operators to continue their contract indefinitely,<br />
subject to an ongoing need for service and the<br />
contractor meeting a number of key performance<br />
indicators (KPIs).<br />
At year-end, 716 school buses (77.4 per cent of<br />
the contracted fleet) were fitted with seat belts and<br />
815 (88.1 per cent of the contracted fleet) were<br />
air conditioned.<br />
Major initiatives for 20<strong>12</strong>-13<br />
Negotiations with industry over the specific content<br />
of the new evergreen contracts will start. Mr Laurie<br />
Shervington has been appointed to chair the group,<br />
with representation from the Minister’s Office, the PTA<br />
and the school bus industry. Phased implementation<br />
of the new arrangement is expected to start with the<br />
2013-14 financial year.<br />
To maximise efficiency, SBS will continue to review its<br />
operations, including:<br />
• Services operating in the Perth metropolitan<br />
fringe (EG Armadale, Two Rocks, Gidgegannup,<br />
Ellenbrook, Brigadoon and Toodyay)<br />
• Rural services in Wyndham, Warmun, Balgo Hills,<br />
Ngalapita, Ngalangangpum Bow River, Kondinin,<br />
Narembeen and Moorine Rock<br />
• Southwest Coachlines services from Collie,<br />
Manjimup, Augusta, Busselton, Bunbury, Margaret<br />
River and Nannup feeding into Bunbury and<br />
Busselton<br />
• New cluster contract in Broome for rural students<br />
include a wheelchair access bus for students<br />
attending Education Support services in the town.<br />
New services will be tendered for Austin Cove<br />
(Mandurah), Bindoon Catholic Agricultural School,<br />
Balgo Hills, Ngalapita, Ngalangangpum Bow River,<br />
Luurnpa, and Billiluna.<br />
SBS will continue to liaise with the Department of<br />
Education to review the student transport assistance<br />
policy with regard to reviewing transport provision<br />
when school facilities are opened or closed.<br />
38 <strong>Public</strong> <strong>Transport</strong> <strong>Authority</strong> <strong>Annual</strong> <strong>Report</strong> <strong>2011</strong>-<strong>12</strong>
Safety<br />
All school bus accidents are notified to the PTA.<br />
<strong>The</strong> measure for the notifiable occurrences is<br />
expressed as the number of accidents (major and<br />
minor) reported during the year. <strong>The</strong> number of<br />
occurrences indicates the effectiveness of the safety<br />
management procedures and controls the extent<br />
to which they are being adhered to by school bus<br />
contractors and drivers.<br />
This year the indicator reached 22, compared with the<br />
target of 13, and the 2010-11 result of 19. <strong>The</strong>re were<br />
22 on-road school bus accidents (all classed as minor)<br />
in <strong>2011</strong>-<strong>12</strong>. Of these, 59 per cent occurred through no<br />
fault of the school bus driver, and <strong>12</strong> occurred in the<br />
country. No fatalities or serious injuries were recorded.<br />
SBS has started a trial of safety devices in response<br />
to a series of incidents where young children were<br />
left on school buses at the end of a service. <strong>The</strong> trial<br />
is considering devices that require the driver to walk<br />
through the bus to activate a switch located at the<br />
rear of the bus.<br />
39
Transwa<br />
Transwa is the brand and operating name for the road and rail<br />
public transport system serving regional centres in the southern<br />
half of <strong>Western</strong> Australia. Our purpose is to provide a customerfocussed,<br />
safe and cost-effective public transport service to<br />
regional WA.<br />
Snapshots<br />
• OTR performances were mixed – the Prospector,<br />
AvonLink and MerredinLink all improved, but the<br />
Australind and road coaches slipped back.<br />
• Due mainly to a good increase in Prospector<br />
numbers, total patronage edged up 0.7 per cent<br />
to 449,804.<br />
Upgrades/Maintenance<br />
• A program to upgrade the seating in the Australind<br />
railcars was completed; the Prospector’s seating<br />
and entertainment system will be upgraded in<br />
20<strong>12</strong>-13.<br />
Passenger satisfaction<br />
• Customer satisfaction, as measured by the<br />
PSM, remained high with 90 per cent of<br />
passengers happy with the overall level of service.<br />
Revenue/Expenditure<br />
• Revenue was up 7.2 per cent at $11.22m;<br />
expenditure was also higher, up 0.61 per cent<br />
at $46.51m.<br />
We monitor our performance against a range of<br />
non-financial and financial indicators such as customer<br />
satisfaction, on-time running (OTR) and cost per<br />
passenger kilometre.<br />
Objectives and outcomes<br />
Objective<br />
To provide customer-focussed passenger transport<br />
services for regional WA<br />
To provide safe and cost-effective passenger<br />
transport services for regional WA<br />
Services to arrive within acceptable punctuality<br />
parameters (within 15 minutes of schedule for the<br />
Prospector and within 10 minutes of schedule for all<br />
other services)<br />
Outcome<br />
We maintained a high level (90 per cent) of overall<br />
customer satisfaction, with cleanliness, punctuality<br />
and staff manner rating highly, reflecting a<br />
commitment to continuous improvement<br />
While maintaining an emphasis on safety, we<br />
continued to look for opportunities to lift our<br />
commercial performance without compromising our<br />
high level of customer service<br />
OTR improved in most areas with AvonLink,<br />
MerredinLink and road coach services maintaining<br />
consistently high levels; the Prospector was up<br />
slightly, though Australind services were adversely<br />
affected by the concrete re-sleepering program<br />
between Armadale and Mundijong<br />
40 <strong>Public</strong> <strong>Transport</strong> <strong>Authority</strong> <strong>Annual</strong> <strong>Report</strong> <strong>2011</strong>-<strong>12</strong>
Review of performance<br />
Trends in patronage<br />
Overall patronage increased fractionally from<br />
2010-11’s 446,637, to 449,804, due mainly to a<br />
10.1 per cent increase in Prospector numbers and<br />
a slight increase in AvonLink and MerredinLink<br />
patronage.<br />
Transwa: Total Patronage<br />
2007-08<br />
2008-09<br />
2009-10<br />
2010-11<br />
<strong>2011</strong>-<strong>12</strong><br />
0<br />
493,655<br />
473,779<br />
456,022<br />
446,637<br />
449,804<br />
100,000<br />
200,000<br />
300,000<br />
400,000<br />
500,000<br />
600,000<br />
Service reliability and information<br />
<strong>The</strong> key performance indicator is OTR and <strong>2011</strong>-<strong>12</strong><br />
targets were:<br />
• Prospector – 90 per cent of services to arrive within<br />
15 minutes of schedule<br />
• Australind – 90 per cent (10min)<br />
• AvonLink – 95 per cent (10min)<br />
• MerredinLink – 95 per cent (10min)<br />
• Road coaches – 95 per cent (10min)<br />
Transwa: OTR performance<br />
Road Coaches<br />
Prospector<br />
AvonLink<br />
MerredinLink<br />
Australind<br />
95%<br />
95%<br />
97%<br />
98%<br />
97%<br />
42%<br />
77%<br />
72%<br />
75%<br />
77%<br />
99%<br />
99%<br />
98%<br />
98%<br />
99%<br />
84%<br />
83%<br />
87%<br />
92%<br />
94%<br />
83%<br />
82%<br />
95%<br />
95%<br />
89%<br />
0% 20% 40% 60% 80% 100%<br />
Transwa: On-time running performance<br />
2007-08 2008-09<br />
2010-11 <strong>2011</strong>-<strong>12</strong><br />
2009-10<br />
<strong>The</strong> combined effect of Brookfield Rail’s rolling program<br />
of track upgrade work and crossings with other trains<br />
impacted on the Australind’s OTR, which ended the<br />
year at 89 per cent, down from 2010-11’s 95 per cent.<br />
<strong>The</strong> performance of the other trains was good –<br />
the AvonLink remained very strong at 99 per cent<br />
(98 per cent previously) while the MerredinLink was<br />
94 (92) per cent and the Prospector 77 (75) per cent.<br />
<strong>The</strong> road coaches maintained a high level of reliability –<br />
97 (previously 98) per cent of services arrived within the<br />
time parameter, continuing a long record of meeting or<br />
bettering performance targets.<br />
Passenger satisfaction<br />
Overall customer satisfaction was maintained at a very<br />
high level. <strong>The</strong> Transwa Passenger Satisfaction Monitor<br />
(PSM), conducted in the second half of the year,<br />
showed that 90 per cent of our passengers were either<br />
satisfied or very satisfied with our service performance.<br />
Transwa: Customer Satisfaction<br />
2007-08<br />
2008-09<br />
2009-10<br />
2010-11<br />
88%<br />
92%<br />
90%<br />
90%<br />
<strong>2011</strong>-<strong>12</strong> 90%<br />
0% 20% 40% 60% 80% 100%<br />
41
Passenger safety<br />
Transwa continued to provide a very safe service for<br />
customers through its commitment to safety systems,<br />
procedures and processes. <strong>The</strong> number of passenger<br />
injuries during the year remained very low.<br />
Efficiency<br />
<strong>The</strong> average cost per road coach passenger kilometre<br />
remained at last year’s $0.22, though the rail equivalent<br />
went down 5.29 per cent to $0.40.<br />
Transwa: Average Cost per passenger kilometre<br />
2007-08<br />
$0.19<br />
$0.44<br />
Revenue and expenditure<br />
Revenue was up 7.2 per cent at $11.22 million, due<br />
mainly to a fare increase in July <strong>2011</strong> and increased<br />
passenger numbers on the Prospector. At the same<br />
time, expenditure was higher than in 2010-11 –<br />
up 0.61 per cent to $46.51m.<br />
Transwa: Revenue (millions)<br />
2007-08<br />
2008-09<br />
2009-10<br />
$10.38<br />
$10.14<br />
$10.26<br />
2008-09<br />
2009-10<br />
2010-11<br />
$0.24<br />
$0.41<br />
$0.20<br />
$0.44<br />
$0.22<br />
$0.43<br />
2010-11 $10.41<br />
<strong>2011</strong>-<strong>12</strong> $11.22<br />
$0 $2 $4 $6 $8 $10 $<strong>12</strong><br />
<strong>2011</strong>-<strong>12</strong><br />
$0.22<br />
$0.40<br />
$0.00 $0.10 $0.20 $0.30 $0.40 $0.50<br />
Road coaches<br />
Rail<br />
42 <strong>Public</strong> <strong>Transport</strong> <strong>Authority</strong> <strong>Annual</strong> <strong>Report</strong> <strong>2011</strong>-<strong>12</strong>
PTA in the Community<br />
Because Transwa services hundreds of WA regional communities, and its<br />
operations are spread across thousands of square kilometres, the organisation<br />
has embraced modern technology to improve its level of customer service.<br />
In the year under review, Transwa decided to<br />
upgrade its existing website to create a new look<br />
and feel for its internet presence.<br />
<strong>The</strong> website had not been updated since 2008<br />
and was due for an aesthetic refresh. It offers<br />
customers a Journey Planner function for booking<br />
travel on the Transwa train and road coach<br />
network, as well as providing a resource for<br />
information relating to fares, timetables, services,<br />
stations, research and announcements.<br />
In re-launching the website, Transwa required<br />
the development of a modern, bold and fresh<br />
look, balanced with the simplicity expected of a<br />
government agency website. <strong>The</strong> design focuses<br />
on easy navigation while retaining strong content<br />
presentation.<br />
<strong>The</strong> site makes good use of imagery to show<br />
what Transwa has to offer. In addressing the key<br />
user types and information areas, the site shows<br />
Transwa is an excellent choice of transport to<br />
the regional community, due to the facilities and<br />
comfort on offer.<br />
Professional creative artists developed the sleek<br />
new design and PTA’s web content staff worked<br />
hard to deliver a result which aims to enhance the<br />
Transwa passenger’s experience.<br />
43
Transwa: Revenue (millions) by service<br />
Transwa: Expenditure (millions)<br />
Australind<br />
AvonLink<br />
MerredinLink<br />
Prospector<br />
$2.29<br />
$1.96<br />
$2.10<br />
$1.70<br />
$1.95<br />
$0.15<br />
$0.15<br />
$0.15<br />
$0.13<br />
$0.14<br />
$0.09<br />
$0.09<br />
$0.10<br />
$0.09<br />
$0.11<br />
$3.45<br />
$3.45<br />
$3.38<br />
$3.63<br />
$4.26<br />
2007-08<br />
2008-09<br />
2009-10<br />
2010-11<br />
<strong>2011</strong>-<strong>12</strong><br />
$49.00<br />
$49.24<br />
$45.79<br />
$46.22<br />
$46.51<br />
$0 $10 $20 $30 $40 $50<br />
In the future<br />
Transwa will replace its booking system in 20<strong>12</strong>-13<br />
with a more functional and modern system.<br />
Road<br />
$4.40<br />
$4.49<br />
$4.53<br />
$4.57<br />
$4.76<br />
$0 $1 $2 $3 $4 $5 $6<br />
We provide hands-on support<br />
for people with mobility difficulties<br />
who might otherwise need to use<br />
a motor vehicle.<br />
2007-08 2008-09<br />
2010-11 <strong>2011</strong>-<strong>12</strong><br />
2009-10<br />
44 <strong>Public</strong> <strong>Transport</strong> <strong>Authority</strong> <strong>Annual</strong> <strong>Report</strong> <strong>2011</strong>-<strong>12</strong>
Transwa trains<br />
<strong>The</strong> train fleet consists of 14 railcars – seven<br />
Prospector, two AvonLink (also used to provide<br />
MerredinLink services) and five Australind railcars.<br />
We run four distinct services:<br />
• <strong>The</strong> Prospector provides a daily service (and two<br />
on Mondays and Fridays) each way between Perth<br />
(the East Perth terminal) and Kalgoorlie for a total of<br />
18 services a week<br />
• <strong>The</strong> Australind operates two daily return services<br />
between Bunbury and Perth for a total of 28<br />
services a week<br />
• <strong>The</strong> AvonLink provides an early-morning weekday<br />
(except public holidays) service from Northam to<br />
Midland, returning early each evening, for a total<br />
of 10 services a week<br />
• <strong>The</strong> MerredinLink provides an all-stops return<br />
service between Perth (the East Perth terminal)<br />
and Merredin on Mondays, Wednesdays and<br />
Fridays (except public holidays), for a total of six<br />
services a week.<br />
In <strong>2011</strong>-<strong>12</strong> Transwa employed 17 railcar drivers<br />
based at East Perth and Bunbury. Australind onboard<br />
services are provided by Bunbury-based Transwa<br />
staff; a contractor provides onboard services on the<br />
Prospector, AvonLink and MerredinLink.<br />
<strong>The</strong> year’s developments<br />
<strong>The</strong> last of the new seats were fitted into the Australind<br />
railcars to improve comfort for passengers and to<br />
improve the overall appearance of the train.<br />
<strong>The</strong> maintenance program for the Prospector<br />
continued and this year included the AvonLink<br />
railcars, with the bogies being replaced. <strong>The</strong> engines<br />
and transmissions continue to be on the ongoing<br />
maintenance program for Transwa railcars.<br />
Plans for a new entertainment system and seats<br />
continued for the Prospector with the critical design<br />
review taking place in the latter half of <strong>2011</strong>-<strong>12</strong>. <strong>The</strong><br />
new seats and entertainment system will improve the<br />
overall amenity of the train and are due for installation<br />
in 20<strong>12</strong>-13.<br />
Patronage<br />
Patronage on Transwa rail services increased 1.7 per<br />
cent from 2010-11’s 233,711 to 237,734, largely driven<br />
by a 10.1 per cent increase in Prospector patronage.<br />
<strong>The</strong> AvonLink and MerredinLink both experienced slight<br />
increases (3.1 per cent and 4.6 per cent respectively)<br />
but Australind patronage continued to decline.<br />
Australind passenger numbers fell 4.9 per cent to<br />
115,835, with a major contributing factor being the<br />
continuing impact of the Forrest Highway (which<br />
has significantly reduced the time of road travel<br />
between Bunbury and Perth) and delays caused by<br />
the completion of the concrete re-sleepering program<br />
between Armadale and Mundijong. <strong>The</strong> service will<br />
be reviewed in 20<strong>12</strong>-13 to see how it can better<br />
meet community expectations.<br />
Transwa Trains: Patronage<br />
151,159<br />
2007-08<br />
91,352<br />
18,427<br />
7743<br />
<strong>12</strong>8,484<br />
2008-09<br />
92,337<br />
18,503<br />
7422<br />
<strong>12</strong>9,228<br />
2009-10<br />
87,188<br />
17,651<br />
7417<br />
<strong>12</strong>1,778<br />
2010-11<br />
90,418<br />
14,838<br />
6677<br />
115,835<br />
<strong>2011</strong>-<strong>12</strong><br />
99,627<br />
15,292<br />
6980<br />
0 50,000 100,000 150,000<br />
Australind Prospector<br />
AvonLink MerredinLink<br />
45
Passenger satisfaction<br />
PSM continued to show excellent overall satisfaction<br />
levels for Transwa trains – the Australind rating<br />
remained high at 93 per cent and the MerredinLink<br />
was 87 per cent. <strong>The</strong> AvonLink approval jumped<br />
significantly to 90 per cent from the previous year’s<br />
75 per cent (when it was rated jointly with the<br />
MerredinLink), while Prospector saw a decrease to<br />
86 per cent, mainly reflecting passenger dissatisfaction<br />
with the onboard entertainment system, which is due<br />
to be replaced in 20<strong>12</strong>-13.<br />
Transwa Trains: Customer Satisfaction<br />
2007-08<br />
2008-09<br />
2009-10<br />
2010-11<br />
<strong>2011</strong>-<strong>12</strong><br />
86%<br />
89%<br />
87%<br />
96%<br />
92%<br />
90%<br />
96%<br />
93%<br />
84%<br />
94%<br />
96%<br />
75%<br />
86%<br />
93%<br />
87%<br />
90%<br />
0% 20% 40% 60% 80% 100%<br />
Prospector<br />
AvonLink &<br />
MerredinLink<br />
Australind<br />
*AvonLink<br />
*MerredinLink<br />
Note: Before <strong>2011</strong>-<strong>12</strong> AvonLink and MerredinLink<br />
results were combined.<br />
Transwa road coaches<br />
During the year we operated 144 services each week,<br />
employing 34 road coach operators for our fleet of<br />
22 five-star vehicles.<br />
Transwa road coaches: On-Time Performance<br />
2007-08<br />
2008-09<br />
2009-10<br />
2010-11<br />
95%<br />
95%<br />
97%<br />
98%<br />
<strong>2011</strong>-<strong>12</strong> 97%<br />
0% 20% 40% 60% 80% 100%<br />
<strong>The</strong> year’s developments<br />
A review of Transwa stopping places between Perth<br />
and Esperance during the year improved the running<br />
times for these services.<br />
Continuation of our Preventative Maintenance Program<br />
(PMP) ensured that we maintain a high level of comfort<br />
for customers and improved coach reliability and<br />
safety. Phase four of the PMP focussed largely on the<br />
road coach transmissions and included servicing of the<br />
air conditioning, demisters and heaters.<br />
<strong>The</strong> interior decor on the road coaches was upgraded,<br />
with the vinyl in facility areas being re-trimmed and<br />
the carpets replaced to improve overall aesthetics<br />
and amenity. Safety barriers were installed to increase<br />
passenger safety.<br />
Patronage<br />
Despite these improvements, patronage on most of<br />
our coach routes slipped slightly throughout the year.<br />
<strong>The</strong> overall result was down 0.4 per cent at 2<strong>12</strong>,070.<br />
Transwa road coaches: Patronage<br />
2007-08<br />
2008-09<br />
2009-10<br />
2010-11<br />
<strong>2011</strong>-<strong>12</strong><br />
0<br />
224,974<br />
227,033<br />
214,538<br />
2<strong>12</strong>,926<br />
2<strong>12</strong>,070<br />
50,000<br />
100,000<br />
150,000<br />
200,000<br />
250,000<br />
46 <strong>Public</strong> <strong>Transport</strong> <strong>Authority</strong> <strong>Annual</strong> <strong>Report</strong> <strong>2011</strong>-<strong>12</strong>
Passenger satisfaction<br />
As is the case with our trains, Transwa’s road coaches<br />
enjoy a consistently high customer approval level.<br />
<strong>The</strong> latest PSM shows that 91 per cent of customers<br />
are either satisfied or very satisfied with the road coach<br />
services.<br />
Transwa road coaches: Customer Satisfaction<br />
2007-08<br />
2008-09<br />
2009-10<br />
2010-11<br />
<strong>2011</strong>-<strong>12</strong><br />
88%<br />
90%<br />
89%<br />
90%<br />
91%<br />
0% 20% 40% 60% 80% 100%<br />
Infrastructure<br />
In the year under review, we completed the fourth<br />
phase of the road coach PMP and began preparatory<br />
work for phase five. <strong>The</strong> PMP has been operating<br />
since 2009 and is designed to run until 2014-15.<br />
It ensures that our road fleet continues to operate<br />
safely and reliably. <strong>The</strong> program includes replacing<br />
vital components at certain milestones and carrying<br />
out rebuilds of major assemblies such as engines and<br />
transmissions before reliability issues arise.<br />
<strong>The</strong> coach depot in East Perth will be upgraded in<br />
20<strong>12</strong>-13.<br />
47
Network and<br />
Infrastructure<br />
<strong>The</strong> Network and Infrastructure (N&I) division is responsible for<br />
the management and maintenance of the urban passenger rail<br />
network, the delivery of part of the asset investment program,<br />
and the delivery of information technology services.<br />
Snapshots<br />
New facilities<br />
• More than 2600 new car parking bays now<br />
completed on the Joondalup and Mandurah lines.<br />
• Completed upgrade of Mt Lawley Station to meet<br />
current accessibility requirements; started similar<br />
work at Meltham and Queens Park.<br />
• Completed construction of a new Central<br />
Monitoring Room, to incorporate bus operations<br />
as well as rail, and a Video Surveillance Office.<br />
• Replaced two rail-over-road bridges in Claremont<br />
(Stirling Road and Shenton Road).<br />
• Built a train turnback siding and crossover facility<br />
at Leederville as part of a $19.8m program to<br />
minimise disruption to PTA customers in the<br />
case of breakdowns or failures.<br />
• Continued work on a detailed conservation<br />
and restoration program at Fremantle Station.<br />
N&I has a service level agreement with Transperth<br />
Train Operations (TTO) which details its responsibility<br />
for the provision and maintenance of the infrastructure<br />
required to operate train services reliably, efficiently<br />
and safely. N&I’s focus is on providing and maintaining<br />
rail infrastructure at a high reliability level. In turn, this<br />
enables TTO to provide a high-quality train service<br />
to the PTA’s customers.<br />
Maintenance<br />
Most of the division’s resources are allocated to<br />
maintenance, both planned and breakdown.<br />
Routine maintenance is planned carefully to ensure the<br />
infrastructure is safe and highly reliable. This ensures<br />
that our customers continue to enjoy a safe and<br />
dependable train service. <strong>The</strong> division also deploys<br />
its resources to ensure a rapid response to any<br />
breakdowns to minimise delays and customer impact.<br />
<strong>The</strong> rail network’s 70 stations are highly-visible<br />
infrastructure assets. As well as ensuring that all station<br />
facilities are reliable, considerable effort is made to have<br />
them well presented.<br />
This is achieved through regular cleaning and periodic<br />
large maintenance items such as high-pressure water<br />
cleaning and painting.<br />
Asset management<br />
<strong>The</strong> division oversees an asset portfolio with a net<br />
book value of approximately $2.1 billion, and is<br />
well advanced in implementing a comprehensive<br />
asset management system based on PAS55<br />
– an internationally-recognised asset management<br />
methodology.<br />
A core component of the methodology is Asset<br />
Management Plans (AMP) that identify planned<br />
maintenance, set targets for asset performance,<br />
record maintenance costs, detail future asset<br />
replacement requirements and identify improvements<br />
required to lift asset performance.<br />
Increasing resilience of<br />
Perth’s train system<br />
With Perth’s well-documented rapid population growth<br />
(and associated congestion), the public transport<br />
system is increasingly vital to the smooth operation of<br />
the city. <strong>The</strong> PTA is undertaking work to strengthen the<br />
network to make it more resilient when problems occur.<br />
Key aspects of this work are the installation of train<br />
turnbacks close to the city, and improvements in the<br />
traction power system.<br />
48 <strong>Public</strong> <strong>Transport</strong> <strong>Authority</strong> <strong>Annual</strong> <strong>Report</strong> <strong>2011</strong>-<strong>12</strong>
Asset investment program<br />
Parking facilities program –<br />
Better <strong>Transport</strong> System<br />
<strong>The</strong> Better <strong>Transport</strong> System project will deliver<br />
more than 4500 car bays (compared with the original<br />
3000-bay target) on the Joondalup and Mandurah lines<br />
at a total cost of $50 million. To balance date, 14 car<br />
park extensions have been completed for a total of<br />
2647 new bays – 88.2 per cent of the original target.<br />
Construction is taking place at Currambine,<br />
Rockingham and Cockburn Central and, with<br />
completion forecast for the third quarter of 20<strong>12</strong>,<br />
a further 1870 (approximately) bays will take the<br />
total to more than 4500.<br />
As part of the Better <strong>Transport</strong> initiative, increased<br />
bicycle and motor cycle parking facilities, including<br />
20 new bicycle shelters, are being built to improve<br />
integrated travel to train stations.<br />
Provision of disabled access at train stations<br />
<strong>The</strong> PTA sets out to provide passenger transport<br />
services that are accessible for everyone. While many<br />
of our facilities are years ahead of official disability<br />
standards, some older stations still require work to<br />
meet compliance requirements.<br />
<strong>The</strong> Mt Lawley Station accessibility upgrade was<br />
completed in the first half of 20<strong>12</strong> and Meltham<br />
Station’s upgrade is scheduled for completion in<br />
August. Preliminary work has started at Queens Park<br />
Station with upgrades also scheduled for Maddington,<br />
Beckenham and North Fremantle stations.<br />
49
<strong>The</strong>se works are part of an ongoing program to make<br />
PTA train stations accessible to all members of the<br />
community.<br />
Fremantle Station heritage upgrade<br />
All work at Fremantle Railway Station is being<br />
carried out in accordance with an approved<br />
Heritage Conservation Plan. Because the work requires<br />
specialist expertise, heritage craftsmen have taken on<br />
the painstaking process of matching stone, carving<br />
blocks, re-mortaring bricks and restoring timber as<br />
closely as possible to the original fittings.<br />
Stage One (now complete) of the conservation<br />
work involved the removal of the paint covering the<br />
main entry facade, and repairs to the Donnybrook<br />
stonework. Stage Two (also complete) involved<br />
upgrading the station’s electrical system. Stage Three,<br />
the restoration of the elaborate finishes, is nearing<br />
completion.<br />
Leederville crossover/turnout<br />
<strong>The</strong> Leederville turnback siding is the first turnback and<br />
crossover facility delivered under a $19.8m program<br />
(for turnbacks and sidings) covering three locations<br />
– Leederville, Karnup and South Perth. This is a key<br />
component of the resilience program currently being<br />
implemented to minimise the disruption to the PTA’s<br />
customers when failures (which cannot be totally<br />
avoided) occur.<br />
<strong>The</strong> Karnup site is under construction and South Perth<br />
is in the planning phase.<br />
Before construction of the Leederville turnback, the<br />
closest that Joondalup Line trains could get to the City<br />
in the event of a failure was Stirling. Now, in the event<br />
of problems, passengers can be brought to Leederville<br />
Station, which will significantly reduce the disruption to<br />
their day.<br />
Shenton and Stirling Road bridges<br />
<strong>The</strong> Shenton Railway Bridge is on the Fremantle Line<br />
and spans Shenton Road between the Showgrounds<br />
and Claremont stations; the Stirling Road Bridge<br />
is 500m to the west. Both bridges were built in<br />
the mid-1940s with the girders likely to have been<br />
manufactured in 19<strong>12</strong> (similar to Stirling Road subway)<br />
and reconditioned for use at the current location.<br />
Both bridges had reached a stage where replacement<br />
was required to ensure ongoing safe operation of<br />
the trains. <strong>The</strong> new bridges were pre-fabricated<br />
and installed on site during two separate 80-hour<br />
shutdowns. Both projects were successfully<br />
completed as a result of meticulous planning<br />
and skilled teamwork.<br />
50 <strong>Public</strong> <strong>Transport</strong> <strong>Authority</strong> <strong>Annual</strong> <strong>Report</strong> <strong>2011</strong>-<strong>12</strong>
PTA in the Community<br />
<strong>The</strong> Fremantle Railway Station, built in 1907, provided an essential link between<br />
the commercial port and the rest of WA and was designed to be “an imposing<br />
building … of great convenience to the merchants and public of Fremantle.”<br />
It was designed by New Zealander William<br />
Dartnell, Chief Engineer of Existing Lines of the<br />
Railway Department. Built in a matter of months<br />
in federation free classic style using elaborately<br />
carved Donnybrook stone on the façade, it<br />
featured a spacious black-and-white tiled hall<br />
separating various offices from the ladies’<br />
waiting-rooms and refreshment area.<br />
An article in <strong>The</strong> West Australian celebrated the<br />
opening with praise for the electric platform lights,<br />
white glazed wall tiles, rolled glass skylights and<br />
even the modern lavatories. It concluded that,<br />
“in many respects, the new Fremantle Station is<br />
the most up-to-date in the State.”<br />
Now, more than 100 years later, it is being<br />
brought back to its former glory by the<br />
conservation efforts of the PTA, which has<br />
been undertaking a multi-million dollar staged<br />
conservation program since 2005.<br />
<strong>The</strong> station was classified by the National Trust in<br />
1974 and is listed on the Register of the National<br />
Estate and Register of Heritage Places. All work is<br />
being carried out in accordance with an approved<br />
Heritage Conservation Plan.<br />
Stage one removed multiple layers of paint from<br />
the entry façade and repaired the underlying<br />
Donnybrook stone; the second upgraded the<br />
station’s electrics. At balance date the third<br />
stage, restoring the elaborate finishes, was<br />
almost complete.<br />
Two original skylights have been repaired, with<br />
frames and glass replaced, a glass archway<br />
window in the entrance foyer has been uncovered<br />
and restored, and the main entrance doors<br />
have been removed and restored. Outside,<br />
the brickwork has been repointed, some stone<br />
mouldings replaced, cast iron rainheads and<br />
downpipes – reproduced to match the originals<br />
have been installed.<br />
One of the quirkier elements of Mr Dartnell’s<br />
design was the inclusion, on two plinths above<br />
the entrance, of six carved swans. Though the<br />
official State emblem depicts the iconic WA black<br />
swan, early photographs and paint chips show<br />
the railway swans were originally painted white<br />
by their creator – Fremantle plaster modeller<br />
Walter Burvil.<br />
By 1951, the outermost swans in each group had<br />
been painted black but the Heritage Council has<br />
recommended that all the swans be painted white<br />
again, to be authentic to the original design.<br />
51
Major<br />
Projects Unit<br />
<strong>The</strong> Major Projects Unit was established to deliver high-value,<br />
high-risk complex public transport infrastructure projects.<br />
It has a small, specialist management team and about<br />
45 staff and contractors.<br />
Snapshots<br />
• <strong>The</strong> $609 million Perth City Link project is funded<br />
by three tiers of government – $336m from the<br />
State, $236m from the Commonwealth (for the rail<br />
project) and $37m from the City of Perth.<br />
New facilities<br />
• <strong>The</strong> Perth City Link Rail Alliance (the PTA,<br />
John Holland and GHD) advanced design<br />
work to 80 per cent complete.<br />
• First major trackwork changes were completed<br />
in December <strong>2011</strong>.<br />
• A significant dewatering and recharge system<br />
was established and commissioned.<br />
• Work started on the rail tunnel beneath Barrack<br />
Street and the structural support work under<br />
the City of Perth Child Care Centre.<br />
• <strong>The</strong> $240m Butler Extension Program is<br />
scheduled for completion in 2014.<br />
As at June 30, it was overseeing the implementation<br />
of projects – primarily Perth City Link and the northern<br />
extension of the rail network – valued at $850 million<br />
over four years. <strong>The</strong> unit will expand its operations to<br />
take on the delivery phase of the next wave of major<br />
projects including the transport infrastructure for the<br />
major stadium at Burswood and the next stage of<br />
expansion of the Joondalup Line north of Butler.<br />
Perth City Link<br />
PCL will transform the CBD. <strong>The</strong> project’s transport<br />
component – funded by the State ($336 million), the<br />
Commonwealth (rail project only $236m) and the City<br />
of Perth ($37m) – is among its first stages and, literally,<br />
sets the scene for the most significant urban renewal in<br />
the WA capital’s history and the development of major<br />
inner-city residential, retail and commercial properties.<br />
To realise this vision, the PTA will:<br />
• sink the Fremantle Line between William Street<br />
and Lake/King Streets to enable development of<br />
street-level connections between the CBD and<br />
Northbridge<br />
• build associated works to enable further<br />
development by the Metropolitan Redevelopment<br />
<strong>Authority</strong> (MRA) after completion of the rail and<br />
bus works<br />
• upgrade Perth Station and ensure platform<br />
capacity for future growth<br />
• improve connections between Perth Station and<br />
Perth Underground with a pedestrian underpass<br />
• replace the existing Wellington Street Bus Station<br />
(WSBS) with a new underground facility.<br />
<strong>The</strong> PTA will deliver the PCL transport project in two<br />
stages: the $360m rail project (<strong>2011</strong>-2014) and the<br />
$249m bus project (2014-2016). When this is done,<br />
the MRA will continue with its program of aboveground<br />
development on the newly-released land.<br />
PCL Rail Project<br />
Forward works for the rail component of PCL were<br />
completed late 2010 and July <strong>2011</strong>. <strong>The</strong> main work<br />
is being undertaken by the Perth City Link Rail Alliance<br />
– the PTA’s first experience in the delivery of a major<br />
infrastructure project through a competitive alliance<br />
form of contract. <strong>The</strong> Alliance (the PTA, John Holland<br />
and design consultant GHD) was formed in March<br />
<strong>2011</strong> and will continue to the end of the construction<br />
and the commissioning of the railway works, scheduled<br />
for mid-2014.<br />
52 <strong>Public</strong> <strong>Transport</strong> <strong>Authority</strong> <strong>Annual</strong> <strong>Report</strong> <strong>2011</strong>-<strong>12</strong>
<strong>The</strong> PTA has a number of key senior people working<br />
within and alongside the Alliance to ensure that the<br />
best outcomes are achieved and that interfaces with<br />
the PTA and key stakeholders are properly considered.<br />
By balance date, the Alliance had achieved:<br />
• Design complete to 80 per cent<br />
• Dewatering and recharge system established<br />
and commissioned<br />
• First track work changes completed<br />
(December <strong>2011</strong>)<br />
• Establishment of 11 work sites between Moore<br />
Street and Fitzgerald Street (work under way on<br />
all sites)<br />
• Major progress towards completion of diaphragm<br />
walls for the Fremantle Line tunnel<br />
• Major progress on pedestrian underpass between<br />
the station building and Platform 6<br />
• Start of works for the rail tunnel beneath Barrack<br />
Street and the structural support work under the<br />
City of Perth Child Care Centre.<br />
PCL Bus Project<br />
<strong>The</strong> PTA reviewed the scope, procurement strategy<br />
and delivery timeframe for the underground bus<br />
station. <strong>The</strong> procurement methodology for this project<br />
will be focused on managing risk and interface with<br />
multiple external stakeholders. Later in the year the<br />
PTA will put out a public tender for competitive bids to<br />
progress design and to construct the bus station, with<br />
completion no later than mid-2016.<br />
PTA in the Community<br />
An artist impression of the pedestrian<br />
underpasses being built as part of the Perth<br />
City Link project.<br />
53
<strong>The</strong> new bus station will have advanced passenger<br />
information systems and a real-time tracking system<br />
to accurately locate buses. This will enable arrival and<br />
departure points within the station to be assigned by<br />
an intelligent transportation system that will operate<br />
a dynamic bus-stand allocation system.<br />
Joondalup Line extension to Butler<br />
<strong>The</strong> $241 million Butler Extension Project (BEP) was<br />
approved in 2009 and is due for completion by late<br />
2014. It will include:<br />
• Duplication of the existing single track between<br />
Clarkson Station and Nowergup Railcar Depot<br />
• New double-track railway between Hester Avenue<br />
(Nowergup) and just north of the new station at<br />
Butler (about 4km)<br />
• A new station at Butler<br />
• Replacement of the main communications fibre<br />
optic cables and station equipment between<br />
Clarkson Station and the <strong>Public</strong> <strong>Transport</strong> Centre<br />
in East Perth<br />
• A new fibre optic cable system to provide<br />
back-up communications, replacing a<br />
low-capacity microwave system<br />
• Signalling, traction overhead wiring and traction<br />
SCADA for the extension to Butler<br />
• Bulk earthworks, retaining walls and drainage<br />
for the railway alignment<br />
• Three road-over-rail bridges<br />
• A new traction-power supply and feeder station<br />
within Nowergup Depot, with new equipment and<br />
interconnection work at the nearby <strong>Western</strong><br />
Power sub-station<br />
• Additional stowage tracks at Nowergup and<br />
Mandurah Depots, and new servicing facilities<br />
at Mandurah<br />
• Supply of 11 new buses to serve the expanded<br />
bus network around the new station and to<br />
enhance the frequency of existing services.<br />
<strong>The</strong> coming year will be very significant for the BEP,<br />
with up to $93 million being committed towards<br />
completion of the road bridges, construction of the<br />
station, continuation of work on communications<br />
equipment and cables, the acquisition of materials for<br />
the railway infrastructure, including track, sleepers, rail<br />
fastenings and turnouts, and the power supply, feeder<br />
station and <strong>Western</strong> Power connection.<br />
54 <strong>Public</strong> <strong>Transport</strong> <strong>Authority</strong> <strong>Annual</strong> <strong>Report</strong> <strong>2011</strong>-<strong>12</strong>
PTA in the community<br />
To construct new track through the north side of Perth Station, modifications<br />
were required to the structural supports of the City of Perth Child Care Centre<br />
and beneath Barrack Street. This involved very complex construction work<br />
which required major changes to the Child Care Centre building,<br />
To get underneath the structure, the Perth City<br />
Link Rail Alliance had to dig up the Child Care<br />
Centre’s playground and build a new supporting<br />
wall and slab, then place soil and grass back on<br />
the slab and reinstate the playground. While this<br />
work was taking place, the children had to be<br />
moved away to a temporary playground in the<br />
concourse on the south side of the centre.<br />
After extensive consultation between the<br />
Alliance team and the Child Care Centre<br />
manager, a safe and attractive alternative<br />
environment for the children was established.<br />
<strong>The</strong> temporary playground was greeted with<br />
great enthusiasm by the City of Perth, the<br />
parents and – most importantly – the children.<br />
It has been a resounding success and stands<br />
as a shining example of how successful<br />
stakeholder engagement and positive spirit<br />
can produce a very effective solution to a tricky<br />
construction problem.<br />
55
Infrastructure<br />
Planning and<br />
Land Services<br />
<strong>The</strong> Infrastructure Planning and Land Services (IPLS) division<br />
focuses on the strategic planning of the public transport<br />
network and to manage the PTA’s extensive land assets.<br />
Its brief includes the definition of future infrastructure<br />
and rollingstock requirements; the master planning<br />
of major projects, including justification and the<br />
development of business cases; the management<br />
of PTA land and properties; and the management<br />
of the PTA’s environmental activities and issues.<br />
<strong>The</strong> division has four branches:<br />
• Transit Planning and Business Development<br />
• Rail Planning and Design<br />
• Land and Property Services<br />
• Environmental.<br />
<strong>The</strong> division has been tasked with preparing, by the<br />
end of the 20<strong>12</strong>-13 financial year, a Master Plan for a<br />
railway from the Midland Line at Bayswater, to Perth<br />
Airport and beyond. Also in the coming twelve months,<br />
IPLS will prepare detailed plans for:<br />
• Rail, road and pedestrian facilities to support the<br />
new Perth Major Stadium at Burswood<br />
• Extension of the Joondalup Line to Yanchep<br />
• Extension (in the medium term) of the Thornlie Spur<br />
to Canning Vale (and beyond)<br />
• A major new Park ‘n’ Ride train station on the<br />
Mandurah Line; (the new Aubin Grove Station).<br />
Transit Planning and<br />
Business Development<br />
This branch is responsible for the planning of future<br />
railways, rail extensions and new railway stations, as<br />
well as long-term planning for rail operations and railcar<br />
acquisition. Key projects for <strong>2011</strong>-<strong>12</strong> included:<br />
• Detailed planning for the extension of the<br />
Joondalup Line to Yanchep<br />
• Detailed planning for the future railway through<br />
Perth Airport to the eastern foothills<br />
• Concept design for a new station at Karnup<br />
(Paganoni Road)<br />
• Concept design for a new bus station at Canning<br />
Bridge Station<br />
• Preliminary design concepts for a future re-location<br />
of Midland Station further east near the new hospital<br />
• Preliminary transport analysis for the proposed<br />
Burswood stadium, including all rail, bus, road and<br />
non-motorised transport requirements<br />
• Analysis of TOD (transport-orientated development)<br />
opportunities in relation to the Perth transport<br />
system<br />
• Modelling transport demand on Perth’s rail<br />
network for the next 20 years to determine railcar<br />
requirements. This work will be the foundation of<br />
studies to identify associated infrastructure and<br />
operational requirements.<br />
56 <strong>Public</strong> <strong>Transport</strong> <strong>Authority</strong> <strong>Annual</strong> <strong>Report</strong> <strong>2011</strong>-<strong>12</strong>
Rail Planning and Design<br />
This branch provides engineering expertise for the<br />
planning and design of new rail projects, and technical<br />
support for the civil and track maintenance of our<br />
assets. Using computer-aided design, our engineers<br />
develop conceptual plans up to detailed design, and<br />
help other agencies in the implementation of<br />
rail projects.<br />
Key projects for 20<strong>12</strong>-13 include:<br />
• Conceptual design of the Butler-to-Yanchep<br />
extension<br />
• Conceptual design of the transport infrastructure<br />
for the proposed Burswood stadium<br />
• Detailed design for the Butler Extension Project<br />
(BEP) and network improvements at Leederville<br />
and Karnup<br />
• Provision of technical rail advice to the Department<br />
of Planning, Department of <strong>Transport</strong> and Main<br />
Roads WA in relation to rail infrastructure works.<br />
57
Land and Property Services<br />
This branch manages the PTA’s non-operational land<br />
and property portfolio including heritage, leasing,<br />
acquisitions and sales, and provides related supporting<br />
services to other divisions within the PTA.<br />
During the year, leasing income exceeded $<strong>12</strong>.9<br />
million ($<strong>12</strong>m in 2010-11). A land and property register<br />
was completed and a complementary geographical<br />
information system is planned. This will be useful in<br />
defining the areas and attributes of more than 4000<br />
listed properties and particularly the 594 current leases.<br />
Support is being provided for major initiatives such<br />
as the Perth City Link, Butler (under construction)<br />
and Yanchep (planned) stations, and work has started<br />
on managing the risks associated with disused country<br />
railway lines following a major risk analysis project<br />
last year.<br />
<strong>The</strong> branch works with other divisions and agencies for<br />
the disposal of redundant assets.<br />
Environmental Branch<br />
This branch was formed to provide specific<br />
environmental services across the PTA. It addresses<br />
significant and diverse environmental issues such<br />
as noise and vibration, land contamination and<br />
revegetation.<br />
Investigations of contaminated land were undertaken<br />
during the year at the former Geraldton, Leighton<br />
and Forrestfield marshalling yards, Kewdale freight<br />
terminal and a former service station site on rail<br />
land in Gosnells.<br />
We also provided environmental support to the<br />
Office of Strategic Projects by launching contamination<br />
investigations and environmental approval processes<br />
for the Burswood stadium project, and managed<br />
revegetation of land (pertaining to the New MetroRail<br />
project) at Leda, Stakehill and Paganoni Reserve, and<br />
monitoring of vegetation protection areas at Warnbro<br />
and Murdoch train stations.<br />
<strong>The</strong> branch helped the PTA’s N&I division with<br />
noise and vibration monitoring and management.<br />
Support was also provided to the Major Projects<br />
division regarding preparation of clearing proposals<br />
at Nowergup and revegetation for the BEP, and<br />
environmental studies were undertaken for several<br />
future projects (including the Butler-to-Yanchep railway<br />
extension and Karnup Station).<br />
58 <strong>Public</strong> <strong>Transport</strong> <strong>Authority</strong> <strong>Annual</strong> <strong>Report</strong> <strong>2011</strong>-<strong>12</strong>
PTA in the community<br />
<strong>The</strong> State Government has announced the Burswood peninsula as the<br />
preferred location for Perth’s new major sports stadium, to accommodate<br />
60,000 people. To facilitate development of the stadium, the Office of<br />
Strategic Projects (OSP) and the Department of Sport and Recreation (DSR)<br />
are preparing a Master Plan, which will provide a local context for<br />
the stadium.<br />
It is intended that the majority of patrons of this<br />
significant, multi-purpose community asset<br />
will get to and from the stadium using public<br />
transport, so it is crucial to get the numbers<br />
right. Planning responsibility for the transport<br />
infrastructure, estimated to cost $300 million,<br />
has been put into a separate process and the<br />
PTA, working through IPLS, has been delegated<br />
as the lead agency. IPLS is working with Main<br />
Roads WA, DSR, OSP and other stakeholders in<br />
this task.<br />
A <strong>Transport</strong> Project Control Group, chaired by<br />
PTA managing director Mark Burgess, has been<br />
formed to oversee the work.<br />
Preparation of the Master Plan will address<br />
requirements for the following transport<br />
elements:<br />
• <strong>Public</strong> transport infrastructure – both rail<br />
and bus<br />
• A new pedestrian bridge across the Swan<br />
River from East Perth<br />
• Road enhancements and improvement to<br />
accommodate stadium traffic.<br />
IPLS is playing a key role in providing crucial<br />
assistance to DSR and OSP in the scoping<br />
and management of key environmental and<br />
geotechnical studies and the attainment of<br />
environmental approvals for the Master Plan.<br />
59
Strategic Asset<br />
Management<br />
Development<br />
<strong>The</strong> Strategic Asset Management Development branch was set<br />
up for a finite period to work as a specific and dedicated team,<br />
working across all divisions, to develop asset management<br />
plans for all PTA infrastructure and rollingstock, ensuring a good<br />
understanding of the principles of asset management across the<br />
organisation.<br />
During the year under review, the PTA finalised a<br />
management framework consisting of an asset<br />
management policy, strategy and guidelines and<br />
supporting procedures to ensure sound management<br />
of its assets. This framework follows BSI PAS 55:2008,<br />
which was developed by the Institution of Asset<br />
Management (IAM) and is to be replaced by ISO 55000<br />
series on asset management (currently in draft).<br />
<strong>The</strong> branch made significant progress in the<br />
implementation of the asset management framework.<br />
Already we are starting to see the outcomes of taking<br />
a whole-of-lifecycle approach to assets including more<br />
accurate prediction of asset life, replacement and<br />
maintenance costs.<br />
During the year each area of Network and<br />
Infrastructure (N&I) finalised an Asset Management Plan<br />
(AMP) covering all classes of assets in their discipline.<br />
<strong>The</strong>y developed a summarised AMP for each class<br />
of asset with brief details including criticality of asset,<br />
level of service, estimated life, lifecycle strategies and<br />
funding required (maintenance and capital).<br />
Training and awareness courses were undertaken<br />
in asset management, including Certificate IV in<br />
Maintenance Management, Asset Management<br />
Fundamentals and Reliability-centred Maintenance.<br />
Five maintenance planners have been appointed and<br />
all disciplines of N&I have their maintenance planning<br />
completed, at least to the detail where work can<br />
be scheduled to the relevant discipline by specific<br />
equipment.<br />
Significant progress has been made with the upgrade<br />
of the PTA’s EAM System from Ellipse 5.3.2 to 8.3.<br />
System design is being undertaken with deployment<br />
planned for December 20<strong>12</strong>. <strong>The</strong> strategic asset<br />
management function, plans and policies are evolving<br />
into ‘mainstream’ practice across all PTA divisions.<br />
60 <strong>Public</strong> <strong>Transport</strong> <strong>Authority</strong> <strong>Annual</strong> <strong>Report</strong> <strong>2011</strong>-<strong>12</strong>
Transperth’s bus replacement<br />
program will put some of the country’s<br />
most environmentally-friendly buses<br />
into the Perth community.<br />
61
PTA people<br />
PTA people are dedicated to the delivery of safe, customerfocussed,<br />
integrated and efficient transport services to the<br />
WA community, a commitment which was confirmed in the<br />
<strong>2011</strong>-<strong>12</strong> EOP (employee opinion poll). <strong>The</strong> PTA recognises the<br />
importance of attracting, developing and retaining the right<br />
people in the right jobs to maintain and exceed the high<br />
standards of service delivered each year.<br />
Snapshots<br />
• <strong>The</strong> PTA employed 1462 people as<br />
at June 30.<br />
• Implementation of the employee-generated<br />
onePTA program continued, with the introduction<br />
of targeted systems and processes.<br />
• <strong>The</strong> first cycle of MAPs (the PTA’s My Action<br />
Plan performance development process) was<br />
completed and a second cycle, incorporating<br />
behavioural standards, was introduced.<br />
• A organisation-wide third Employee Opinion<br />
Poll was conducted. Majority of respondents<br />
felt positive; full analysis is still being undertaken.<br />
• Major transit officer and railcar driver recruitment<br />
process undertaken.<br />
• Competency mapping and structured training<br />
programs developed for key infrastructure roles.<br />
• Successful overseas recruitment process to fill<br />
priority engineering and technical positions.<br />
• Leadership development training conducted<br />
for supervisors.<br />
<strong>The</strong> PTA Strategic Plan reflects our commitment<br />
to managing our people effectively. <strong>The</strong> People<br />
component sets four core strategic outcomes –<br />
Workforce Capacity, Organisational Performance,<br />
Strategic Leadership, and one PTA Culture – all<br />
underpinned by our values. <strong>The</strong> plan guides the<br />
organisation in decisions affecting our people.<br />
All people strategies, initiatives and actions are<br />
aligned to the achievement of one or more of the four<br />
outcomes. We expect and seek the best from our<br />
people and recognise the importance of rewarding<br />
effort and supporting development in achieving that<br />
aim. We also promote and support a positive work<br />
environment.<br />
As well as following public sector standards in human<br />
resource management, the PTA has achieved higher<br />
levels of transparency, consistency and efficiency<br />
through the review and streamlining of processes<br />
as part of the onePTA program. This was launched<br />
in 2010 and continues to deliver improvements for<br />
the PTA – the workplace experience impacts on<br />
employee engagement, motivation, commitment<br />
and performance.<br />
<strong>The</strong> onePTA program promotes a united purpose<br />
for PTA employees and supports a strong culture of<br />
safety, respect, recognition, integrity and sustainability.<br />
In 2010-11, improvements focussed on processes<br />
and systems – streamlining recruitment, improving<br />
performance reviews and development planning, and<br />
increasing employee access to information. In the<br />
current year, the focus shifts to management skills<br />
and capabilities, and the influence of corporate and<br />
individual values on employee behaviour and the<br />
workplace environment.<br />
In March and April we conducted our third EOP.<br />
<strong>The</strong> majority of respondents reported feeling positive<br />
about working at the PTA – a full analysis is being<br />
undertaken and will be used to assess the impact of<br />
the actions initiated through the onePTA program and<br />
future improvements opportunities.<br />
62 <strong>Public</strong> <strong>Transport</strong> <strong>Authority</strong> <strong>Annual</strong> <strong>Report</strong> <strong>2011</strong>-<strong>12</strong>
<strong>The</strong> PTA is engaged in a broad range of activities and<br />
employs a diverse workforce. Job roles and career<br />
paths are offered in direct transport service provision,<br />
front-line customer service, planning, infrastructure<br />
design and delivery, maintenance, trades, project and<br />
contract management, security and a wide range of<br />
professions. As at June 30, the PTA employed<br />
1462 people.<br />
Strategic People Management<br />
Workforce planning and development are a key focus.<br />
Planning provides a strategic framework to identify<br />
future needs and the challenges we face in attracting<br />
and retaining a skilled workforce. In this context the<br />
PTA develops strategies to attract and recruit new<br />
employees and develop the capabilities of the<br />
existing workforce.<br />
<strong>The</strong> Graduate Recruitment Program is an important<br />
vehicle to attract and retain high-calibre people for<br />
eventual appointment to key leadership roles in the<br />
PTA. <strong>The</strong> program started in 2002 and has provided<br />
a pool of talented employees. It will be maintained<br />
as a key strategy in a competitive employment<br />
market. This year we introduced a complementary,<br />
undergraduate program to provide people who seek<br />
vacation work at the PTA a structure through which<br />
they might enter the PTA graduate program.<br />
On Radio Lollipop Uniform<br />
Free Day the PTA collected $69,177.<br />
63
Learning and Development<br />
Building on the foundations established in 2010-11,<br />
the Learning and Development (L&D) branch increased<br />
its service offerings to the wider PTA in <strong>2011</strong>-<strong>12</strong>, by<br />
enhancing relationships with key stakeholders across<br />
the organisation, and more clearly identifying the<br />
avenues to increased workforce capability.<br />
In this “back to basics” approach, a role matrix is<br />
being used to define training requirements. Roles are<br />
reviewed to identify what mandatory training is needed<br />
to ensure competency. This has generated a number<br />
of initiatives.<br />
PTA in the Community<br />
One the many charities helped by the PTA<br />
and its people was Movember – 38 men took<br />
part in month-long men’s health fundraiser,<br />
and raised a total of $14,216.<br />
Other supported charities included Radio<br />
Lollipop, Breast Cancer WA, <strong>The</strong> Salvation<br />
Army, Heart Foundation, Legacy and<br />
Cystic Fibrosis.<br />
• Phase two of the new development review process<br />
includes the introduction of behaviours analysis.<br />
• A number of leadership skills pilot courses have<br />
been delivered to enable L&D to capture the<br />
essence of what is required for our future leaders.<br />
• Training records are being collated and recorded<br />
to provide a single information repository.<br />
• A PTA-specific procurement program.<br />
• Microsoft training is being processed following the<br />
new review MAP sessions.<br />
• A new undergraduate program is being introduced,<br />
providing people who join the PTA as vacation<br />
students a structure which can lead to the PTA<br />
graduate program.<br />
• Scoping and launching a special program to identify<br />
the critical safety training required for each role and<br />
the frequency with which such training should be<br />
conducted.<br />
<strong>The</strong> PTA RTO (registered training organisation)<br />
continues to monitor and improve its service offerings<br />
with internal audits and detailed analysis of evolving<br />
job requirements. This year there have been changes<br />
64 <strong>Public</strong> <strong>Transport</strong> <strong>Authority</strong> <strong>Annual</strong> <strong>Report</strong> <strong>2011</strong>-<strong>12</strong>
to several of our training qualification packages, which<br />
has resulted in a review and update of all training<br />
materials. Achievements include:<br />
• Three transit officer schools, involving 54 trainees<br />
• Continuation of the OHS supervisor courses –<br />
28 attendees<br />
• Review and implementation of the Transwa Journal,<br />
which led to the RTO scope being amended<br />
• RPL (recognition of prior learning) templates were<br />
compiled, enabling our overhead catenary staff to<br />
work towards competency requirements<br />
• Development of a structured program for trainee<br />
overhead catenary maintainers<br />
• Research and scope of available options to enable<br />
competency mapping of all signal technicians.<br />
Labour Relations<br />
<strong>The</strong> remuneration and employment conditions for<br />
PTA employees are governed by registered industrial<br />
agreements and, in the case of railcar drivers, an<br />
Enterprise Order. <strong>The</strong> Labour Relations branch has<br />
continued to undertake a key role in dispute resolution,<br />
policy development and strategic advice in relation to<br />
work reform matters.<br />
A process to review and standardise a range of<br />
employment conditions, practices and outstanding<br />
interpretation issues came out of the last round of<br />
negotiations – this will enable the PTA to enter into<br />
future industrial agreement negotiations from a<br />
clear base.<br />
Diversity<br />
<strong>The</strong> PTA continues to implement initiatives to<br />
meet its representation and distribution objectives<br />
for each diversity category in its Equity and<br />
Diversity Management Plan 2010-20<strong>12</strong>. Through a<br />
Reconciliation Action Plan, we continue to contribute<br />
to reconciliation by raising the organisational profile<br />
and awareness of indigenous issues to improve<br />
respect, relationships and opportunities for<br />
Indigenous Australians.<br />
<strong>The</strong> PTA also engages with the <strong>Public</strong> Sector<br />
Commission and Rocky Bay Employment Service<br />
to employ people with disabilities.<br />
Health and Lifestyle<br />
<strong>The</strong> PTA has a comprehensive health and lifestyle<br />
program for all employees. This concentrates on<br />
changing habits and educating employees to make<br />
healthy lifestyle choices. Components include<br />
good eating habits, food and health awareness,<br />
physical activity for employees and their families, and<br />
sponsorship of participation in community events.<br />
65
Executive<br />
profiles<br />
Reece Waldock<br />
Chief Executive Officer<br />
Mark Burgess<br />
Managing Director<br />
Reece has 26 years experience in strategic<br />
management with particular expertise in<br />
organisational reform. He held a number of senior<br />
executive roles within the Department of Commerce<br />
and Trade and Department of <strong>Transport</strong> from the<br />
early 1990s through to the end of 2000. Prior to<br />
his career with the WA public sector, Reece held<br />
a number of senior management roles with BHP.<br />
In December 2000, following the sale of the<br />
rail freight business of the <strong>Western</strong> Australian<br />
Government Railways Commission, Reece acted<br />
in the position of Commissioner of Railways. With<br />
the creation of the PTA on July 1, 2003 Reece<br />
was appointed as the inaugural CEO and oversaw<br />
the integration of all state-wide public transport<br />
services, together with a major construction<br />
program which included the Mandurah Railway.<br />
In May 2010 the State Government integrated<br />
WA’s three key transport agencies and Reece<br />
was appointed to head the <strong>Transport</strong> portfolio,<br />
consisting of the Department of <strong>Transport</strong>, Main<br />
Roads WA and the PTA. This has heralded a<br />
new direction for the portfolio of single point<br />
accountability, a whole of portfolio approach<br />
and ensuring we get the transport system right.<br />
Mark has gained extensive logistic, transport and<br />
people management skills through 21 years in<br />
the Army and 15 years in senior public transport<br />
management roles.<br />
He joined the PTA at its formation after six years<br />
when Transperth was within the Department<br />
of <strong>Transport</strong> and the Department for Planning<br />
and Infrastructure.<br />
As PTA’s Managing Director, Mark is responsible<br />
for the day to day operations of the PTA. Prior to<br />
moving to this position two years ago, Mark was<br />
Executive Director of the Transperth system –<br />
that is Perth’s integrated bus, train and ferry<br />
system – for <strong>12</strong> years.<br />
66 <strong>Public</strong> <strong>Transport</strong> <strong>Authority</strong> <strong>Annual</strong> <strong>Report</strong> <strong>2011</strong>-<strong>12</strong>
Pat Italiano<br />
General Manager<br />
Transperth Train Operations<br />
Pat is a qualified accountant and member of<br />
CPA Australia.<br />
During his 39-year career in public transport, Pat<br />
has acquired considerable expertise in business<br />
and strategic management, risk management,<br />
audit and, has extensive, operational experience<br />
within a fully-integrated urban passenger transit<br />
environment.<br />
Kim Stone<br />
General Manager<br />
Network and Infrastructure<br />
Kim joined the PTA in August 2004 as the General<br />
Manager of Transwa after a two year secondment<br />
in the Department for Planning and Infrastructure.<br />
He had previously been director of Coastal and<br />
Facilities Management in the Department of<br />
<strong>Transport</strong> for four years.<br />
Kim has worked in both the State and Federal<br />
Government arenas in addition to a number of<br />
roles in the private sector, including running his own<br />
management consulting business. His background<br />
is in engineering and management.<br />
In September 2009, Kim moved to the Network<br />
and Infrastructure Division as the General Manager<br />
and his responsibilities include the management<br />
and maintenance of the PTA railway network<br />
infrastructure, including controlling access by third<br />
parties under the Railways (Access) Act 1998 and<br />
ensuring the provision of Information Technology<br />
services to support PTA’s operations.<br />
Tim Woolerson<br />
General Manager Transwa<br />
Twenty-one years in the military has provided<br />
Tim with extensive logistics and management skills<br />
along with an Associate Diploma in Engineering<br />
Maintenance. Tim commenced work at the PTA<br />
seven years ago as the Transperth Fleet Manager<br />
after six years in the private sector working<br />
in the vehicle fleet management field.<br />
As general manager of Transwa, Tim is responsible<br />
for the delivery of a customer-focussed, safe<br />
and cost-effective transport services through the<br />
regional train and road coach network and for the<br />
maintenance of infrastructure and management of<br />
contracts associated with these services.<br />
67
Martin White<br />
Executive Director Transperth<br />
System, Regional and School Bus Services<br />
Kevin Kirk<br />
Executive Director<br />
Finance and Contracts<br />
David Browne<br />
Executive Director<br />
Safety and Strategic Development<br />
Martin joined the PTA in 2006. He was formerly<br />
General Manager of the Eastern Goldfields<br />
<strong>Transport</strong> Board (trading as TransGoldfields).<br />
Martin has 20 years’ experience in public transport,<br />
having previously worked in both the Department<br />
of <strong>Transport</strong> and the Department for Planning and<br />
Infrastructure. He is a qualified accountant and has<br />
a post-graduate qualification in management.<br />
He is responsible for managing, coordinating and<br />
marketing the Transperth system, comprising<br />
commercial bus contractors, a commercial ferry<br />
contractor and the urban passenger rail services.<br />
His role is also responsible for the management<br />
of Regional Town Bus Services and School Bus<br />
Services throughout <strong>Western</strong> Australia.<br />
Kevin has more than 35 years’ experience in public<br />
service and has held senior roles in Main Roads<br />
WA and the Department of <strong>Transport</strong>. He holds<br />
a Bachelor of Business (Accounting) degree and<br />
is a CPA and a fellow of the Institute of <strong>Public</strong><br />
Accountants. His professional interest is in the areas<br />
of financial management, business performance<br />
and procurement.<br />
Kevin is PTA’s Chief Finance Officer, responsible<br />
for maintaining PTA’s financial management and<br />
procurement systems and processes.<br />
David joined PTA predecessor WAGRC in<br />
December 2002 as a Policy Officer and has a<br />
Master of <strong>Transport</strong> Studies degree (UWA) as well<br />
as qualifications in policy and management. Before<br />
joining the PTA, David spent 20 years in the aviation<br />
industry including 15 years in the RAAF where he<br />
worked in a number of areas including strategic<br />
airspace management policy and planning.<br />
His role includes making the link between high-level<br />
policy and operations within the agency, managing<br />
a number of key projects, and driving strategic<br />
change in safety, policy development and business<br />
management.<br />
68 <strong>Public</strong> <strong>Transport</strong> <strong>Authority</strong> <strong>Annual</strong> <strong>Report</strong> <strong>2011</strong>-<strong>12</strong>
Brian Appleby<br />
Executive Director People<br />
and Organisational Development<br />
Hugh Smith<br />
Executive Director Strategic<br />
Asset Management and Development<br />
Ross Hamilton<br />
Executive Director<br />
Major Projects<br />
Brian brings to the organisation more than 24 years’<br />
experience in Labour Relations, human resource<br />
management, workforce services and learning<br />
and development. After beginning his career in the<br />
private sector, Brian has undertaken a range of roles<br />
as an operative, operational manager and director in<br />
key public sector agencies and central government<br />
departments. He holds a post-graduate qualification<br />
in Industrial Relations and is a former Australian<br />
Army Reserve officer. He is a board member of<br />
the Logistics Training Council and a member of<br />
the Australasian Railways Workforce Development<br />
Committee.<br />
Along with his responsibility for strategic people<br />
management, Brian oversees the delivery of<br />
functional human resource services for the PTA’s<br />
people. He commenced his appointment in<br />
February 2008.<br />
Hugh launched his engineering career at British<br />
Steel in the United Kingdom and joined WAGRC<br />
in 1972 as an assistant engineer at the Midland<br />
Workshops, where he subsequently held senior<br />
management positions in design and production.<br />
He was appointed General Manager of the Urban<br />
Passenger Division in 1994.<br />
In this role he was responsible for developing<br />
strategies for customer focus, reliability of services<br />
and improved OTR of trains. Following the sale<br />
of WAGR’s freight business in December 2000,<br />
Hugh was appointed General Manager, N&I in an<br />
organisation focused exclusively on passenger<br />
transport and customer service<br />
In October 2010 Hugh took on the role of Executive<br />
Director Strategic Asset Management Development<br />
responsible for the implementation of policies,<br />
strategies and actions for the effective asset<br />
management of PTA assets.<br />
Ross has worked for Westrail and the PTA for<br />
25 years in various roles including Construction,<br />
Planning Land Rationalisation and Maintenance.<br />
With the inception of the PTA he worked as the<br />
Manager Track and Civil Infrastructure and then<br />
took over the construction of the Mandurah railway<br />
through the critical commissioning phase for the<br />
commencement of services in December 2007.<br />
Ross is responsible for the delivery of major projects<br />
for the PTA and is currently working on the Perth<br />
City Link project and the extension to the Northern<br />
Suburbs Railway from Clarkson to Butler.<br />
69
Peter Martinovich<br />
Executive Director Infrastructure<br />
Planning and Land Services<br />
David Hynes<br />
Manager Corporate<br />
Communications<br />
Peter began his railway career with WAGR as a<br />
junior clerk in 1964 and graduated as an engineer<br />
in Westrail’s Civil Engineering branch in 1974.<br />
He returned to this branch after a two-year<br />
secondment with the Australian Railways Research<br />
and Development Organisation in Melbourne in the<br />
early 80s. In 1987, he was appointed Maintenance<br />
Engineer in the Civil Branch. After serving in the<br />
position of Planning Engineer Northern Suburbs<br />
Railway, Peter rose to the position of Principal<br />
Engineer Planning and Permanent Way before<br />
transferring to the Department of <strong>Transport</strong> in 1995.<br />
He became Manager, Transit Planning with the<br />
Department of <strong>Transport</strong> in 1995, and set up<br />
and led the team which developed the South<br />
West Metropolitan Railway and Northern Suburbs<br />
Extension Master Plans. He was appointed Deputy<br />
Project Director of New MetroRail in 2003. After<br />
completion of the NMR Project in 2007, he was<br />
appointed Director of Railway and Infrastructure<br />
Planning within the PTA’s Network and<br />
Infrastructure Division.<br />
David brought a wealth of communications<br />
experience to the PTA (then WAGRC) when he<br />
joined the organisation in 2003 and has been<br />
a significant contributor to its communications<br />
activities, especially media relations, since then.<br />
Immediately prior to his appointment he had been<br />
working as a government media adviser to a senior<br />
Cabinet Minister.<br />
He had previously worked as a freelance journalist,<br />
writing for a range of national and international<br />
publications, and run his own public relations<br />
consultancy, providing high-level strategic advice<br />
to a big number of clients. This followed a<br />
20-year career at WA Newspapers working on<br />
the Daily News, Weekend News and Countryman,<br />
culminating in a three-year stint as Business and<br />
Finance Editor of <strong>The</strong> West Australian.<br />
In 2009, he was appointed Executive Director<br />
of the newly-formed Infrastructure Planning and<br />
Land Services Division.<br />
70 <strong>Public</strong> <strong>Transport</strong> <strong>Authority</strong> <strong>Annual</strong> <strong>Report</strong> <strong>2011</strong>-<strong>12</strong>
PTA in the Community<br />
<strong>The</strong> PTA’s Urban Art Project reduces instances<br />
of graffiti by using respected urban artists to<br />
create artworks around the railway network.<br />
<strong>The</strong> initiative is supported by other anti-graffiti<br />
strategies such as rapid removal of painted<br />
areas, use of graffiti-resistant materials and<br />
education through the PTA’s Right Track<br />
program.<br />
71
Compliance,<br />
audits and<br />
reporting<br />
<strong>The</strong> annual Rail Safety Compliance Audit was conducted by the<br />
Office of Rail Safety (ORS) in November <strong>2011</strong>, and the report issued<br />
in January. <strong>The</strong> audit identified three non-compliances and six<br />
observations. All issues identified during the audit were closed<br />
out in April 20<strong>12</strong>.<br />
Throughout <strong>2011</strong>-<strong>12</strong>, health and safety representatives<br />
in each operating division continued to conduct<br />
regular workplace inspections, in accordance with the<br />
Occupational Safety and Health (OSH) Act (1984).<br />
A comprehensive quarterly health, safety and<br />
environment (HSE) performance report is provided to<br />
the PTA’s Executive HSE Management Committee.<br />
<strong>The</strong> committee meets to discuss the report and to<br />
identify potential strategies for continuous safety<br />
improvement.<br />
<strong>The</strong> PTA also prepares an annual rail safety<br />
performance report which is submitted to the ORS<br />
as part of rail accreditation requirements.<br />
Notifiable occurrences<br />
Under the Rail Safety Act (2010), certain railway<br />
safety incidents must be reported to the ORS. <strong>The</strong>se<br />
“Notifiable Occurrences” are defined in the Rail Safety<br />
Regulations (<strong>2011</strong>) as Category A (serious injury, death,<br />
or significant damage) or Category B (incidents that<br />
may have the potential to cause a serious accident).<br />
<strong>The</strong>y do not cover non-rail operations. <strong>The</strong> benchmark<br />
targets for Category A and Category B incidents are<br />
calculated using estimates of passenger boardings and<br />
train kilometres travelled. <strong>The</strong>re were 15 Category A<br />
incidents in <strong>2011</strong>-<strong>12</strong>, up from 11 in 2010-11.<br />
Excluding incidents beyond the PTA’s control (such as<br />
those considered to be suicides or attempted suicides),<br />
it is encouraging that there was a drop, from eight in<br />
2010-11 to six, and no adverse trends were identified.<br />
In March <strong>2011</strong>, the PTA, in conjunction with the Office<br />
of the Chief Psychiatrist (Department of Health),<br />
examined the characteristics and patterns of suicide<br />
events on the rail system with a view to developing<br />
effective intervention-prevention measures.<br />
A report was submitted with the dataset from the<br />
Health Department’s Data Linkage Branch, (which is<br />
also linked to the Hospital Morbidity, Mental Health<br />
and Death databases), and will be analysed by PTA to<br />
develop a plan with the supporting services to reduce<br />
the risk of suicide incidents on PTA’s railway network.<br />
In another commitment to improving rail safety, the<br />
PTA engaged Curtin-Monash Accident Research<br />
Centre (C-MARC) in May to conduct a study on<br />
non-compliance at PTA pedestrian level crossing gates.<br />
72 <strong>Public</strong> <strong>Transport</strong> <strong>Authority</strong> <strong>Annual</strong> <strong>Report</strong> <strong>2011</strong>-<strong>12</strong>
C-MARC provided a report in August <strong>2011</strong>.<br />
A workshop by the researchers and representatives<br />
of the PTA addressed the findings, and strategies were<br />
developed to further reduce the risk of pedestrian<br />
behaviour and compliance at rail-road level crossings,<br />
including infrastructure countermeasures and safety<br />
campaigns.<br />
Category B incidents rose 15 per cent from<br />
2010-11’s 392, to 450. This was attributed to a<br />
review of Notifiable Occurrences against the Rail<br />
Safety Regulation (<strong>2011</strong>) where additional reporting<br />
requirements were identified for compliance.<br />
Health and safety<br />
<strong>The</strong> PTA’s Health and Safety Policy describes the<br />
overarching framework for the management of injuries<br />
and safety and health throughout the organisation.<br />
Commitment to this policy is shown by the signature<br />
of the policy owner, the Chief Executive Officer.<br />
PTA continued to enhance the understanding of safety<br />
management across the organisation through initiatives<br />
which included rollout of the Manager and Supervisor<br />
Safety Responsibility Training program, further<br />
development of the Keeping Rail on Track Safety<br />
Culture Project and continued progress of the Train<br />
Driver Workload Fatigue Study.<br />
It is now mandatory for all managers and supervisors<br />
to attend an accredited safety responsibility training<br />
program. Upon successful completion of the program<br />
the participants will have achieved five units of a Cert<br />
IV in Occupational Health and Safety and support is<br />
provided to complete the full qualification.<br />
Consultation with employees regarding health and<br />
safety matters is evidenced by the HSE Committee<br />
Procedure. <strong>The</strong> purpose of the Committee is to<br />
focus upon directing and communicating workplace<br />
health, safety and environmental activities by positively<br />
influencing cultural change, as is necessary for the PTA<br />
to achieve its management and corporate governance<br />
objectives. <strong>The</strong> frequency and outcomes from these<br />
committee meetings is reported to the Executive HSE<br />
Committee every quarter.<br />
During the year, the PTA continued its focus on Fatigue<br />
Management and in order to support an increased<br />
understanding of fatigue across the organisation, held<br />
a series of Fatigue Masterclass run by Professor Drew<br />
Dawson from the Central Queensland University for<br />
Sleep Research. <strong>The</strong>se Masterclasses have provided<br />
an opportunity for employees, including managers,<br />
safety representatives and operational employees,<br />
to gain knowledge of the most recent research and<br />
technology available for the management of fatigue.<br />
<strong>The</strong> PTA is introducing railway level crossing<br />
improvements with built-in safety features including<br />
consistent signage definitions and outlines through<br />
painting and the use of high-visibility material. This<br />
will improve the interface between vehicles using<br />
the crossing and train movements with an expected<br />
reduction in near-miss incidents.<br />
<strong>The</strong> PTA is trialing a standardised pedestrian-crossings<br />
model with inbuilt safety features including consistent<br />
signage, clearly-designated routes, and layouts to<br />
reduce pedestrian confusion.<br />
73
To ensure continuous improvement in our program<br />
of reinforcing a positive safety culture, the PTA has<br />
completed a survey of staff views about our current<br />
safety culture, and identify areas for review and<br />
improvement. <strong>The</strong> outcomes of this survey were<br />
reviewed at a strategic safety planning day and will<br />
form the cornerstone of further reform across the<br />
organisation.<br />
<strong>The</strong> PTA has also introduced proactive initiatives<br />
to promote safety and value its people (EG a flu<br />
vaccination program and mole check clinics).<br />
Integrated HSE management system<br />
Safety and Strategy continued to monitor and<br />
review the Health, Safety and Environment system<br />
through a comprehensive strategic audit program.<br />
This is supported by the divisional audit programs<br />
using AS4801, which ensure that all aspects, from<br />
local hazard control measures to the overarching<br />
organisational HSE strategy, are working effectively<br />
to identify areas for continuous improvement. This is<br />
evidenced by the HSE Compliance Matrix. Identified<br />
corrective actions are tracked and regularly monitored<br />
through the PTA’s STAR <strong>Report</strong>ing System.<br />
Improved access to safety procedures has now been<br />
achieved by the introduction of a Safety Hub hot key<br />
on the safety tab of the intranet home page which<br />
provides quick access to safety procedures and links.<br />
<strong>The</strong> PTA’s safety management system also extends<br />
to our direct contractor stakeholders who contribute<br />
significantly to our overall service delivery provision.<br />
This ensures that our contractors understand PTA<br />
safety management requirements, and reinforces the<br />
organisation’s overall commitment to safety.<br />
74 <strong>Public</strong> <strong>Transport</strong> <strong>Authority</strong> <strong>Annual</strong> <strong>Report</strong> <strong>2011</strong>-<strong>12</strong><br />
School Bus Service contracts are held by a wide variety<br />
of individuals and companies with varying degrees of<br />
safety expertise and competence. Through auditing<br />
and a close working relationship with contractors,<br />
we identified the need to help the industry achieve<br />
safety competence by creating Safety Management<br />
Plan documentation that can be adapted to meet the<br />
demands of any contractor.<br />
<strong>The</strong> associated guidance notes contain a selfassessment<br />
checklist to enable the contractor to<br />
perform a gap analysis, identifying where they are now,<br />
where they need to be and how to get there. Example<br />
forms for topics such as hazard reporting and risk<br />
assessments are provided, and hyperlinks to safety<br />
legislation and helpful websites are included throughout<br />
the document.<br />
Rail safety accreditation<br />
A number of workshops were held to ensure our<br />
personnel stay focussed on rail safety management<br />
changes:<br />
• Human factors workshops recognise the inevitability<br />
of human error and encourage honest reporting,<br />
while establishing clear accountability for remedial<br />
actions.<br />
• A driver workload/fatigue study is being carried out<br />
by the Centre for Sleep Research at the University<br />
of South Australia to assess potential workload<br />
and fatigue management issues among railcar<br />
drivers. A number of workshops have been held<br />
to communicate information regarding this study.<br />
• Workshops were also held with ORS officers to<br />
develop a Memorandum of Understanding on<br />
reporting Notifiable Occurrences.<br />
• Two Fatigue Master Classes were held under<br />
the guidance of Professor Drew Dawson, an<br />
acknowledged fatigue expert, to help the PTA’s<br />
operational divisions reinforce the shift/roster<br />
organisational arrangements, to reduce the risk<br />
of fatigue.<br />
<strong>Report</strong>ing systems<br />
<strong>The</strong> STAR <strong>Report</strong>ing System enables the efficient<br />
reporting, storage and analysis of hazards, nearmisses,<br />
incidents, injuries and Workers’ Compensation<br />
claim data.<br />
<strong>The</strong> PTA’s rail safety reporting system, IFRIS, enables<br />
the reporting and storage of rail-related incidents,<br />
in particular, Notifiable Occurrences. This system is<br />
compliant with national reporting requirements defined<br />
in ONS-1(WA) 2008 and is updated as required.<br />
<strong>The</strong> information collated by PTA’s reporting systems<br />
is used to identify trends which may indicate where<br />
corrective actions and other improvements may be<br />
required. A report consisting of lead and lag indicators<br />
for the organisation as a whole, as well as individual<br />
divisions, is tabled at a quarterly meeting of the<br />
Executive HSE management committee. Summaries<br />
of the key outcomes of this report are regularly<br />
communicated through the PTA intranet.<br />
A recent improvement to the report is the introduction<br />
of an action register for investigation outcomes.<br />
<strong>The</strong> register lists actions against specific managers<br />
and includes deadlines for completion thereby<br />
monitoring performance against corporate KPIs.<br />
Further improvement to this divisional reporting process<br />
has continued throughout the year with new reporting<br />
parameters including traffic infringements and security<br />
incidents being reported and analysed for trends.
Injury management<br />
Injury prevention and injury management continue<br />
to be a focus for the PTA. We met the 10 per cent<br />
improvement target for the LTI (lost-time injury) rate<br />
in <strong>2011</strong>-<strong>12</strong>, recording 4.65, down 29 per cent from<br />
2010-11. While there were no fatalities among PTA<br />
employees, an employee under contractor control<br />
was fatally injured at the Perth City Link project.<br />
Analysis identified that transit officers have the highest<br />
incidence of LTIs – the rate in this workgroup dropped<br />
from 16.88 in 2010-11, to 8.94.<br />
Employees who are injured are supported by the<br />
PTA’s injury management team in accordance with the<br />
Workers’ Compensation and Injury Management Act<br />
(1981). <strong>The</strong> PTA’s injury management system works<br />
on the principle of early intervention/rehabilitation<br />
and includes return-to-work programs developed in<br />
accordance with the Act.<br />
Return-to-work programs are provided to all injured<br />
employees who are deemed fit to do light duties<br />
to support their timely return to their pre-injury role.<br />
Despite the reduction in LTI numbers this year,<br />
the LTI severity rate increased 14.7 per cent from<br />
26.04 in 2010-11, to 29.89. Of the closed Worker’s<br />
Compensation claims, 91 per cent were closed within<br />
26 weeks.<br />
Indicator Results Target <strong>2011</strong>-20<strong>12</strong><br />
Number of fatalities Zero (0) Zero (0)<br />
Lost time injury/disease (LTI/D) incidence rate<br />
Note: LTI/D (Lost time duration)<br />
39.69<br />
(43%<br />
improvement)<br />
Lost time injury severity rate 29.89<br />
(47%<br />
improvement)<br />
Percentage of injured workers returned to work within (i)<br />
13 weeks and (ii) 26 weeks<br />
Percentage of managers and supervisors trained in<br />
occupational safety, health and injury management<br />
responsibilities.<br />
Health assessment standards<br />
During the year, the PTA, in conjunction with our health<br />
assessment provider, undertook a review of the draft<br />
updated national road health assessment standards<br />
to assess their potential impact on the PTA. <strong>The</strong> rail<br />
health assessment standards are due for release later<br />
this year and will also be reviewed by the PTA. <strong>The</strong><br />
PTA will continue to monitor the outcomes of these<br />
draft standards and, when they are finalised, will work<br />
in conjunction with our health provider to ensure PTA<br />
processes are compliant.<br />
Zero (0) or 10% improvement on<br />
the previous three (3) years.<br />
Zero (0) or 10% improvement on<br />
the previous three (3) years.<br />
(i) 39% (ii) 91% Greater than or equal to 80%<br />
return to work within 26 weeks.<br />
28% Greater than or equal to 80%.<br />
Testing for drugs and alcohol<br />
As part of the PTA’s focus on continuous improvement<br />
of our testing methodology, we continued random<br />
and blanket drug and alcohol testing during the year<br />
to support our existing drug and alcohol management<br />
program. We also introduced proactive testing for<br />
synthetic cannabinoids, into the testing regime.<br />
No illicit positive results were recorded for post-incident<br />
tests. Of the 234 random tests, six positive results<br />
due to illicit substances were recorded. Five of the<br />
illicit positives were for PTA employees; one was for<br />
a contractor. One test result for a transit officer was<br />
recorded as positive for synthetic cannabinoids.<br />
75
Sustainability<br />
<strong>The</strong> PTA continues to work with relevant external<br />
parties to identify opportunities to maximise<br />
sustainability during the development and planning<br />
of transport services. In the latest year this included:<br />
• Transit Oriented Developments (TODs).<br />
• Integration of infrastructure for pedestrians and<br />
cyclists.<br />
• Protection and restoration of local air, water, soils,<br />
flora and fauna.<br />
• Services to improve accessibility for people with<br />
disabilities.<br />
During the year we:<br />
• Continued to implement the PTA water efficiency<br />
management plan.<br />
• Continued to implement the recommendations of<br />
the 2006 energy and water audits of the <strong>Public</strong><br />
<strong>Transport</strong> Centre.<br />
• Undertook energy audits of Cockburn Central<br />
Station and the Kewdale and Claisebrook depots.<br />
• Continued using recycled water and reverse<br />
osmosis to wash railcars.<br />
• Continued implementation of the Energy Efficiency<br />
Opportunities Program including the completion of<br />
the energy assessment of Transperth buses.<br />
• Reviewed and updated the online greenhouse gas<br />
savings calculator, which uses travel information<br />
(including the car size and distance travelled) to<br />
calculate a passenger’s greenhouse gas savings.<br />
• Continued implementation of the environmental<br />
induction program for PTA staff.<br />
• Submitted our Greenhouse and Energy <strong>Report</strong> to<br />
the Department of Climate Change.<br />
Disability Access and Inclusion<br />
Plan (DAIP)<br />
<strong>The</strong> PTA continued to improve access to public<br />
transport for people with disabilities, working through<br />
the 2007-20<strong>12</strong> DAIP, which was released in July 2007.<br />
Achievements included:<br />
• Continued implementation of a <strong>12</strong>-year program<br />
to progressively replace the existing fleet with new,<br />
low-floor, accessible buses.<br />
• Progressively increasing the number of accessible<br />
bus services.<br />
• Continued recognition of companion cards to<br />
allow a companion to travel with a person with a<br />
permanent disability at no additional cost.<br />
• Continued administration of the Bus Shelters Grant<br />
Scheme, which provides dollar-for-dollar funding to<br />
local councils and schools for the construction of<br />
accessible shelters at selected bus stops.<br />
• Continued administration of the Accessible<br />
Pathways Grant Scheme, which provides dollar-fordollar<br />
funding to local councils for the construction<br />
of accessible pathways at selected bus stops.<br />
• Developing and managing an accessibility group<br />
via TravelEasy as a mechanism to disseminate<br />
disability-specific updates to relevant organisations.<br />
• Completing the planning and design phase for the<br />
upgrade of Meltham and Queens Park stations, with<br />
work expected to start early in <strong>2011</strong>-<strong>12</strong>.<br />
• Establishing a cross-referencing process to allow<br />
a PTA infringement notice to be revoked if it has<br />
been issued to a customer who is a Transperth<br />
Unrestricted Travel Pass holder, but was not<br />
carrying the pass.<br />
• Upgrading approximately 50 bus stops to meet<br />
the requirements of the Disability Standards<br />
for Accessible <strong>Public</strong> <strong>Transport</strong> under the<br />
Government’s Bus Stop Accessibility Works<br />
Program, launched in January 2010, which funds<br />
the upgrade of up to 600 stops a year.<br />
• Issuing Accessibility Bulletins to customers<br />
registered with the Transperth Accessibility Group<br />
to advise of system changes, upgrades and other<br />
Transperth news relating to accessibility issues.<br />
• Delivering 37 in-class presentations and station<br />
tour experiences through the school-based Get On<br />
Board program for Education Support students.<br />
<strong>The</strong> program continues to work with disability<br />
organisations to deliver information and training<br />
at both the staff and client level. Train-the-trainer<br />
sessions have been delivered to organisations<br />
including Intework and Activ to provide the skills<br />
and knowledge necessary to take clients on the<br />
Transperth network and teach them how to become<br />
safe and confident travellers.<br />
• Posting new station information on the Transperth<br />
website. This includes detailed maps of all bus/<br />
train interchanges and train stations highlighting<br />
accessible pathways into and around each facility.<br />
Each map includes a summary of such key features<br />
as ACROD parking bays, ticket machines and<br />
toilets (including disabled toilets).<br />
76 <strong>Public</strong> <strong>Transport</strong> <strong>Authority</strong> <strong>Annual</strong> <strong>Report</strong> <strong>2011</strong>-<strong>12</strong>
Risk management<br />
<strong>The</strong> PTA has a comprehensive risk management<br />
strategy to manage strategic and operational risks.<br />
<strong>The</strong> PTA’s Risk Register is reviewed annually to<br />
ensure that identified corrective actions are reviewed<br />
and monitored regularly. In <strong>2011</strong>-<strong>12</strong> a combination<br />
of internal and external audits validated compliance<br />
with the Risk Management framework and identified<br />
opportunities for improvement.<br />
Record-keeping<br />
<strong>The</strong> PTA continued to improve business recordkeeping<br />
processes and procedures in <strong>2011</strong>-<strong>12</strong>.<br />
A Document Management System (DMS) package<br />
was progressively implemented in <strong>2011</strong> and is now<br />
operational in all divisions. System management<br />
procedures and business rules, a training program<br />
and ongoing support processes are well established.<br />
<strong>The</strong> PTA’s record-keeping efficiency has been improved<br />
with the revision of our business classification scheme.<br />
<strong>The</strong> functional retention and disposal schedule has also<br />
been revised and is awaiting endorsement by the State<br />
Records Advisory Committee.<br />
Pricing policy<br />
Government continued to maintain public transport<br />
fares at an affordable level by restricting the increase<br />
in Transperth standard fares to the projected rate of<br />
increase in CPI of 3.0 per cent. In accordance with<br />
government policy, concession fares were set at<br />
40 per cent of standard fares and the student fare<br />
was left unchanged.<br />
Transwa fares are established by Government to<br />
ensure affordability for regional West Australians.<br />
For the <strong>2011</strong>-<strong>12</strong> financial year, Transwa fare increases<br />
were restricted to the projected rate of increase in CPI,<br />
though the increase in Prospector fares was offset by<br />
a three per cent reduction resulting from the phased<br />
abolition of a fare loading previously applied to this<br />
service.<br />
Transperth fare information is provided at<br />
www.transperth.wa.gov.au<br />
Transwa fare information is provided at<br />
www.transwa.wa.gov.au<br />
Records management functions continue to be<br />
improved as a result of internal auditing, quality<br />
assurance monitoring and record-keeping best<br />
practice. <strong>The</strong> online Record-keeping Awareness course<br />
reflects current operational and administrative practices<br />
and processes.<br />
To improve the management of records created for<br />
major infrastructure projects, the DMS has been<br />
integrated with an online project management system<br />
accessible to all project stakeholders.<br />
77
78 <strong>Public</strong> <strong>Transport</strong> <strong>Authority</strong> <strong>Annual</strong> <strong>Report</strong> <strong>2011</strong>-<strong>12</strong><br />
<strong>The</strong> B-Series suburban railcars<br />
use re-generative brakes to improve<br />
energy efficiency by more than<br />
20 per cent.
Compliance statements<br />
Statement of compliance with<br />
<strong>Public</strong> Sector Standards<br />
PTA’s human resource management policies and<br />
practices are subject to ongoing review and, in<br />
accordance with section 31 (1) of the <strong>Public</strong> Sector<br />
Management Act 1994, comply fully with the <strong>Public</strong><br />
Sector standards in Human Resource Management.<br />
Statement of compliance with relevant written law<br />
Enabling legislation<br />
<strong>The</strong> PTA is established under the <strong>Public</strong> <strong>Transport</strong> <strong>Authority</strong> Act 2003, an Act to establish a State agency<br />
responsible for providing public passenger transport services anywhere in the State and performing functions<br />
under other Acts, including the Rail Freight System Act 2000 and the Government Railways Act 1904 as well as<br />
the construction of railways under various railway enabling Acts. Currently the Minister responsible for the PTA is<br />
the Minister for <strong>Transport</strong>.<br />
Legislation impacting on the PTA’s activities<br />
In the performance of its functions, the PTA complies with all relevant written laws of <strong>Western</strong> Australia and, where<br />
required, reports on an annual basis in accordance with the following key legislation:<br />
Financial Management Act 2006; Electoral Act 1907; Equal Opportunity Act 1984; State Superannuation<br />
Act 2000; Heritage of <strong>Western</strong> Australia Act 1990; Freedom of Information Act 1992; State Supply Commission<br />
Act 1991; <strong>Public</strong> Sector Management Act 1994; Disability Services Act 1993 (Cth); Rail Safety Act 2010;<br />
Railways (Access) Act 1998; State Trading Concerns Act 1916; Occupational Safety & Health Act 1984,<br />
Environmental Protection Act 1986, and <strong>Public</strong> Interest Disclosure Act 2003.<br />
Other various Agreements/Acts and written laws impact on the PTA’s activities from time to time.<br />
In the financial administration of the PTA, we have complied with the requirements of the Financial Management<br />
Act 2006. We have also complied with every other relevant written law and exercised controls to provide<br />
reasonable assurance that the receipt and expenditure of moneys, the acquisition and disposal of public<br />
property and the incurring of liabilities have been in accordance with legislative provisions.<br />
At the date of signing we are not aware of any circumstances which would render the particulars included in this<br />
statement misleading or inaccurate.<br />
Reece Waldock<br />
Kevin Kirk<br />
Accountable <strong>Authority</strong> Chief Finance Officer<br />
13 September 20<strong>12</strong> 13 September 20<strong>12</strong><br />
79
Service and<br />
financial<br />
achievements<br />
During the financial year <strong>2011</strong>-<strong>12</strong>, the PTA has delivered public<br />
transport services to the people of <strong>Western</strong> Australia worth<br />
$1,076.7 million. <strong>The</strong> graph below shows how these funds were<br />
spent across each service. Refer to the individual sections of<br />
Review of Performance by mode for further details on expenditure<br />
by services. Total revenue and funding received during the year<br />
amounted to $1,014.3 million.<br />
Expenditure by Service Total Expenditure by Type Revenue and Funding Sources<br />
2% 4%<br />
10%<br />
10%<br />
<strong>12</strong>%<br />
19%<br />
4%<br />
37% 10%<br />
25%<br />
24%<br />
77%<br />
37%<br />
Transperth Metropolitan Bus and Ferry Operations<br />
Transperth Train Operations<br />
Regional Bus Operations<br />
Country Passenger Rail and Road Coach Services<br />
Regional School Bus Services<br />
Rail Corridor and Residual Freight Issues<br />
6%<br />
23%<br />
Employee benefits expense<br />
Supplies, services and utilities<br />
Depreciation and amortisation<br />
Borrowing expenses<br />
Bus, ferry and regional bus operators<br />
School bus operators<br />
State<br />
User charges and fees<br />
Other income<br />
80 <strong>Public</strong> <strong>Transport</strong> <strong>Authority</strong> <strong>Annual</strong> <strong>Report</strong> <strong>2011</strong>-<strong>12</strong>
Financial Targets: Actuals compared to budget targets<br />
<strong>The</strong> following table provides a comparison of the financial targets and outcomes against criteria included in the Resource Agreement between<br />
the Chief Executive Officer, Minister for <strong>Transport</strong> and the Treasurer.<br />
<strong>2011</strong>-<strong>12</strong> Target <strong>2011</strong>-<strong>12</strong> Actual Variation<br />
$000 $000 $000<br />
Total cost of services 1,097,519 1,076,687 20,832 Note 1<br />
Net cost of services 897,577 843,463 54,114 Note 2<br />
Total Equity 4,649,690 4,748,089 ( 98,399) Note 3<br />
Net increase/(decrease) in cash held (4,199) (13,130) (8,931) Note 4<br />
Number of FTE’s Number of FTE’s Number of FTE’s<br />
Approved full time equivalent 1,474 1,459 15 Note 5<br />
Notes:<br />
(1) Total Cost of Services<br />
<strong>The</strong> decrease is mainly due to a reduction in<br />
borrowing costs following an interest rate review<br />
($16.6 million).<br />
(2) Net Cost of Services<br />
<strong>The</strong> variation is primarily due to a reduction in<br />
expenses (see Note 1) and an increase in revenue.<br />
(3) Total Equity<br />
<strong>The</strong> variation is mainly due to an increase in<br />
non-current assets.<br />
(4) Net Decrease in Cash Held<br />
<strong>The</strong> net decrease is mainly due to the advancement<br />
of expenditure on capital projects offset by<br />
increased provisions for contaminated sites<br />
and workers compensation.<br />
(5) Approved Full Time Equivalent<br />
<strong>The</strong> variation to the approved FTE staff level is<br />
mainly due to lower than anticipated recruitment<br />
of transit officers. Train security was maintained<br />
by use of CCTV and contracted security services.<br />
82 <strong>Public</strong> <strong>Transport</strong> <strong>Authority</strong> <strong>Annual</strong> <strong>Report</strong> <strong>2011</strong>-<strong>12</strong>
Summary of Key Performance Indicators: Actual compared to budget targets<br />
Outcome: Accessible, Reliable and Safe <strong>Public</strong> <strong>Transport</strong> System.<br />
Key Effectiveness Indicators<br />
Use of public transport – passengers per service kilometre:<br />
<strong>2011</strong>-<strong>12</strong><br />
Target<br />
<strong>2011</strong>-<strong>12</strong><br />
Actual<br />
Variation<br />
• metropolitan bus services 1.38 1.39 0.01<br />
• metropolitan train services 4.09 4.21 0.<strong>12</strong><br />
• metropolitan ferry services 13.88 13.68 (0.20)<br />
• regional bus services 0.852 0.818 (0.034)<br />
• country passenger rail services 0.23 0.239 0.009<br />
• country passenger road coach services 0.07 0.066 (0.004)<br />
Accessible <strong>Public</strong> <strong>Transport</strong>:<br />
<strong>The</strong> proportion of street addresses within the Perth <strong>Public</strong> <strong>Transport</strong> Area which are<br />
within 500 metres of a Transperth stop providing an acceptable level of service<br />
83.50% 84.56% 1.06%<br />
Metropolitan and regional passenger services reliability:<br />
• bus services within four minutes of scheduled time 85.0% 79.08% (5.92%)<br />
• train arriving within four minutes of scheduled time 95.0% 94.59% (0.41%)<br />
• ferries arriving within three minutes of scheduled time 98.0% 96.67% (1.33%)<br />
83
<strong>2011</strong>-<strong>12</strong><br />
Target<br />
<strong>2011</strong>-<strong>12</strong><br />
Actual<br />
Variation<br />
Country passenger rail and road coach services reliability:<br />
• Prospector arriving within 15 minutes of scheduled time (a) 90% 77% (13%)<br />
• Australind arriving within 10 minutes of scheduled time 90% 89% (1%)<br />
• MerredinLink arriving within 10 minutes of scheduled time 95% 94% (1%)<br />
• AvonLink arriving within 10 minutes of scheduled time 95% 99% 4%<br />
• Road coaches arriving within 10 minutes of scheduled time 95% 97% 2%<br />
Regional school bus services reliability:<br />
• drop off no less than 10 minutes before the school starts and pick up<br />
within 10 minutes of school ending<br />
97% 99% 2%<br />
Level of overall customer satisfaction – customer satisfaction index:<br />
• metropolitan bus services 83% 83% 0%<br />
• metropolitan train services 92% 89% (3%)<br />
• metropolitan ferry services 98% 95% (3%)<br />
• country passenger rail and road coach services 92% 90% (2%)<br />
84 <strong>Public</strong> <strong>Transport</strong> <strong>Authority</strong> <strong>Annual</strong> <strong>Report</strong> <strong>2011</strong>-<strong>12</strong>
<strong>2011</strong>-<strong>12</strong><br />
Target<br />
<strong>2011</strong>-<strong>12</strong><br />
Actual<br />
Variation<br />
Customer perception of safety – independent external surveys:<br />
• train station – daytime 96% 98% 2%<br />
• on-board train – daytime 97% 99% 2%<br />
• train station – night-time 65% 68% 3%<br />
• on-board train – night-time 75% 72% (3%)<br />
• bus station – daytime 96% 97% 1%<br />
• on-board bus – daytime 98% 99% 1%<br />
• bus station – night-time 70% 72% 2%<br />
• on-board bus – night-time 82% 79% (3%)<br />
Level of notifiable safety occurrences – notifiable occurrences:<br />
• Category A: occurrences per million passenger boardings 0.25 0.24 (0.01)<br />
• Category A: occurrences per million train kilometres 0.90 0.90 0.00<br />
• Category B: occurrences per million passenger boardings (b) 8.10 7.11 (0.99)<br />
• Category B: occurrences per million train kilometres (b) 29.52 27.11 (2.41)<br />
• Regional school bus services: notifiable occurrences (accidents) reported each<br />
school year (c)<br />
13 22 9<br />
85
<strong>2011</strong>-<strong>12</strong><br />
Target<br />
<strong>2011</strong>-<strong>12</strong><br />
Actual<br />
Variation<br />
Outcome: Protection of the long-term functionality of the rail corridor and<br />
railway infrastructure:<br />
• Number of lease breaches Nil Nil Nil<br />
Key Efficiency Indicators<br />
Service 1: Metropolitan and Regional Passenger Services<br />
Average cost per passenger kilometre<br />
• Transperth bus operations $0.88 $0.85 ($0.03)<br />
• Transperth train operations $0.43 $0.40 ($0.03)<br />
• Transperth ferry operations $1.11 $1.22 $0.11<br />
Average cost per 1,000 place kilometres<br />
• Regional bus services $79.23 $85.95 $6.72<br />
Total passenger place kilometres (millions)<br />
• Regional bus services 190.30 198.30 8.00<br />
86 <strong>Public</strong> <strong>Transport</strong> <strong>Authority</strong> <strong>Annual</strong> <strong>Report</strong> <strong>2011</strong>-<strong>12</strong>
<strong>2011</strong>-<strong>12</strong><br />
Target<br />
<strong>2011</strong>-<strong>12</strong><br />
Actual<br />
Variation<br />
Service 2: Country Passenger Rail and Road Coach Services<br />
Average cost per passenger kilometre<br />
• Transwa rail (d) $0.46 $0.40 ($0.06)<br />
• Transwa road coaches $0.22 $0.22 $0.00<br />
Service 3: Regional School Bus Services<br />
Average cost per contracted kilometre: School bus services $3.80 $3.63 ($0.17)<br />
Service 4: Rail Corridor and Residual Freight Issues<br />
Total cost of managing the rail freight corridor and residual freight issues $110,851,000 $1<strong>12</strong>,713,000 $1,862,000<br />
Note: For more explanations on the variation, please refer to the section Audited Key Performance Indicators.<br />
a) <strong>The</strong> Prospector on time running result was below<br />
target as a result of disruptions in services due to<br />
track repairs, speed restrictions, signal failures and<br />
train crossing delays due to increased traffic.<br />
b) Category ‘B’ incidents per million passenger<br />
boardings and per million train kilometres were<br />
<strong>12</strong>.19 per cent and 8.16 per cent lower than target.<br />
c) Regional school bus services notifiable occurrences<br />
were 69 per cent above target; 59 per cent of the<br />
accident cases occurred through no fault of the<br />
school bus driver. No major incidents occurred and<br />
no fatalities or serious injuries were recorded.<br />
d) <strong>The</strong> Transwa rail cost per passenger kilometre in<br />
<strong>2011</strong>-<strong>12</strong> was <strong>12</strong>.16 per cent below target mainly<br />
due to a deferment in maintenance cost.<br />
87
Electoral<br />
Act 1907 –<br />
Section 175ZE<br />
In compliance with section 175ZE of the Electoral Act 1907,<br />
the <strong>Public</strong> <strong>Transport</strong> <strong>Authority</strong> of <strong>Western</strong> Australia is required<br />
to report on expenditure incurred during the financial year in<br />
relation to advertising agencies, market research organisations,<br />
polling organisations, direct mail organisations and media<br />
advertising organisations.<br />
88 <strong>Public</strong> <strong>Transport</strong> <strong>Authority</strong> <strong>Annual</strong> <strong>Report</strong> <strong>2011</strong>-<strong>12</strong>
<strong>The</strong> details of the report are as follows:<br />
<strong>2011</strong>-<strong>12</strong><br />
$<br />
Expenditure with Advertising Agencies:<br />
Cooch Creative 561,822<br />
Definition Pty Ltd 277,806<br />
ADCORP Marketing Communication 201,488<br />
key2creative 84,246<br />
Exposure Print and Design 42,294<br />
Radiowest Broadcasters 9,370<br />
Graduate Careers Australia 7,<strong>12</strong>5<br />
<strong>The</strong> Design Cooperative 4,482<br />
Image Source 3,471<br />
ICON illustrations 3,286<br />
Australia’s Golden Outback 3,177<br />
1,198,567<br />
Expenditure with Market Research Agencies:<br />
Painted Dog Research 455,585<br />
Taylor Nelson Sofres 20,000<br />
<strong>The</strong> Nexus Network 17,860<br />
493,445<br />
Expenditure with Polling Agencies:<br />
Nil<br />
Expenditure with Direct Mail Agencies:<br />
Nil<br />
Expenditure with Media Advertising Agencies:<br />
Mitchell & Partners Australia 219,<strong>12</strong>0<br />
Optimum Media Decisions 27,911<br />
Gramercy Park Consulting <strong>12</strong>,783<br />
Metropolitan Redevelopment 8,280<br />
Wesley Buzza 3,400<br />
BAM Creative 2,385<br />
Siamese Pty Ltd 2,247<br />
276,<strong>12</strong>6<br />
Total Expenditure 1,968,138<br />
89
Explanation of<br />
major capital<br />
expenditure<br />
variations<br />
<strong>2011</strong>-<strong>12</strong><br />
(a) Budgeted estimates and actual results for <strong>2011</strong>-<strong>12</strong><br />
Budget Actual Variation Comments<br />
$000 $000 $000<br />
Grain Freight Re-sleepering Project 79,634 32,945 46,689 Project scheduling<br />
Business Support Upgrades 7,569 890 6,679 Projects deferred<br />
Bus Priority Projects 8,000 2,711 5,289 Project scheduling<br />
Disability Access for Intermediate<br />
Minor Stations & Track Works 7,483 4,584 2,899 Project scheduling<br />
Maddington Station Upgrade 2,599 89 2,510 Project scheduling<br />
Track Recording System 2,250 4 2,246 Project cancelled<br />
Warnbro Bus Rail Interchange 2,741 1,032 1,709 Project scheduling<br />
Network & Infrastructure<br />
Maintenance Depot 2,632 1,143 1,489 Project scheduling<br />
Power Supply Continuity Program 1,287 - 1,287 Project scheduling<br />
Security Fire Protection 1,4<strong>12</strong> 141 1,271 Project scheduling<br />
Goongoonup (East Perth) Rail Bridge 2,079 3,297 (1,218) Project scheduling<br />
Escalator and Lift Upgrade 584 1,835 (1,251) Project scheduling<br />
Concrete Re-sleepering Project 5,513 7,488 (1,975) Project scheduling<br />
Extension of the Northern Suburbs<br />
Railway to Butler 46,498 55,415 (8,917) Project scheduling<br />
Bus Replacement Program 29,958 41,069 (11,111) Project scheduling<br />
Perth City Link 68,937 107,016 (38,079) Project scheduling<br />
Others 76,680 86,322 (9,642) Project scheduling<br />
Grand Total 345,856 345,981 (<strong>12</strong>5)<br />
90 <strong>Public</strong> <strong>Transport</strong> <strong>Authority</strong> <strong>Annual</strong> <strong>Report</strong> <strong>2011</strong>-<strong>12</strong>
(b) Major Works in progress and completed<br />
<strong>2011</strong>-<strong>12</strong><br />
Estimated<br />
Total Cost<br />
Estimated Cost<br />
to Complete<br />
Total Cost of<br />
Project – Actual<br />
Description of Work $000 $000 $000<br />
Expected Year<br />
of Completion<br />
Perth City Link 609,269 467,332 141,937 2015-16<br />
Bus Replacement Program 431,369 389,835 41,534 2020-21<br />
Extension of the Northern<br />
Suburbs Railway to Butler 250,230 177,630 72,600 2014-15<br />
Disability Access for Intermediate<br />
Minor Stations & Track Works 33,304 25,658 7,646 2016-17<br />
Bus Priority Projects 25,590 19,402 6,188 2015-16<br />
Better <strong>Transport</strong> System<br />
(3000 parking bays) 50,022 4,944 45,078 20<strong>12</strong>-13<br />
Concrete Re-sleepering Projects 60,641 (355) 60,996 20<strong>12</strong>-13<br />
Bus Acquisition Program 406,375 <strong>12</strong>0 406,255 <strong>2011</strong>-<strong>12</strong><br />
Grain Freight Re-sleepering Project 171,420 114,291 57,<strong>12</strong>9 2013-14<br />
91
Independent<br />
audit opinion<br />
Auditor General<br />
Independent Auditor’s <strong>Report</strong><br />
To the Parliament of <strong>Western</strong> Australia<br />
<strong>Public</strong> <strong>Transport</strong> <strong>Authority</strong><br />
of <strong>Western</strong> Australia<br />
<strong>Report</strong> on the Financial Statements<br />
I have audited the accounts and financial statements<br />
of the <strong>Public</strong> <strong>Transport</strong> <strong>Authority</strong> of <strong>Western</strong> Australia.<br />
<strong>The</strong> financial statements comprise the Statement of<br />
Financial Position as at 30 June 20<strong>12</strong>, the Statement<br />
of Comprehensive Income, Statement of Changes in<br />
Equity and Statement of Cash Flows for the year then<br />
ended, and Notes comprising a summary of significant<br />
accounting policies and other explanatory information.<br />
Chief Executive Officer’s Responsibility for the<br />
Financial Statements<br />
<strong>The</strong> Chief Executive Officer is responsible for keeping<br />
proper accounts, and the preparation and fair<br />
presentation of the financial statements in accordance<br />
with Australian Accounting Standards and the<br />
92 <strong>Public</strong> <strong>Transport</strong> <strong>Authority</strong> <strong>Annual</strong> <strong>Report</strong> <strong>2011</strong>-<strong>12</strong><br />
Treasurer’s Instructions, and for such internal control as<br />
the Chief Executive Officer determines is necessary to<br />
enable the preparation of financial statements that are<br />
free from material misstatement, whether due to fraud<br />
or error.<br />
Auditor’s Responsibility<br />
As required by the Auditor General Act 2006, my<br />
responsibility is to express an opinion on the financial<br />
statements based on my audit. <strong>The</strong> audit was<br />
conducted in accordance with Australian Auditing<br />
Standards. Those Standards require compliance<br />
with relevant ethical requirements relating to audit<br />
engagements and that the audit be planned and<br />
performed to obtain reasonable assurance about<br />
whether the financial statements are free from<br />
material misstatement.<br />
An audit involves performing procedures to obtain audit<br />
evidence about the amounts and disclosures in the<br />
financial statements. <strong>The</strong> procedures selected depend<br />
on the auditor’s judgement, including the assessment<br />
of the risks of material misstatement of the financial<br />
statements, whether due to fraud or error. In making<br />
those risk assessments, the auditor considers internal<br />
control relevant to the <strong>Authority</strong>’s preparation and fair<br />
presentation of the financial statements in order to<br />
design audit procedures that are appropriate in the<br />
circumstances. An audit also includes evaluating the<br />
appropriateness of the accounting policies used and<br />
the reasonableness of accounting estimates made by<br />
the Chief Executive Officer, as well as evaluating the<br />
overall presentation of the financial statements.<br />
I believe that the audit evidence obtained is sufficient<br />
and appropriate to provide a basis for my audit opinion.<br />
Opinion<br />
In my opinion, the financial statements are based<br />
on proper accounts and present fairly, in all material<br />
respects, the financial position of the <strong>Public</strong> <strong>Transport</strong><br />
<strong>Authority</strong> of <strong>Western</strong> Australia at 30 June 20<strong>12</strong> and<br />
its financial performance and cash flows for the year<br />
then ended. <strong>The</strong>y are in accordance with Australian<br />
Accounting Standards and the Treasurer’s Instructions.<br />
<strong>Report</strong> on Controls<br />
I have audited the controls exercised by the <strong>Public</strong><br />
<strong>Transport</strong> <strong>Authority</strong> of <strong>Western</strong> Australia during the<br />
year ended 30 June 20<strong>12</strong>.<br />
Controls exercised by the <strong>Public</strong> <strong>Transport</strong> <strong>Authority</strong><br />
of <strong>Western</strong> Australia are those policies and procedures<br />
established by the Chief Executive Officer to ensure<br />
that the receipt, expenditure and investment of money,<br />
the acquisition and disposal of property, and the<br />
incurring of liabilities have been in accordance with<br />
legislative provisions.<br />
Chief Executive Officer’s Responsibility for Controls<br />
<strong>The</strong> Chief Executive Officer is responsible for<br />
maintaining an adequate system of internal control<br />
to ensure that the receipt, expenditure and investment<br />
of money, the acquisition and disposal of public and<br />
other property, and the incurring of liabilities are in<br />
accordance with the Financial Management Act 2006<br />
and the Treasurer’s Instructions, and other relevant<br />
written law.<br />
Auditor’s Responsibility<br />
As required by the Auditor General Act 2006, my<br />
responsibility is to express an opinion on the controls<br />
exercised by the <strong>Public</strong> <strong>Transport</strong> <strong>Authority</strong> of <strong>Western</strong><br />
Australia based on my audit conducted in accordance<br />
with Australian Auditing and Assurance Standards.
An audit involves performing procedures to obtain audit<br />
evidence about the adequacy of controls to ensure that<br />
the <strong>Authority</strong> complies with the legislative provisions.<br />
<strong>The</strong> procedures selected depend on the auditor’s<br />
judgement and include an evaluation of the design<br />
and implementation of relevant controls.<br />
I believe that the audit evidence obtained is sufficient<br />
and appropriate to provide a basis for my audit opinion.<br />
Opinion<br />
In my opinion, the controls exercised by the <strong>Public</strong><br />
<strong>Transport</strong> <strong>Authority</strong> of <strong>Western</strong> Australia are sufficiently<br />
adequate to provide reasonable assurance that the<br />
receipt, expenditure and investment of money, the<br />
acquisition and disposal of property, and the incurring<br />
of liabilities have been in accordance with legislative<br />
provisions during the year ended 30 June 20<strong>12</strong>.<br />
<strong>Report</strong> on the Key Performance Indicators<br />
I have audited the key performance indicators of the<br />
<strong>Public</strong> <strong>Transport</strong> <strong>Authority</strong> of <strong>Western</strong> Australia for the<br />
year ended 30 June 20<strong>12</strong>.<br />
<strong>The</strong> key performance indicators are the key<br />
effectiveness indicators and the key efficiency<br />
indicators that provide information on outcome<br />
achievement and service provision.<br />
Chief Executive Officer’s Responsibility for the<br />
Key Performance Indicators<br />
<strong>The</strong> Chief Executive Officer is responsible for<br />
the preparation and fair presentation of the key<br />
performance indicators in accordance with the<br />
Financial Management Act 2006 and the Treasurer’s<br />
Instructions and for such controls as the Chief<br />
Executive Officer determines necessary to ensure<br />
that the key performance indicators fairly represent<br />
indicated performance.<br />
Auditor’s Responsibility<br />
As required by the Auditor General Act 2006, my<br />
responsibility is to express an opinion on the key<br />
performance indicators based on my audit conducted<br />
in accordance with Australian Auditing and Assurance<br />
Standards.<br />
An audit involves performing procedures to obtain<br />
audit evidence about the key performance indicators.<br />
<strong>The</strong> procedures selected depend on the auditor’s<br />
judgement, including the assessment of the risks<br />
of material misstatement of the key performance<br />
indicators. In making these risk assessments the<br />
auditor considers internal control relevant to the Chief<br />
Executive Officer’s preparation and fair presentation of<br />
the key performance indicators in order to design audit<br />
procedures that are appropriate in the circumstances.<br />
An audit also includes evaluating the relevance and<br />
appropriateness of the key performance indicators for<br />
measuring the extent of outcome achievement and<br />
service provision.<br />
I believe that the audit evidence obtained is sufficient<br />
and appropriate to provide a basis for my audit opinion.<br />
Opinion<br />
In my opinion, the key performance indicators of the<br />
<strong>Public</strong> <strong>Transport</strong> <strong>Authority</strong> of <strong>Western</strong> Australia are<br />
relevant and appropriate to assist users to assess the<br />
<strong>Authority</strong>’s performance and fairly represent indicated<br />
performance for the year ended 30 June 20<strong>12</strong>.<br />
Independence<br />
In conducting this audit, I have complied with the<br />
independence requirements of the Auditor General<br />
Act 2006 and Australian Auditing and Assurance<br />
Standards, and other relevant ethical requirements.<br />
Matters Relating to the Electronic <strong>Public</strong>ation<br />
of the Audited Financial Statements and Key<br />
Performance Indicators<br />
This auditor’s report relates to the financial statements<br />
and key performance indicators of the <strong>Public</strong> <strong>Transport</strong><br />
<strong>Authority</strong> of <strong>Western</strong> Australia for the year ended<br />
30 June 20<strong>12</strong> included on the <strong>Authority</strong>’s website.<br />
<strong>The</strong> <strong>Authority</strong>’s management is responsible for the<br />
integrity of the <strong>Authority</strong>’s website. This audit does not<br />
provide assurance on the integrity of the <strong>Authority</strong>’s<br />
website. <strong>The</strong> auditor’s report refers only to the financial<br />
statements and key performance indicators described<br />
above. It does not provide an opinion on any other<br />
information which may have been hyperlinked to/<br />
from these financial statements or key performance<br />
indicators. If users of the financial statements and<br />
key performance indicators are concerned with the<br />
inherent risks arising from publication on a website,<br />
they are advised to refer to the hard copy of the<br />
audited financial statements and key performance<br />
indicators to confirm the information contained in this<br />
website version of the financial statements and key<br />
performance indicators.<br />
Colin Murphy<br />
Auditor General for <strong>Western</strong> Australia<br />
Perth, <strong>Western</strong> Australia<br />
17 September 20<strong>12</strong><br />
93
Audited Key<br />
Performance<br />
Indicators<br />
Certification of Key Performance Indicators<br />
For the year ended 30 June 20<strong>12</strong><br />
I hereby certify that the key performance indicators are based on proper records, are relevant and appropriate<br />
for assisting users to assess the <strong>Public</strong> <strong>Transport</strong> <strong>Authority</strong>’s performance, and fairly represent the performance<br />
of the <strong>Public</strong> <strong>Transport</strong> <strong>Authority</strong> of <strong>Western</strong> Australia for the financial year ended 30 June 20<strong>12</strong>.<br />
Reece Waldock<br />
Accountable <strong>Authority</strong><br />
13 September 20<strong>12</strong><br />
94 <strong>Public</strong> <strong>Transport</strong> <strong>Authority</strong> <strong>Annual</strong> <strong>Report</strong> <strong>2011</strong>-<strong>12</strong>
Key Performance<br />
Indicators<br />
Relationship to Government Strategic Goal<br />
<strong>The</strong> following table depicts the relationship between<br />
the Government’s Goals and the outcomes and<br />
services that the PTA provides in order to achieve<br />
those goals.<br />
Government Strategic Goal PTA Outcomes PTA Services<br />
Results-Based Service Delivery:<br />
Greater focus on achieving results<br />
in key service delivery areas for the<br />
benefit of all <strong>Western</strong> Australians.<br />
Accessible, reliable and safe public<br />
transport system<br />
Protection of the long term<br />
functionality of the rail corridor<br />
and railway infrastructure<br />
1. Metropolitan and Regional<br />
Passenger Services<br />
2. Country Passenger Rail<br />
and Road Coach Services<br />
3. Regional School Bus Services<br />
4. Rail Corridor and Residual<br />
Freight Issues Management<br />
Note: <strong>The</strong> key performance indicators and the variances are calculated based on original source data and the<br />
results are reported with rounding to the nearest appropriate decimals.<br />
95
Measuring Performance<br />
Outcome 1: Accessible, reliable and<br />
safe public transport system<br />
Effectiveness Indicators<br />
<strong>The</strong> PTA’s effectiveness in providing an accessible,<br />
reliable and safe public transport system is measured<br />
using the following key effectiveness indicators for:<br />
1. Use of public transport<br />
2. Accessible public transport<br />
3. Service reliability<br />
4. Level of overall customer satisfaction<br />
5. Customer perception of safety<br />
6. Level of notifiable safety incidents.<br />
1. Use of <strong>Public</strong> <strong>Transport</strong><br />
<strong>The</strong> use of public transport is measured by comparing<br />
the annual number of passengers carried with the<br />
number of service kilometres. Service kilometres are<br />
kilometres operated on scheduled passenger services<br />
and exclude “non-productive running” IE travelling<br />
to or from the depot to commence a service trip or<br />
re-positioning to commence another service trip.<br />
<strong>The</strong> measure indicates the extent to which services<br />
provided, as represented by the number of kilometres<br />
operated, are being utilised. An increasing trend in the<br />
indicator will generally signify that patronage is rising<br />
at a rate greater than the rate of increase in service<br />
kilometres operated and represents an improvement<br />
in effectiveness as well as an increase in the use of<br />
public transport.<br />
This effectiveness indicator is applied to each mode<br />
of public transport. <strong>The</strong> indicator is based on total<br />
boardings on Transperth services and includes<br />
fare-paying boardings plus free travel and transfers.<br />
Transfers are boardings which occur either between<br />
services within the same mode or between modes<br />
during the specified ticket transfer time.<br />
Transperth Bus Services<br />
2008-09<br />
2009-10<br />
2010-11<br />
<strong>2011</strong>-<strong>12</strong><br />
1.41<br />
1.43<br />
1.43<br />
1.39<br />
Target <strong>2011</strong>-<strong>12</strong> 1.38<br />
0.0 0.3 0.6 0.9 1.2 1.5<br />
Passengers per service kilometre<br />
Total boardings reached 80.626 million in <strong>2011</strong>-<strong>12</strong><br />
compared to 76.636 million in 2010-11 and the target<br />
of 78.032 million, an increase of 5.21 per cent over<br />
2010-11 and 3.32 per cent above the target.<br />
<strong>The</strong> introduction of new bus services increased service<br />
kilometres to 58.091 million kilometres, 4.540 million<br />
more than the 53.551 million in 2010-11 and exceeded<br />
the target of 56.630 million. This is an increase of<br />
8.48 per cent to 2010-11 and 2.58 per cent to target.<br />
<strong>The</strong> total number of services (trips) increased by<br />
<strong>12</strong>.08 per cent from 3.659 million trips to 4.101 million<br />
trips in <strong>2011</strong>-<strong>12</strong>.<br />
Transperth Train Services<br />
2008-09<br />
2009-10<br />
2010-11<br />
<strong>2011</strong>-<strong>12</strong><br />
Target <strong>2011</strong>-<strong>12</strong><br />
3.77<br />
4.15<br />
4.11<br />
4.21<br />
4.09<br />
0 1 2 3 4 5<br />
Passengers per service kilometre<br />
Passengers per service kilometre on Transperth train<br />
exceeded the target by 2.98 per cent.<br />
Total boardings reached 63.030 million from<br />
58.868 million in 2010-11 and the target of<br />
61.261 million, an increase of 7.07 per cent from<br />
2010-11 and 2.89 per cent above the target.<br />
<strong>The</strong> increased boardings are due to the increase<br />
in population and the benefits of <strong>Public</strong> <strong>Transport</strong><br />
over other transport modes.<br />
Train service kilometres recorded 14.965 million<br />
kilometres compared to 14.307 million in 2010-11,<br />
an increase of 4.60 per cent as a result of bringing<br />
four additional railcars into service in April <strong>2011</strong>.<br />
96 <strong>Public</strong> <strong>Transport</strong> <strong>Authority</strong> <strong>Annual</strong> <strong>Report</strong> <strong>2011</strong>-<strong>12</strong>
Regional Town Bus Services: Intra-town services<br />
operate within rural town boundaries, while inter-town<br />
services run between regional centres.<br />
a. Intra-Town Services<br />
2008-09<br />
2009-10<br />
2010-11<br />
<strong>2011</strong>-<strong>12</strong><br />
0.977<br />
1.004<br />
0.990<br />
0.962<br />
Target <strong>2011</strong>-<strong>12</strong> 0.993<br />
0.0 0.2 0.4 0.6 0.8 1.0 1.2<br />
Passengers per service kilometre<br />
Passengers per service kilometre were 2.83 per cent<br />
less than 2010-11 and 3.11 per cent less than<br />
the target.<br />
Total patronage was 2.417 million compared to<br />
2.411 million in 2010-11, an increase of 0.24 per cent.<br />
Service kilometres also increased by 3.16 per cent<br />
to 2.5<strong>12</strong> million kilometres from 2.435 million in<br />
2010-11 due to the inclusion of a new Dunsborough<br />
public school bus service in the intra-town service<br />
(previously this had been a contract school bus<br />
service).<br />
b. Inter-Town Services<br />
2008-09<br />
2009-10<br />
2010-11<br />
<strong>2011</strong>-<strong>12</strong><br />
Target <strong>2011</strong>-<strong>12</strong><br />
0.021<br />
0.018<br />
0.016<br />
0.019<br />
0.014<br />
0.000 0.005 0.010 0.015 0.020 0.025<br />
Passengers per service kilometre<br />
Passengers per service kilometre exceeded the<br />
2010-11 result by 18.79 per cent and the target by<br />
35.77 per cent.<br />
Total patronage was 8,610 compared to 6,532 in<br />
2010-11, an increase of 31.81 per cent with significant<br />
increases recorded for Roebourne (41 per cent),<br />
Monkey Mia (39 per cent) and Pilbara services<br />
(38 per cent).<br />
Service kilometres also increased by 10.97 per cent to<br />
0.453 million kilometres from 0.408 million in 2010-11.<br />
<strong>The</strong> increase in service kilometres was spread across<br />
all seven inter-town services.<br />
Transperth Ferry Services<br />
2008-09<br />
2009-10<br />
2010-11<br />
<strong>2011</strong>-<strong>12</strong><br />
Target <strong>2011</strong>-<strong>12</strong><br />
14.01<br />
13.43<br />
13.64<br />
13.68<br />
13.88<br />
0 3 6 9 <strong>12</strong> 15<br />
Passengers per service kilometre<br />
Passengers per service kilometre exceeded the<br />
2010-11 result but fell below the target of <strong>2011</strong>-<strong>12</strong>.<br />
This is an increase of 0.29 per cent from 2010-11<br />
and 1.44 per cent below the target.<br />
<strong>The</strong> target was based on projected annual total<br />
boardings of 479,000 and 34,500 service kilometres.<br />
During the year, ferry boardings increased by 0.51 per<br />
cent from 471,338 in 2010-11 to 473,728 but were<br />
lower than the target by 1.10 per cent. <strong>Annual</strong> service<br />
kilometres increased slightly from 34,555 kilometres<br />
to 34,630 and were 0.38 per cent above the target.<br />
97
Transwa Rail Services<br />
2008-09<br />
2009-10<br />
2010-11<br />
<strong>2011</strong>-<strong>12</strong><br />
Target <strong>2011</strong>-<strong>12</strong><br />
0.271<br />
0.242<br />
0.235<br />
0.239<br />
0.23<br />
0.00 0.05 0.10 0.15 0.20 0.25 0.30<br />
Passengers per service kilometre<br />
Passengers per service kilometre exceeded the<br />
2010-11 result and the target for <strong>2011</strong>-<strong>12</strong>. This is<br />
an increase of 1.45 per cent from 2010-11 and 3.85<br />
per cent above the target.<br />
<strong>The</strong>re was a marginal (0.27 per cent) increase in service<br />
kilometres from 992,669 in 2010-11 to 995,329, albeit<br />
0.34 per cent below the target of 998,706.<br />
<strong>The</strong> patronage increased by 1.72 per cent from<br />
233,711 in 2010-11 to 237,734 in <strong>2011</strong>-<strong>12</strong>, exceeding<br />
the target of 234,722 by 1.28 per cent. This increase<br />
was predominantly due to a 10.18 per cent increase in<br />
Prospector patronage in <strong>2011</strong>-<strong>12</strong>.<br />
Transwa Road Coach Services<br />
2008-09<br />
2009-10<br />
2010-11<br />
<strong>2011</strong>-<strong>12</strong><br />
Target <strong>2011</strong>-<strong>12</strong><br />
0.069<br />
0.067<br />
0.066<br />
0.066<br />
0.07<br />
0.00 0.02 0.04 0.06 0.08<br />
Passengers per service kilometre<br />
Passengers per service kilometre remained the same<br />
as the 2010-11 result and was 6.25 per cent below<br />
the <strong>2011</strong>-<strong>12</strong> target of 0.07.<br />
This is due to a 0.40 per cent decline in patronage<br />
from 2<strong>12</strong>,926 in 2010-11 to 2<strong>12</strong>,070 in <strong>2011</strong>-<strong>12</strong> and<br />
a 0.34 per cent increase in service kilometres (from<br />
3.221 million kilometres in 2010-11 to 3.232 million<br />
in <strong>2011</strong>-<strong>12</strong>) which is above the target of 3.210 million<br />
kilometres by 0.66 per cent.<br />
2. Accessible <strong>Public</strong> <strong>Transport</strong><br />
Accessibility to public transport, in terms of service<br />
coverage, is measured as the proportion of Property<br />
Street Addresses (PSA) within the Perth <strong>Public</strong><br />
<strong>Transport</strong> Area (PPTA) which are within 500 metres<br />
of a Transperth stop providing an acceptable level of<br />
service. <strong>The</strong> PPTA defines the core operational areas<br />
for Transperth services.<br />
“Acceptable Service Level” (ASL) is defined as an<br />
hourly service during the day with at least three trips<br />
per hour (IE at 20-minute intervals) in the peak flow<br />
direction in the morning and/or afternoon peaks,<br />
excluding dedicated school bus services.<br />
<strong>The</strong> indicator uses PSA data from Landgate and<br />
service information and stop location data from<br />
the Transperth Route Information System (TRIS).<br />
<strong>The</strong> measure demonstrates the extent to which the<br />
PTA meets its accessibility standards in the Perth<br />
metropolitan area.<br />
2008-09<br />
2009-10<br />
2010-11<br />
<strong>2011</strong>-<strong>12</strong><br />
Target <strong>2011</strong>-<strong>12</strong><br />
81.10%<br />
82.89%<br />
83.78%<br />
84.56%<br />
83.50%<br />
0% 20% 40% 60% 80% 100%<br />
<strong>The</strong> proportion of street addresses within<br />
the PPTA which are within 500 metres of a<br />
Transperth stop providing an acceptable<br />
level of service<br />
98 <strong>Public</strong> <strong>Transport</strong> <strong>Authority</strong> <strong>Annual</strong> <strong>Report</strong> <strong>2011</strong>-<strong>12</strong>
Accessibility to public transport increased by 0.94<br />
per cent from 2010-11 and was 1.27 per cent above<br />
the target. While the number of PSAs within the PPTA<br />
increased by 3.38 per cent to 906,184 from 876,549 in<br />
2010-11, the number of PSAs within 500 metres of an<br />
ASL stop increased by 4.35 per cent to 766,276 from<br />
734,349 in 2010-11. <strong>The</strong> <strong>2011</strong>-<strong>12</strong> result indicates that<br />
a very high proportion of PSAs in Perth, 766,276 out<br />
of 906,184 (84.56 per cent) have ready access to an<br />
acceptable level of public transport services.<br />
3. Service Reliability<br />
According to an independent survey which measured<br />
customer satisfaction, service reliability is regarded as<br />
one of the most significant characteristics of a quality<br />
service. Service reliability is essentially a combination<br />
of two main factors, punctuality and consistency.<br />
Services are considered to be punctual if they arrive<br />
within a defined period of time after the scheduled<br />
arrival time. This parameter is referred to as ‘On Time<br />
Running’ (OTR).<br />
Operation<br />
‘OTR’ parameter<br />
Metropolitan and Regional Passenger Services<br />
Transperth Trains<br />
Transperth Buses<br />
Transperth Ferries<br />
4 minutes<br />
4 minutes<br />
3 minutes<br />
Country Passenger Rail and Road<br />
Coach Services<br />
Transwa Rail<br />
Prospector<br />
Australind<br />
AvonLink<br />
MerredinLink<br />
Road coaches<br />
Regional school bus services<br />
15 minutes<br />
10 minutes<br />
10 minutes<br />
10 minutes<br />
10 minutes<br />
Drop off no less than 10 minutes before school starts<br />
and pick up within 10 minutes of school ending<br />
<strong>The</strong> ‘OTR’ measure demonstrates the extent to which<br />
the PTA meets its service reliability standards.<br />
Transperth Train Services<br />
2008-09<br />
2009-10<br />
2010-11<br />
<strong>2011</strong>-<strong>12</strong><br />
Target <strong>2011</strong>-<strong>12</strong><br />
94.72%<br />
95.90%<br />
95.71%<br />
94.59%<br />
95.00%<br />
0% 20% 40% 60% 80% 100%<br />
Percentage of services arriving within<br />
‘on-time arrival’ parameter<br />
<strong>The</strong> ‘OTR’ of Transperth Trains in <strong>2011</strong>-<strong>12</strong> was<br />
marginally lower (0.43 per cent) than the target<br />
and marginally below (1.17 per cent) the previous<br />
year’s result.<br />
99
Transperth Bus Services<br />
2008-09 84.50%<br />
2009-10 85.54%<br />
Transperth Ferry Services<br />
2008-09 98.39%<br />
2009-10 98.39%<br />
Transwa Rail Services: Indicators of the ‘OTR’<br />
performance for Transwa rail services are reported<br />
separately for each service.<br />
a. Prospector<br />
2010-11<br />
85.13%<br />
2010-11<br />
99.19%<br />
2008-09<br />
77%<br />
<strong>2011</strong>-<strong>12</strong><br />
79.08%<br />
<strong>2011</strong>-<strong>12</strong><br />
96.67%<br />
2009-10<br />
72%<br />
Target <strong>2011</strong>-<strong>12</strong><br />
85.00%<br />
0% 20% 40% 60% 80% 100%<br />
Percentage of services arriving within<br />
‘on-time arrival’ parameter<br />
<strong>The</strong> ‘OTR’ of Transperth Bus in <strong>2011</strong>-<strong>12</strong> was 7.11 per<br />
cent less than 2010-11 and 6.97 per cent below the<br />
target due to congestion on the Perth Metropolitan<br />
road network especially the road works on the Great<br />
Eastern Highway widening, the Great Eastern Highway/<br />
Roe Highway overpass and the on-going works at<br />
various locations around the Perth CBD.<br />
Target <strong>2011</strong>-<strong>12</strong><br />
98.00%<br />
0% 20% 40% 60% 80% 100%<br />
Percentage of services arriving within<br />
‘on-time arrival’ parameter<br />
<strong>The</strong> <strong>2011</strong>-<strong>12</strong> target for the ferry ‘OTR’ key performance<br />
indicator was for services to arrive within three minutes<br />
of the scheduled time.<br />
During the year, on average 96.67 per cent of services<br />
met the target compared with 99.19 per cent of<br />
services in 2010-11. Of the <strong>12</strong>0 trips checked during<br />
<strong>2011</strong>-<strong>12</strong> (1 per cent of total round-trips), four trips<br />
failed to meet the target.<br />
<strong>The</strong> ‘OTR’ of Transperth Ferry in <strong>2011</strong>-<strong>12</strong> was<br />
2.54 per cent less than 2010-11 and 1.36 per cent<br />
below the target.<br />
2010-11<br />
<strong>2011</strong>-<strong>12</strong><br />
75%<br />
77%<br />
Target <strong>2011</strong>-<strong>12</strong> 90%<br />
0% 20% 40% 60% 80% 100%<br />
Percentage of services arriving within<br />
‘on-time arrival’ parameter<br />
<strong>The</strong> ‘OTR’ of the Prospector in <strong>2011</strong>-<strong>12</strong> increased by<br />
2.80 per cent from 2010-11 and was 14.34 per cent<br />
below the <strong>2011</strong>-<strong>12</strong> target. <strong>The</strong> disruptions in services<br />
were caused by delays with crossings, signal failures,<br />
track repairs and speed restrictions resulting from rail<br />
works.<br />
100 <strong>Public</strong> <strong>Transport</strong> <strong>Authority</strong> <strong>Annual</strong> <strong>Report</strong> <strong>2011</strong>-<strong>12</strong>
. Australind<br />
2008-09<br />
2009-10<br />
82%<br />
95%<br />
<strong>The</strong> ‘OTR’ of AvonLink in <strong>2011</strong>-<strong>12</strong> increased by<br />
0.82 per cent from 2010-11 and was 4 per cent above<br />
the target.<br />
d. MerredinLink<br />
Transwa Road Coach Services<br />
2008-09 95%<br />
2009-10 97%<br />
2010-11<br />
95%<br />
2008-09<br />
83%<br />
2010-11<br />
98%<br />
<strong>2011</strong>-<strong>12</strong><br />
89%<br />
2009-10<br />
87%<br />
<strong>2011</strong>-<strong>12</strong><br />
97%<br />
Target <strong>2011</strong>-<strong>12</strong><br />
90%<br />
0% 20% 40% 60% 80% 100%<br />
Percentage of services arriving within<br />
‘on-time arrival’ parameter<br />
<strong>The</strong> ‘OTR’ of the Australind in <strong>2011</strong>-<strong>12</strong> was<br />
1.42 per cent below the target and 6.61 per cent<br />
below the previous year’s result. <strong>The</strong> decrease in the<br />
‘OTR’ performance is associated with delays caused<br />
by crossings and mechanical issues.<br />
c. AvonLink<br />
2008-09<br />
99%<br />
2010-11<br />
<strong>2011</strong>-<strong>12</strong><br />
92%<br />
94%<br />
Target <strong>2011</strong>-<strong>12</strong> 95%<br />
0% 20% 40% 60% 80% 100%<br />
Percentage of services arriving within<br />
‘on-time arrival’ parameter<br />
<strong>The</strong> ‘OTR’ of MerredinLink in <strong>2011</strong>-<strong>12</strong> increased by<br />
2.13 per cent from 2010-11 and was 1.10 per cent<br />
below the target. Delays caused by crossings were<br />
the primary reason for the failure to meet the ‘OTR’<br />
performance target.<br />
Target <strong>2011</strong>-<strong>12</strong><br />
95%<br />
0% 20% 40% 60% 80% 100%<br />
Percentage of services arriving within<br />
‘on-time arrival’ parameter<br />
<strong>The</strong> ‘OTR’ of the Road Coach services in <strong>2011</strong>-<strong>12</strong><br />
decreased by 1.09 per cent from 2010-11 but was<br />
2.03 per cent above the target.<br />
2009-10<br />
2010-11<br />
<strong>2011</strong>-<strong>12</strong><br />
98%<br />
98%<br />
99%<br />
Target <strong>2011</strong>-<strong>12</strong> 95%<br />
0% 20% 40% 60% 80% 100%<br />
Percentage of services arriving within<br />
‘on-time arrival’ parameter<br />
101
Regional School Bus Services<br />
This indicator measures school bus timetable reliability<br />
for rural mainstream services and Special Education<br />
School buses operating in the metropolitan area.<br />
<strong>The</strong> ‘OTR’ parameter is to arrive at school no less<br />
than 10 minutes before school starts and depart within<br />
10 minutes of school ending.<br />
2008-09<br />
2009-10<br />
2010-11<br />
<strong>2011</strong>-<strong>12</strong><br />
Target <strong>2011</strong>-<strong>12</strong><br />
97%<br />
97%<br />
99%<br />
99%<br />
97%<br />
0% 20% 40% 60% 80% 100%<br />
Drop off before school starts and<br />
pick up when school finishes<br />
<strong>The</strong> ‘OTR’ in <strong>2011</strong>-<strong>12</strong> is the same as last year’s result<br />
and above the target by 1.82 per cent.<br />
In <strong>2011</strong>-<strong>12</strong>, 647 services were monitored for ‘on-time<br />
running’ of which 639 were within the time standard.<br />
<strong>The</strong> number of observations was within the acceptable<br />
limit of sampling error rate.<br />
This indicator is calculated using a random sample<br />
which ties in with the School Bus Service inspection<br />
program.<br />
<strong>The</strong> table shows five year performance to 30 June<br />
20<strong>12</strong>:<br />
Year<br />
Number of<br />
observations<br />
for compliance<br />
with ‘on-time<br />
arrival’<br />
Observations<br />
that were<br />
compliant<br />
2007-08 1046 1022<br />
2008-09 1030 1001<br />
2009-10 888 864<br />
2010-11 976 970<br />
<strong>2011</strong>-<strong>12</strong> 647 639<br />
<strong>The</strong> error rate of ± 3.05 per cent is within the ± 5 per<br />
cent tolerance level.<br />
4. Level of Overall Customer Satisfaction<br />
<strong>The</strong> proportion of patrons who expressed overall<br />
satisfaction with their public transport service level,<br />
measures the public perception of Transperth’s<br />
performance in providing a high-quality and attractive<br />
public transport service.<br />
<strong>The</strong> measure for Transperth services is derived<br />
from an extensive annual survey conducted by<br />
independent pollsters. <strong>The</strong> survey, known as the<br />
‘Passenger Satisfaction Monitor’ (PSM), provides an<br />
objective, unbiased view over time of patrons’ overall<br />
satisfaction with the system, EG safety, on-time<br />
running, courtesy of staff, service frequency and<br />
station amenities. <strong>The</strong> information is used by<br />
Transperth to develop strategies for improving<br />
service performance and infrastructure.<br />
<strong>The</strong> pollsters interview a large sample of passengers in<br />
lengthy face-to-face surveys. Interviewers are assigned<br />
to various services and transit station locations over<br />
a four week period covering the working week and<br />
weekend.<br />
Transperth Train Services<br />
For the train PSM, a total of 1018 train patrons were<br />
surveyed. <strong>The</strong> overall sample comprised of:<br />
• Adults aged 18 years or over resident within the<br />
Perth metropolitan area<br />
• Current users of Transperth train services (excluding<br />
school students)<br />
• Patrons who travel on trains at least once per<br />
fortnight.<br />
<strong>The</strong> sample error estimate was within ± 3 - 4 per cent<br />
and represents score differences required to reach the<br />
95 per cent confidence level.<br />
2008-09<br />
2009-10<br />
2010-11<br />
<strong>2011</strong>-<strong>12</strong><br />
Target <strong>2011</strong>-<strong>12</strong><br />
89%<br />
93%<br />
88%<br />
89%<br />
92%<br />
0% 20% 40% 60% 80% 100%<br />
% of respondents either ‘Very satisfied’<br />
or ‘Satisfied’<br />
102 <strong>Public</strong> <strong>Transport</strong> <strong>Authority</strong> <strong>Annual</strong> <strong>Report</strong> <strong>2011</strong>-<strong>12</strong>
Overall satisfaction increased by 1.14 per cent from<br />
2010-11 and was 3.26 per cent below the target.<br />
<strong>The</strong> expressed levels of dissatisfaction decreased from<br />
5 per cent in 2010-11 to 4 per cent in <strong>2011</strong>-<strong>12</strong>.<br />
<strong>The</strong> results have been driven by a 2.38 per cent<br />
increase in overall satisfaction of peak-time travellers<br />
(from 84 per cent in 2010-11 to 86 per cent in<br />
<strong>2011</strong>-<strong>12</strong>).<br />
<strong>The</strong> main reasons for dissatisfaction related to<br />
crowding issues, insufficient carriages and service<br />
frequency during peak times, service reliability and<br />
insufficient off-peak services (after 6pm or weekends).<br />
Transperth Bus Services<br />
For the Transperth bus PSM, a total of 3,067 bus<br />
patrons were surveyed. <strong>The</strong> overall sample<br />
comprised of:<br />
• Adults aged 18 years or over resident within the<br />
Perth Bus Contract region<br />
• Current users of Transperth bus services (excluding<br />
school students)<br />
• Patrons who travel on bus at least once per<br />
fortnight.<br />
<strong>The</strong> sample error estimate was within ± 2 - 3 per cent<br />
and represents score differences required to reach the<br />
95 per cent confidence level.<br />
2008-09<br />
2009-10<br />
2010-11<br />
<strong>2011</strong>-<strong>12</strong><br />
Target <strong>2011</strong>-<strong>12</strong><br />
83%<br />
81%<br />
82%<br />
83%<br />
83%<br />
0% 20% 40% 60% 80% 100%<br />
% of respondents either ‘Very satisfied’<br />
or ‘Satisfied’<br />
Overall satisfaction increased by 1.22 per cent<br />
from 2010-11.<br />
Levels of dissatisfaction remained unchanged at<br />
10 per cent. <strong>The</strong> <strong>2011</strong>-<strong>12</strong> results are same as the<br />
last three years and consistent with those of the<br />
past decade.<br />
Belmont, Joondalup and all CAT services recorded<br />
significantly higher satisfaction levels in <strong>2011</strong>-<strong>12</strong><br />
ranging from 89 per cent to 95 per cent. Significantly<br />
higher dissatisfaction levels were recorded for Midland<br />
and Morley. Midland has recorded significant higher<br />
dissatisfaction and lower satisfaction compared<br />
to <strong>2011</strong>.<br />
<strong>The</strong> most frequently nominated reasons for<br />
dissatisfaction with the Bus system in <strong>2011</strong>-<strong>12</strong> were<br />
issues relating to service punctuality, frequency, limited<br />
connection of buses and trains and insufficient off-peak<br />
and weekend services.<br />
Transperth Ferry Services<br />
For the Transperth ferry PSM, a total of 202 ferry<br />
patrons were surveyed. <strong>The</strong> overall sample<br />
comprised of:<br />
• Adults aged 18 years or over resident within the<br />
Perth metropolitan area, (IE Patrons who were users<br />
of Transperth ferry services and used it more than<br />
once a fortnight for Perth residents)<br />
• Patrons who were users of Transperth ferry services<br />
whilst visiting Perth<br />
• School students were excluded from the sample.<br />
<strong>The</strong> sample error estimate was within ± 10 per cent<br />
and represents score differences required to reach the<br />
95 per cent confidence level.<br />
2008-09<br />
2009-10<br />
2010-11<br />
<strong>2011</strong>-<strong>12</strong><br />
Target <strong>2011</strong>-<strong>12</strong><br />
96%<br />
96%<br />
96%<br />
95%<br />
98%<br />
0% 20% 40% 60% 80% 100%<br />
% of respondents either ‘Very satisfied’<br />
or ‘Satisfied’<br />
103
Customer satisfaction with the overall level of<br />
Transperth ferry services remained very high at<br />
95 per cent with a slight decrease from the previous<br />
three years. In <strong>2011</strong>-<strong>12</strong>, zero per cent of the<br />
respondents indicated that they were dissatisfied<br />
at the overall service level, thus maintaining the<br />
long-term trend of satisfaction with Transperth ferry<br />
services. <strong>The</strong> proportions of users who were ‘very<br />
satisfied’ with the Transperth ferry services increased<br />
significantly compared to <strong>2011</strong>.<br />
<strong>The</strong> key factors affecting the level of satisfaction were<br />
the availability of seats, speed of the trip, cleanliness on<br />
board, punctuality, personal safety and cost of fares.<br />
Transwa Train and Road Coach Services<br />
An independent passenger satisfaction survey is<br />
undertaken annually for each service: Australind,<br />
Prospector, AvonLink, MerredinLink and road coaches.<br />
In <strong>2011</strong>-<strong>12</strong>, a total of 1,167 country services patrons<br />
were surveyed via a self-completion questionnaire.<br />
<strong>The</strong> sample error estimate was within ± 3 - 5 per cent<br />
and represents score differences required to reach the<br />
95 per cent confidence level.<br />
2008-09<br />
2009-10<br />
2010-11<br />
<strong>2011</strong>-<strong>12</strong><br />
Target <strong>2011</strong>-<strong>12</strong><br />
92%<br />
90%<br />
90%<br />
90%<br />
92%<br />
0% 20% 40% 60% 80% 100%<br />
% of respondents either ‘Very satisfied’<br />
or ‘Satisfied’<br />
Overall satisfaction remained the same as the<br />
2010-11 result and was 2.17 per cent below the target<br />
of 92 per cent in <strong>2011</strong>-<strong>12</strong>.<br />
A slight decrease in overall satisfaction was recorded<br />
for the Australind and the Prospector, however overall<br />
services recorded high level of satisfaction in <strong>2011</strong>-<br />
<strong>12</strong>. <strong>The</strong> decrease in satisfaction of the Prospector<br />
service is attributed to the dissatisfaction with<br />
the entertainment system whilst there was minor<br />
dissatisfaction with the length of time for the trip on<br />
the Australind.<br />
5. Customer Perception of Safety<br />
Safety perceptions are an important factor in the public<br />
deciding whether to use public transport. <strong>The</strong> PTA is<br />
continuing to invest in security-related infrastructure<br />
and has increased its security staff to ensure that<br />
customers can see the tangible measures being<br />
taken to increase their safety.<br />
Customer perceptions of safety are measured through<br />
data gathered in the Passenger Satisfaction Monitor<br />
(PSM) which distinguishes between on-train and<br />
on-bus and at stations, at night and during the day<br />
for the Transperth train and bus services.<br />
Transperth Train Services<br />
Stations<br />
97%<br />
98%<br />
99%<br />
98%<br />
96%<br />
98%<br />
98%<br />
On-board trains 98%<br />
99%<br />
97%<br />
0% 20% 40% 60% 80% 100%<br />
Customer perception of safety<br />
Daytime<br />
2008-09 2009-10 2010-11<br />
<strong>2011</strong>-<strong>12</strong> Target <strong>2011</strong>-<strong>12</strong><br />
<strong>The</strong> indicator for perceived safety at train stations<br />
reached 98 per cent, below the 2010-11 result of<br />
99 per cent and above the target of 96 per cent in<br />
<strong>2011</strong>-<strong>12</strong>. This is a decrease of 1.01 per cent from<br />
2010-11 and 2.08 per cent above the target.<br />
104 <strong>Public</strong> <strong>Transport</strong> <strong>Authority</strong> <strong>Annual</strong> <strong>Report</strong> <strong>2011</strong>-<strong>12</strong>
<strong>The</strong> indicator for perceived safety on-board trains<br />
reached 99 per cent, above the target of 97 per cent<br />
in <strong>2011</strong>-<strong>12</strong>. This is 2.06 per cent above the target.<br />
Stations<br />
66%<br />
70%<br />
72%<br />
68%<br />
65%<br />
76%<br />
75%<br />
On-board trains 76%<br />
72%<br />
75%<br />
0% 20% 40% 60% 80% 100%<br />
Customer perception of safety<br />
Night-time<br />
2008-09 2009-10 2010-11<br />
<strong>2011</strong>-<strong>12</strong> Target <strong>2011</strong>-<strong>12</strong><br />
<strong>The</strong> indicator for perceived safety at train stations<br />
reached 68 per cent, below the 2010-11 result of<br />
72 per cent and above the target of 65 per cent in<br />
<strong>2011</strong>-<strong>12</strong>. This is a decrease of 5.56 per cent from<br />
2010-11 and 4.62 per cent above the target.<br />
<strong>The</strong> indicator for perceived safety on-board trains<br />
reached 72 per cent, below the 2010-11 result of<br />
76 per cent and below the target of 75 per cent in<br />
<strong>2011</strong>-<strong>12</strong>. This is a decrease of 5.26 per cent from<br />
2010-11 and 4.00 per cent below the target.<br />
Transperth Bus Services<br />
At bus stations/<br />
interchanges<br />
97%<br />
96%<br />
97%<br />
97%<br />
96%<br />
98%<br />
98%<br />
On-board buses 99%<br />
99%<br />
98%<br />
0% 20% 40% 60% 80% 100%<br />
Customer perception of safety<br />
Daytime<br />
2008-09 2009-10 2010-11<br />
<strong>2011</strong>-<strong>12</strong> Target <strong>2011</strong>-<strong>12</strong><br />
<strong>The</strong> indicator for perceived safety at bus stations<br />
reached 97 per cent, same as the 2010-11 result<br />
and was 1.04 per cent above the target.<br />
<strong>The</strong> indicator for perceived safety on board reached<br />
99 per cent, same as the 2010-11 result of 99 per cent<br />
and was 1.02 per cent above the target.<br />
At bus stations/<br />
interchanges<br />
68%<br />
70%<br />
73%<br />
72%<br />
70%<br />
82%<br />
79%<br />
On-board buses 82%<br />
79%<br />
82%<br />
0% 20% 40% 60% 80% 100%<br />
Customer perception of safety<br />
Night-time<br />
2008-09 2009-10 2010-11<br />
<strong>2011</strong>-<strong>12</strong> Target <strong>2011</strong>-<strong>12</strong><br />
<strong>The</strong> indicator for perceived safety at bus stations<br />
reached 72 per cent, 1.37 per cent below the 2010-11<br />
result and 2.86 per cent above the target.<br />
<strong>The</strong> indicator for perceived safety on-board buses<br />
reached 79 per cent, 3.66 per cent below the 2010-11<br />
result and the target.<br />
105
6. Level of Notifiable Occurrences<br />
Rail Safety<br />
Railway safety incidents are recorded and notified to<br />
the Office of Rail Safety. <strong>The</strong>se incidents are termed<br />
‘notifiable occurrences’ and are defined in the Rail<br />
Safety Regulations <strong>2011</strong> as Category ‘A’ (serious<br />
injury, death, or significant damage) or Category ‘B’<br />
(incidents that may have the potential to cause a<br />
serious accident). Notifiable occurrences reporting is a<br />
legislated requirement under the Rail Safety Act 2010<br />
for the accredited owner and operator of a rail system<br />
and form part of the PTA’s safety management system.<br />
<strong>The</strong>se arrangements do not cover bus operations.<br />
<strong>The</strong> performance measure for Category ‘A’ and<br />
‘B’ occurrences is expressed as the number of<br />
occurrences per million passenger boardings and per<br />
million train kilometres. A low rate of incidents indicates<br />
that sound safety procedures and risk management<br />
procedures/controls exist and are operating effectively<br />
throughout the rail system.<br />
<strong>The</strong> benchmark values for Category ‘A’ and Category<br />
‘B’ incidents are calculated on the projected<br />
estimations of the number of future passenger<br />
boardings and train kilometres.<br />
Category A<br />
Occurrences per<br />
million passenger<br />
boardings<br />
0.16<br />
0.23<br />
0.19<br />
0.24<br />
0.25<br />
0.58<br />
Category A 0.86<br />
Occurrences per<br />
million train<br />
0.69<br />
kilometres 0.90<br />
0.90<br />
0.0 0.2 0.4 0.6 0.8 1.0<br />
Notifiable occurrences – Rail safety<br />
2008-09 2009-10 2010-11<br />
<strong>2011</strong>-<strong>12</strong> Target <strong>2011</strong>-<strong>12</strong><br />
<strong>The</strong> indicator for Category ‘A’ incidents per million<br />
passenger boardings reached 0.24, 27.38 per<br />
cent above the 2010-11 result and 5.16 per cent<br />
below the target of 0.25 in <strong>2011</strong>-<strong>12</strong>. <strong>The</strong> KPIs were<br />
calculated based on 15 Category ‘A’ incidents, total<br />
train kilometres of 16.598 million and 63.268 million<br />
boardings in <strong>2011</strong>-<strong>12</strong>.<br />
<strong>The</strong> indicator for Category ‘A’ occurrences per million<br />
train kilometres reached 0.90, 30.46 per cent above<br />
the 2010-11 result and was on target.<br />
Category ‘A’ occurrences, which includes suicides,<br />
increased by 36.36 per cent from 11 in 2010-11 to<br />
15 in <strong>2011</strong>-<strong>12</strong>.<br />
However, when excluding suicides and attempted<br />
suicides, there were 9 Category ‘A’ occurrences<br />
compared to 3 in 2010-11.<br />
Category B<br />
Occurrences per<br />
million passenger<br />
boardings<br />
9.22<br />
8.19<br />
6.63<br />
7.11<br />
8.10<br />
32.73<br />
Category B 30.74<br />
Occurrences per<br />
million train<br />
24.69<br />
kilometres 27.11<br />
29.52<br />
0 5 10 15 20 25 30 35<br />
Notifiable occurrences – Rail safety<br />
2008-09 2009-10 2010-11<br />
<strong>2011</strong>-<strong>12</strong> Target <strong>2011</strong>-<strong>12</strong><br />
<strong>The</strong> indicator for Category ‘B’ incidents per million<br />
passenger boardings reached 7.11, above the<br />
2010-11 result of 6.63 and below the target of<br />
8.10 in <strong>2011</strong>-<strong>12</strong>. This is an increase of 7.24 per cent<br />
from 2010-11 and <strong>12</strong>.19 per cent below the target.<br />
<strong>The</strong>re were 450 Category ‘B’ occurrences in<br />
<strong>2011</strong>-<strong>12</strong> compared to 392 in 2010-11.<br />
<strong>The</strong> indicator for Category ‘B’ occurrences per million<br />
train kilometres reached 27.11, 9.83 per cent above<br />
the 2010-11 result and 8.16 per cent below the target<br />
in <strong>2011</strong>-<strong>12</strong>.<br />
106 <strong>Public</strong> <strong>Transport</strong> <strong>Authority</strong> <strong>Annual</strong> <strong>Report</strong> <strong>2011</strong>-<strong>12</strong>
Effective Safety Management Systems controls are in<br />
place and ongoing reviews undertaken to minimise<br />
the incidents.<br />
Regional School Bus Services Safety<br />
Accidents attributable to all causes are notified to<br />
the PTA. <strong>The</strong> measure for the notifiable occurrences<br />
is expressed as the number of accidents (major and<br />
minor) reported during the school year.<br />
A low number of occurrences indicate that effective<br />
safety management procedures and controls exist and<br />
are being adhered to by school bus contractors and<br />
drivers throughout the regional school bus fleet.<br />
2008-09<br />
2009-10<br />
14<br />
17<br />
<strong>The</strong> indicator reached 22, above the 2010-11 result<br />
of 19 and above the target of 13 in <strong>2011</strong>-<strong>12</strong>. This is<br />
an increase of 15.79 per cent from 2010-11 and<br />
69.23 per cent above the target.<br />
All 22 ‘on-road’ school bus accidents in <strong>2011</strong>-<strong>12</strong> were<br />
minor accidents and 59 per cent occurred through no<br />
fault of the school bus driver compared with 68.42<br />
per cent in 2010-11.<br />
Of the 22 accidents, <strong>12</strong> occurred in the country area<br />
and 10 in metropolitan Perth. School Bus Services<br />
continues to campaign and educate school bus<br />
contractors and drivers about the relative risks<br />
associated with accidents and measures such as the<br />
requirement for all contractors to have in place Safety<br />
Management plans are effective means of improving<br />
and maintaining safety standards.<br />
2010-11<br />
<strong>2011</strong>-<strong>12</strong><br />
19<br />
22<br />
Target <strong>2011</strong>-<strong>12</strong><br />
13<br />
0 5 10 15 20 25<br />
School bus services notifiable occurrences<br />
(accidents) reported each school year<br />
107
Efficiency Indicators<br />
<strong>The</strong> PTA’s effectiveness in providing a cost efficient<br />
public transport system is measured using the following<br />
key efficiency indicators:<br />
Transperth Train Services<br />
2008-09<br />
$0.47<br />
Transperth Bus Services<br />
2008-09<br />
$0.63<br />
1. Average cost per passenger kilometre<br />
2. Average cost per 1,000 place kilometres<br />
3. Average cost per contracted kilometres<br />
2009-10<br />
2010-11<br />
$0.41<br />
$0.40<br />
2009-10<br />
2010-11<br />
$0.76<br />
$0.83<br />
1. Average Cost per Passenger Kilometre<br />
This indicator measures the cost efficiency of providing<br />
passenger services, expressed as the cost of carrying<br />
one passenger one kilometre.<br />
Transperth<br />
Passenger kilometres are calculated by multiplying the<br />
number of total boardings by the average trip length.<br />
<strong>The</strong> indicator measures the cost efficiency of the<br />
services, IE the trend in the cost of carrying one<br />
passenger over one kilometre. A declining trend<br />
indicates that the resources used to provide the<br />
services are being utilised in a cost efficient manner.<br />
<strong>2011</strong>-<strong>12</strong><br />
Target <strong>2011</strong>-<strong>12</strong><br />
$0.40<br />
$0.43<br />
$0.0 $0.1 $0.2 $0.3 $0.4 $0.5<br />
Transperth Train Operations<br />
Average cost per passenger kilometre<br />
<strong>The</strong> indicator maintained the 2010-11 result of<br />
$0.40 and was 6.78 per cent below the target.<br />
Cost of the services increased to $392.857 million from<br />
$379.175 million in 2010-11 by 3.61 per cent and was<br />
7.44 per cent below the budget target of $424.431<br />
million. This was mainly due to the reduction in interest<br />
cost and railcar maintenance cost.<br />
Passenger kilometres increased to 980.073 million<br />
in <strong>2011</strong>-<strong>12</strong> by 3.57 per cent from 946.283 million in<br />
2010-11 and was below the target of 986.815 million<br />
by 0.68 per cent.<br />
<strong>2011</strong>-<strong>12</strong><br />
Target <strong>2011</strong>-<strong>12</strong><br />
$0.85<br />
$0.88<br />
$0.0 $0.2 $0.4 $0.6 $0.8 $1.0<br />
Transperth Bus Operations<br />
Average cost per passenger kilometre<br />
<strong>The</strong> indicator reached $0.85, 2.49 per cent above the<br />
2010-11 result of $0.83 and 2.95 per cent below the<br />
target of $0.88 in <strong>2011</strong>-<strong>12</strong>.<br />
Cost of the services increased by 9.57 per cent to<br />
$385.533 million from $351.869 million in 2010-11<br />
and was 2.33 per cent above the budget target of<br />
$376.741 million. This was mainly due to the increased<br />
bus kilometres and passengers resulting in increased<br />
bus maintenance and operating costs.<br />
Passenger kilometres increased by 6.90 per cent to<br />
451.404 million from 422.251 million in 2010-11 and<br />
was 4.95 per cent above the target of 430.1<strong>12</strong> million.<br />
108 <strong>Public</strong> <strong>Transport</strong> <strong>Authority</strong> <strong>Annual</strong> <strong>Report</strong> <strong>2011</strong>-<strong>12</strong>
Transperth Ferry Services<br />
Transwa Rail Services<br />
Transwa Road Coach Services<br />
2008-09<br />
$0.93<br />
2008-09<br />
$0.41<br />
2008-09<br />
$0.24<br />
2009-10<br />
$1.22<br />
2009-10<br />
$0.44<br />
2009-10<br />
$0.20<br />
2010-11<br />
$1.15<br />
2010-11<br />
$0.43<br />
2010-11<br />
$0.22<br />
<strong>2011</strong>-<strong>12</strong><br />
$1.22<br />
<strong>2011</strong>-<strong>12</strong><br />
$0.40<br />
<strong>2011</strong>-<strong>12</strong><br />
$0.22<br />
Target <strong>2011</strong>-<strong>12</strong><br />
$1.11<br />
$0.0 $0.3 $0.6 $0.9 $1.2 $1.5<br />
Transperth Ferry Operations<br />
Average cost per passenger kilometre<br />
Target <strong>2011</strong>-<strong>12</strong><br />
$0.46<br />
$0.0 $0.1 $0.2 $0.3 $0.4 $0.5<br />
Transwa Rail<br />
Average cost per passenger kilometre<br />
Target <strong>2011</strong>-<strong>12</strong><br />
$0.22<br />
$0.00 $0.05 $0.10 $0.15 $0.20 $0.25<br />
Transwa Road Coaches<br />
Average cost per passenger kilometre<br />
<strong>The</strong> indicator reached $1.22, 6.14 per cent above the<br />
2010-11 result of $1.15 and 9.69 per cent above the<br />
target of $1.11 in <strong>2011</strong>-<strong>12</strong>.<br />
Cost of the services increased by 6.68 per cent<br />
to $0.796 million from $0.746 million in 2010-11<br />
and was 8.45 per cent above the budget target of<br />
$0.734 million. <strong>The</strong> increase in costs is due to the<br />
refurbishment of the MV Shelley Taylor-Smith ferry.<br />
Passenger kilometres increased by 0.51 per cent to<br />
653,744 from 650,446 in 2010-11 and was 1.10 per<br />
cent below the target of 661,000.<br />
<strong>The</strong> indicator reached $0.40, 5.29 per cent below the<br />
2010-11 result of $0.43 and <strong>12</strong>.16 per cent below the<br />
target of $0.46 in <strong>2011</strong>-<strong>12</strong>. This reduced cost is due<br />
to a 6.29 per cent increase in passenger kilometres<br />
from 72.215 million in 2010-11 to 76.756 million in<br />
<strong>2011</strong>-<strong>12</strong> (driven mainly by the 10.18 per cent increase<br />
in Prospector patronage) and a marginal 0.66 per cent<br />
increase in operating expenses.<br />
<strong>The</strong> indicator was on target and consistent with the<br />
previous year.<br />
109
2. Average Cost per 1000 Place Kilometres<br />
This indicator measures the cost efficiency of<br />
providing the service per 1000 place kilometres and<br />
it is calculated for each mode by dividing total cost<br />
by place kilometres and multiplying by 1,000. Place<br />
kilometres are calculated by multiplying the average<br />
fleet capacity by the service kilometres.<br />
Regional Bus Services: Intra-Town and<br />
Inter-Town Services<br />
2008-09<br />
2009-10<br />
2010-11<br />
<strong>2011</strong>-<strong>12</strong><br />
Target <strong>2011</strong>-<strong>12</strong><br />
$77.01<br />
$80.09<br />
$80.91<br />
$85.95<br />
$79.23<br />
$0 $20 $40 $60 $80 $100<br />
Regional Town Bus Services<br />
Intra and Inter-town services<br />
Average cost per 1000 Place Kilometres<br />
<strong>The</strong> indicator reached $85.95, 6.24 per cent above the<br />
2010-11 result of $80.91 and 8.49 per cent above the<br />
target of $79.23 in <strong>2011</strong>-<strong>12</strong>.<br />
<strong>The</strong> increase was due to the “one-off” additional<br />
expenditure related to the outsourcing of the<br />
TransGoldfields Bus service IE significant bus fleet<br />
repairs and maintenance costs in Bunbury and the<br />
recognition of the increased costs of operating a<br />
subsidised 4WD inter-town bus service in the<br />
Pilbara region.<br />
When compared to 2010-11, total passenger place<br />
kilometres for intra-town and inter-town services<br />
recorded a 3.89 per cent increase from 190.874 million<br />
to 198.298 million in <strong>2011</strong>-<strong>12</strong> and total costs increased<br />
by 10.37 per cent from $15.443 million to $17.045<br />
million in <strong>2011</strong>-<strong>12</strong>. Service kilometres also increased<br />
by 4.28 per cent from 2.843 million kilometres in<br />
2010-11 to 2.965 million in <strong>2011</strong>-<strong>12</strong>.<br />
Total Passenger Place Kilometres (millions)<br />
This indicator measures the total number of<br />
passengers that can be carried for the service<br />
kilometres.<br />
It is calculated for each mode of transport by<br />
multiplying the average fleet capacity by the service<br />
kilometres and this represents the capacity provided<br />
on each mode.<br />
<strong>The</strong> service kilometres for most intra-town services<br />
are calculated using the Transperth Route Information<br />
System (TRIS).<br />
Regional Bus Services: Intra-Town and<br />
Inter-Town Services<br />
2008-09<br />
2009-10<br />
2010-11<br />
<strong>2011</strong>-<strong>12</strong><br />
Target <strong>2011</strong>-<strong>12</strong><br />
182.6<br />
190.5<br />
190.9<br />
198.3<br />
190.3<br />
0 50 100 150 200<br />
Intra-town and Inter-town Bus Services<br />
Total passenger place kilometres (millions)<br />
<strong>The</strong> indicator reached 198.3, above the 2010-11<br />
result of 190.9 and above the target of 190.3 in<br />
<strong>2011</strong>-<strong>12</strong>. This is an increase of 3.89 per cent from<br />
2010-11 and 4.20 per cent above the target.<br />
Service kilometres increased by 4.28 per cent from<br />
2.843 million kilometres in 2010-11 to 2.965 million<br />
in <strong>2011</strong>-<strong>12</strong> mainly due to the inclusion of a new<br />
Dunsborough public school bus service in the<br />
intra-town service and general increases in service<br />
kilometres of the seven inter-town services.<br />
110 <strong>Public</strong> <strong>Transport</strong> <strong>Authority</strong> <strong>Annual</strong> <strong>Report</strong> <strong>2011</strong>-<strong>12</strong>
3. Average Cost per Contracted Kilometres<br />
Regional School Bus Services<br />
<strong>The</strong> cost of administering school bus services on a<br />
kilometre basis is calculated by dividing the total cost<br />
of school bus contracts and operating expenses by the<br />
total contracted kilometres.<br />
2008-09<br />
2009-10<br />
2010-11<br />
<strong>2011</strong>-<strong>12</strong><br />
Target <strong>2011</strong>-<strong>12</strong><br />
$3.22<br />
$3.27<br />
$3.39<br />
$3.63<br />
$3.80<br />
$0 $1 $2 $3 $4<br />
Regional School Bus Services<br />
Average cost per contracted kilometre<br />
<strong>The</strong> indicator reached $3.63, above the 2010-11 result<br />
of $3.39 and below the target of $3.80 in <strong>2011</strong>-<strong>12</strong>.<br />
This is an increase of 7.09 per cent from 2010-11<br />
and 4.35 per cent below the target.<br />
During the year, total costs increased by 6.26 per<br />
cent to $107.652 million from $101.310 million in<br />
2010-11. This includes the costs associated with the<br />
phased introduction of air conditioning and automatic<br />
transmission on contract school buses and the<br />
expansion of the cluster contract arrangements.<br />
Contract kilometres decreased by 0.78 per cent to<br />
29.617 million kilometres from 29.849 million in<br />
2010-11.<br />
Outcome 2: Protection of the<br />
long-term functionality of the rail<br />
corridor and railway infrastructure<br />
Effectiveness Indicator<br />
<strong>The</strong> most significant issue for this outcome is the<br />
management of the long-term lease of the rail freight<br />
infrastructure to Brookfield Rail Pty Ltd.<br />
Brookfield Rail manages and operates the rail<br />
freight infrastructure under the terms of the Railway<br />
Infrastructure Lease. Under the Lease, Brookfield Rail<br />
is the ‘accredited owner’ of the infrastructure as<br />
defined in the Rail Safety Act 1998.<br />
Under the terms and conditions of the Railway<br />
Infrastructure Lease, an independent inspection of the<br />
railway infrastructure is carried out every five years.<br />
<strong>The</strong> last independent inspection was completed in<br />
June 2010.<br />
<strong>The</strong> results of this inspection did not indicate any cause<br />
for concern and confirmed that the rail corridor and<br />
infrastructure was being satisfactorily maintained.<br />
Cost Efficiency<br />
<strong>The</strong> cost efficiency for the management of the<br />
long-term lease of the rail freight infrastructure to<br />
Brookfield Rail is monitored using the total cost of<br />
managing the rail corridor and residual freight issues.<br />
2008-09<br />
2009-10<br />
2010-11<br />
<strong>2011</strong>-<strong>12</strong><br />
Target <strong>2011</strong>-<strong>12</strong><br />
$100,346<br />
$1<strong>12</strong>,713<br />
$110,851<br />
$27,108<br />
$29,681<br />
$0 $30,000 $60,000 $90,000 $<strong>12</strong>0,000<br />
Cost of managing rail corridor and residual<br />
freight issues management ($’000s)<br />
<strong>The</strong> cost of managing the rail corridor and residual<br />
freight issues in <strong>2011</strong>-<strong>12</strong> was above the target by<br />
1.68 per cent mainly due to a “one-off” subsidy paid to<br />
Brookfield Rail to keep some Tier 3 lines open whilst<br />
adjacent roads were upgraded and the increased<br />
depreciation resulting from grain re-sleepering program.<br />
<strong>The</strong> significant increase in 2010-11 was the result of<br />
a revaluation of the freight network which increased<br />
the depreciation costs by $76 million.<br />
111
Financial<br />
statements<br />
For the year ended 30 June 20<strong>12</strong><br />
Statement of comprehensive income 114<br />
Statement of financial position 115<br />
Statement of changes in equity 116<br />
Statement of cash flows 117<br />
Notes to the financial statements 118<br />
1 Australian Accounting Standards 118<br />
2 Summary of significant accounting policies 118<br />
3 Judgement made by management in applying<br />
accounting policies <strong>12</strong>5<br />
4 Key sources of estimation uncertainty <strong>12</strong>5<br />
5 Disclosure of changes in accounting policy<br />
and estimates <strong>12</strong>6<br />
6 Employee benefits expense 130<br />
7 Supplies and services 130<br />
8 Depreciation and amortisation expense 131<br />
9 Finance costs 131<br />
10 Grants and subsidies expense 132<br />
11 Other expenses 132<br />
<strong>12</strong> User charges and fees 132<br />
13 Operating lease revenue 133<br />
14 Commonwealth grants and contributions 133<br />
15 Interest revenue 133<br />
16 Other revenue 134<br />
17 Net loss on disposal of non-current assets 134<br />
18 Income from State Government 135<br />
19 Restricted cash and cash equivalents 136<br />
20 Inventories 136<br />
21 Receivables 137<br />
22 Amounts receivable for services<br />
(Holding Account) 137<br />
23 Infrastructure, property, plant, equipment<br />
and vehicles 138<br />
24 Intangible assets 140<br />
25 Non-current assets classified as held for sale 141<br />
26 Impairment of assets 141<br />
27 Payables 141<br />
28 Borrowings 142<br />
29 Provisions 142<br />
30 Other current liabilities 145<br />
31 Deferred income – operating leases 145<br />
32 Equity 145<br />
33 Notes to the Statement of Cash Flows 146<br />
34 Commitments 147<br />
35 Contingent liabilities and contingent assets 149<br />
36 Remuneration of members of the accountable<br />
authority and senior officers 149<br />
37 Financial instruments 150<br />
38 Supplementary financial information 156<br />
39 Events occurring after the end of<br />
reporting period 156<br />
40 Explanatory statement 156<br />
41 Schedule of income and expenses by service 159<br />
42 Remuneration of auditor 160<br />
1<strong>12</strong> <strong>Public</strong> <strong>Transport</strong> <strong>Authority</strong> <strong>Annual</strong> <strong>Report</strong> <strong>2011</strong>-<strong>12</strong>
Certification of<br />
financial statements<br />
For the year ended 30 June 20<strong>12</strong><br />
<strong>The</strong> accompanying financial statements of the <strong>Public</strong> <strong>Transport</strong> <strong>Authority</strong> of <strong>Western</strong> Australia have been prepared<br />
in compliance with the provisions of the Financial Management Act 2006 from proper accounts and records to<br />
present fairly the financial transactions for the financial year ended 30 June 20<strong>12</strong> and the financial position as<br />
at 30 June 20<strong>12</strong>.<br />
At the date of signing we are not aware of any circumstances which would render the particulars included in the<br />
financial statements misleading or inaccurate.<br />
R Waldock<br />
K Kirk<br />
Accountable <strong>Authority</strong><br />
Chief Finance Officer<br />
13 September 20<strong>12</strong> 13 September 20<strong>12</strong><br />
113
Statement of<br />
comprehensive<br />
income<br />
For the year ended 30 June 20<strong>12</strong><br />
Cost of Services<br />
Expenses<br />
Employee benefits expense 6 135,193 <strong>12</strong>5,936<br />
Supplies and services 7 201,439 184,032<br />
Depreciation and amortisation expense 8 245,646 242,957<br />
Finance costs 9 67,672 66,318<br />
Grants and subsidies 10 379,867 345,647<br />
Energy and fuel 25,236 22,545<br />
Loss on disposal of non-current assets 17 816 101<br />
Other expenses 11 20,818 16,168<br />
Total cost of services 1,076,687 1,003,704<br />
Note<br />
20<strong>12</strong><br />
$000<br />
<strong>2011</strong><br />
$000<br />
Income<br />
Revenue<br />
User charges and fees <strong>12</strong> 192,003 170,869<br />
Operating lease revenue 13 5,466 5,466<br />
Commonwealth grants and contributions 14 466 440<br />
Interest revenue 15 3,<strong>12</strong>5 2,042<br />
Other revenue 16 32,164 52,483<br />
Total revenue 233,224 231,300<br />
Total income other than income from State Government 233,224 231,300<br />
Net Cost of Services 843,463 772,404<br />
Income from State Government 18<br />
Service appropriation 776,189 731,186<br />
Resources received free of charge 455 361<br />
Royalties for Regions Fund 3,007 1,900<br />
Contribution – other government agencies 1,437 992<br />
Total income from State Government 781,088 734,439<br />
(Deficit)/surplus for the period (62,375) (37,965)<br />
Refer to note 41 ‘Schedule of income and expense by service’.<br />
<strong>The</strong> Statement of Comprehensive Income should be read in<br />
conjunction with the accompanying notes.<br />
Other Comprehensive Income<br />
Changes in asset revaluation surplus 32 19,184 6,542<br />
Total other comprehensive income 19,184 6,542<br />
Total comprehensive income for the period (43,191) (31,423)<br />
114 <strong>Public</strong> <strong>Transport</strong> <strong>Authority</strong> <strong>Annual</strong> <strong>Report</strong> <strong>2011</strong>-<strong>12</strong>
Statement of<br />
financial position<br />
As at 30 June 20<strong>12</strong><br />
Assets<br />
Current Assets<br />
Cash and cash equivalents 33 48,138 66,608<br />
Restricted cash and cash equivalents 19 30,595 28,239<br />
Inventories 20 13,147 <strong>12</strong>,846<br />
Receivables 21 26,291 21,546<br />
Amounts receivable for services 22 24,836 47,692<br />
Non-current assets classified as held for sale 25 <strong>12</strong>,100 15,885<br />
Total Current Assets 155,107 192,816<br />
Note<br />
20<strong>12</strong><br />
$000<br />
<strong>2011</strong><br />
$000<br />
Non-Current Assets<br />
Restricted cash and cash equivalents 19 2,984 0<br />
Amounts receivable for services 22 1,003,301 855,537<br />
Infrastructure, property, plant, equipment and vehicles 23 5,261,107 5,137,088<br />
Intangible assets 24 1,599 3,014<br />
Total Non-Current Assets 6,268,991 5,995,639<br />
Total Assets 6,424,098 6,188,455<br />
Liabilities<br />
Current Liabilities<br />
Payables 27 97,789 105,365<br />
Borrowings 28 59,918 78,382<br />
Provisions 29 42,219 35,267<br />
Other current liabilities 30 211 1,254<br />
Deferred income operating lease 31 5,466 5,466<br />
Total Current Liabilities 205,603 225,734<br />
Non-Current Liabilities<br />
Borrowings 28 1,258,651 1,156,826<br />
Provisions 29 7,966 8,462<br />
Deferred income operating lease 31 203,789 209,255<br />
Total Non-Current Liabilities 1,470,406 1,374,543<br />
Total Liabilities 1,676,009 1,600,277<br />
Net Assets 4,748,089 4,588,178<br />
<strong>The</strong> Statement of Financial Position should be read in conjunction<br />
with the accompanying notes.<br />
Equity 32<br />
Contributed equity 2,760,107 2,557,005<br />
Reserves 1,977,497 1,958,313<br />
Accumulated surplus 10,485 72,860<br />
Total Equity 4,748,089 4,588,178<br />
115
Statement of<br />
changes in equity<br />
For the year ended 30 June 20<strong>12</strong><br />
Contributed<br />
equity<br />
Reserves<br />
Accumulated<br />
surplus/ (deficit)<br />
Total equity<br />
Note $000 $000 $000 $000<br />
Balance at 1 July 2010 32 2,414,434 1,951,771 110,825 4,477,030<br />
Surplus/(deficit) 0 0 (37,965) (37,965)<br />
Other comprehensive income 0 6,542 0 6,542<br />
Total comprehensive<br />
income for the period 0 6,542 (37,965) (31,423)<br />
Transactions with owners in their<br />
capacity as owners:<br />
Capital appropriations 88,721 0 0 88,721<br />
Other contributions by owners 55,010 0 0 55,010<br />
Distributions to owners (1,160) 0 0 (1,160)<br />
Total 142,571 0 0 142,571<br />
Balance at 30 June <strong>2011</strong> 2,557,005 1,958,313 72,860 4,588,178<br />
Balance at 1 July <strong>2011</strong> 2,557,005 1,958,313 72,860 4,588,178<br />
Surplus/(deficit) 0 0 (62,375) (62,375)<br />
Other comprehensive income 0 19,184 0 19,184<br />
Total comprehensive income<br />
for the period 0 19,184 (62,375) (43,191)<br />
Transactions with owners in their<br />
capacity as owners:<br />
Capital appropriations 201,813 0 0 201,813<br />
Other contributions by owners 1,539 0 0 1,539<br />
Distributions to owners (250) 0 0 (250)<br />
Total 203,102 0 0 203,102<br />
Balance at 30 June 20<strong>12</strong> 2,760,107 1,977,497 10,485 4,748,089<br />
<strong>The</strong> Statement of Changes in Equity should be read in conjunction<br />
with the accompanying notes.<br />
116 <strong>Public</strong> <strong>Transport</strong> <strong>Authority</strong> <strong>Annual</strong> <strong>Report</strong> <strong>2011</strong>-<strong>12</strong>
Statement of cash flows<br />
For the year ended 30 June 20<strong>12</strong><br />
Cash Flows from State Government<br />
Service appropriation 611,324 569,057<br />
Capital appropriation – other government agencies 490 992<br />
Capital appropriation 201,813 88,721<br />
Royalties for Regions Fund 3,007 1,900<br />
Holding account drawdown 39,958 0<br />
Net cash provided by State Government 856,592 660,670<br />
Note<br />
20<strong>12</strong><br />
$000<br />
<strong>2011</strong><br />
$000<br />
<strong>The</strong> Statement of Cash Flows should be read in conjunction<br />
with the accompanying notes.<br />
Utilised as follows:<br />
Cash Flows from Operating Activities<br />
Payments<br />
Employee benefits (137,233) (119,018)<br />
Supplies and services (227,222) (209,324)<br />
Finance costs (67,639) (67,524)<br />
Grants and subsidies (380,767) (336,162)<br />
Receipts paid into consolidated account (3,052) 0<br />
GST payments on purchases (94,981) (70,693)<br />
Other payments (10,781) (8,657)<br />
Receipts<br />
User charges and fees: Transwa 11,917 10,985<br />
User charges and fees: Transperth train operations and buses 197,699 172,818<br />
Commonwealth grants and contributions 466 440<br />
Interest received 2,686 1,662<br />
GST receipts on sales 22,225 22,183<br />
GST receipts from taxation authority 71,345 48,102<br />
Other receipts 14,369 39,795<br />
Net cash used in operating activities 33 (600,968) (515,393)<br />
Cash Flows from Investing Activities<br />
Payments<br />
Purchase of non-current physical assets (352,408) (179,133)<br />
Receipts<br />
Proceeds from sale of non-current physical assets 292 390<br />
Net cash used in investing activities (352,116) (178,743)<br />
Cash Flows from Financing Activities<br />
Payments<br />
Repayment of borrowings (79,667) (50,353)<br />
Other repayments (365) (389)<br />
Receipts<br />
Proceeds from borrowings 163,394 <strong>12</strong>5,000<br />
Net cash provided by financing activities 83,362 74,258<br />
Net (decrease)/increase in cash and cash equivalents (13,130) 40,792<br />
Cash and cash equivalents at the beginning of the period 94,847 54,055<br />
Cash and Cash Equivalents at the end of the period 33 81,717 94,847<br />
117
Notes to the<br />
financial statements<br />
For the year ended 30 June 20<strong>12</strong><br />
1 Australian Accounting Standards<br />
General<br />
<strong>The</strong> <strong>Public</strong> <strong>Transport</strong> <strong>Authority</strong> of <strong>Western</strong> Australia’s<br />
(PTA) financial statements for the year ended 30 June<br />
20<strong>12</strong> have been prepared in accordance with Australian<br />
Accounting Standards. <strong>The</strong> term ‘Australian Accounting<br />
Standards’ includes Standards and Interpretations<br />
issued by the Australian Accounting Standards<br />
Board (AASB).<br />
<strong>The</strong> PTA has adopted any applicable, new and<br />
revised Australian Accounting Standards from their<br />
operative dates.<br />
Early adoption of standards<br />
<strong>The</strong> PTA cannot early adopt an Australian Accounting<br />
Standard unless specifically permitted by TI 1101<br />
Application of Australian Accounting Standards and<br />
Other Pronouncements. <strong>The</strong>re has been no early<br />
adoption of Australian Accounting Standards that have<br />
been issued or amended, but not operative by the PTA<br />
for the annual reporting period ended 30 June 20<strong>12</strong>.<br />
2 Summary of significant<br />
accounting policies<br />
a) General statement<br />
<strong>The</strong> PTA is a not-for-profit reporting entity that<br />
prepares general purpose financial statements in<br />
accordance with Australian Accounting Standards, the<br />
Framework, Statements of Accounting Concepts and<br />
other authoritative pronouncements of the AASB as<br />
applied by the Treasurer’s Instructions. Several of these<br />
are modified by the Treasurer’s Instructions to vary<br />
application, disclosure, format and wording.<br />
<strong>The</strong> Financial Management Act and the Treasurer’s<br />
Instructions impose legislative provisions that govern<br />
the preparation of financial statements and take<br />
precedence over Australian Accounting Standards, the<br />
Framework, Statements of Accounting Concepts and<br />
other authoritative pronouncements of the AASB.<br />
Where modification is required and has had a material<br />
or significant financial effect upon the reported results,<br />
details of that modification and the resulting financial<br />
effect are disclosed in the notes to the financial<br />
statements.<br />
b) Basis of preparation<br />
<strong>The</strong> financial statements have been prepared on the<br />
accrual basis of accounting using the historical cost<br />
convention, except for land, buildings, rollingstock,<br />
vessels, buses and infrastructure which have been<br />
measured at fair value.<br />
<strong>The</strong> accounting policies adopted in the preparation of<br />
the financial statements have been consistently applied<br />
throughout all periods presented unless otherwise<br />
stated.<br />
<strong>The</strong> financial statements are presented in Australian<br />
dollars and all values are rounded to the nearest<br />
thousand dollars ($’000).<br />
Note 3 ‘Judgements made by management in<br />
applying accounting policies’ discloses judgements<br />
that have been made in the process of applying<br />
the PTA’s accounting policies resulting in the most<br />
significant effect on amounts recognised in the financial<br />
statements.<br />
Note 4 ‘Key sources of estimation uncertainty’<br />
discloses key assumptions made concerning the future,<br />
and other key sources of estimation uncertainty at<br />
the end of the reporting period, that have a significant<br />
risk of causing a material adjustment to the carrying<br />
amounts of assets and liabilities within the next<br />
financial year.<br />
118 <strong>Public</strong> <strong>Transport</strong> <strong>Authority</strong> <strong>Annual</strong> <strong>Report</strong> <strong>2011</strong>-<strong>12</strong>
c) <strong>Report</strong>ing entity<br />
<strong>The</strong> PTA is the reporting entity and there are no other<br />
related or affiliated bodies.<br />
d) Contributed equity<br />
AASB Interpretation 1038 Contributions by Owners<br />
Made to Wholly-Owned <strong>Public</strong> Sector Entities requires<br />
transfers in the nature of equity contributions, other<br />
than as a result of a restructure of administrative<br />
arrangements, to be designated by the Government<br />
(the owner) as contributions by owners (at the<br />
time of, or prior to transfer) before such transfers<br />
can be recognised as equity contributions. Capital<br />
appropriations have been designated as contributions<br />
by owners by TI 955 Contributions by Owners made<br />
to Wholly-Owned <strong>Public</strong> Sector Entities and have<br />
been credited directly to Contributed Equity.<br />
<strong>The</strong> transfers of net assets to/from other agencies,<br />
other than as a result of a restructure of administrative<br />
arrangements, are designated as contributions by<br />
owners where the transfers are non-discretionary and<br />
non-reciprocal. (See note 32 ‘Equity’).<br />
e) Income<br />
Revenue recognition<br />
Revenue is recognised and measured at the fair value<br />
of consideration received or receivable. <strong>The</strong> following<br />
specific recognition criteria must also be met before<br />
revenue is recognised for the major business activities<br />
as follows:<br />
Sale of goods<br />
Revenue is recognised from the sale of goods and<br />
disposal of other assets when the significant risks and<br />
rewards of ownership control transfer to the purchaser<br />
and can be measured reliably.<br />
Provision of services<br />
Revenue is recognised by reference to the stage of<br />
completion of the transaction, except for the following:<br />
i) Cash fares collected by contractors delivering<br />
bus services to PTA are accounted for at the<br />
time the contract for services invoice is approved<br />
for payment.<br />
ii) MultiRider fares collected by contractors<br />
delivering bus services to PTA in WA’s regional<br />
areas are accounted for at the time the contract<br />
for services invoice is approved for payment.<br />
Unused MultiRider travel entitlements are<br />
not recognised as liabilities in the financial<br />
statements.<br />
Interest<br />
Revenue is recognised as the interest accrues.<br />
Lease income<br />
Lease income from operating leases is recognised as<br />
income on a straight-line basis over the term of the<br />
lease. (See note 13 ‘Operating lease revenue’ and<br />
note 31 ‘Deferred income – operating leases’).<br />
Service appropriations<br />
Service appropriations are recognised as revenues<br />
at fair value in the period in which the PTA gains<br />
control of the appropriated funds. <strong>The</strong> PTA gains<br />
control of appropriated funds at the time those funds<br />
are deposited to the bank account or credited to the<br />
‘Amounts receivable for services’ (holding account)<br />
held at Treasury. (See note 18 ‘Income from State<br />
Government’).<br />
Grants, donations, gifts and other non-reciprocal<br />
contributions<br />
Revenue is recognised at fair value when the PTA<br />
obtains control over the assets comprising the<br />
contributions, usually when cash is received.<br />
Other non-reciprocal contributions that are not<br />
contributions by owners are recognised at their fair<br />
value. Contributions of services are only recognised<br />
when a fair value can be reliably determined and the<br />
services would be purchased if not donated.<br />
Royalties for Regions funds are recognised as revenue<br />
at fair value in the period in which the PTA obtains<br />
control over the funds. <strong>The</strong> PTA obtains control of the<br />
funds at the time the funds are deposited into the PTA’s<br />
bank account.<br />
Infringements<br />
Infringements are recorded on a cash basis.<br />
Gains<br />
Realised and unrealised gains are usually recognised<br />
on a net basis. <strong>The</strong>se include gains arising on the<br />
disposal of non-current assets and some revaluations<br />
of non-current assets.<br />
f) Borrowing costs<br />
All borrowing costs are recognised as expenses<br />
in the period in which they are incurred. (See note<br />
3 ‘Judgement made by management in applying<br />
accounting policies’).<br />
g) Infrastructure, property, plant and equipment<br />
and vehicles<br />
Capitalisation/Expensing of assets<br />
Items of infrastructure, property, plant and equipment<br />
and vehicles costing $5,000 or more are recognised<br />
as assets and the cost of utilising assets is expensed<br />
(depreciated) over their useful lives. Items of<br />
infrastructure, property, plant and equipment and<br />
vehicles costing less than $5,000 are immediately<br />
expensed direct to the Statement of Comprehensive<br />
Income (other than where they form part of a group of<br />
similar items which are significant in total).<br />
119
Initial recognition and measurement<br />
All items of infrastructure, property, plant and<br />
equipment and vehicles are initially recognised at cost.<br />
For items of infrastructure, property, plant and<br />
equipment and vehicles acquired at no cost or for<br />
nominal cost, the cost is their fair value at the date of<br />
acquisition.<br />
Subsequent measurement<br />
Subsequent to initial recognition as an asset, the<br />
revaluation model is used for the measurement of land,<br />
buildings, urban rail system and bus infrastructure,<br />
rollingstock, vessels and buses and the historical cost<br />
for plant and equipment and motor vehicles. Land<br />
is carried at fair value and accumulated impairment<br />
losses. Buildings, urban rail system, freight network<br />
infrastructure and bus infrastructure are carried at fair<br />
value less accumulated depreciation and accumulated<br />
impairment losses. Plant and equipment and motor<br />
vehicles are stated at historical cost less accumulated<br />
depreciation and accumulated impairment losses.<br />
Where market-based evidence is available, the fair<br />
value of land and buildings is determined on the<br />
basis of current market buying values determined<br />
by reference to recent market transactions. When<br />
buildings are revalued by reference to recent market<br />
transactions, the accumulated depreciation is<br />
eliminated against the gross carrying amount of the<br />
asset and the net amount restated to the revalued<br />
amount.<br />
In absence of market-based evidence, the fair value<br />
of land and buildings is determined on the basis of<br />
existing use. This normally applies where buildings are<br />
specialised or where land use is restricted. Fair value<br />
for existing use assets is determined by reference to<br />
the cost of replacing the remaining future economic<br />
benefits embodied in the asset, IE the depreciated<br />
replacement cost. Where the fair value of buildings<br />
is determined on the depreciated replacement cost<br />
basis, the gross carrying amount and the accumulated<br />
depreciation are restated proportionately.<br />
<strong>The</strong> revaluation of land controlled by the PTA including<br />
metropolitan and regional corridor land, not subject<br />
to commercial lease, is provided independently on<br />
an annual basis by the <strong>Western</strong> Australian Land<br />
Information <strong>Authority</strong> (Valuation Services) and<br />
recognised annually to ensure that the carrying amount<br />
does not differ materially from the asset’s fair value at<br />
the end of reporting period.<br />
Land and buildings which are commercially leased<br />
are independently valued at fair value based on the<br />
capitalised value of current leases. Independent<br />
valuations are obtained annually.<br />
Buildings, bus infrastructure, rollingstock, vessels<br />
and buses have been revalued at fair value using<br />
depreciated replacement cost by independent valuers,<br />
engineering and management professionals. Valuations<br />
are obtained every 3 to 5 years.<br />
Urban rail system infrastructure and freight network<br />
infrastructure are revalued, at least once every<br />
five years, to its fair value based on depreciated<br />
replacement cost, as the assets are specialised and a<br />
market value does not exist.<br />
When infrastructure is revalued, the accumulated<br />
depreciation is restated proportionately with the change<br />
in the gross carrying amount of the asset so that the<br />
carrying amount of the asset after revaluation equals its<br />
revalued amount.<br />
Construction in progress is recognised at cost.<br />
<strong>The</strong> most significant assumptions in estimating<br />
fair value are made in assessing whether to apply<br />
the existing use basis to assets and in determining<br />
estimated useful life. Professional judgement by the<br />
valuer is required where the evidence does not provide<br />
a clear distinction between market type assets and<br />
existing use assets.<br />
Derecognition<br />
Upon disposal or derecognition of an item of property,<br />
plant and equipment, infrastructure and vehicles, any<br />
revaluation surplus relating to that asset is retained in<br />
the asset revaluation surplus.<br />
Asset revaluation surplus<br />
<strong>The</strong> asset revaluation surplus is used to record<br />
increments and decrements on the revaluation of noncurrent<br />
assets as described in note 23 ‘Infrastructure,<br />
property, plant, equipment and vehicles’.<br />
Depreciation<br />
All non-current assets having a limited useful life are<br />
systematically depreciated over their estimated useful<br />
lives in a manner which reflects the consumption of<br />
their future economic benefits.<br />
Depreciation is calculated using the straight-line<br />
method, using rates which are reviewed annually.<br />
Estimated useful lives for each class of depreciable<br />
asset are:<br />
Class of Asset<br />
Buildings<br />
Rollingstock<br />
Infrastructure<br />
Plant and equipment<br />
Buses<br />
Motor vehicles<br />
Vessels<br />
Office equipment<br />
Useful Life<br />
30 to 50 years<br />
30 years<br />
15 to 75 years<br />
10 to 15 years<br />
7 to 18 years<br />
5 to 10 years<br />
10 years<br />
3 to 5 years<br />
<strong>12</strong>0 <strong>Public</strong> <strong>Transport</strong> <strong>Authority</strong> <strong>Annual</strong> <strong>Report</strong> <strong>2011</strong>-<strong>12</strong>
Assets under construction are not depreciated until<br />
they are available for use.<br />
Land is not depreciated.<br />
h) Intangible assets<br />
Capitalisation/Expensing of assets<br />
Acquisitions of intangible assets costing $5,000 or<br />
more and internally generated intangible assets costing<br />
$5,000 or more are capitalised. <strong>The</strong> cost of utilising the<br />
assets is expensed (amortised) over their useful lives.<br />
Costs incurred below these thresholds are immediately<br />
expensed directly to the Statement of Comprehensive<br />
Income.<br />
Intangible assets are initially recognised at cost.<br />
For assets acquired at no cost or for nominal cost,<br />
the cost is their fair value at the date of acquisition.<br />
<strong>The</strong> cost model is applied for subsequent<br />
measurement requiring the asset to be carried at cost<br />
less any accumulated amortisation and accumulated<br />
impairment losses.<br />
Amortisation for intangible assets with finite useful lives<br />
is calculated for the period of the expected benefit<br />
(estimated useful life which is reviewed annually) on the<br />
straight-line basis. All intangible assets controlled by<br />
the PTA have a finite useful life and zero residual value.<br />
<strong>The</strong> expected useful lives for each class of intangible<br />
asset are:<br />
Class of Intangible asset<br />
Software*<br />
Website costs<br />
Useful Life<br />
3 to 5 years<br />
3 to 5 years<br />
* Software that is not integral to the operation of any<br />
related hardware.<br />
i) Computer software<br />
Software that is an integral part of the related<br />
hardware is recognised as property, plant and<br />
equipment. Software that is not an integral<br />
part of the related hardware is recognised as<br />
an intangible asset. Software costing less than<br />
$5,000 is expensed in the year of acquisition.<br />
ii) Website costs<br />
Website costs are charged as expenses when<br />
they are incurred unless they relate to the<br />
acquisition or development of an asset when<br />
they may be capitalised or amortised. Generally,<br />
costs in relation to feasibility studies during<br />
the planning phase of a website, and ongoing<br />
costs of maintenance during the operating<br />
phase are expensed. Costs incurred in building<br />
or enhancing a website, to the extent that they<br />
represent probable future economic benefits that<br />
can be reliably measured, are capitalised.<br />
i) Impairment of assets<br />
Property, plant and equipment, infrastructure, vehicles<br />
and intangible assets are tested for any indication of<br />
impairment at the end of each reporting period. Where<br />
there is an indication of impairment, the recoverable<br />
amount is estimated. Where the recoverable amount is<br />
less than the carrying amount, the asset is considered<br />
impaired and is written down to the recoverable<br />
amount and an impairment loss is recognised. As the<br />
PTA is a not-for-profit entity, unless an asset has been<br />
identified as a surplus asset, the recoverable amount is<br />
the higher of an asset’s fair value less costs to sell and<br />
depreciated replacement cost.<br />
<strong>The</strong> risk of impairment is generally limited to<br />
circumstances where an asset’s depreciation is<br />
materially understated, where the replacement cost<br />
is falling or where there is a significant change in<br />
useful life. Each relevant class of assets is reviewed<br />
annually to verify that the accumulated depreciation/<br />
amortisation reflects the level of consumption or<br />
expiration of asset’s future economic benefits and<br />
to evaluate any impairment risk from falling<br />
replacement costs.<br />
Intangible assets with an indefinite useful life and<br />
intangible assets not yet available for use are tested<br />
for impairment at the end of each reporting period<br />
irrespective of whether there is any indication of<br />
impairment.<br />
<strong>The</strong> recoverable amount of assets identified as surplus<br />
assets is the higher of fair value less costs to sell and<br />
the present value of future cash flows expected to<br />
be derived from the asset. Surplus assets carried at<br />
fair value have no risk of material impairment where<br />
fair value is determined by reference to market-based<br />
evidence. Where fair value is determined by reference<br />
to the depreciated replacement cost, surplus assets<br />
are at risk of impairment and the recoverable amount<br />
is measured. Surplus assets at cost are tested for<br />
indications of impairments at the end of each reporting<br />
period.<br />
Refer to note 26 ‘Impairment of assets’ for the<br />
outcome of impairment reviews and testing.<br />
j) Non-current assets (or disposal groups)<br />
classified as held for sale<br />
Non-current assets (or disposal groups) held for sale<br />
are recognised at the lower of carrying amount or fair<br />
value less costs to sell, and are disclosed separately<br />
from other assets in the Statement of Financial<br />
Position. Assets classified as held for sale are not<br />
depreciated or amortised.<br />
<strong>12</strong>1
k) Leases<br />
<strong>The</strong> PTA has entered into a number of operating lease<br />
arrangements where the lessor effectively retains the<br />
entire risks and benefits incident to ownership of the<br />
items held under the operating leases. Operating<br />
leases are expensed on a straight line basis over the<br />
term of the lease as this represents the pattern of<br />
benefits derived from the leased properties.<br />
l) Prepaid lease revenue<br />
<strong>The</strong> sale of the Westrail Freight Business on 17<br />
December 2000 included an operating lease of the<br />
freight network infrastructure for 49 years between<br />
the <strong>Western</strong> Australian Government Railways<br />
Commission (WAGR) – now <strong>Public</strong> <strong>Transport</strong> <strong>Authority</strong><br />
of <strong>Western</strong> Australia (PTA) and Westnet Rail Pty Ltd<br />
– now Brookfield Rail Pty Ltd. <strong>The</strong> lease rentals were<br />
fully prepaid on 17 December 2000, and credited to<br />
deferred operating lease revenue. 133 grain receival<br />
sites were leased for a 99 year period in two tranches<br />
in 2003 and 2004. <strong>The</strong> rental for sites was prepaid<br />
and credited to deferred income operating lease.<br />
(See note 2(e)).<br />
m) Financial instruments<br />
In addition to cash and cash equivalents, the PTA has<br />
two categories of financial instruments:<br />
• Loans and receivables<br />
• Financial liabilities measured at amortised cost.<br />
Financial instruments have been disaggregated into the<br />
following classes:<br />
• Financial Assets<br />
−−<br />
Cash and cash equivalents<br />
−−<br />
Restricted cash and cash equivalents<br />
−−<br />
Receivables<br />
−−<br />
Amounts receivable for services<br />
• Financial Liabilities<br />
−−<br />
Payables<br />
−−<br />
Other current liabilities<br />
−−<br />
<strong>Western</strong> Australian Treasury Corporation<br />
(WATC) loans<br />
−−<br />
Commonwealth loans<br />
Initial recognition and measurement of financial<br />
instruments is at fair value which normally equates to<br />
the transaction cost or the face value. Subsequent<br />
measurement is at amortised cost using the effective<br />
interest method.<br />
<strong>The</strong> fair value of short-term receivables and payables<br />
is the transaction cost or the face value because<br />
there is no interest rate applicable and subsequent<br />
measurement is not required as the effect of<br />
discounting is not material.<br />
When a foreign exchange contract (FEC) is entered<br />
into, no amount is recognised through the Statement<br />
of Comprehensive Income or the Statement of<br />
Financial Position. When the FEC are utilised, the<br />
differences between the prevailing spot rate and the<br />
original or revised FEC rate are recognised through the<br />
Statement of Comprehensive Income.<br />
At the end of reporting period the fair value change<br />
in the remaining FEC balance is recognised in the<br />
Statement of Comprehensive Income creating a<br />
derivative asset or liability. This is calculated by<br />
comparing the original FEC rate and the current<br />
forward rate.<br />
n) Cash and cash equivalents<br />
For the purpose of the Statement of Cash Flows, cash<br />
and cash equivalents (and restricted cash and cash<br />
equivalents) assets comprise of cash on hand.<br />
o) Accrued salaries<br />
Accrued salaries (refer to note 27 ‘Payables’) represent<br />
the amount due to staff but unpaid at the end of the<br />
financial year. Accrued salaries are settled within a<br />
fortnight of the financial year end. <strong>The</strong> PTA considers<br />
the carrying amount of accrued salaries to be<br />
equivalent to its fair value.<br />
p) Amounts receivable for services (Holding<br />
account)<br />
<strong>The</strong> PTA receives income from the State Government<br />
partly in cash and partly as an asset (holding account<br />
receivable). <strong>The</strong> accrued amount appropriated is<br />
accessible on the emergence of the cash funding<br />
requirement to cover leave entitlements and asset<br />
replacement.<br />
q) Inventories<br />
Inventories are measured at the lower of cost or net<br />
realisable value. Costs are assigned by the method<br />
most appropriate to each particular class of inventory.<br />
Inventory recorded using the inventory control system<br />
is valued at the weighted average cost and the<br />
remainder is valued on a first in first out basis.<br />
Inventories not held for resale are measured at<br />
cost unless they are no longer required, in which<br />
case they are measured at net realisable value.<br />
(See note 20 ‘Inventories’).<br />
r) Receivables<br />
Receivables are recognised at original invoice amount<br />
less an allowance for any uncollectible amounts<br />
(IE impairment).<br />
<strong>The</strong> collectability of receivables is reviewed on an<br />
ongoing basis and any receivables identified as<br />
uncollectible are written off against the allowance<br />
account. <strong>The</strong> allowance for uncollectible amounts<br />
(doubtful debts) is raised when there is objective<br />
<strong>12</strong>2 <strong>Public</strong> <strong>Transport</strong> <strong>Authority</strong> <strong>Annual</strong> <strong>Report</strong> <strong>2011</strong>-<strong>12</strong>
evidence that the PTA will not be able to collect the<br />
debts. <strong>The</strong> carrying amount is equivalent to fair value<br />
as they are generally settled within 30 days. (See note<br />
2(m) ‘Financial instruments’ and note 21 ‘Receivables’).<br />
s) Payables<br />
Payables are recognised when the PTA becomes<br />
obliged to make future payments as a result of a<br />
purchase of assets or services. <strong>The</strong> carrying amount<br />
is equivalent to fair value, as settlement is generally<br />
30 days. (See note 2(m) ‘Financial instruments’ and<br />
note 27 ‘Payables’).<br />
t) Borrowings<br />
All loans payable are initially recognised at fair value,<br />
being the net proceeds received. Subsequent<br />
measurement is at amortised cost using the effective<br />
interest rate method. (See note 2(m) ‘Financial<br />
instruments’ and note 28 ‘Borrowings’).<br />
u) Provisions<br />
Provisions are liabilities of uncertain timing or amount<br />
and are recognised where there is a present legal or<br />
constructive obligation as a result of a past event and<br />
when the outflow of resources embodying economic<br />
benefits is probable and a reliable estimate can be<br />
made of the amount of the obligation. Provisions are<br />
reviewed at the end of reporting period. (See note<br />
29 ‘Provisions’).<br />
(i) Provisions – employee benefits<br />
All annual leave and long service leave provisions<br />
are in respect of employees’ services up to the<br />
end of the reporting period.<br />
<strong>Annual</strong> leave<br />
<strong>The</strong> liability for annual leave that is expected to<br />
be settled within <strong>12</strong> months after the end of the<br />
reporting period is recognised and measured at<br />
the undiscounted amounts expected to be paid<br />
when the liability is settled.<br />
<br />
<br />
<br />
<br />
<strong>Annual</strong> leave that is not expected to be settled<br />
within <strong>12</strong> months after the end of the reporting<br />
period is recognised and measured at the<br />
present value of amounts expected to be<br />
paid when the liabilities are settled using the<br />
remuneration rate expected to apply at the<br />
time of settlement.<br />
When assessing expected future payments<br />
consideration is given to expected future<br />
wage and salary levels including non-salary<br />
components such as employer superannuation<br />
contributions, as well as the experience of<br />
employee departures and periods of service.<br />
<strong>The</strong> expected future payments are discounted<br />
using market yields at the end of the reporting<br />
period on national government bonds with terms<br />
to maturity that match, as closely as possible,<br />
the estimated future cash outflows.<br />
<strong>The</strong> provision for annual leave is classified as<br />
a current liability as the PTA does not have an<br />
unconditional right to the defer settlement of the<br />
liability for at least <strong>12</strong> months after the reporting<br />
period.<br />
Long service leave<br />
A liability for long service leave is recognised<br />
after an employee has completed seven years<br />
of service except for wages employees first ten<br />
years of service and subsequently seven years of<br />
service, based on remuneration rates current as<br />
at the end of the reporting period.<br />
An actuarial assessment of long service leave<br />
undertaken by Price Waterhouse Actuaries at 30<br />
June <strong>2011</strong> determined that the liability measured<br />
using the short-hand measurement technique<br />
above was not materially different from the liability<br />
determined using the present value of expected<br />
future payments. This calculation is consistent<br />
with the PTA’s experience of employee retention<br />
and leave taken.<br />
Unconditional long service leave provisions are<br />
classified as current liabilities as the PTA does<br />
not have an unconditional right to defer the<br />
settlement of the liability for at least <strong>12</strong> months<br />
after the end of the reporting period. Preconditional<br />
and conditional long service leave<br />
provisions are classified as non-current liabilities<br />
because the PTA has an unconditional right<br />
to defer the settlement of the liability until the<br />
employee has completed the requisite years<br />
of service.<br />
Sick leave<br />
Liabilities for sick leave are recognised when it is<br />
probable that sick leave paid in the future will be<br />
greater than the entitlement that will accrue in<br />
the future.<br />
Past history indicates that on average, sick leave<br />
taken each reporting period is less than the<br />
entitlement accrued. This is expected to continue<br />
in future periods. Accordingly, it is unlikely that<br />
existing accumulated entitlements will be used<br />
by employees and no liability for unused sick<br />
leave entitlements is recognised. As sick leave<br />
is non-vesting, an expense is recognised in the<br />
Statement of Comprehensive Income for this<br />
leave as it is taken.<br />
Deferred leave<br />
<strong>The</strong> provision for deferred leave relates to<br />
<strong>Public</strong> Service employees who have entered<br />
into an agreement to self-fund an additional <strong>12</strong><br />
months leave in the fifth year of the agreement.<br />
<strong>The</strong> provision recognises the value of salary set<br />
aside for employees to be used in the fifth year.<br />
<strong>12</strong>3
This liability is measured on the same basis as<br />
annual leave. Deferred leave is reported as a<br />
current provision as employees can leave the<br />
scheme at their discretion at any time.<br />
Purchased leave<br />
<strong>The</strong> provision for purchased leave relates to<br />
<strong>Public</strong> Service employees who have entered<br />
into an agreement to self-fund up to an<br />
additional eight weeks leave per calendar year.<br />
<strong>The</strong> provision recognises the value of salary set<br />
aside for employees and is measured at the<br />
nominal amounts expected to be paid when the<br />
liabilities are settled. This liability is measured on<br />
the same basis as annual leave.<br />
Superannuation<br />
<strong>The</strong> Government Employees Superannuation<br />
Board (GESB) and other funds administer<br />
public sector superannuation arrangements in<br />
<strong>Western</strong> Australia in accordance with legislative<br />
requirements. Eligibility criteria for membership in<br />
particular schemes for public sector employees<br />
varies according to commencement and<br />
implementation dates.<br />
Eligible employees contribute to the Pension<br />
Scheme, a defined benefit pension scheme<br />
closed to new members since 1987, or the<br />
Gold State Superannuation Scheme (GSS),<br />
a defined benefit lump sum scheme closed<br />
to new members since 1995.<br />
<strong>The</strong> GSS is a defined benefit scheme for<br />
the purposes of employees and wholeof-government<br />
reporting. However, it is a<br />
defined contribution plan for agency purposes<br />
because the concurrent contributions (defined<br />
contributions) made by the PTA to GESB<br />
extinguishes the agency’s obligations to the<br />
related superannuation liability.<br />
<strong>The</strong> PTA has no liabilities under the Pension<br />
Scheme or the GSS. <strong>The</strong> liabilities for the<br />
unfunded Pension Scheme and the unfunded<br />
GSS transfer benefits attributable to members<br />
who transferred from the Pension Scheme,<br />
are assumed by the Treasurer. All other<br />
GSS obligations are funded by concurrent<br />
contributions made by the PTA to the GESB.<br />
Employees commencing employment prior<br />
to 16 April 2007 who were not members of<br />
either the Pension Scheme or the GSS became<br />
non-contributory members of the West State<br />
Superannuation Scheme (WSS). Employees<br />
commencing employment on or after 16 April<br />
2007 became members of the GESB Super<br />
Scheme (GESBS). From 30 March 20<strong>12</strong>,<br />
existing members of the WSS or GESBS and<br />
new employees became able to choose their<br />
preferred superannuation fund. <strong>The</strong> PTA makes<br />
concurrent contributions to GESB or other<br />
funds on behalf of employees in compliance<br />
with the Commonwealth Government’s<br />
Superannuation Guarantee (Administration)<br />
Act 1992. Contributions to these accumulation<br />
schemes extinguish the PTA’s liability for<br />
superannuation charges in respect of employees<br />
who are not members of the Pension Scheme<br />
or GSS. See also note 2(v) ‘Superannuation<br />
expense’.<br />
<strong>The</strong> GESB makes all benefit payments in<br />
respect of the Pension Scheme and GSS,<br />
and is recouped from the Treasurer for the<br />
employer’s share.<br />
(ii) Provisions – other<br />
Employment on-costs<br />
Employment on-costs, including payroll tax<br />
and workers’ compensation insurance, are<br />
not employee benefits and are recognised<br />
separately as liabilities and expenses when<br />
the employment to which they relate has<br />
occurred. Employment on-costs are included<br />
as part of ‘Other expenses’ and are not included<br />
as part of the PTA’s ‘Employee benefits expense’.<br />
<strong>The</strong> related liability is included in ‘Employment<br />
on-costs provision’. (See note 6 ‘Employee<br />
benefits expense’, note 11 ‘Other expenses’<br />
and note 29 ‘Provisions’).<br />
<strong>Public</strong> liability<br />
Provision is made for all outstanding public<br />
liability claims before 1 July 2005 worth less<br />
than $1 million. <strong>The</strong> amount of the provision<br />
is the estimated outstanding value of the claims<br />
at the end of the reporting period.<br />
Workers’ compensation<br />
Provision is made for all outstanding claims from<br />
periods before 1 July 1997 and any previous<br />
years fund contribution assessments based on<br />
claims experience. <strong>The</strong> amount of the provision<br />
is the estimated outstanding value of claims plus<br />
any actuarial assessments of the previous years<br />
adjusted fund contribution at the end of the<br />
reporting period.<br />
Contaminated sites<br />
Provision is recognised for the sites that are<br />
classified as contaminated – remediation required<br />
or possibly contaminated – investigation required,<br />
and where the PTA has a liability in respect of<br />
investigation or remediation expenses. Estimates<br />
are based on the present value of expected<br />
future cash outflows.<br />
<strong>12</strong>4 <strong>Public</strong> <strong>Transport</strong> <strong>Authority</strong> <strong>Annual</strong> <strong>Report</strong> <strong>2011</strong>-<strong>12</strong>
v) Superannuation expense<br />
<strong>The</strong> superannuation expense in the Statement<br />
of Comprehensive Income comprises employer<br />
contributions paid to the GSS (concurrent<br />
contributions), the West State Superannuation<br />
Scheme (WSS), and the GESB Super Scheme<br />
(GESBS), or other superannuation fund.<br />
w) Resources received free of charge or for<br />
nominal cost<br />
Resources received free of charge or for nominal<br />
cost that can be reliably measured are recognised<br />
as income at fair value. Where the resource received<br />
represents a service that the PTA would otherwise<br />
pay for, a corresponding expense is recognised.<br />
Receipts of assets are recognised in the Statement<br />
of Financial Position.<br />
Assets or services received from another State<br />
Government agency are separately disclosed under<br />
Income from State Government in the Statement of<br />
Comprehensive Income.<br />
x) Comparative figures<br />
Comparative figures are, where appropriate,<br />
reclassified to be comparable with the figures<br />
presented in the current financial year.<br />
y) Foreign currency translation<br />
Transactions denominated in a foreign currency are<br />
translated at the rates in existence at the dates of<br />
the transactions. Foreign currency receivables and<br />
payables are translated at exchange rates current at<br />
the end of the reporting period. Exchange gains and<br />
losses are brought to account in determining the result<br />
for the year.<br />
3 Judgement made by management<br />
in applying accounting policies<br />
<strong>The</strong> judgements that have been made in the process<br />
of applying accounting policies that have the most<br />
significant effect on the amounts recognised in the<br />
financial statements include:<br />
Borrowing Costs<br />
<strong>The</strong> PTA has made a determination to expense all<br />
borrowing costs associated with the construction<br />
of capital projects as allowed by the alternative<br />
accounting treatment under AASB <strong>12</strong>3<br />
Borrowing Costs.<br />
4 Key sources of<br />
estimation uncertainty<br />
Key estimates and assumptions concerning the future<br />
are based on historical experience and various other<br />
factors that have a significant risk of causing a material<br />
adjustment to the carrying amounts of assets and<br />
liabilities within the next financial year include:<br />
Long Service Leave<br />
<strong>The</strong> PTA undertook an actuarial assessment of its<br />
long service leave provision and is using employees’<br />
age based factors for discounting its expected<br />
future payments between valuations. <strong>The</strong>se factors<br />
incorporate a series of assumptions like demographics,<br />
salary inflation, and market yields on commonwealth<br />
government bonds. Fluctuations in any of the<br />
assumptions used to calculate these factors may<br />
impact the provision for annual and long service leave.<br />
Estimating useful life of key assets<br />
<strong>The</strong> useful lives are estimated having regard to such<br />
factors as asset maintenance, rate of technical and<br />
commercial obsolescence, and asset usage. <strong>The</strong> useful<br />
lives of key assets are reviewed annually.<br />
Depreciated replacement cost of railway<br />
infrastructure assets<br />
<strong>The</strong> Building Cost Index from the Department of<br />
Finance has been applied in a model developed by the<br />
PTA for measuring the current replacement cost of the<br />
urban railway infrastructure.<br />
<strong>The</strong> remaining useful life of the freight network<br />
infrastructure assets has been assessed by<br />
experienced independent engineering and valuation<br />
professionals based on a review of information<br />
pertaining to age, history, site assessment observation<br />
and condition. <strong>The</strong> PTA has assumed no residual value<br />
on life expired freight network infrastructure assets.<br />
Contingencies<br />
<strong>The</strong> PTA is unable to assess the outcome of the<br />
classification process for 25 possible contaminated<br />
sites. Possible remediation costs associated with<br />
these sites might have an impact on the provision for<br />
contaminated sites. See note 35 ‘Contingent liabilities<br />
and contingent assets’ for more details.<br />
<strong>12</strong>5
5 Disclosure of changes in accounting policy and estimates<br />
Initial application of an Australian Accounting Standard<br />
<strong>The</strong> PTA has applied the following Australian Accounting Standards effective for annual reporting periods beginning on or after 1 July <strong>2011</strong> that impacted on the PTA.<br />
AASB 1054 Australian Additional Disclosures<br />
This Standard, in conjunction with AASB <strong>2011</strong>-1 Amendments to Australian Accounting Standards arising from the Trans-Tasman Convergence Project,<br />
removes disclosure requirements from other Standards and incorporates them in a single Standard to achieve convergence between Australian and<br />
New Zealand Accounting Standards. <strong>The</strong>re is no financial impact.<br />
AASB 2009-<strong>12</strong> Amendments to Australian Accounting Standards [AASB 5, 8, 108, 110, 1<strong>12</strong>, 119, 133, 137, 139, 1023 & 1031 and Int 2, 4, 16, 1039 & 1052]<br />
This Standard makes editorial amendments to a range of Australian Accounting Standards and Interpretations. <strong>The</strong>re is no financial impact.<br />
AASB 2010-4 Further Amendments to Australian Accounting Standards arising from the <strong>Annual</strong> Improvements Project [AASB 1, 7, 101 & 134 and Int 13]<br />
<strong>The</strong> amendments to AASB 7 clarify financial instrument disclosures in relation to credit risk. <strong>The</strong> carrying amount of financial assets that would otherwise<br />
be past due or impaired whose terms have been renegotiated is no longer required to be disclosed. <strong>The</strong>re is no financial impact.<br />
<strong>The</strong> amendments to AASB 101 clarify the presentation of the Statement of Changes in Equity. <strong>The</strong> disaggregation of other comprehensive income<br />
reconciling the carrying amount at the beginning and the end of the period for each component of equity can be presented in either the Statement of<br />
Changes in Equity or the Notes. <strong>The</strong>re is no financial impact.<br />
AASB 2010-5 Amendments to Australian Accounting Standards [AASB 1, 3, 4, 5, 101, 107, 1<strong>12</strong>, 118, 119, <strong>12</strong>1, 132, 133, 134, 137, 139, 140, 1023 & 1038 and<br />
Int 1<strong>12</strong>, 115, <strong>12</strong>7, 132 & 1042]<br />
This Standard makes editorial amendments to a range of Australian Accounting Standards and Interpretations. <strong>The</strong>re is no financial impact.<br />
AASB 2010-6 Amendments to Australian Accounting Standards – Disclosures on Transfers of Financial Assets [AASB 1 & 7]<br />
This Standard introduces additional disclosures relating to transfers of financial assets in AASB 7. An entity shall disclose all transferred financial assets<br />
that are not derecognised and any continuing involvement in a transferred asset, existing at the reporting date, irrespective of when the related transfer<br />
transaction occurred. <strong>The</strong>re is no financial impact.<br />
AASB <strong>2011</strong>-1 Amendments to Australian Accounting Standards arising from the Trans-Tasman Convergence Project AASB 1, 5, 101, 107, 108, <strong>12</strong>1, <strong>12</strong>8, 132 & 134<br />
and Int 2, 1<strong>12</strong> & 113]<br />
This Standard, in conjunction with AASB 1054, removes disclosure requirements from other Standards and incorporates them in a single standard to<br />
achieve convergence between Australian and New Zealand Accounting Standards. <strong>The</strong>re is no financial impact.<br />
AASB <strong>2011</strong>-5 Amendments to Australian Accounting Standards – Extending Relief from Consolidation, the Equity Method and Proportionate Consolidation<br />
[AASB <strong>12</strong>7, <strong>12</strong>8 & 131]<br />
This Standard extends the relief from consolidation, the equity method and proportionate consolidation by removing the requirement for the<br />
consolidated financial statements prepared by the ultimate or any intermediate parent entity to be IFRS compliant, provided that the parent entity,<br />
investor or venturer and the ultimate or intermediate parent entity are not-for-profit non-reporting entities that comply with Australian Accounting<br />
Standards. <strong>The</strong>re is no financial impact.<br />
<strong>12</strong>6 <strong>Public</strong> <strong>Transport</strong> <strong>Authority</strong> <strong>Annual</strong> <strong>Report</strong> <strong>2011</strong>-<strong>12</strong>
Future impact of Australian Accounting Standards not yet operative<br />
<strong>The</strong> PTA cannot early adopt an Australian Accounting Standard unless specifically permitted by TI 1101 Application of Australian Accounting Standards and Other<br />
Pronouncements. Consequently, the PTA has not applied early any of the following Australian Accounting Standards that have been issued that may impact the PTA.<br />
Where applicable, the PTA plans to apply these Australian Accounting Standards from their application date.<br />
AASB 9<br />
AASB 10<br />
AASB 11<br />
AASB <strong>12</strong><br />
AASB 13<br />
AASB 119<br />
Financial Instruments<br />
This Standard supersedes AASB 139 Financial Instruments: Recognition and Measurement, introducing a number of changes to accounting treatments.<br />
<strong>The</strong> Standard was reissued in December 2010. <strong>The</strong> PTA has not yet determined the application or the potential impact of the Standard.<br />
<strong>The</strong> Standard is required to be applied to annual reporting periods beginning on or after 1 January 2013.<br />
Consolidated Financial Statements<br />
This Standard supersedes requirements under AASB <strong>12</strong>7 Consolidated and Separate Financial Statements and Int 1<strong>12</strong> Consolidation – Special<br />
Purpose Entities, introducing a number of changes to accounting treatments.<br />
<strong>The</strong> Standard was issued in August <strong>2011</strong>. <strong>The</strong> PTA has not yet determined the application or the potential impact of the Standard.<br />
<strong>The</strong> Standard is required to be applied to annual reporting periods beginning on or after 1 January 2013.<br />
Joint Arrangements<br />
This Standard supersedes AASB 131 Interests in Joint Ventures, introducing a number of changes to accounting treatments.<br />
<strong>The</strong> Standard was issued in August <strong>2011</strong>. <strong>The</strong> PTA has not yet determined the application or the potential impact of the Standard.<br />
<strong>The</strong> Standard is required to be applied to annual reporting periods beginning on or after 1 January 2013.<br />
Disclosure of Interests in Other Entities<br />
This Standard supersedes disclosure requirements under AASB <strong>12</strong>7 Consolidated and Separate Financial Statements, AASB <strong>12</strong>8 Investments<br />
in Associates and AASB 131 Interests in Joint Ventures.<br />
<strong>The</strong> Standard was issued in August <strong>2011</strong>. <strong>The</strong> PTA has not yet determined the application or the potential impact of the Standard.<br />
<strong>The</strong> Standard is required to be applied to annual reporting periods beginning on or after 1 January 2013.<br />
Fair Value Measurement<br />
This Standard defines fair value, sets out a framework for measuring fair value and requires disclosures about fair value measurements. <strong>The</strong>re is<br />
no financial impact.<br />
<strong>The</strong> Standard is required to be applied to annual reporting periods beginning on or after 1 January 2013.<br />
Employee Benefits<br />
This Standard supersedes AASB 119 (October 2010). As the PTA does not operate a defined benefit plan, the impact of the change is limited<br />
to measuring annual leave as a long-term employee benefit. <strong>The</strong> resultant discounting of the annual leave benefit has an immaterial impact.<br />
<strong>The</strong> Standard is required to be applied to annual reporting periods beginning on or after 1 January 2013.<br />
<strong>12</strong>7
AASB <strong>12</strong>7 Separate Financial Statements<br />
This Standard supersedes requirements under AASB <strong>12</strong>7 Consolidated and Separate Financial Statements, introducing a number of changes<br />
to accounting treatments.<br />
This Standard was issued in August <strong>2011</strong>. <strong>The</strong> PTA has not yet determined the application or the potential impact of the Standard.<br />
<strong>The</strong> Standard is required to be applied to annual reporting periods beginning on or after 1 January 2013.<br />
AASB <strong>12</strong>8 Investments in Associates and Joint Ventures<br />
This Standard supersedes AASB <strong>12</strong>8 Investments in Associates, introducing a number of changes to accounting treatments.<br />
<strong>The</strong> Standard was issued in August <strong>2011</strong>. <strong>The</strong> PTA has not yet determined the application or the potential impact of the Standard.<br />
<strong>The</strong> Standard is required to be applied to annual reporting periods beginning on or after 1 January 2013.<br />
AASB 1053 Application of Tiers of Australian Accounting Standards<br />
This Standard establishes a differential financial reporting framework consisting of two tiers of reporting requirements for preparing general purpose<br />
financial statements. <strong>The</strong>re is no financial impact.<br />
<strong>The</strong> Standard is required to be applied to annual reporting periods beginning on or after 1 July 2013.<br />
AASB 2009-11 Amendments to Australian Accounting Standards arising from AASB 9 [AASB 1, 3, 4, 5, 7, 101, 102, 108, 1<strong>12</strong>, 118, <strong>12</strong>1, <strong>12</strong>7, <strong>12</strong>8, 131, 132, 136,<br />
139, 1023 & 1038 and Int 10 & <strong>12</strong>]<br />
[Modified by AASB 2010-7]<br />
<strong>The</strong> Standard is required to be applied to annual reporting periods beginning on or after 1 July 2013.<br />
AASB 2010-2 Amendments to Australian Accounting Standards arising from Reduced Disclosure Requirements [AASB 1, 2, 3, 5, 7, 8, 101, 102, 107, 108, 110, 111,<br />
1<strong>12</strong>, 116, 117, 119, <strong>12</strong>1, <strong>12</strong>3, <strong>12</strong>4, <strong>12</strong>7, <strong>12</strong>8, 131, 133, 134, 136, 137, 138, 140, 141, 1050 & 1052 and Int 2, 4, 5, 15, 17, <strong>12</strong>7, <strong>12</strong>9 & 1052]<br />
This Standard makes amendments to Australian Accounting Standards and Interpretations to introduce reduced disclosure requirements for certain<br />
types of entities. <strong>The</strong>re is no financial impact.<br />
<strong>The</strong> Standard is required to be applied to annual reporting periods beginning on or after 1 July 2013.<br />
AASB 2010-7 Amendments to Australian Accounting Standards arising from AASB 9 (December 2010) [AASB 1, 3, 4, 5, 7, 101, 102, 108, 1<strong>12</strong>, 118, <strong>12</strong>0, <strong>12</strong>1, <strong>12</strong>7,<br />
<strong>12</strong>8, 131, 132, 136, 137, 139, 1023 & 1038 and Int 2, 5, 10, <strong>12</strong>, 19 & <strong>12</strong>7]<br />
This Standard makes consequential amendments to other Australian Accounting Standards and Interpretations as a result of issuing AASB 9 in<br />
December 2010. <strong>The</strong> PTA has not yet determined the application or the potential impact of the Standard.<br />
<strong>The</strong> Standard is required to be applied to annual reporting periods beginning on or after 1 January 2013.<br />
AASB <strong>2011</strong>-2 Amendments to Australian Accounting Standards arising from the Trans-Tasman Convergence Project – Reduced Disclosure Requirements<br />
[AASB 101 & 1054]<br />
This Standard removes disclosure requirements from other Standards and incorporates them in a single Standard to achieve convergence between<br />
Australian and New Zealand Accounting Standards for reduced disclosure reporting. <strong>The</strong>re is no financial impact.<br />
<strong>The</strong> Standard is required to be applied to annual reporting periods beginning on or after 1 July 2013.<br />
<strong>12</strong>8 <strong>Public</strong> <strong>Transport</strong> <strong>Authority</strong> <strong>Annual</strong> <strong>Report</strong> <strong>2011</strong>-<strong>12</strong>
AASB <strong>2011</strong>-6 Amendments to Australian Accounting Standards – Extending Relief from Consolidation, the Equity Method and Proportionate Consolidation – Reduced<br />
Disclosure Requirements [AASB <strong>12</strong>7, <strong>12</strong>8 & 131]<br />
This Standard extends the relief from consolidation, the equity method and proportionate consolidation by removing the requirement for the<br />
consolidated financial statements prepared by the ultimate or any intermediate parent entity to be IFRS compliant, provided that the parent entity,<br />
investor or venturer and the ultimate or intermediate parent entity comply with Australian Accounting Standards or Australian Accounting Standards –<br />
Reduced Disclosure Requirements. <strong>The</strong>re is no financial impact.<br />
<strong>The</strong> Standard is required to be applied to annual reporting periods beginning on or after 1 July 2013.<br />
AASB <strong>2011</strong>-7 Amendments to Australian Accounting Standards arising from the Consolidation and Joint Arrangements Standards [AASB 1, 2, 3, 5, 7, 9, 2009-11,<br />
101, 107, 1<strong>12</strong>, 118, <strong>12</strong>1, <strong>12</strong>4, 132, 133, 136, 138, 139, 1023 & 1038 and Int 5, 9, 16 & 17]<br />
This Standard give effect to consequential changes arising from the issuance of AASB 10, AASB 11, AASB <strong>12</strong>7 Separate Financial Statements and<br />
AASB <strong>12</strong>8 Investments in Associates and Joint Ventures. <strong>The</strong> PTA has not yet determined the application or the potential impact of the Standard.<br />
<strong>The</strong> Standard is required to be applied to annual reporting periods beginning on or after 1 January 2013.<br />
AASB <strong>2011</strong>-8 Amendments to Australian Accounting Standards arising from AASB 13 [AASB 1, 2, 3, 4, 5, 7, 9, 2009-11, 2010-7, 101, 102, 108, 110, 116, 117, 118,<br />
119, <strong>12</strong>0, <strong>12</strong>1, <strong>12</strong>8, 131, 132, 133, 134, 136, 138, 139, 140, 141, 1004, 1023 & 1038 and Int 2, 4, 13, 14, 17, 19, 131 & 132]<br />
This Standard replaces the existing definition and fair value guidance in other Australian Accounting Standards and Interpretations as the result of<br />
issuing AASB 13 in September <strong>2011</strong>. <strong>The</strong>re is no financial impact.<br />
<strong>The</strong> Standard is required to be applied to annual reporting periods beginning on or after 1 January 2013.<br />
AASB <strong>2011</strong>-9 Amendments to Australian Accounting Standards – Presentation of Items of Other Comprehensive Income [AASB 1, 5, 7, 101, 1<strong>12</strong>, <strong>12</strong>0, <strong>12</strong>1, 132,<br />
133, 134, 1039 & 1049]<br />
This Standard requires to group items presented in other comprehensive income on the basis of whether they are potentially reclassifiable to profit or<br />
loss subsequently (reclassification adjustments). <strong>The</strong> PTA has not yet determined the application or the potential impact of the Standard.<br />
<strong>The</strong> Standard is required to be applied to annual reporting periods beginning on or after 1 July 20<strong>12</strong>.<br />
AASB <strong>2011</strong>-10 Amendments to Australian Accounting Standards arising from AASB 119 (September <strong>2011</strong>) [AASB 1, 8, 101, <strong>12</strong>4, 134, 1049 & <strong>2011</strong>-8 and Int 14]<br />
This Standard makes amendments to other Australian Accounting Standards and Interpretations as a result of issuing AASB 119 Employee Benefits in<br />
September <strong>2011</strong>. <strong>The</strong>re is no financial impact.<br />
<strong>The</strong> Standard is required to be applied to annual reporting periods beginning on or after 1 January 2013.<br />
AASB <strong>2011</strong>-11 Amendments to AASB 119 (September <strong>2011</strong>) arising from Reduced Disclosure Requirements<br />
This Standard gives effect to Australian Accounting Standards – Reduced Disclosure requirements for AASB 119 (September <strong>2011</strong>). <strong>The</strong>re is no<br />
financial impact.<br />
<strong>The</strong> Standard is required to be applied to annual reporting periods beginning on or after 1 July 2013.<br />
AASB 20<strong>12</strong>-1 Amendments to Australian Accounting Standards – Fair Value Measurement – Reduced Disclosure Requirements [AASB 3, 7, 13, 140 & 141]<br />
This Standard establishes and amends reduced disclosure requirements for additional and amended disclosures arising from AASB 13 and the<br />
consequential amendments implemented through AASB <strong>2011</strong>-8. <strong>The</strong>re is no financial impact.<br />
<strong>The</strong> Standard is required to be applied to annual reporting periods beginning on or after 1 July 2013.<br />
<strong>12</strong>9
6 Employee benefits expense<br />
Wages and salaries (i) <strong>12</strong>4,115 115,855<br />
Superannuation – defined contribution plans (ii) 11,078 10,081<br />
135,193 <strong>12</strong>5,936<br />
(i) Includes the value of the fringe benefit to the employee plus the fringe benefit tax component, leave entitlements including superannuation contribution component.<br />
(ii) Defined contribution plans include West State, Gold State and GESB Super Scheme (contributions paid).<br />
Employment on-costs expenses such as workers’ compensation insurance and payroll tax are included at note 11 ‘Other expenses’. Employment on-cost liability is<br />
included at note 29 ‘Provisions’.<br />
20<strong>12</strong><br />
$000<br />
<strong>2011</strong><br />
$000<br />
7 Supplies and services<br />
Contractors 144,421 136,933<br />
Materials and Signs 21,963 23,295<br />
Consumables 6,874 4,477<br />
Travel 8,804 9,233<br />
Communications 1,262 1,178<br />
Other 18,115 8,916<br />
201,439 184,032<br />
130 <strong>Public</strong> <strong>Transport</strong> <strong>Authority</strong> <strong>Annual</strong> <strong>Report</strong> <strong>2011</strong>-<strong>12</strong>
8 Depreciation and amortisation expense<br />
Depreciation<br />
Buildings 4,689 4,555<br />
Freight network infrastructure 83,417 82,771<br />
Rollingstock 32,678 32,278<br />
Railway infrastructure 83,678 84,770<br />
Plant, equipment and motor vehicles 4,809 4,549<br />
Bus infrastructure 6,087 5,947<br />
Vessels 80 80<br />
Buses 28,627 26,378<br />
Total depreciation 244,065 241,328<br />
Amortisation<br />
Intangible assets 1,581 1,629<br />
Total amortisation 1,581 1,629<br />
Total depreciation and amortisation 245,646 242,957<br />
20<strong>12</strong><br />
$000<br />
<strong>2011</strong><br />
$000<br />
9 Finance costs<br />
Interest expense on <strong>Western</strong> Australian Treasury Corporation (WATC) loans 67,539 64,959<br />
Interest expense on Commonwealth loans 133 156<br />
Interest – Other 0 15<br />
Net change in fair value of financial assets designated at fair value through profit and loss 0 1,188<br />
Finance costs expensed 67,672 66,318<br />
131
10 Grants and subsidies expense<br />
Bus operators 255,155 229,023<br />
School bus services 103,062 98,010<br />
Regional bus services 14,932 <strong>12</strong>,913<br />
Rail corridor and freight issues management 3,325 0<br />
Ferry services 728 701<br />
Grants to local government 1,165 1,566<br />
Grants to other government agencies 1,500 600<br />
Student fare concessions 0 2,834<br />
379,867 345,647<br />
20<strong>12</strong><br />
$000<br />
<strong>2011</strong><br />
$000<br />
11 Other expenses<br />
Employment on-costs (i) 187 1,228<br />
Payroll tax 7,505 6,730<br />
Workers’ compensation 9,301 7,696<br />
Doubtful debts expense 148 4<br />
Notional charges for services provided by government agencies 455 361<br />
Audit fees 170 149<br />
Payment of infringements to consolidated account 3,052 0<br />
20,818 16,168<br />
(i) Includes workers’ compensation insurance and payroll tax relating to annual and long service leave. <strong>The</strong> corresponding liability is included at note 29 ‘Provisions’.<br />
Superannuation contributions accrued as part of the provision for leave are employee benefits and are not included in employment on-costs.<br />
<strong>12</strong> User charges and fees<br />
Transperth system revenue 176,039 156,056<br />
School bus services revenue 4,747 4,400<br />
Country passenger operations revenue 11,217 10,413<br />
192,003 170,869<br />
132 <strong>Public</strong> <strong>Transport</strong> <strong>Authority</strong> <strong>Annual</strong> <strong>Report</strong> <strong>2011</strong>-<strong>12</strong>
13 Operating lease revenue<br />
Rental income from Freight network infrastructure (i) 5,383 5,383<br />
Rental income from grain receival sites (ii) 83 83<br />
5,466 5,466<br />
(i) <strong>The</strong> sale of the Westrail Freight Business on 17 December 2000 included an operating lease of the freight network infrastructure for 49 years between the <strong>Western</strong><br />
Australian Government Railways Commission (WAGR) – now <strong>Public</strong> <strong>Transport</strong> <strong>Authority</strong> of <strong>Western</strong> Australia (PTA) and Westnet Rail Pty Ltd – now Brookfield Rail Pty Ltd.<br />
<strong>The</strong> lease rentals were fully prepaid on 17 December 2000, and credited to deferred operating lease revenue.<br />
(ii) A 99 year operating lease for 118 grain receival sites was entered into with Co-operative Bulk Handling (CBH) in 2003. Rental Income for 99 years of $7.45 million was<br />
received in full at the commencement of the lease, and is accounted for as revenue over the 99 year lease period, with the prepaid portion shown as deferred income.<br />
(See note 31 ‘Deferred income – operating leases’).<br />
A further 99 year operating lease for 15 grain receival sites was entered into with CBH in 2004. Rental Income for 99 years of $775,000 was received in full at the<br />
commencement of the lease, and is accounted for as revenue over the 99 year lease period, with the prepaid portion shown as deferred income.<br />
(See note 31 ‘Deferred income – operating leases’).<br />
20<strong>12</strong><br />
$000<br />
<strong>2011</strong><br />
$000<br />
14 Commonwealth grants and contributions<br />
Chamber of Commerce and Industry – Employfast 11 11<br />
National Partnership Agreement – concessions for pensioners and seniors card holders 455 429<br />
466 440<br />
15 Interest revenue<br />
Interest revenue 3,<strong>12</strong>5 2,042<br />
Interest revenue is received quarterly from Department of Treasury calculated on the daily balance held on the interest bearing bank account.<br />
133
16 Other revenue<br />
Rents and leases <strong>12</strong>,906 <strong>12</strong>,298<br />
Infringements 3,280 2,828<br />
Advertising income 4,823 4,413<br />
Parking 2,340 2,2<strong>12</strong><br />
External works 2,909 2,107<br />
SmartRider card sales 1,194 923<br />
Cost savings from commonwealth project 1,089 0<br />
Contribution from local government 0 26,304<br />
Miscellaneous 3,623 1,398<br />
32,164 52,483<br />
17 Net loss on disposal of non-current assets<br />
Proceeds from disposal of non-current assets<br />
Land 1,685 0<br />
Buses 43 323<br />
Other 0 250<br />
Costs of disposal of non-current assets<br />
Land (1,685) 0<br />
Buses (416) (671)<br />
Other (443) (3)<br />
20<strong>12</strong><br />
$000<br />
<strong>2011</strong><br />
$000<br />
Net loss (816) (101)<br />
134 <strong>Public</strong> <strong>Transport</strong> <strong>Authority</strong> <strong>Annual</strong> <strong>Report</strong> <strong>2011</strong>-<strong>12</strong>
18 Income from State Government<br />
Appropriation received during the period:<br />
Service appropriations (i) 776,189 731,186<br />
Resources received free of charge (ii)<br />
Determined on the basis of the following estimates provided by agencies:<br />
Landgate 450 361<br />
Building Management and Works 5 0<br />
455 361<br />
20<strong>12</strong><br />
$000<br />
<strong>2011</strong><br />
$000<br />
Royalties for Regions Fund:<br />
Regional Community Services Account (iii) 3,007 1,900<br />
3,007 1,900<br />
Contribution – other government agencies<br />
Department of <strong>Transport</strong> – funding for CAT bus replacement and new CAT depot 163 992<br />
Department of Finance – funding for Burswood Stadium 947 0<br />
Department of <strong>Transport</strong> – funding for the Central Northern Corridor LRT project 327 0<br />
1,437 992<br />
781,088 734,439<br />
(i) Service appropriations fund the net cost of services delivered. Appropriation revenue comprises a cash component and a receivable (asset). <strong>The</strong> receivable<br />
(holding account) comprises the depreciation expense for the year and any agreed increase in leave liability during the year.<br />
(ii) Assets or services received free of charge or for nominal cost are recognised as revenue at fair value of the assets and/or services that can be reliably measured and<br />
which would have been purchased if they were not donated. Contributions of assets or services in the nature of contributions by owners are recognised directly to equity.<br />
(iii) This is a sub-fund within the over-arching ‘Royalties for Regions Fund’. <strong>The</strong> recurrent funds are committed to projects and programs in WA regional areas.<br />
135
19 Restricted cash and cash equivalents<br />
Current<br />
Capital Grant from the City of Perth (i) 28,239 28,239<br />
Royalties for Regions Fund (ii) (585) 0<br />
Parental Leave 1 0<br />
Commonwealth Funds – Eastern Goldfield Railway project 1,089 0<br />
Funding segregated for specific projects 1,851 0<br />
30,595 28,239<br />
Non-Current<br />
Accrued salaries suspense account (iii) 2,984 0<br />
2,984 0<br />
(i) Funds held for the construction of the Perth City Link Project.<br />
(ii) Unspent funds are committed to projects and programs in WA regional areas. This funding is currently in overdraft and will be recouped from the Royalties for<br />
Regions funding.<br />
(iii) Funds held in suspense account used only for the purpose of meeting the 27th pay in a financial year that occurs every 11 years.<br />
20<strong>12</strong><br />
$000<br />
<strong>2011</strong><br />
$000<br />
20 Inventories<br />
Current<br />
Inventories not held for resale:<br />
Maintenance spares – at cost 13,147 <strong>12</strong>,846<br />
13,147 <strong>12</strong>,846<br />
136 <strong>Public</strong> <strong>Transport</strong> <strong>Authority</strong> <strong>Annual</strong> <strong>Report</strong> <strong>2011</strong>-<strong>12</strong>
21 Receivables<br />
Current<br />
Receivables 5,6<strong>12</strong> 4,902<br />
Allowance for impairment of receivables (154) (<strong>12</strong>)<br />
Accrued revenue 7,951 6,801<br />
GST receivable 10,487 7,936<br />
Other receivables – external works 668 226<br />
24,564 19,853<br />
Prepayments 1,727 1,693<br />
Total receivables 26,291 21,546<br />
20<strong>12</strong><br />
$000<br />
<strong>2011</strong><br />
$000<br />
Reconciliation of changes in the allowance for impairment of receivables:<br />
Balance at start of period <strong>12</strong> 14<br />
Doubtful debts expense 148 4<br />
Amount recovered during the period (6) (6)<br />
Balance at end of period 154 <strong>12</strong><br />
22 Amounts receivable for services (Holding Account)<br />
Current 24,836 47,692<br />
Non-current 1,003,301 855,537<br />
1,028,137 903,229<br />
Represents the non-cash component of service appropriations. It is restricted in that it can only be used for asset replacement or payment of leave liability.<br />
137
23 Infrastructure, property, plant, equipment and vehicles<br />
20<strong>12</strong> 20<strong>12</strong> 20<strong>12</strong> 20<strong>12</strong> <strong>2011</strong> <strong>2011</strong> <strong>2011</strong> <strong>2011</strong><br />
Cost At Fair Value Accumulated<br />
depreciation<br />
Carrying amount as<br />
at 30 June 20<strong>12</strong><br />
Cost At Fair Value Accumulated<br />
depreciation<br />
Carrying amount as<br />
at 30 June <strong>2011</strong><br />
$000 $000 $000 $000 $000 $000 $000 $000<br />
Owned Assets:<br />
Land (i) 0 361,222 0 361,222 0 350,737 0 350,737<br />
Buildings (ii) 0 211,026 98,486 1<strong>12</strong>,540 0 207,288 93,796 113,492<br />
Freight network<br />
0 5,<strong>12</strong>1,807 3,877,117 1,244,690 0 5,084,696 3,793,700 1,290,996<br />
infrastructure (iii)<br />
Rollingstock (ii) 0 1,023,824 402,545 621,279 0 1,023,824 369,867 653,957<br />
Railway infrastructure (iv) 0 2,949,634 840,575 2,109,059 0 2,993,133 861,213 2,131,920<br />
Plant, equipment and 35,<strong>12</strong>1 0 17,793 17,328 38,584 0 14,430 24,154<br />
motor vehicles<br />
Bus infrastructure (ii) 0 235,516 107,940 <strong>12</strong>7,576 0 232,081 101,502 130,579<br />
Vessels (ii) 0 3,200 1,851 1,349 0 3,200 1,771 1,429<br />
Buses (ii) 0 713,858 364,796 349,062 0 664,240 345,784 318,456<br />
Construction in progress (v) 317,002 0 0 317,002 <strong>12</strong>1,368 0 0 <strong>12</strong>1,368<br />
Total 352,<strong>12</strong>3 10,620,087 5,711,103 5,261,107 159,952 10,559,199 5,582,063 5,137,088<br />
(i) Land controlled by the PTA has been revalued as at 1 July <strong>2011</strong> by Landgate (Valuation Services) and Burgess Rawson. <strong>The</strong> valuations were performed during the year<br />
ended 30 June 20<strong>12</strong> and recognised at 30 June 20<strong>12</strong>. <strong>The</strong> fair value was determined by reference to market values. See note 2(g).<br />
To ensure the valuations provided by Valuation Services were compliant at 30 June 20<strong>12</strong> with the fair value requirements under AASB 116, Valuation Services provided<br />
the Department of Treasury with information that tracked the general movement in the market value of land and in building construction costs from the 1 July <strong>2011</strong><br />
(the date of valuation) to 30 June 20<strong>12</strong>. Department of Treasury reviewed the information and determined that the valuations provided by Valuation Services<br />
(as at 1 July <strong>2011</strong>) were compliant with fair value requirements for 30 June 20<strong>12</strong> reporting without further adjustment by reference to market values based on<br />
existing use.<br />
Land and buildings which are commercially leased were independently valued on the capitalised value of current lease by Burgess Rawson. <strong>The</strong> valuations were<br />
performed during the year ended 30 June 20<strong>12</strong> and recognised at 30 June 20<strong>12</strong>.<br />
(ii) Buildings, rollingstock, bus infrastructure, vessels and buses were last revalued on 30 June 2010 by independent valuers, engineering and management professionals<br />
at depreciated replacement cost.<br />
(iii) Freight network infrastructure was revalued on 30 June 2010 at depreciated replacement cost. A model was developed using independent third party audited<br />
information, engineering and independent valuers. As a reliable market value does not exist for the freight network infrastructure the effect and disclosure on the current<br />
and future periods cannot be determined.<br />
138 <strong>Public</strong> <strong>Transport</strong> <strong>Authority</strong> <strong>Annual</strong> <strong>Report</strong> <strong>2011</strong>-<strong>12</strong>
(iv) Railway infrastructure was revalued on 30 June 20<strong>12</strong>. Railway infrastructure has been revalued by PTA’s management professionals and third party vendors.<br />
<strong>The</strong> methodology adopted has been depreciated replacement cost with a modern equivalent asset capable of delivering the same service potential.<br />
(v) Construction in progress is valued at cost.<br />
Reconciliations of the carrying amounts of infrastructure, property, plant, equipment and vehicles at the beginning and end of the current financial year are set out below.<br />
Carrying amount<br />
at start of period Additions Transfers<br />
Revaluation<br />
Increments Disposals Depreciation<br />
Carrying amount<br />
at end of period<br />
20<strong>12</strong> $000 $000 $000 $000 $000 $000 $000<br />
Owned Assets:<br />
Land 350,737 0 4,529 5,956 0 0 361,222<br />
Buildings 113,492 323 3,414 0 0 (4,689) 1<strong>12</strong>,540<br />
Freight network infrastructure 1,290,996 0 37,111 0 0 (83,417) 1,244,690<br />
Rollingstock 653,957 0 0 0 0 (32,678) 621,279<br />
Railway infrastructure 2,131,920 755 45,189 15,328 (455) (83,678) 2,109,059<br />
Plant, equipment and motor vehicles 24,154 2,046 (4,055) 0 (8) (4,809) 17,328<br />
Bus infrastructure 130,579 146 2,938 0 0 (6,087) <strong>12</strong>7,576<br />
Vessels 1,429 0 0 0 0 (80) 1,349<br />
Buses 318,456 0 59,629 0 (396) (28,627) 349,062<br />
Construction in progress <strong>12</strong>1,368 257,130 (61,496) 0 0 0 317,002<br />
Total 5,137,088 260,400 87,259 21,284 (859) (244,065) 5,261,107<br />
139
Carrying amount<br />
at start of period Additions Transfers<br />
Revaluation<br />
Increments Disposals Depreciation<br />
Carrying amount<br />
at end of period<br />
<strong>2011</strong> $000 $000 $000 $000 $000 $000 $000<br />
Owned Assets:<br />
Land 342,771 0 3,034 4,932 0 0 350,737<br />
Buildings 115,632 323 2,092 0 0 (4,555) 113,492<br />
Freight network infrastructure 1,373,158 0 609 0 0 (82,771) 1,290,996<br />
Rollingstock 643,256 0 42,979 0 0 (32,278) 653,957<br />
Railway infrastructure 2,<strong>12</strong>5,497 755 90,438 0 0 (84,770) 2,131,920<br />
Plant, equipment and motor vehicles 26,454 2,045 205 0 (1) (4,549) 24,154<br />
Bus infrastructure <strong>12</strong>9,724 146 6,658 0 (2) (5,947) 130,579<br />
Vessels 1,509 0 0 0 0 (80) 1,429<br />
Buses 301,967 0 43,538 0 (671) (26,378) 318,456<br />
Construction in progress 68,134 191,456 (138,222) 0 0 0 <strong>12</strong>1,368<br />
Total 5,<strong>12</strong>8,102 194,725 51,331 4,932 (674) (241,328) 5,137,088<br />
24 Intangible assets<br />
Software – at cost 8,559 8,393<br />
Accumulated amortisation (6,960) (5,379)<br />
1,599 3,014<br />
Reconciliations:<br />
Carrying amount at start of period 3,014 4,619<br />
Additions and transfers in 166 24<br />
Amortisation expense and disposal (1,581) (1,629)<br />
Carrying amount at end of period 1,599 3,014<br />
20<strong>12</strong><br />
$000<br />
<strong>2011</strong><br />
$000<br />
140 <strong>Public</strong> <strong>Transport</strong> <strong>Authority</strong> <strong>Annual</strong> <strong>Report</strong> <strong>2011</strong>-<strong>12</strong>
25 Non-current assets classified as held for sale<br />
Freehold land<br />
Opening balance 15,885 <strong>12</strong>,591<br />
Revaluation (2,100) 1,610<br />
Assets reclassified as held for sale 0 1,684<br />
Assets sold (1,685) 0<br />
Closing balance <strong>12</strong>,100 15,885<br />
<strong>The</strong> PTA holds land surplus to its operational requirements. Various properties have been identified as land for future sales. <strong>The</strong> PTA anticipates that all the freehold land in<br />
the closing balance will be disposed of in the next reporting period. See also note 2(j) non-current assets (or disposal groups) classified as held for sale.<br />
20<strong>12</strong><br />
$000<br />
<strong>2011</strong><br />
$000<br />
26 Impairment of assets<br />
<strong>The</strong>re were no indications of impairment of property, plant and equipment, vehicles, infrastructure or intangible assets at 30 June 20<strong>12</strong>.<br />
PTA held no goodwill or intangible assets with an indefinite useful life during the reporting period. At the end of the reporting period there were no intangible assets not yet<br />
available for use.<br />
All surplus assets at 30 June 20<strong>12</strong> have either been classified as assets held for sale or written-off.<br />
27 Payables<br />
Current<br />
Trade payables 9,553 2,387<br />
Accrued operational expenses 68,630 82,891<br />
Accrued salaries 4,634 5,187<br />
Accrued interest 13,426 13,392<br />
Other payables 1,546 1,508<br />
97,789 105,365<br />
141
28 Borrowings<br />
Current<br />
<strong>Western</strong> Australian Treasury Corporation loans 59,553 78,017<br />
Commonwealth loans 365 365<br />
59,918 78,382<br />
Non-Current<br />
<strong>Western</strong> Australian Treasury Corporation loans (i) 1,257,049 1,154,859<br />
Commonwealth loans 1,602 1,967<br />
1,258,651 1,156,826<br />
(i) <strong>The</strong> non-current amount includes an amount that will be due and payable during the year 20<strong>12</strong>-13 which will be refinanced rather<br />
than repaid and therefore is not recognised as current borrowings.<br />
20<strong>12</strong><br />
$000<br />
<strong>2011</strong><br />
$000<br />
29 Provisions<br />
Current<br />
Employee benefits provision<br />
<strong>Annual</strong> leave (i) 13,198 <strong>12</strong>,363<br />
Long service leave (ii) <strong>12</strong>,543 11,589<br />
Deferred salary scheme (iv) 103 1<strong>12</strong><br />
25,844 24,064<br />
Other provisions<br />
<strong>Public</strong> liability provision 710 141<br />
Workers’ compensation 9,586 5,546<br />
Contaminated sites 3,555 3,177<br />
Employment on-costs (iii) 2,524 2,339<br />
16,375 11,203<br />
42,219 35,267<br />
142 <strong>Public</strong> <strong>Transport</strong> <strong>Authority</strong> <strong>Annual</strong> <strong>Report</strong> <strong>2011</strong>-<strong>12</strong>
Non-Current<br />
Employee benefits provision<br />
Long service leave (ii) 6,462 5,975<br />
6,462 5,975<br />
Other provisions<br />
Contaminated sites 850 1,877<br />
Employment on-costs (iii) 654 610<br />
1,504 2,487<br />
7,966 8,462<br />
20<strong>12</strong><br />
$000<br />
<strong>2011</strong><br />
$000<br />
(i) <strong>Annual</strong> leave liabilities have been classified as current as there is no unconditional right to defer settlement for at least <strong>12</strong> months<br />
after the end of the reporting period. Assessments indicate that actual settlement of liabilities is expected to occur as follows:<br />
Within <strong>12</strong> months of the end of the reporting period 9,872 8,749<br />
More than <strong>12</strong> months after the end of the reporting period 3,326 3,614<br />
13,198 <strong>12</strong>,363<br />
(ii) Long service leave liabilities have been classified as current where there is no unconditional right to defer settlement for at least<br />
<strong>12</strong> months after the end of the reporting period. Assessments indicate that actual settlement of the liabilities is expected to occur as follows:<br />
Within <strong>12</strong> months of the end of the reporting period 2,240 1,725<br />
More than <strong>12</strong> months after the end of the reporting period 16,765 15,839<br />
19,005 17,564<br />
(iii) <strong>The</strong> settlement of annual and long service leave liabilities gives rise to the payment of employment on-costs including payroll<br />
tax and workers’ compensation insurance. <strong>The</strong> provision is the present value of expected future payments.<br />
<strong>The</strong> associated expense is disclosed in note 11 ‘Other expenses’.<br />
143
(iv) Deferred salary scheme liabilities have been classified as current where there is no unconditional right to defer settlement for<br />
at least <strong>12</strong> months after the end of the reporting period. Actual settlement of the liabilities is expected to occur as follows:<br />
20<strong>12</strong><br />
$000<br />
<strong>2011</strong><br />
$000<br />
Within <strong>12</strong> months of the end of the reporting period 103 69<br />
More than <strong>12</strong> months after the end of the reporting period 0 43<br />
103 1<strong>12</strong><br />
Movements in other provisions<br />
Movements in each class of provisions during the financial year, other than employee benefits, are set out below.<br />
<strong>Public</strong> liability provision<br />
Carrying amount at start of period 141 131<br />
Additional provisions recognised 576 59<br />
Payments/other sacrifices of economic benefit (7) (49)<br />
Carrying amount at end of period 710 141<br />
Workers’ compensation provisions<br />
Carrying amount at start of period 5,546 2,426<br />
Additional provisions recognised 9,301 7,696<br />
Payments/other sacrifices of economic benefit (5,261) (4,576)<br />
Carrying amount at end of period 9,586 5,546<br />
Employment on-cost provision<br />
Carrying amount at start of period 2,949 1,763<br />
Additional provisions recognised 1,636 2,309<br />
Payments/other sacrifices of economic benefit (1,407) (1,<strong>12</strong>3)<br />
Carrying amount at end of period 3,178 2,949<br />
Contaminated sites provision<br />
Carrying amount at start of period 5,054 1,010<br />
Additional provisions recognised 2,173 7,<strong>12</strong>6<br />
Payments/other sacrifices of economic benefit (2,822) (3,082)<br />
Carrying amount at end of period 4,405 5,054<br />
144 <strong>Public</strong> <strong>Transport</strong> <strong>Authority</strong> <strong>Annual</strong> <strong>Report</strong> <strong>2011</strong>-<strong>12</strong>
30 Other current liabilities<br />
Contractors’ deposits 80 1,063<br />
Payments held in suspense 130 191<br />
Parental leave 1 0<br />
211 1,254<br />
31 Deferred income – operating leases<br />
Current<br />
Freight network infrastructure prepaid operating lease 5,383 5,383<br />
Co-operative Bulk Handling 99 year lease 83 83<br />
5,466 5,466<br />
20<strong>12</strong><br />
$000<br />
<strong>2011</strong><br />
$000<br />
Non-Current<br />
Freight network infrastructure prepaid operating lease 196,470 201,853<br />
Co-operative Bulk Handling 99 year lease 7,319 7,402<br />
203,789 209,255<br />
209,255 214,721<br />
32 Equity<br />
<strong>The</strong> Government holds the equity interest in the PTA on behalf of the community. Equity represents the residual interest in the<br />
net assets of the PTA. <strong>The</strong> asset revaluation surplus represents that portion of equity resulting from the revaluation of the<br />
non-current assets.<br />
Contributed equity<br />
Balance at start of period 2,557,005 2,414,434<br />
Contributions by owners<br />
Capital appropriations 201,813 88,721<br />
Transfer of net assets from other agencies<br />
Main Roads WA 1,539 55,010<br />
Total contributions by owners 203,352 143,731<br />
145
Distributions to owners<br />
Transfer of net assets to other agencies<br />
Main Roads WA (250) (1,160)<br />
Total distributions to owners (250) (1,160)<br />
Balance at end of period 2,760,107 2,557,005<br />
20<strong>12</strong><br />
$000<br />
<strong>2011</strong><br />
$000<br />
Reserves<br />
Asset revaluation surplus<br />
Balance at start of period 1,958,313 1,951,771<br />
Net revaluation increments/(decrements):<br />
Land 3,856 6,542<br />
Rail infrastructure 15,328 0<br />
Balance at end of period 1,977,497 1,958,313<br />
Accumulated surplus<br />
Balance at start of period 72,860 110,825<br />
Result for the period (62,375) (37,965)<br />
Balance at end of period 10,485 72,860<br />
Total Equity at end of period 4,748,089 4,588,178<br />
33 Notes to the Statement of Cash Flows<br />
Reconciliation of cash and cash equivalents<br />
Cash and cash equivalents at the end of the financial year as shown in the Statement of Cash Flows<br />
is reconciled to the related items in the Statement of Financial Position as follows:<br />
Cash and cash equivalents 48,138 66,608<br />
Restricted cash and cash equivalents (refer to note 19) 33,579 28,239<br />
81,717 94,847<br />
Financing facilities<br />
<strong>The</strong> PTA has a short-term liquidity facility of $200 million (2010-11: $200 million) with the WATC.<br />
Amounts drawn from this facility at June 30 0 25,000<br />
146 <strong>Public</strong> <strong>Transport</strong> <strong>Authority</strong> <strong>Annual</strong> <strong>Report</strong> <strong>2011</strong>-<strong>12</strong>
Reconciliation of net cost of services to net cash flows used in operating activities<br />
20<strong>12</strong><br />
$000<br />
<strong>2011</strong><br />
$000<br />
Net cost of services (843,463) (772,404)<br />
Non cash items:<br />
Depreciation and amortisation expense 245,646 242,957<br />
Loss on sale of property, plant and equipment 816 101<br />
Resources received free of charge 455 361<br />
(Increase)/decrease in assets:<br />
Current receivables (2,194) (2,760)<br />
Current inventories (301) 905<br />
Increase/(decrease) in liabilities:<br />
Current payables 678 8,832<br />
Current provisions 6,951 11,720<br />
Other current liabilities (1,043) (625)<br />
Non-current provisions (496) 1,257<br />
Non-current deferred operating lease revenue (5,466) (5,466)<br />
Change in GST receivables/payments (2,551) (271)<br />
Net cash used in operating activities (600,968) (515,393)<br />
34 Commitments<br />
<strong>The</strong> commitments below are inclusive of GST where relevant.<br />
Capital expenditure commitments<br />
Capital expenditure commitments, being contracted capital expenditure additional<br />
to the amounts reported in the financial statements, are payable as follows:<br />
Within one year 352,729 181,<strong>12</strong>1<br />
Later than one year and not later than five years 452,388 511,764<br />
Later than five years 275,752 335,373<br />
1,080,869 1,028,258<br />
147
<strong>The</strong> capital commitments include amounts for:<br />
Railway infrastructure 280,493 422,966<br />
Bus infrastructure 0 432<br />
Railcars – Transperth Train Operations 148,007 300<br />
Buses 609,758 581,959<br />
Land and buildings 42,611 22,601<br />
1,080,869 1,028,258<br />
Non-cancellable operating lease commitments<br />
Commitments for minimum lease payments are payable as follows:<br />
Within one year 686 914<br />
Later than one year and not later than five years 460 472<br />
1,146 1,386<br />
Other expenditure commitments<br />
Other expenditure commitments contracted for at the end of reporting period but not recognised as liabilities,<br />
are payable as follows:<br />
Within one year 531,819 505,818<br />
Later than one year and not later than five years 1,715,861 1,418,187<br />
Later than five years 2,089,025 1,578,087<br />
4,336,705 3,502,092<br />
20<strong>12</strong><br />
$000<br />
<strong>2011</strong><br />
$000<br />
<strong>The</strong> other expenditure commitments include amounts for:<br />
Land and buildings maintenance 2,562 4,001<br />
Transperth Train Operations 752,1<strong>12</strong> 95,437<br />
Railway infrastructure 178,745 61,035<br />
Railcars and road coaches – Transwa 8,235 10,399<br />
Buses and support services 1,796,567 1,757,665<br />
School bus services 1,586,969 1,564,009<br />
Miscellaneous 11,515 9,546<br />
4,336,705 3,502,092<br />
148 <strong>Public</strong> <strong>Transport</strong> <strong>Authority</strong> <strong>Annual</strong> <strong>Report</strong> <strong>2011</strong>-<strong>12</strong>
35 Contingent liabilities and contingent assets<br />
Contingent liabilities<br />
<strong>The</strong> following contingent liabilities are additional to the liabilities included in the financial statements:<br />
Contaminated sites<br />
Under the Contaminated Sites Act 2003, the PTA is required to report known and suspected contaminated sites to the Department of Environment and Conservation (DEC).<br />
In accordance with the Act, DEC classifies these sites on the basis of the risk to human health, the environment and environmental values. Where sites are classified as<br />
contaminated – remediation required or possibly contaminated – investigation required, the PTA may have a liability in respect of investigation or remediation expenses.<br />
During the year, the PTA reported one additional known or suspected contaminated site to DEC. <strong>The</strong> additional site has been classified as report not substantiated.<br />
<strong>The</strong> PTA is unable to assess the outcome of the classification process and accordingly, it is not practicable to estimate the potential financial effect or to identify the<br />
uncertainties relating to the amount or timing of any outflows. Whilst there is no possibility of reimbursement of any future expenses that may be incurred in the remediation<br />
of these sites, the PTA may apply for funding from the Contaminated Sites Management Account to undertake further investigative work or to meet remediation costs that<br />
may be required.<br />
Litigation in progress<br />
A third party has commenced one Supreme Court action against the PTA relating to a claim to provide a Railway Crossing pursuant to Section 102 of the <strong>Public</strong> Works Act.<br />
<strong>The</strong> PTA has denied all liability and is defending the action. It is not possible to estimate the amount of any eventual payments in relation to this claim at balance sheet date.<br />
36 Remuneration of members of the accountable authority and senior officers<br />
Remuneration of members of the accountable authority<br />
<strong>The</strong> number of members of the accountable authority, whose total of fees, salaries, superannuation, non-monetary benefits and other<br />
benefits for the financial year, fall within the following bands are:<br />
$ 20<strong>12</strong> <strong>2011</strong><br />
0 – 10,000 1 1<br />
$000 $000<br />
<strong>The</strong> total remuneration of members of the accountable authority 0 0<br />
<strong>The</strong> total remuneration includes the superannuation expense incurred by the PTA in respect of the member of the accountable authority.<br />
<strong>The</strong> accountable authority of the PTA is the Director General – <strong>Transport</strong> who oversees the agencies Main Roads WA, the Department of <strong>Transport</strong> and the PTA from<br />
3 May 2010. <strong>The</strong> Director General’s remuneration is paid by the Department of <strong>Transport</strong>. <strong>The</strong> day-to-day operations of the PTA are overseen by the Managing Director<br />
whose remuneration is reported under the remuneration of senior officers.<br />
149
Remuneration of senior officers<br />
<strong>The</strong> number of senior officers, other than senior officers reported as members of the accountable authority, whose total fees, salaries, superannuation, non-monetary benefits<br />
and other benefits for the financial year fall within the following bands are:<br />
$ 20<strong>12</strong> <strong>2011</strong><br />
150,001 – 160,000 1 0<br />
160,001 – 170,000 0 2<br />
170,001 – 180,000 1 2<br />
180,001 – 190,000 0 1<br />
190,001 – 200,000 4 4<br />
200,001 – 210,000 2 1<br />
210,001 – 220,000 2 1<br />
230,001 – 240,000 1 0<br />
240,001 – 250,000 0 1<br />
290,001 – 300,000 1 0<br />
<strong>12</strong> <strong>12</strong><br />
$000 $000<br />
<strong>The</strong> total remuneration of senior officers 2,475 2,299<br />
<strong>The</strong> total remuneration includes the superannuation expense incurred by the PTA in respect of senior officers other than the senior officers reported as member of the<br />
accountable authority.<br />
37 Financial instruments<br />
a) Financial risk management objectives and policies<br />
Financial instruments held by the PTA are cash and cash equivalents, restricted cash and cash equivalents, borrowings, receivables and payables. <strong>The</strong> PTA has limited<br />
exposure to financial risks. <strong>The</strong> PTA’s overall risk management program focuses on managing the risks identified below.<br />
Credit risk<br />
Credit risk arises when there is the possibility of the PTA’s receivables defaulting on their contractual obligations resulting in financial loss to the PTA.<br />
<strong>The</strong> maximum exposure to credit risk at end of the reporting period in relation to each class of recognised financial assets is the gross carrying amount of those assets<br />
inclusive of any allowance for impairment as shown in the table at note 37 ‘Financial instruments disclosures’ and note 21 ‘Receivables’.<br />
150 <strong>Public</strong> <strong>Transport</strong> <strong>Authority</strong> <strong>Annual</strong> <strong>Report</strong> <strong>2011</strong>-<strong>12</strong>
Credit risk associated with the PTA’s financial assets is minimal because the main receivable is the amounts receivable for services (holding account). For receivables other<br />
than government, the PTA trades only with recognised, creditworthy third parties. <strong>The</strong> PTA has policies in place to ensure that sales of products and services are made<br />
to customers with an appropriate credit history. In addition, receivable balances are monitored on an ongoing basis with the result that the PTA’s exposure to bad debts is<br />
minimal. At the end of the reporting period there were no significant concentrations of credit risk.<br />
Liquidity risk<br />
Liquidity risk arises when the PTA is unable to meet its financial obligations as they fall due.<br />
<strong>The</strong> PTA is exposed to liquidity risk through its trading in the normal course of business.<br />
<strong>The</strong> PTA has appropriate procedures to manage cash flows including drawdowns of appropriations by monitoring forecast cash flows to ensure that sufficient funds are<br />
available to meet its commitments.<br />
<strong>The</strong> PTA has a short-term liquidity facility of $200 million on which it can draw down to fund temporary cash shortfall. <strong>The</strong> PTA is currently in a net current liability position but<br />
can convert their short-term borrowings at any time as approval from the <strong>Western</strong> Australian Treasury Corporation (WATC) has been obtained. As such, this does not pose a<br />
liquidity risk to the PTA.<br />
Market risk<br />
Market risk is the risk that changes in market prices such as foreign exchange rates and interest rates will affect the PTA’s income or the value of its holdings of<br />
financial instruments.<br />
<strong>The</strong> PTA’s exposure to market risk for changes in interest relates primarily to the long-term debt obligations. <strong>The</strong> PTA’s borrowings are all obtained through WATC and are<br />
repayable at fixed rates with varying maturities. <strong>The</strong> risk is managed by WATC through portfolio diversification and variation in maturity dates. <strong>The</strong> PTA earns interest on the<br />
daily balance of its bank account.<br />
b) Categories of financial instruments<br />
<strong>The</strong> carrying amounts of each of the following categories of financial assets and financial liabilities at the end of the reporting period are:<br />
Financial assets<br />
Cash and cash equivalents 48,138 66,608<br />
Restricted cash and cash equivalents 33,579 28,239<br />
Loans and receivables (i) 1,042,214 915,146<br />
20<strong>12</strong><br />
$000<br />
<strong>2011</strong><br />
$000<br />
Financial liabilities<br />
Financial liabilities measured at amortised cost 1,416,569 1,341,827<br />
(i) <strong>The</strong> amount of loan and receivables excludes GST recoverable from ATO (statutory receivable) and prepayments.<br />
151
c) Financial instrument disclosures<br />
Credit risk<br />
<strong>The</strong> following table discloses the PTA’s maximum exposure to credit risk and the ageing analysis of financial assets. <strong>The</strong> PTA’s maximum exposure to credit risk at the end<br />
of reporting period is the carrying amount of the financial assets as shown below. <strong>The</strong> table discloses the ageing of financial assets that are past due but not impaired and<br />
impaired financial assets. <strong>The</strong> table is based on information provided to senior management of the PTA.<br />
<strong>The</strong> PTA does not hold any collateral as security or other credit enhancement relating to the financial assets it holds.<br />
Aged analysis of financial assets<br />
Carrying<br />
Amount<br />
Not past<br />
due and not<br />
impaired<br />
Up to<br />
1 month<br />
Past due but not impaired<br />
1 to 3<br />
months<br />
3 months<br />
to 1 year<br />
1 to 5<br />
years<br />
More than<br />
5 years<br />
Impaired<br />
financial<br />
assets<br />
Note $000 $000 $000 $000 $000 $000 $000 $000<br />
20<strong>12</strong><br />
Cash and cash equivalents 33 48,138 48,138 0 0 0 0 0 0<br />
Restricted cash and cash equivalents 19 33,579 33,579 0 0 0 0 0 0<br />
Receivables (i) 21 14,077 <strong>12</strong>,656 474 309 484 0 0 154<br />
Amounts receivable for services 22 1,028,137 1,028,137 0 0 0 0 0 0<br />
1,<strong>12</strong>3,931 1,<strong>12</strong>2,510 474 309 484 0 0 154<br />
<strong>2011</strong><br />
Cash and cash equivalents 33 66,608 66,608 0 0 0 0 0 0<br />
Restricted cash and cash equivalents 19 28,239 28,239 0 0 0 0 0 0<br />
Receivables (i) 21 11,917 10,938 439 523 9 0 0 8<br />
Amounts receivable for services 22 903,229 903,229 0 0 0 0 0 0<br />
1,009,993 1,009,014 439 523 9 0 0 8<br />
(i) <strong>The</strong> amount of receivables excludes GST recoverable from ATO (statutory receivable) and prepayments.<br />
152 <strong>Public</strong> <strong>Transport</strong> <strong>Authority</strong> <strong>Annual</strong> <strong>Report</strong> <strong>2011</strong>-<strong>12</strong>
Liquidity risk and interest rate exposure<br />
<strong>The</strong> following table details the PTA’s interest rate exposure and the contractual maturity analysis of financial assets and financial liabilities. <strong>The</strong> maturity analysis section<br />
includes interest and principal cash flows. <strong>The</strong> interest rate exposure section analyses only the carrying amounts of each item.<br />
Interest rate exposures and maturity analysis of financial assets and financial liabilities<br />
Interest rate exposure<br />
Maturity dates<br />
Weighted<br />
average<br />
effective<br />
interest<br />
rate<br />
Carrying<br />
Amount<br />
Fixed<br />
interest<br />
rate<br />
Variable<br />
interest<br />
rate (ii)<br />
Noninterest<br />
bearing<br />
Nominal<br />
Amount<br />
Up to 1<br />
month<br />
1 to 3<br />
months<br />
3 months<br />
to 1 year<br />
1 to 5<br />
years<br />
More than<br />
5 years<br />
Note % $000 $000 $000 $000 $000 $000 $000 $000 $000 $000<br />
20<strong>12</strong><br />
Financial Assets<br />
Cash and cash<br />
equivalents 33 4.68 48,138 0 48,138 0 48,138 48,138 0 0 0 0<br />
Restricted cash and<br />
cash equivalents 19 4.68 33,579 0 33,579 0 33,579 33,579 0 0 0 0<br />
Receivables (i) 21 14,077 0 0 14,077 14,077 14,077 0 0 0 0<br />
Amounts receivable<br />
for services 22 1,028,137 0 0 1,028,137 1,028,137 0 0 24,836 137,468 865,833<br />
1,<strong>12</strong>3,931 0 81,717 1,042,214 1,<strong>12</strong>3,931 95,794 0 24,836 137,468 865,833<br />
Financial Liabilities<br />
Payables 27 97,789 0 0 97,789 97,789 97,789 0 0 0 0<br />
Other current liabilities 30 211 0 0 211 211 211 0 0 0 0<br />
WATC loans (iii) 28 4.94 1,316,602 1,316,602 0 0 1,653,752 207,<strong>12</strong>0 2,304 83,552 391,116 969,660<br />
Commonwealth loans 28 5.93 1,967 1,967 0 0 2,475 0 0 481 1,458 536<br />
1,416,569 1,318,569 0 98,000 1,754,227 305,<strong>12</strong>0 2,304 84,033 392,574 970,196<br />
(i) <strong>The</strong> amount of receivables excludes GST recoverable from ATO (statutory receivable) and prepayments.<br />
(ii) Variable interest rates represent the most recently determined rate applicable to the instrument at the end of reporting period.<br />
(iii) <strong>The</strong> principal repayment of the WATC loans is based on a 25 year repayment schedule.<br />
153
Weighted<br />
average<br />
effective<br />
interest<br />
rate<br />
Carrying<br />
Amount<br />
Interest rate exposure<br />
Fixed<br />
interest<br />
rate<br />
Variable<br />
interest<br />
rate (ii)<br />
Noninterest<br />
bearing<br />
Nominal<br />
Amount<br />
Up to 1<br />
month<br />
1 to 3<br />
months<br />
Maturity dates<br />
3 months<br />
to 1 year<br />
1 to 5<br />
years<br />
More than<br />
5 years<br />
Note % $000 $000 $000 $000 $000 $000 $000 $000 $000 $000<br />
<strong>2011</strong><br />
Financial Assets<br />
Cash and cash<br />
equivalents 33 5.13 66,608 0 66,608 0 66,608 66,608 0 0 0 0<br />
Restricted cash and<br />
cash equivalents 19 5.13 28,239 0 28,239 0 28,239 28,239 0 0 0 0<br />
Receivables (i) 21 11,917 0 0 11,917 11,917 11,917 0 0 0 0<br />
Amounts receivable<br />
for services 22 903,229 0 0 903,229 903,229 0 0 39,958 116,066 747,205<br />
1,009,993 0 94,847 915,146 1,009,993 106,764 0 39,958 116,066 747,205<br />
Financial Liabilities<br />
Payables 27 105,365 0 0 105,365 105,365 105,365 0 0 0 0<br />
Other current liabilities 30 1,254 0 0 1,254 1,254 1,254 0 0 0 0<br />
WATC loans (iii) 28 5.51 1,232,876 1,232,876 0 0 1,500,660 47,762 205,187 429,227 337,073 481,411<br />
Commonwealth loans 28 5.93 2,332 2,332 0 0 2,971 0 0 498 1,672 801<br />
1,341,827 1,235,208 0 106,619 1,610,250 154,381 205,187 429,725 338,745 482,2<strong>12</strong><br />
(i) <strong>The</strong> amount of receivables excludes GST recoverable from ATO (statutory receivable) and prepayments.<br />
(ii) Variable interest rates represent the most recently determined rate applicable to the instrument at the end of reporting period.<br />
(iii) <strong>The</strong> principal repayment of the WATC loans is based on a 25 year repayment schedule.<br />
154 <strong>Public</strong> <strong>Transport</strong> <strong>Authority</strong> <strong>Annual</strong> <strong>Report</strong> <strong>2011</strong>-<strong>12</strong>
Interest rate sensitivity analysis<br />
<strong>The</strong> following table represents a summary of the interest rate sensitivity of the PTA’s financial assets and liabilities at the end of the reporting period on the surplus for the<br />
period and equity for a 1% change in interest rates. It is assumed that the change in interest rates is held constant throughout the reporting period.<br />
-100 basis points +100 basis points<br />
Carrying<br />
amount Surplus Equity Surplus Equity<br />
20<strong>12</strong> $000 $000 $000 $000 $000<br />
Financial Assets<br />
Cash and cash equivalents 48,138 (481) (481) 481 481<br />
Restricted cash and cash equivalents 33,579 (336) (336) 336 336<br />
Total increase/(decrease) (817) (817) 817 817<br />
-100 basis points +100 basis points<br />
Carrying<br />
amount Surplus Equity Surplus Equity<br />
<strong>2011</strong> $000 $000 $000 $000 $000<br />
Financial Assets<br />
Cash and cash equivalents 66,608 (666) (666) 666 666<br />
Restricted cash and cash equivalents 28,239 (282) (282) 282 282<br />
Total increase/(decrease) (948) (948) 948 948<br />
Fair values<br />
All financial assets and liabilities recognised in the Statement of Financial Position, whether they are carried at cost or fair value, are recognised at amounts that represent a<br />
reasonable approximation of fair value unless otherwise stated in the applicable notes.<br />
155
38 Supplementary financial information<br />
Write-offs<br />
<strong>Public</strong> property written-off by the Executive Council during the financial year (i) 9 228<br />
Revenue written-off (i) 0 9<br />
9 237<br />
20<strong>12</strong><br />
$000<br />
<strong>2011</strong><br />
$000<br />
Losses through theft, defaults and other causes<br />
Losses of public moneys and public and other property through theft or default 17 5<br />
(i) During the financial year $9,345 (<strong>2011</strong>: $227,598) was written off the PTA’s asset register and $113 (<strong>2011</strong>: $9,259) of bad debts were written off.<br />
39 Events occurring after the end of reporting period<br />
<strong>The</strong> PTA has not identified any material events after the end of reporting period that would require adjustment or disclosure to be made.<br />
40 Explanatory statement<br />
a) Significant variances between estimated and actual result for the financial year<br />
Details and reasons for significant variations between estimates and actual results are detailed below. Significant variations are considered to be those greater than<br />
10% or $5 million.<br />
20<strong>12</strong> 20<strong>12</strong><br />
Actual Estimate Variance<br />
$000 $000 $000<br />
Income 233,224 199,942 33,282<br />
Cost of Services 1,076,687 1,097,519 20,832<br />
Net Cost of Services 843,463 897,577 54,114<br />
Revenue<br />
Revenue was $33.3 million (16.6%) above the estimate. <strong>The</strong> variations include increased:<br />
• fare revenue from increased patronage<br />
• revenue from ticket infringements, advertising and parking<br />
156 <strong>Public</strong> <strong>Transport</strong> <strong>Authority</strong> <strong>Annual</strong> <strong>Report</strong> <strong>2011</strong>-<strong>12</strong>
• revenue from services funded by external parties<br />
• interest revenue through holding the City of Perth contribution to the Perth City Link project.<br />
Total cost of services<br />
Cost of services for the year was $20.8 million (1.9%) below the estimate.<br />
<strong>The</strong>re were several significant variations that contributed to this overall variation. <strong>The</strong>se variations include:<br />
• Decreased interest costs of $16.5 million<br />
• Decreased depreciation costs of $9.4 million resulting from deferral of the asset investment program and unfunded depreciation related to the freight<br />
network infrastructure.<br />
Offset by:<br />
• Increased grants and subsidies of $3.3 million for the grain freight network<br />
• Increased provision for contaminated sites to be remediated of $2.2 million.<br />
b) Significant variations between actual revenues and expenditures for the financial year and revenues and expenditures for the immediately<br />
preceding financial year<br />
Details and reasons for significant variations between actual results with the corresponding items of the preceding year are detailed below. Significant variations are<br />
considered to be those greater than 10% or $5 million.<br />
20<strong>12</strong> <strong>2011</strong><br />
Actual Actual Variance<br />
$000 $000 $000<br />
Income<br />
User charges and fees 192,003 170,869 21,134<br />
Other revenue 32,164 52,483 (20,319)<br />
Interest revenue 3,<strong>12</strong>5 2,042 1,083<br />
Expenses<br />
Employee benefits expense 135,193 <strong>12</strong>5,936 9,257<br />
Grants and subsidies expense 379,867 345,647 34,220<br />
Supplies and services 201,439 184,032 17,407<br />
Energy and fuel 25,236 22,545 2,691<br />
Other expenses 20,818 16,168 4,650<br />
Loss on disposal of non-current assets 816 101 715<br />
157
User charges and fees<br />
Increased user charges and fees mainly due to fare increases and patronage increase.<br />
Other revenue<br />
Decreased other revenue mainly due to a contribution of $25.6 million from the City of Perth for the Perth City Link project in the previous year, offset by increased revenue<br />
from services funded by external parties and increased income from leased properties.<br />
Interest revenue<br />
Increased interest revenue mainly through holding the funding from the City of Perth contribution to the Perth City Link project.<br />
Employee benefits expense<br />
Increased employee benefits expense mainly due to increased FTE, yearly salary and wages increment based on the Enterprise Bargaining Agreement and voluntary<br />
severance payments.<br />
Grants and subsidies expense<br />
Increased grants and subsidies expense of $34.2 million mainly due to increased:<br />
• bus service kilometres for the Transperth Bus Network<br />
• labour and fuel costs for the Transperth and School bus operators<br />
• grants and subsidies of $3.3 million for the grain freight network.<br />
Supplies and services<br />
Increased supplies and services expense of $17.4 million mainly due to increased:<br />
• maintenance of railcars<br />
• security on rail and buses<br />
• signage<br />
• contaminated sites provision<br />
• retrofit of perimeter seating to buses.<br />
Energy and fuel<br />
Increased energy costs mainly due to an increase in electricity tariffs.<br />
Other expenses<br />
Increased other expenses mainly due to increased workers’ compensation contributions to Riskcover and crediting infringements revenue to the Consolidated Account.<br />
Loss on disposal of non-current assets<br />
Increased loss on disposal of non-current assets mainly due to sale of buses which had a higher written down value.<br />
158 <strong>Public</strong> <strong>Transport</strong> <strong>Authority</strong> <strong>Annual</strong> <strong>Report</strong> <strong>2011</strong>-<strong>12</strong>
41 Schedule of income and expenses by service<br />
Metropolitan and Regional<br />
Passenger Services<br />
Country Passenger Rail<br />
and Road Coach Services<br />
Regional School Bus<br />
Services<br />
Rail Corridor and Residual<br />
Freight Issues<br />
20<strong>12</strong> <strong>2011</strong> 20<strong>12</strong> <strong>2011</strong> 20<strong>12</strong> <strong>2011</strong> 20<strong>12</strong> <strong>2011</strong> 20<strong>12</strong> <strong>2011</strong><br />
$000 $000 $000 $000 $000 $000 $000 $000 $000 $000<br />
Cost of Services<br />
Expenses<br />
Employee benefits expenses 1<strong>12</strong>,952 109,8<strong>12</strong> <strong>12</strong>,607 11,756 3,543 3,200 6,091 1,168 135,193 <strong>12</strong>5,936<br />
Supplies and Services 169,199 153,481 22,184 22,555 1,393 1,068 8,663 6,928 201,439 184,032<br />
Depreciation and<br />
amortisation expense 153,003 151,142 4,409 4,414 1,077 738 87,157 86,663 245,646 242,957<br />
Finance costs 59,561 58,235 3,415 3,620 0 0 4,696 4,463 67,672 66,318<br />
Grants and subsidies 272,373 244,803 0 0 103,079 100,844 4,415 0 379,867 345,647<br />
Energy and fuel 21,474 19,104 2,624 2,491 24 0 1,114 950 25,236 22,545<br />
Loss on disposal of<br />
non-current assets 816 351 0 0 0 0 0 (250) 816 101<br />
Other expenses 18,501 14,<strong>12</strong>6 1,268 1,388 472 230 577 424 20,818 16,168<br />
Total cost of services 807,879 751,054 46,507 46,224 109,588 106,080 1<strong>12</strong>,713 100,346 1,076,687 1,003,704<br />
Income<br />
User charges and fees 176,039 156,056 11,217 10,413 4,747 4,400 0 0 192,003 170,869<br />
Operating lease revenue 0 0 0 0 0 0 5,466 5,466 5,466 5,466<br />
Commonwealth grants and<br />
contributions 364 343 91 86 0 0 11 11 466 440<br />
Interest revenue 0 0 0 0 0 0 3,<strong>12</strong>5 2,042 3,<strong>12</strong>5 2,042<br />
Other revenue 20,770 43,<strong>12</strong>6 18 19 0 0 11,376 9,338 32,164 52,483<br />
Total income other<br />
than income from<br />
State Government 197,173 199,525 11,326 10,518 4,747 4,400 19,978 16,857 233,224 231,300<br />
Net Cost of Services 610,706 551,529 35,181 35,706 104,841 101,680 92,735 83,489 843,463 772,404<br />
Total<br />
159
Metropolitan and Regional<br />
Passenger Services<br />
Country Passenger Rail<br />
and Road Coach Services<br />
Regional School Bus<br />
Services<br />
Rail Corridor and Residual<br />
Freight Issues<br />
20<strong>12</strong> <strong>2011</strong> 20<strong>12</strong> <strong>2011</strong> 20<strong>12</strong> <strong>2011</strong> 20<strong>12</strong> <strong>2011</strong> 20<strong>12</strong> <strong>2011</strong><br />
$000 $000 $000 $000 $000 $000 $000 $000 $000 $000<br />
Income from State<br />
Government<br />
Service appropriation 634,981 587,163 38,863 37,257 102,146 100,996 199 5,770 776,189 731,186<br />
Resources received free<br />
of charge 0 0 0 0 0 0 455 361 455 361<br />
Royalties for Regions 0 0 7 0 3,000 1,900 0 0 3,007 1,900<br />
Contributions – other<br />
government agencies 1,437 992 0 0 0 0 0 0 1,437 992<br />
Total income from<br />
State Government 636,418 588,155 38,870 37,257 105,146 102,896 654 6,131 781,088 734,439<br />
Surplus/(deficit)<br />
for the period 25,7<strong>12</strong> 36,626 3,689 1,551 305 1,216 (92,081) (77,358) (62,375) (37,965)<br />
<strong>The</strong> Schedule of Income and Expenses by Service should be read in conjunction with the accompanying notes.<br />
Total<br />
42 Remuneration of auditor<br />
Remuneration paid or payable to the Auditor General in respect of the audit for the current financial year is as follows:<br />
Auditing the accounts, financial statements and key performance indicators 166 155<br />
20<strong>12</strong><br />
$000<br />
<strong>2011</strong><br />
$000<br />
160 <strong>Public</strong> <strong>Transport</strong> <strong>Authority</strong> <strong>Annual</strong> <strong>Report</strong> <strong>2011</strong>-<strong>12</strong>
<strong>Public</strong> <strong>Transport</strong> Centre,<br />
West Parade, Perth, WA 6000<br />
PO Box 8<strong>12</strong>5,<br />
Perth Business Centre,<br />
Perth, WA 6849<br />
enquire@pta.wa.gov.au<br />
www.pta.wa.gov.au<br />
Telephone (08) 9326 2000