Canara Bank - The Smart Investor
Canara Bank - The Smart Investor
Canara Bank - The Smart Investor

You also want an ePaper? Increase the reach of your titles
YUMPU automatically turns print PDFs into web optimized ePapers that Google loves.
4QFY2012 Result Update | <strong>Bank</strong>ing<br />
May 10, 2012<br />
<strong>Canara</strong> <strong>Bank</strong><br />
Performance Highlights<br />
Particulars (` cr) 4QFY12 3QFY12 % chg (qoq) 4QFY11 % chg (yoy)<br />
NII 2,040 1,919 6.3 1,973 3.4<br />
Pre-prov. profit 1,491 1,577 (5.5) 1,695 (12.0)<br />
PAT 829 876 (5.3) 899 (7.8)<br />
Source: Company, Angel Research<br />
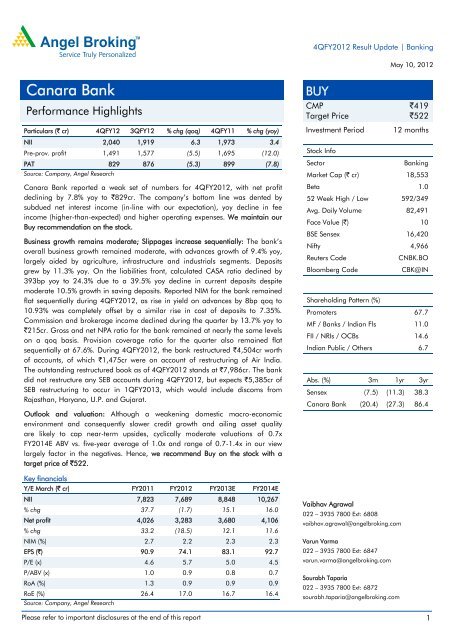
<strong>Canara</strong> <strong>Bank</strong> reported a weak set of numbers for 4QFY2012, with net profit<br />
declining by 7.8% yoy to `829cr. <strong>The</strong> company’s bottom line was dented by<br />
subdued net interest income (in-line with our expectation), yoy decline in fee<br />
income (higher-than-expected) and higher operating expenses. We maintain our<br />
Buy recommendation on the stock.<br />
Business growth remains moderate; Slippages increase sequentially: <strong>The</strong> bank’s<br />
overall business growth remained moderate, with advances growth of 9.4% yoy,<br />
largely aided by agriculture, infrastructure and industrials segments. Deposits<br />
grew by 11.3% yoy. On the liabilities front, calculated CASA ratio declined by<br />
393bp yoy to 24.3% due to a 39.5% yoy decline in current deposits despite<br />
moderate 10.5% growth in saving deposits. Reported NIM for the bank remained<br />
flat sequentially during 4QFY2012, as rise in yield on advances by 8bp qoq to<br />
10.93% was completely offset by a similar rise in cost of deposits to 7.35%.<br />
Commission and brokerage income declined during the quarter by 13.7% yoy to<br />
`215cr. Gross and net NPA ratio for the bank remained at nearly the same levels<br />
on a qoq basis. Provision coverage ratio for the quarter also remained flat<br />
sequentially at 67.6%. During 4QFY2012, the bank restructured `4,504cr worth<br />
of accounts, of which `1,475cr were on account of restructuring of Air India.<br />
<strong>The</strong> outstanding restructured book as of 4QFY2012 stands at `7,986cr. <strong>The</strong> bank<br />
did not restructure any SEB accounts during 4QFY2012, but expects `5,385cr of<br />
SEB restructuring to occur in 1QFY2013, which would include discoms from<br />
Rajasthan, Haryana, U.P. and Gujarat.<br />
Outlook and valuation: Although a weakening domestic macro-economic<br />
environment and consequently slower credit growth and ailing asset quality<br />
are likely to cap near-term upsides, cyclically moderate valuations of 0.7x<br />
FY2014E ABV vs. five-year average of 1.0x and range of 0.7-1.4x in our view<br />
largely factor in the negatives. Hence, we recommend Buy on the stock with a<br />
target price of `522.<br />
Key financials<br />
Y/E March (` cr) FY2011 FY2012 FY2013E FY2014E<br />
NII 7,823 7,689 8,848 10,267<br />
% chg 37.7 (1.7) 15.1 16.0<br />
Net profit 4,026 3,283 3,680 4,106<br />
% chg 33.2 (18.5) 12.1 11.6<br />
NIM (%) 2.7 2.2 2.3 2.3<br />
EPS (`) 90.9 74.1 83.1 92.7<br />
P/E (x) 4.6 5.7 5.0 4.5<br />
P/ABV (x) 1.0 0.9 0.8 0.7<br />
RoA (%) 1.3 0.9 0.9 0.9<br />
RoE (%) 26.4 17.0 16.7 16.4<br />
Source: Company, Angel Research<br />
BUY<br />
CMP<br />
`419<br />
Target Price<br />
`522<br />
Investment Period 12 months<br />
Stock Info<br />
Sector<br />
<strong>Bank</strong>ing<br />
Market Cap (` cr) 18,553<br />
Beta 1.0<br />
52 Week High / Low 592/349<br />
Avg. Daily Volume 82,491<br />
Face Value (`) 10<br />
BSE Sensex 16,420<br />
Nifty 4,966<br />
Reuters Code<br />
CNBK.BO<br />
Bloomberg Code<br />
CBK@IN<br />
Shareholding Pattern (%)<br />
Promoters 67.7<br />
MF / <strong>Bank</strong>s / Indian Fls 11.0<br />
FII / NRIs / OCBs 14.6<br />
Indian Public / Others 6.7<br />
Abs. (%) 3m 1yr 3yr<br />
Sensex (7.5) (11.3) 38.3<br />
<strong>Canara</strong> <strong>Bank</strong> (20.4) (27.3) 86.4<br />
Vaibhav Agrawal<br />
022 – 3935 7800 Ext: 6808<br />
vaibhav.agrawal@angelbroking.com<br />
Varun Varma<br />
022 – 3935 7800 Ext: 6847<br />
varun.varma@angelbroking.com<br />
Sourabh Taparia<br />
022 – 3935 7800 Ext: 6872<br />
sourabh.taparia@angelbroking.com<br />
Please refer to important disclosures at the end of this report 1
<strong>Canara</strong> <strong>Bank</strong> | 4QFY2012 Result Update<br />
Exhibit 1: 4QFY2012 performance<br />
Particulars (` cr)<br />
4QFY12 3QFY12 % chg (qoq) 4QFY11 % chg (yoy)<br />
Interest earned 8,267 7,812 5.8 6,418 28.8<br />
- on Advances / Bills 6,189 5,946 4.1 4,823 28.3<br />
- on investments 1,908 1,810 5.4 1,521 25.4<br />
- on balance with RBI & others 170 56 201.5 73 132.7<br />
- on others (0) 0 (107.1) 1 (103.4)<br />
Interest Expended 6,227 5,894 5.7 4,445 40.1<br />
Net Interest Income 2,040 1,919 6.3 1,973 3.4<br />
Other income 769 779 (1.3) 933 (17.5)<br />
Other income excl. treasury 674 622 8.4 951 (29.1)<br />
- Fee Income 215 205 4.9 249 (13.7)<br />
- Treasury Income 95 157 (39.5) (18) NA<br />
- Recov. from written off a/cs 98 68 44.1 327 (70.0)<br />
- Others 361 349 3.5 375 (3.6)<br />
Operating income 2,809 2,698 4.1 2,906 (3.3)<br />
Operating expenses 1,319 1,121 17.7 1,211 8.9<br />
- Employee expenses 826 713 15.9 783 5.6<br />
- Other Opex 493 408 20.7 428 15.0<br />
Pre-provision Profit 1,491 1,577 (5.5) 1,695 (12.0)<br />
Provisions & Contingencies 462 501 (7.9) 546 (15.5)<br />
- Provisions for NPAs 390 142 174.6 541 (27.9)<br />
- Other Provisions 72 359 (80.1) 5 1,340.8<br />
PBT 1,029 1,076 (4.3) 1,149 (10.4)<br />
Provision for Tax 200 200 - 250 (20.0)<br />
PAT 829 876 (5.3) 899 (7.8)<br />
Effective Tax Rate (%) 19.4 18.6 84bp 21.8 (233)bp<br />
Source: Company, Angel Research<br />
Exhibit 2: 4QFY2012 Actual vs. Estimates<br />
Particulars (` cr) Actual Estimates Var (%)<br />
NII 2,040 2,019 1.0<br />
Non-interest income 769 861 (10.6)<br />
Operating income 2,809 2,880 (2.5)<br />
Operating expenses 1,319 1,196 10.3<br />
Pre-prov. profit 1,491 1,685 (11.5)<br />
Provisions & cont. 462 391 18.0<br />
PBT 1,029 1,293 (20.4)<br />
Prov. for taxes 200 313 (36.1)<br />
PAT 829 981 (15.4)<br />
Source: Company, Angel Research<br />
May 10, 2012 2
<strong>Canara</strong> <strong>Bank</strong> | 4QFY2012 Result Update<br />
Exhibit 3: 4QFY2012 performance analysis<br />
Particulars 4QFY12 3QFY12 %chg (qoq) 4QFY11 %chg (yoy)<br />
Balance sheet<br />
Advances (` cr) 232,490 219,253 6.0 212,467 9.4<br />
Deposits (` cr) 327,054 315,456 3.7 293,973 11.3<br />
Credit-to-Deposit Ratio (%) 71.1 69.5 158bp 72.3 (119)bp<br />
Current deposits (` cr) 14,819 12,059 22.9 24,500 (39.5)<br />
Saving deposits (` cr) 64,792 63,361 2.3 58,617 10.5<br />
CASA deposits (` cr) 79,611 75,420 5.6 83,117 (4.2)<br />
Calculated CASA ratio (%) 24.3 23.9 43bp 28.3 (393)bp<br />
CAR (%) 13.8 13.2 54bp 15.4 (162)bp<br />
Tier 1 CAR (%) 10.4 9.5 87bp 10.9 (52)bp<br />
Profitability Ratios (%)<br />
Cost of deposits 7.4 7.3 8bp 5.8 155bp<br />
Yield on advances 10.9 10.9 8bp 9.7 120bp<br />
Yield on investments 8.0 7.9 3bp 7.7 24bp<br />
Yield on funds 9.0 8.8 16bp 8.1 82bp<br />
Cost of funds 6.7 6.6 13bp 5.4 135bp<br />
Reported NIM 2.5 2.5 (2)bp 3.1 (62)bp<br />
Cost-to-income ratio 46.9 41.6 539bp 41.7 527bp<br />
Asset quality<br />
Gross NPAs (` cr) 4,032 3,999 0.8 3,089 30.5<br />
Gross NPAs (%) 1.7 1.8 (8)bp 1.5 28bp<br />
Net NPAs (` cr) 3,386 3,265 3.7 2,347 44.3<br />
Net NPAs (%) 1.5 1.5 (3)bp 1.1 35bp<br />
PCR incl. tech. w/offs (%) 67.6 67.9 (27)bp 73.0 (540)bp<br />
Slippage ratio (%) 2.1 1.6 49bp 4.4 (224)bp<br />
NPA to avg. assets (%) 0.4 0.2 27bp 0.7 (26)bp<br />
Source: Company, Angel Research<br />
Business growth remains moderate; NIM remains flat<br />
<strong>The</strong> bank’s overall business growth remained moderate, with advances growing by<br />
9.4% yoy and deposits growing by 11.3% yoy. Growth in advances was largely<br />
aided by segments such as agriculture, infrastructure and industrials, which grew<br />
by 21.4%, 16.5% and 15.4% yoy, respectively. While segments such retail and SME<br />
witnessed a decline of 1.9% and 7.4% yoy, respectively.<br />
On the liabilities front, the volatile current account deposits decreased by 39.5%<br />
yoy (up 22.3% qoq on account of 4Q phenomena), while saving account deposits<br />
witnessed an increase of 10.5% yoy (2.3% qoq). Consequently, calculated CASA<br />
ratio for the bank declined by 393bp yoy to 24.3% (up by 43bp sequentially).<br />
May 10, 2012 3
<strong>Canara</strong> <strong>Bank</strong> | 4QFY2012 Result Update<br />
Exhibit 4: Business growth remains moderate<br />
Exhibit 5: CASA decline continues in 4QFY2012<br />
Adv. yoy chg (%) Dep. yoy chg (%) CDR (%, RHS)<br />
Calculated CASA ratio<br />
CASA yoy growth (%, RHS)<br />
28.0<br />
21.0<br />
14.0<br />
7.0<br />
72.3<br />
25.5<br />
25.3<br />
71.6<br />
23.7<br />
25.7<br />
69.7<br />
23.8<br />
25.4<br />
69.5<br />
15.5<br />
19.7<br />
71.1<br />
9.4<br />
11.3<br />
74.0<br />
72.0<br />
70.0<br />
30.0<br />
27.5<br />
25.0<br />
22.5<br />
21.8<br />
28.3<br />
9.7<br />
25.4<br />
12.2<br />
25.8<br />
(1.4)<br />
23.9<br />
(4.2)<br />
24.3<br />
30.0<br />
20.0<br />
10.0<br />
-<br />
-<br />
4QFY11 1QFY12 2QFY12 3QFY12 4QFY12<br />
68.0<br />
20.0<br />
4QFY11 1QFY12 2QFY12 3QFY12 4QFY12<br />
(10.0)<br />
Source: Company, Angel Research<br />
Source: Company, Angel Research<br />
<strong>The</strong> bank’s reported NIM remained flat sequentially during 4QFY2012, as the 8bp<br />
qoq rise in yield on advances to 10.93% was completely offset by a similar rise in<br />
cost of deposits to 7.35%. Management attributed the declining trend in CASA<br />
ratio mostly to the flight of saving deposits to higher yielding term deposits and<br />
difficulty in sustaining the current account balances due to prevalent domestic<br />
macro headwinds.<br />
Exhibit 6: YoA up by 8bp qoq, but similar rise in COD...<br />
Exhibit 7: ...results in flat reported NIM<br />
(%)<br />
11.00<br />
10.50<br />
10.72 10.85 10.93<br />
(%)<br />
3.50<br />
3.12<br />
10.00<br />
9.00<br />
9.73<br />
3.00<br />
2.50<br />
2.00<br />
2.42<br />
2.64<br />
2.52 2.50<br />
8.00<br />
1.50<br />
7.00<br />
4QFY11 1QFY12 2QFY12 3QFY12 4QFY12<br />
1.00<br />
4QFY11 1QFY12 2QFY12 3QFY12 4QFY12<br />
Source: Company, Angel Research<br />
Source: Company, Angel Research<br />
Fee income declines on a yoy basis on account of a dip in<br />
commission and brokerage income<br />
Commission and brokerage income declined during the quarter by 13.7% yoy to<br />
`215cr. Recoveries from written-off accounts, which halved sequentially in the last<br />
quarter to `68cr, picked up momentum once again as they grew by 44.1%<br />
sequentially. Treasury income posted a healthy performance growing to `95cr in<br />
4QFY2012 from loss of `18cr in 4QFY2011. Overall, core fee income declined by<br />
29.1% yoy to `674cr.<br />
May 10, 2012 4
<strong>Canara</strong> <strong>Bank</strong> | 4QFY2012 Result Update<br />
Exhibit 8: Fee income declines on a yoy basis during 4QFY2012<br />
Particulars (` cr) 4QFY12 3QFY12 % chg (qoq) 4QFY11 % chg (yoy)<br />
CEB 215 205 4.9 249 (13.7)<br />
Treasury 95 157 (39.5) (18) NA<br />
Recoveries 98 68 44.1 327 (70.0)<br />
Others 361 349 3.5 375 (3.6)<br />
Other income 769 779 (1.3) 933 (17.5)<br />
Other income excl. treasury 674 622 8.4 951 (29.1)<br />
Source: Company, Angel Research<br />
Slippages increase sequentially<br />
Gross and net NPA ratio for the bank remained at nearly the same levels on a qoq<br />
basis. As of 4QFY2012, gross NPA ratio stood at 1.73% (1.81% in 3QFY2012),<br />
while net NPA ratio stood at 1.46% (1.49% in 3QFY2012). Provision coverage<br />
ratio for the quarter remained flat sequentially at 67.6%. Slippages on an absolute<br />
basis increased sequentially by ~`250cr. While recoveries/upgrades improved<br />
sequentially by `59cr, write-offs increased by almost three times on a qoq basis,<br />
hence limiting the increase in gross NPA to ~`33cr only. <strong>The</strong> bank’s gross<br />
annualized slippage ratio, which was improving constantly for the past few<br />
quarters, increased sequentially by ~50bp to 2.1%, though it still remains at much<br />
lower levels than the highs of 4.4% witnessed in 4QFY2011.<br />
During 4QFY2012, the bank restructured `4,504cr worth of accounts, of which<br />
`1,475cr were on account of restructuring of Air India. NPV loss on Air India<br />
restructuring equally amortized over eight quarters beginning 1QFY2013 amounts<br />
to `19cr. <strong>The</strong> outstanding restructured book as of 4QFY2012 stands at `7,986cr.<br />
<strong>The</strong> bank did not restructure any SEB accounts during 4QFY2012 but expects<br />
`5,385cr of SEB restructuring to occur in 1QFY2013, which would include discoms<br />
from Rajasthan, Haryana, U.P. and Gujarat. However, management also<br />
mentioned that rest of the SEB exposure of the bank (~`6,600cr) is performing<br />
and there would be no NPV loss on account of SEB restructuring.<br />
Exhibit 9: Slippages increase sequentially<br />
Exhibit 10: Sequentially stable NPA ratios<br />
Slippages (%)<br />
Credit cost (%, RHS)<br />
Gross NPAs (%) Net NPAs (%) PCR (%, RHS)<br />
5.0<br />
0.7<br />
0.8<br />
2.0<br />
80.0<br />
4.0<br />
3.0<br />
2.0<br />
1.0<br />
4.4<br />
0.3<br />
2.6<br />
0.5<br />
2.3<br />
0.2<br />
1.6<br />
0.4<br />
2.1<br />
0.6<br />
0.4<br />
0.2<br />
1.5<br />
1.0<br />
0.5<br />
73.0<br />
1.5<br />
1.1<br />
69.5<br />
1.7<br />
1.3<br />
68.6<br />
1.7<br />
1.4<br />
67.9 67.6<br />
1.8<br />
1.5<br />
1.7<br />
1.5<br />
75.0<br />
70.0<br />
65.0<br />
-<br />
4QFY11 1QFY12 2QFY12 3QFY12 4QFY12<br />
-<br />
-<br />
4QFY11 1QFY12 2QFY12 3QFY12 4QFY12<br />
60.0<br />
Source: Company, Angel Research<br />
Source: Company, Angel Research; Note: PCR including tech. write-offs<br />
May 10, 2012 5
<strong>Canara</strong> <strong>Bank</strong> | 4QFY2012 Result Update<br />
Exhibit 11: Strong rise in branch network<br />
Exhibit 12: Cost ratios rise sequentially on higher opex<br />
3,650<br />
3,500<br />
3,350<br />
3,200<br />
3,257 3,277<br />
3,437<br />
3,569<br />
3,600<br />
48.0<br />
46.0<br />
44.0<br />
42.0<br />
Cost-to-income ratio (%)<br />
1.5<br />
1.2<br />
Opex to average assets (%, RHS)<br />
2.0<br />
1.4<br />
1.4<br />
1.2<br />
1.5<br />
1.0<br />
3,050<br />
40.0<br />
41.7<br />
45.2<br />
42.5<br />
41.6<br />
46.9<br />
0.5<br />
2,900<br />
4QFY11 1QFY12 2QFY12 3QFY12 4QFY12<br />
38.0<br />
4QFY11 1QFY12 2QFY12 3QFY12 4QFY12<br />
-<br />
Source: Company, Angel Research<br />
Source: Company, Angel Research<br />
Investment concerns<br />
Weak liability franchise likely to keep NIM under pressure<br />
<strong>The</strong> bank has a relatively weak liability profile with a calculated CASA base at<br />
24.3% as of 4QFY2012. As witnessed in 3QFY2012, overall CASA deposits again<br />
declined by 4.2% yoy in 4QFY2012 as compared to 21.8% yoy growth witnessed<br />
in 4QFY2011. <strong>The</strong> bank had relatively high proportion of more costly bulk<br />
deposits and CDs at ~43% of deposits in 4QFY2012 as against ~30% in<br />
3QFY2012, which increases the bank’s exposure to interest rate movements. Due<br />
to tight liquidity situation prevalent in 4QFY2012, margins continued to remain<br />
under check. Accordingly, we keep our NIM forecast for FY2013 at 2.2%.<br />
Outlook and valuation<br />
<strong>The</strong> bank has embarked on a relatively aggressive network expansion plan. Over<br />
the past one year, the bank has added over 323 branches and 642 ATMs. Such a<br />
pace of network expansion should augur well, in our view, for strengthening the<br />
bank’s relatively weak liability franchise.<br />
Though a weakening domestic macro-economic environment and consequently<br />
slower credit growth and ailing asset quality are likely to cap near-term upsides,<br />
cyclically moderate valuations of 0.7x FY2014E ABV vs. five-year average of 1.0x<br />
and range of 0.7-1.4x in our view largely factor in the negatives. Hence,<br />
we recommend Buy on the stock with a target price of `522.<br />
May 10, 2012 6
<strong>Canara</strong> <strong>Bank</strong> | 4QFY2012 Result Update<br />
Exhibit 13: Key assumptions<br />
Particulars (%)<br />
Earlier estimates Revised estimates<br />
FY2013 FY2014 FY2013 FY2014<br />
Credit growth 17.0 18.0 18.0 18.0<br />
Deposit growth 16.0 18.0 13.0 18.0<br />
CASA ratio 25.4 24.6 24.3 23.7<br />
NIMs 2.2 2.2 2.3 2.3<br />
Other income growth 11.2 14.3 9.8 13.2<br />
Growth in staff expenses 15.0 15.0 15.0 15.0<br />
Growth in other expenses 15.0 15.0 15.0 15.0<br />
Slippages 1.8 1.7 1.6 1.5<br />
Coverage 69.0 70.0 67.6 68.0<br />
Source: Angel Research<br />
Exhibit 14: Change in estimates<br />
FY2013<br />
FY2014<br />
Particulars (` cr) Earlier Revised<br />
Earlier Revised<br />
Var. (%)<br />
Var. (%)<br />
estimates estimates estimates estimates<br />
NII 8,791 8,848 0.6 10,204 10,267 0.6<br />
Non-interest income 3,329 3,213 (3.5) 3,805 3,639 (4.4)<br />
Operating income 12,120 12,061 (0.5) 14,009 13,906 (0.7)<br />
Operating expenses 5,233 5,375 2.7 6,018 6,181 2.7<br />
Pre-prov. profit 6,887 6,686 (2.9) 7,990 7,725 (3.3)<br />
Provisions & cont. 1,463 1,428 (2.4) 1,736 1,647 (5.2)<br />
PBT 5,424 5,258 (3.1) 6,254 6,078 (2.8)<br />
Prov. for taxes 1,627 1,577 (3.1) 2,029 1,972 (2.8)<br />
PAT 3,797 3,680 (3.1) 4,225 4,106 (2.8)<br />
Source: Angel Research<br />
Exhibit 15: P/ABV band<br />
1200<br />
Price (`) 0.75x 1x 1.25x 1.5x 1.75x<br />
1000<br />
800<br />
600<br />
400<br />
200<br />
0<br />
Apr-06<br />
Oct-06<br />
Apr-07<br />
Oct-07<br />
Apr-08<br />
Oct-08<br />
Apr-09<br />
Oct-09<br />
Apr-10<br />
Oct-10<br />
Apr-11<br />
Oct-11<br />
Apr-12<br />
Oct-12<br />
Source: Company, Angel Research<br />
May 10, 2012 7
<strong>Canara</strong> <strong>Bank</strong> | 4QFY2012 Result Update<br />
Exhibit 16: Recommendation summary<br />
Company<br />
Reco.<br />
CMP<br />
(`)<br />
Tgt. price<br />
(`)<br />
Upside<br />
(%)<br />
FY2014E<br />
P/ABV (x)<br />
FY2014E<br />
Tgt P/ABV (x)<br />
FY2014E<br />
P/E (x)<br />
FY2012-14E<br />
EPS CAGR (%)<br />
FY2014E<br />
RoA (%)<br />
FY2014E<br />
RoE (%)<br />
AxisBk Buy 979 1,587 62.1 1.3 2.2 7.0 16.4 1.5 20.3<br />
FedBk Neutral 408 - - 1.0 - 7.1 13.0 1.3 14.5<br />
HDFCBk Accumulate 517 567 9.7 3.0 3.3 14.6 27.0 1.7 22.1<br />
ICICIBk* Buy 813 1,201 47.8 1.3 1.9 10.0 20.4 1.5 16.0<br />
SIB Neutral 23 - - 1.1 - 6.1 4.5 0.8 17.5<br />
YesBk Buy 326 470 43.9 1.7 2.4 7.9 22.5 1.4 23.3<br />
AllBk Accumulate 152 166 9.3 0.6 0.7 3.6 6.2 0.9 17.6<br />
AndhBk Neutral 105 - - 0.6 - 4.1 3.3 0.9 16.0<br />
BOB Buy 641 925 44.5 0.7 1.1 4.3 11.1 1.1 18.2<br />
BOI Buy 353 411 16.3 0.7 1.0 4.4 23.3 0.8 16.9<br />
BOM Buy 48 57 18.7 0.6 0.7 3.7 45.3 0.7 17.2<br />
CanBk Buy 419 522 24.7 0.7 0.9 4.5 11.8 0.9 16.4<br />
CentBk Neutral 77 - - 0.7 - 3.9 45.7 0.5 13.8<br />
CorpBk Buy 404 504 24.7 0.5 0.7 3.6 5.3 0.8 16.5<br />
DenaBk Buy 84 118 39.8 0.5 0.7 3.3 6.2 0.9 16.9<br />
IDBI# Buy 92 117 26.5 0.6 0.7 3.9 22.7 0.9 14.8<br />
IndBk Buy 196 240 22.4 0.7 0.8 4.0 5.4 1.2 18.2<br />
IOB Buy 82 101 23.7 0.5 0.6 3.8 28.3 0.6 13.9<br />
J&KBk Neutral 854 - - 0.8 - 4.4 8.8 1.4 18.6<br />
OBC Buy 220 285 29.6 0.5 0.6 3.4 27.7 0.8 14.3<br />
PNB Buy 754 1,117 48.1 0.7 1.1 4.3 10.3 1.0 18.1<br />
SBI* Buy 1,844 2,593 40.6 1.1 1.6 6.8 23.6 1.0 19.1<br />
SynBk Buy 91 128 41.1 0.5 0.8 3.3 8.7 0.8 17.1<br />
UcoBk Neutral 68 - - 0.8 - 4.7 7.0 0.5 13.4<br />
UnionBk Buy 203 276 35.9 0.7 0.9 4.0 24.8 0.8 17.5<br />
UtdBk Buy 58 85 46.3 0.4 0.6 2.7 11.4 0.7 15.9<br />
VijBk Neutral 53 - - 0.6 - 4.3 13.5 0.5 13.7<br />
Source: Company, Angel Research; Note:*Target multiples=SOTP Target Price/ABV (including subsidiaries), # Without adjusting for SASF<br />
May 10, 2012 8
<strong>Canara</strong> <strong>Bank</strong> | 4QFY2012 Result Update<br />
Income statement<br />
Y/E March (` cr) FY09 FY10 FY11 FY12 FY13E FY14E<br />
Net Interest Income 4,718 5,681 7,823 7,689 8,848 10,267<br />
- YoY Growth (%) 33.4 20.4 37.7 (1.7) 15.1 16.0<br />
Other Income 2,427 2,858 2,703 2,928 3,213 3,639<br />
- YoY Growth (%) 5.1 17.7 (5.4) 8.3 9.8 13.2<br />
Operating Income 7,145 8,538 10,526 10,617 12,061 13,906<br />
- YoY Growth (%) 22.2 19.5 23.3 0.9 13.6 15.3<br />
Operating Expenses 3,065 3,478 4,419 4,674 5,375 6,181<br />
- YoY Growth (%) 9.8 13.5 27.1 5.8 15.0 15.0<br />
Pre - Provision Profit 4,080 5,061 6,107 5,943 6,686 7,725<br />
- YoY Growth (%) 33.5 24.1 20.7 (2.7) 12.5 15.5<br />
Prov. & Cont. 1,507 1,239 1,081 1,860 1,428 1,647<br />
- YoY Growth (%) 31.1 (17.8) (12.8) 72.1 (23.2) 15.3<br />
Profit Before Tax 2,572 3,821 5,026 4,083 5,258 6,078<br />
- YoY Growth (%) 35.0 48.6 31.5 (18.8) 28.8 15.6<br />
Prov. for Taxation 500 800 1,000 800 1,577 1,972<br />
- as a % of PBT 19.4 20.9 19.9 19.6 30.0 32.4<br />
PAT 2,072 3,021 4,026 3,283 3,680 4,106<br />
- YoY Growth (%) 32.4 45.8 33.2 (18.5) 12.1 11.6<br />
Balance sheet<br />
Y/E March (` cr) FY09 FY10 FY11 FY12 FY13E FY14E<br />
Share Capital 410 410 443 443 443 443<br />
Reserve & Surplus 11,798 14,262 19,597 22,247 25,129 28,334<br />
Deposits 186,893 234,651 293,973 327,054 369,571 436,093<br />
- Growth (%) 21.3 25.6 25.3 11.3 13.0 18.0<br />
Borrowings 7,057 1,041 5,198 5,787 6,540 7,695<br />
Tier 2 Capital 6,944 7,399 9,063 9,738 11,491 13,559<br />
Other Liab. & Prov. 6,498 6,977 7,805 8,891 9,627 11,358<br />
Total Liabilities 219,599 264,741 336,079 374,160 422,801 497,482<br />
Cash Balances 10,037 15,719 22,015 17,795 14,783 17,444<br />
<strong>Bank</strong> Balances 6,623 3,934 8,693 10,384 11,734 13,807<br />
Investments 57,777 69,677 83,700 102,057 109,123 127,535<br />
Advances 138,219 169,335 212,467 232,490 274,338 323,719<br />
- Growth (%) 28.9 22.5 25.5 9.4 18.0 18.0<br />
Fixed Assets 2,929 2,859 2,844 2,858 3,132 3,575<br />
Other Assets 4,014 3,217 6,359 8,576 9,691 11,403<br />
Total Assets 219,599 264,741 336,079 374,160 422,801 497,482<br />
- Growth (%) 21.7 20.6 26.9 11.3 13.0 17.7<br />
May 10, 2012 9
<strong>Canara</strong> <strong>Bank</strong> | 4QFY2012 Result Update<br />
Ratio analysis<br />
Y/E March FY09 FY10 FY11 FY12 FY13E FY14E<br />
Profitability ratios (%)<br />
NIMs 2.4 2.4 2.7 2.2 2.3 2.3<br />
Cost to Income Ratio 42.9 40.7 42.0 44.0 44.6 44.4<br />
RoA 1.0 1.2 1.3 0.9 0.9 0.9<br />
RoE 22.6 26.8 26.4 17.0 16.7 16.4<br />
B/S ratios (%)<br />
CASA Ratio 30.1 29.1 28.3 24.3 24.3 23.7<br />
Credit/Deposit Ratio 74.0 72.2 72.3 71.1 74.2 74.2<br />
CAR 14.1 13.4 15.4 15.6 16.0 15.7<br />
- Tier I 8.0 8.5 10.9 11.2 11.2 10.7<br />
Asset Quality (%)<br />
Gross NPAs 1.6 1.5 1.4 1.7 2.2 2.5<br />
Net NPAs 1.1 1.1 0.8 1.5 1.4 1.4<br />
Slippages 2.2 2.4 2.1 2.1 1.6 1.5<br />
Loan Loss Prov. /Avg. Assets 0.5 0.6 0.3 0.4 0.3 0.3<br />
Provision Coverage 30.5 77.7 73.0 67.6 67.6 68.0<br />
Per Share Data (`)<br />
EPS 50.5 73.7 90.9 74.1 83.1 92.7<br />
ABVPS (75% cover.) 221.3 305.8 401.1 447.3 509.6 580.1<br />
DPS 8.0 10.0 11.0 11.0 15.5 17.5<br />
Valuation Ratios<br />
PER (x) 8.3 5.7 4.6 5.7 5.0 4.5<br />
P/ABVPS (x) 1.9 1.4 1.0 0.9 0.8 0.7<br />
Dividend Yield 1.9 2.4 2.6 2.6 3.7 4.2<br />
DuPont Analysis<br />
NII 2.4 2.3 2.6 2.2 2.2 2.2<br />
(-) Prov. Exp. 0.8 0.5 0.4 0.5 0.4 0.4<br />
Adj. NII 1.6 1.8 2.2 1.6 1.9 1.9<br />
Treasury 0.3 0.4 0.1 0.1 0.1 0.0<br />
Int. Sens. Inc. 1.9 2.2 2.3 1.7 1.9 1.9<br />
Other Inc. 0.9 0.8 0.8 0.7 0.8 0.8<br />
Op. Inc. 2.8 3.0 3.1 2.5 2.7 2.7<br />
Opex 1.5 1.4 1.5 1.3 1.3 1.3<br />
PBT 1.3 1.6 1.7 1.1 1.3 1.3<br />
Taxes 0.3 0.3 0.3 0.2 0.4 0.4<br />
RoA 1.0 1.2 1.3 0.9 0.9 0.9<br />
Leverage 21.8 21.5 19.7 18.4 18.1 18.3<br />
RoE 22.6 26.8 26.4 17.0 16.7 16.4<br />
May 10, 2012 10
<strong>Canara</strong> <strong>Bank</strong> | 4QFY2012 Result Update<br />
Research Team Tel: 022 - 39357800 E-mail: research@angelbroking.com Website: www.angelbroking.com<br />
DISCLAIMER<br />
This document is solely for the personal information of the recipient, and must not be singularly used as the basis of any investment<br />
decision. Nothing in this document should be construed as investment or financial advice. Each recipient of this document should make<br />
such investigations as they deem necessary to arrive at an independent evaluation of an investment in the securities of the companies<br />
referred to in this document (including the merits and risks involved), and should consult their own advisors to determine the merits and<br />
risks of such an investment.<br />
Angel Broking Limited, its affiliates, directors, its proprietary trading and investment businesses may, from time to time, make<br />
investment decisions that are inconsistent with or contradictory to the recommendations expressed herein. <strong>The</strong> views contained in this<br />
document are those of the analyst, and the company may or may not subscribe to all the views expressed within.<br />
Reports based on technical and derivative analysis center on studying charts of a stock's price movement, outstanding positions and<br />
trading volume, as opposed to focusing on a company's fundamentals and, as such, may not match with a report on a company's<br />
fundamentals.<br />
<strong>The</strong> information in this document has been printed on the basis of publicly available information, internal data and other reliable<br />
sources believed to be true, but we do not represent that it is accurate or complete and it should not be relied on as such, as this<br />
document is for general guidance only. Angel Broking Limited or any of its affiliates/ group companies shall not be in any way<br />
responsible for any loss or damage that may arise to any person from any inadvertent error in the information contained in this report.<br />
Angel Broking Limited has not independently verified all the information contained within this document. Accordingly, we cannot testify,<br />
nor make any representation or warranty, express or implied, to the accuracy, contents or data contained within this document. While<br />
Angel Broking Limited endeavours to update on a reasonable basis the information discussed in this material, there may be regulatory,<br />
compliance, or other reasons that prevent us from doing so.<br />
This document is being supplied to you solely for your information, and its contents, information or data may not be reproduced,<br />
redistributed or passed on, directly or indirectly.<br />
Angel Broking Limited and its affiliates may seek to provide or have engaged in providing corporate finance, investment banking or<br />
other advisory services in a merger or specific transaction to the companies referred to in this report, as on the date of this report or in<br />
the past.<br />
Neither Angel Broking Limited, nor its directors, employees or affiliates shall be liable for any loss or damage that may arise from or in<br />
connection with the use of this information.<br />
Note: Please refer to the important `Stock Holding Disclosure' report on the Angel website (Research Section). Also, please refer to the<br />
latest update on respective stocks for the disclosure status in respect of those stocks. Angel Broking Limited and its affiliates may have<br />
investment positions in the stocks recommended in this report.<br />
Disclosure of Interest Statement<br />
<strong>Canara</strong> <strong>Bank</strong><br />
1. Analyst ownership of the stock No<br />
2. Angel and its Group companies ownership of the stock No<br />
3. Angel and its Group companies' Directors ownership of the stock No<br />
4. Broking relationship with company covered No<br />
Note: We have not considered any Exposure below ` 1 lakh for Angel, its Group companies and Directors<br />
Ratings (Returns): Buy (> 15%) Accumulate (5% to 15%) Neutral (-5 to 5%)<br />
Reduce (-5% to 15%) Sell (< -15%)<br />
May 10, 2012 11