Presentation 6 - Jabatan Taman Laut Malaysia
Presentation 6 - Jabatan Taman Laut Malaysia
Presentation 6 - Jabatan Taman Laut Malaysia

You also want an ePaper? Increase the reach of your titles
YUMPU automatically turns print PDFs into web optimized ePapers that Google loves.
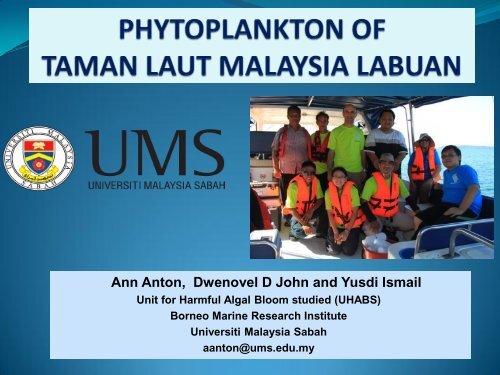
Ann Anton, Dwenovel D John and Yusdi Ismail<br />
Unit for Harmful Algal Bloom studied (UHABS)<br />
Borneo Marine Research Institute<br />
Universiti <strong>Malaysia</strong> Sabah<br />
aanton@ums.edu.my
INTRODUCTION<br />
• Differences in the quality and quantity of<br />
phytoplankton in water bodies have<br />
contributed to their use as indicators of water<br />
quality and trophic status (level of<br />
anthropogenic enrichment)<br />
• For 2 important reasons:<br />
• Autotrophic organisms<br />
• React very quickly to changes in the<br />
environment
Cont……<br />
• Usually done together with hydromorphological,<br />
chemical and physical parameters to support water<br />
quality assessments.<br />
• Resulted in development of indices in water resource<br />
monitoring and management strategies/Initiatives.<br />
Examples:<br />
• European Water Framework Directive (WFD)<br />
• UK Priority Species Indicator Initiative<br />
• DoE <strong>Malaysia</strong> Indicators for River Classification<br />
and Monitoring
INTRODUCTION (Cont…)<br />
• Phytoplankton indicators are reflected as:<br />
• changes in taxonomic composition<br />
(indicator species)<br />
• phytoplankton community structure, eg:<br />
dominance of larger cells in eutrophic<br />
coastal systems (Bosak et al 2012)*<br />
• presence/absence of specific (toxic)<br />
species<br />
*(Bosak, S., T. Silović2, Z. Ljubesić, G. Kuspilić,B. Pestorić, S. Krivokapić<br />
and D.Vilicić. 2012. OCEANOLOGIA, 54 (2):255–286)
Marine Phytoplankton indicators<br />
• Communities affected by toxic<br />
pollutant has a low diversity and low<br />
number of species whereas a<br />
community affected by organic<br />
pollutant has a fairly high number of<br />
species but low diversity (Patrick 1973)<br />
• Oscillatoria chalybea, Oscillatoria<br />
trichodes, Spirulina spp (Nwankwo,<br />
2004) – indicators of high levels of<br />
biodegradable waste pollution<br />
• Beggiatoa alba – indicator of sewage<br />
pollution (APHA 1981)<br />
Oscillatoria trichodes<br />
Beggiatoa alba
OBJECTIVES OF TAMAN LAUT MALAYSIA LABUAN<br />
(TLML) EXPEDITION<br />
• To identify dominant species of phytoplankton.<br />
• To identify the presence of key species (eg.<br />
indicators of eutrophication, harmful algal<br />
species, etc)<br />
• To determine the phytoplankton community<br />
structure abundance and spatial distribution of<br />
dominant phytoplankton species in TLML<br />
• To establish the water quality and productivity of<br />
the marine environment of TLML
SAMPLING SITES<br />
• Sites of interest<br />
‣ Kuraman Island<br />
‣ Rusukan Kecil/Besar Island<br />
• Justification for selection of<br />
sampling stations:<br />
‣ Sites of interest<br />
‣ Sources of<br />
pollution/anthropogenic/industri<br />
al influences<br />
‣ Gradients of physical/chemical<br />
parameters
SAMPLING LOCATIONS<br />
• Total of 12 sampling stations.<br />
• line transects (from Labuan Island to<br />
Kuraman island (stations A,B,C, D, D1)<br />
• Areas surrounding islands ie shallow<br />
waters (stations E, F, G, H, J, K, C)<br />
• Possible sources of pollution - Shipping<br />
lanes (stations B, D, I) - anthropogenic<br />
influence (stations D1, & A)
SAMPLING LOCATIONS<br />
D1<br />
J<br />
C<br />
D<br />
B<br />
A<br />
E<br />
F<br />
K<br />
G<br />
H<br />
I
SAMPLE COLLECTION<br />
• Qualitative data (cell<br />
identification) & Quantitative<br />
data (estimation of<br />
phytoplankton cell<br />
densities).<br />
• Sampling for both analysis<br />
done at each sampling site.<br />
• According to standard<br />
methods(Addison 2006) *Addison, P. 2006. Environment Agency Report.<br />
BS EN 15204.2006. Quality Assurance in Marine<br />
Biological Monitoring 10.2 Phytoplankton.
SAMPLE COLLECTION (Cont…)<br />
Description<br />
Number of Stations<br />
Phytoplankton Group<br />
Total : 12 Stations<br />
Number of Samples taken<br />
38 Samples<br />
• Samples for estimation of<br />
diversity and density of<br />
phytoplankton<br />
• Presence of harmful algae<br />
• Identification of indicator<br />
species for levels of<br />
productivity and pollution<br />
status
RESULTS<br />
52 species of phytoplankton from 28 genera were<br />
identified (16 species of dinoflagelates, 36 species<br />
of diatoms)<br />
Mainly diatoms (Rhizosolenia sp., Bacteriastrum<br />
sp., Chaetoceros sp., Thalssionema sp.)<br />
Harmful algal bloom (HAB) species present<br />
(Cochlodinium polykrikoides) – present in low<br />
numbers ~ 80 cells/L<br />
(Blooms of C.polykrikoides in Sepanggar Bay 9.1 x<br />
10^7 cells/L (Anton et al., 2011)
Diatoms<br />
Rhizosolenia sp.<br />
Thalssionema sp.<br />
Cosinodiscus sp.<br />
Chaetoceros sp.<br />
Bacteriastrum sp.<br />
Bidulphia sp.
Dictyocha fibula<br />
Dinoflagellates<br />
Ceratium tripos Dictyocha fibula Licmophora sp.<br />
Ceratium sp. Peridinium sp. Prorocentrum sp.
HABs<br />
C. polikrikoides
PHYTOPLANKTON DENSITIES<br />
37<br />
27<br />
28<br />
12<br />
9<br />
10<br />
21<br />
21<br />
39<br />
64<br />
25<br />
58<br />
Numbers shown are phytoplankton<br />
densities (cells/L) x 10^2
Species diversity – Shannon-Weiner Diversity Index (H’)(Odum, 1993)<br />
Station<br />
S-W diversity index<br />
A 1.6<br />
B 1.4<br />
C 1.5<br />
D 1.4<br />
D1 1.5<br />
E 1.4<br />
F 1.3<br />
G 1.3<br />
H 1.2<br />
I 1.1<br />
J 1.1<br />
K 1.1<br />
H’ < 1 phytoplankton community is low<br />
1
Phytoplankton Abundance in coastal waters<br />
off Labuan, Kudat and Kota Kinabalu<br />
Labuan Kudat Kota<br />
Kinabalu<br />
Average<br />
cells/L<br />
2903 2730 8440
Correlation Coefficient Values Between<br />
Physico-chemical Parameters and<br />
Phytoplankton Abundance and Diversity<br />
Phytoplankton<br />
Correlation coefficient, r<br />
Salinity pH Temp Turbidity Nitrate Phosphate Oil &<br />
Grease<br />
Chlorophyll<br />
A<br />
Cell Density *0.82 *-0.66 *-0.75 0.19 0.48 0.28 0.51 *0.60<br />
Species<br />
Diversity<br />
*-0.70 *0.62 0.69 0.47 0.50 0.32 0.20 *-0.65<br />
* Significant at p< 0.01
7000<br />
Cell Density vs salinity<br />
6000<br />
5000<br />
y = 3874x - 116543<br />
R² = 0.6665<br />
4000<br />
3000<br />
Cell Density<br />
Linear (Cell Density)<br />
2000<br />
1000<br />
0<br />
30.2 30.4 30.6 30.8 31 31.2 31.4 31.6<br />
Salinity<br />
• Positive correlation
1.8<br />
Species Diversity vs salinity<br />
1.6<br />
1.4<br />
1.2<br />
1<br />
0.8<br />
y = -0.3445x + 11.947<br />
R² = 0.481<br />
Species Diversity<br />
Linear (Species Diversity)<br />
0.6<br />
0.4<br />
0.2<br />
0<br />
30.2 30.4 30.6 30.8 31 31.2 31.4 31.6<br />
Salinity<br />
• Negative correlation
1.8<br />
Species Diversity vs pH<br />
1.6<br />
1.4<br />
y = 1.5291x - 12.002<br />
R² = 0.3756<br />
1.2<br />
1<br />
0.8<br />
Species Diversity<br />
Linear (Species Diversity)<br />
0.6<br />
0.4<br />
0.2<br />
0<br />
8.5 8.55 8.6 8.65 8.7 8.75 8.8<br />
pH<br />
• Positive correlation
7000<br />
Cell Density vs pH<br />
6000<br />
5000<br />
4000<br />
3000<br />
Cell Density<br />
Linear (Cell Density)<br />
2000<br />
y = -16047x + 142758<br />
R² = 0.4533<br />
1000<br />
0<br />
8.5 8.55 8.6 8.65 8.7 8.75 8.8<br />
Negative correlation<br />
pH
7000<br />
Cell Density vs temperature<br />
6000<br />
5000<br />
4000<br />
3000<br />
Cell Density<br />
Linear (Cell Density)<br />
2000<br />
1000<br />
y = -7722.7x + 237353<br />
R² = 0.5565<br />
0<br />
29.9 30 30.1 30.2 30.3 30.4 30.5 30.6 30.7<br />
Negative correlation<br />
temperature
7000<br />
Cell Density vs chlorophyll a<br />
6000<br />
5000<br />
4000<br />
3000<br />
y = 570.22x - 2695.5<br />
R² = 0.3655<br />
Cell Density<br />
Linear (Cell Density)<br />
2000<br />
1000<br />
0<br />
0 2 4 6 8 10 12 14<br />
Positive correlation<br />
Chlorophyll, mg/ml
CONCLUSIONS<br />
• Diatoms were the most dominant phtyoplankton<br />
• Chaetoceros sp., Bacteriastrum hyalinum and<br />
Thalssionema fraunfeldii recorded the highest<br />
densities –common marine phytoplankton<br />
• Presence of harmful algae (Cochlodinium<br />
polikrikoides), but in low numbers, no blooms<br />
detected.<br />
• Absence of specific indicator species
Cont..CONCLUSION<br />
• Interactions with environmental factors:<br />
Cell abundance<br />
positive correlation with salinity and<br />
chlorophyll a<br />
Negative correlation with pH and<br />
temperature<br />
Species diversity:<br />
Positive correlation with pH<br />
Negative correlation with salinity and<br />
chlorophyll a
Cont..CONCLUSION<br />
• High species diversity & relative low densities of<br />
phytoplankton in <strong>Taman</strong> <strong>Laut</strong> <strong>Malaysia</strong> Labuan<br />
suggest pristine water quality, no sign of marine<br />
eutrophication.<br />
• No evidence of severe pollution either from<br />
anthropogenic activities of mainland Labuan,<br />
shipping lanes or refinery.
RECOMMENDATIONS<br />
• Long-term monitoring required for:<br />
• Determination of species indices for the<br />
assessment of eutrophication levels for<br />
mitigation/policy purposes.<br />
• Monitoring and assessment of harmful<br />
algal blooms for protecting human health<br />
and avoiding economic losses.<br />
• To provide baseline information necessary<br />
for developing a monitoring programme for<br />
island parks.
ACKNOWLEDGEMENTS<br />
• JABATAN TAMAN LAUT MALAYSIA<br />
• UNIVERSITI MALAYSIA SABAH<br />
• BORNEO MARINE RESEARCH INSTITUTE<br />
• RESEARCH AND FIELD ASSISTANTS
Thank you for your attention!