Child Equity Atlas - BIDS
Child Equity Atlas - BIDS
Child Equity Atlas - BIDS

Create successful ePaper yourself
Turn your PDF publications into a flip-book with our unique Google optimized e-Paper software.
<strong>Child</strong> <strong>Equity</strong> <strong>Atlas</strong><br />
It is evident from the Maps that areas in the<br />
neighbourhood of Dhaka city, parts of Sylhet<br />
division, and Chittagong Hill Tracts, have higher<br />
concentration of child workers than in other<br />
regions of the country, except for a few other<br />
upazilas (as depicted by dark colours in Map 4.2).<br />
The proportion of real child workers in Dhaka<br />
city, which is significantly higher than the rest<br />
of the country, has been discussed separately in<br />
Chapter six. Among the districts, Dhaka district<br />
has the highest (14.6 per cent) and Jhalokati the<br />
lowest proportion of child workers (2.2 per cent).<br />
Table 4.1: Proportion of real child worker<br />
(10-14 years): Best and worst districts,<br />
Bangladesh 2011<br />
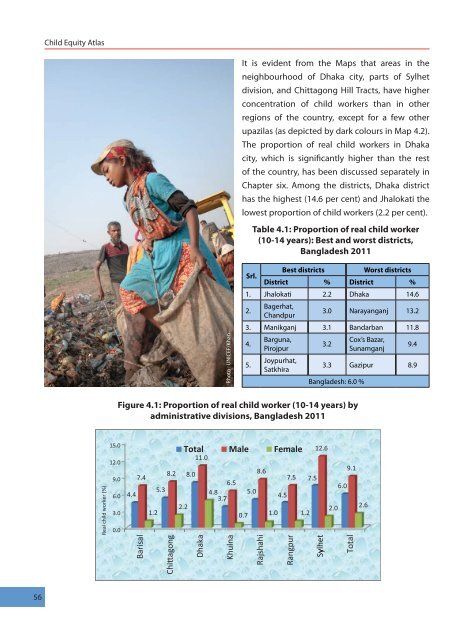
Photo : UNICEF/Khan<br />
Srl.<br />
Best districts<br />
Worst districts<br />
District % District %<br />
1. Jhalokati 2.2 Dhaka 14.6<br />
2.<br />
Bagerhat,<br />
Chandpur<br />
3.0 Narayanganj 13.2<br />
3. Manikganj 3.1 Bandarban 11.8<br />
4.<br />
5.<br />
Barguna,<br />
Pirojpur<br />
Joypurhat,<br />
Satkhira<br />
3.2<br />
Cox’s Bazar,<br />
Sunamganj<br />
9.4<br />
3.3 Gazipur 8.9<br />
Bangladesh: 6.0 %<br />
Figure 4.1: Proportion of real child worker (10-14 years) by<br />
administrative divisions, Bangladesh 2011<br />
Real child worker (%)<br />
15.0<br />
12.0<br />
9.0<br />
6.0<br />
3.0<br />
0.0<br />
Total<br />
8.2<br />
7.4<br />
8.0<br />
5.3<br />
4.4<br />
2.2<br />
1.2<br />
11.0<br />
Male Female<br />
8.6<br />
6.5<br />
7.5<br />
4.8<br />
3.7<br />
5.0<br />
4.5<br />
0.7 1.0<br />
Barisal<br />
Dhaka<br />
Khulna<br />
Rajshahi<br />
Rangpur<br />
12. .6<br />
9.1<br />
7.5<br />
6.0<br />
2.0<br />
2.6<br />
1.2<br />
Sylhet<br />
Total<br />
56