Child Equity Atlas - BIDS
Child Equity Atlas - BIDS Child Equity Atlas - BIDS
Introduction social deprivation and usable for multi-sector social targeting of the most deprived upazilas as it represents the education, housing, child protection and water and sanitation sectors. The index captures social deprivation poverty and the results of the index can easily be used and understood. The higher the CDI number the worse the situation and, therefore, the more efforts to be invested to achieve Millennium Development Goals (MDGs), focusing on the most deprived populations. 1.5.7 The upazila map with its greater geographic resolution, features patterns of performance and glaring “worst performing” areas or disparities, often obscured by national and “district averages”. Thus 90 “high deprivation” upazilas were identified. This combined with the 50 “highest deprivation” upazilas, adds up to 140 upazilas (29 per cent of all upazilas) being recognized as “most deprived” upazilas. 1.5.8 The important thing about the 2011 Census, when analyzed from the children’s socioeconomic rights equity lens, is that it shows Bangladesh is homogeneous but home to more challenging disparities than thought. The robust census data at the upazila and ward level shows the disparities, especially within urban districts or districts with isolated areas. The composite deprivation index helps to focus on the most deprived areas. For instance, the areas with the highest deprivation tend to be both the least and most (urban slums) densely populated areas. Combining the map results and statistical analysis, we can conclude that among the 50 highest deprivation upazilas, only one has an above average progress in literacy reduction and that these have been the low performing areas for a long time (stagnant areas are the hard core), most of them being geographically remote areas, and have lowest population densities. 1.5.9 The analysis reveals that more than good governance, remoteness seems to be the big driver of social stagnation. Thus, efforts to reach and open up these areas should be increased, as stated in the Sixth Five Year Plan 2011-2015. 1.6 Structure of the Report 1.6.1 The report is structured as follows. After the introductory chapter, chapter two discusses the population distribution and demographic situation in the country. Literacy, school attendance and educational attainment are discussed in chapter three. The issues of child worker and spatial distribution are presented in chapter four. Chapter five is on housing, access to sanitary toilet and electricity. The situation in Dhaka City Corporation, also a proxy for urban area, has been presented in chapter six. Chapter seven presents the pockets of social deprivation, and finally the summary and conclusion of the report is presented in chapter eight. Presentation of Data/Findings 1.6.2 As mentioned earlier, the report has used the 2011 census data quite extensively. Results obtained from the analyses are presented in several stages using tables, graphs, and maps by gender, area (rural-urban), division, district, upazila and wards of Dhaka City Corporation. Indicators used in the report along with their definition and computation are given in Annex 1A through 1C respectively. Presentation of results is made as in the follow order: (i) Graphs have been prepared for some of the selected indicators by gender, rural-urban and/or division and presented alongside 7
Child Equity Atlas (ii) text in each of the chapters (referred to as “figure” in the title as well as in the text). Maps have been prepared again for some selected indicators separately by both district and upazila for the entire country, and ward for Dhaka City Corporation and presented in the respective chapters. Range of values of the respective indicators used for preparing the maps is presented in Annex-2. The legends used in the maps portray “dark” colours in most cases to represent the worst scenario and vice-versa for each of the indicators taken into consideration. (iv) City Corporation. These set of tables is presented towards the end of the report in Annex-3A and numbered according to the chapters they belong to (e.g., Annex Table 2.1, etc.). The snap shots on each of the tables mentioned above were presented in each chapter alongside text. A second set of tables have also been prepared using all the indicators and presented by upazila. These tables are not presented in the report, but available electronically (in CD) in Annex-3B and numbered according to the chapters they refer to (e.g., Annex Table 2.1, etc.). (iii) First set of tables have been prepared using all the indicators taken into consideration and the presentation of results has been made by districts for the entire country and wards for Dhaka 1.6.3 A brief discussion of main findings is presented in the chapters. Detailed information by district, upazila or ward (in Dhaka City Corporation) for the indicators of interest can be seen from the maps, tables or annexes. Photo : Md. G M Rajib 8
- Page 1 and 2: Child Equity Atlas: Pockets of Soci
- Page 3 and 4: © Bangladesh Institute of Developm
- Page 5 and 6: We are pleased to present to the pu
- Page 7 and 8: List of Abbreviations BBS BDHS BIDS
- Page 9 and 10: Chapter Five: Housing, Access to Sa
- Page 11 and 12: Figure 6.1: Educational attainment
- Page 14 and 15: Introduction Chapter One Introducti
- Page 16 and 17: Introduction Introduction 1.0 Backg
- Page 18 and 19: Introduction 3. Present geographica
- Page 22 and 23: Introduction Table 1.1: Comparison
- Page 24 and 25: Population Distribution and Demogra
- Page 26 and 27: Population Distribution and Demogra
- Page 28 and 29: Jamuna River Padma Population Distr
- Page 30 and 31: Population Distribution and Demogra
- Page 32 and 33: Population Distribution and Demogra
- Page 34 and 35: Population Distribution and Demogra
- Page 36 and 37: Population Distribution and Demogra
- Page 38 and 39: Population Distribution and Demogra
- Page 40 and 41: Literacy, School Attendance and Edu
- Page 42 and 43: Literacy, School Attendance and Edu
- Page 44 and 45: Literacy, School Attendance and Edu
- Page 46 and 47: Literacy, School Attendance and Edu
- Page 48 and 49: Literacy, School Attendance and Edu
- Page 50 and 51: Literacy, School Attendance and Edu
- Page 52 and 53: Literacy, School Attendance and Edu
- Page 54 and 55: Literacy, School Attendance and Edu
- Page 56 and 57: Literacy, School Attendance and Edu
- Page 58 and 59: Literacy, School Attendance and Edu
- Page 60 and 61: Literacy, School Attendance and Edu
- Page 62 and 63: Literacy, School Attendance and Edu
- Page 64 and 65: Literacy, School Attendance and Edu
- Page 66 and 67: Child Worker and the Sectors of Emp
- Page 68 and 69: Child Worker and the Sectors of Emp
<strong>Child</strong> <strong>Equity</strong> <strong>Atlas</strong><br />
(ii)<br />
text in each of the chapters (referred to as<br />
“figure” in the title as well as in the text).<br />
Maps have been prepared again for some<br />
selected indicators separately by both<br />
district and upazila for the entire country,<br />
and ward for Dhaka City Corporation and<br />
presented in the respective chapters.<br />
Range of values of the respective<br />
indicators used for preparing the maps is<br />
presented in Annex-2. The legends used<br />
in the maps portray “dark” colours in most<br />
cases to represent the worst scenario and<br />
vice-versa for each of the indicators taken<br />
into consideration.<br />
(iv)<br />
City Corporation. These set of tables is<br />
presented towards the end of the report in<br />
Annex-3A and numbered according to the<br />
chapters they belong to (e.g., Annex Table<br />
2.1, etc.). The snap shots on each of the<br />
tables mentioned above were presented<br />
in each chapter alongside text.<br />
A second set of tables have also been<br />
prepared using all the indicators and<br />
presented by upazila. These tables are<br />
not presented in the report, but available<br />
electronically (in CD) in Annex-3B and<br />
numbered according to the chapters they<br />
refer to (e.g., Annex Table 2.1, etc.).<br />
(iii)<br />
First set of tables have been prepared<br />
using all the indicators taken into<br />
consideration and the presentation of<br />
results has been made by districts for<br />
the entire country and wards for Dhaka<br />
1.6.3 A brief discussion of main findings is<br />
presented in the chapters. Detailed information by<br />
district, upazila or ward (in Dhaka City Corporation)<br />
for the indicators of interest can be seen from the<br />
maps, tables or annexes.<br />
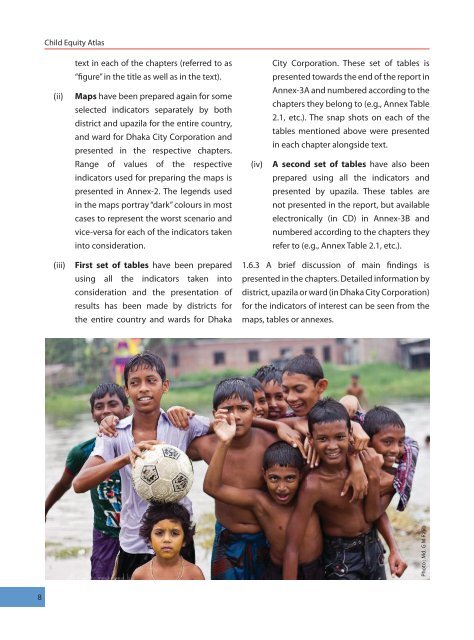
Photo : Md. G M Rajib<br />
8


