Child Equity Atlas - BIDS
Child Equity Atlas - BIDS Child Equity Atlas - BIDS
ANNEX-3A District Number of population Urban population (%) Population density (population/ per sq km) Proportion below 18 years (%) Proportion below 5 years (%) Total Male Female Total Male Female Total Boys Girls Sex ratio under five Proportion women in childbearing age (15-49 years) (%) Female teenage married (15-19 years) (%) Rural Total Urban Proportion of female headed households (%) Total Rural Urban Narayanganj 2948217 1521438 1426779 33.5 4308 37.2 37.0 37.4 9.8 9.7 9.9 104 58.1 32.8 34.0 30.4 13.2 13.6 12.6 Narsingdi 2224944 1102943 1122001 20.1 1934 42.8 44.7 40.8 11.3 11.5 11.0 103 51.2 33.4 33.8 32.2 17.9 18.4 15.6 Natore 1706673 854183 852490 13.4 898 35.0 36.8 33.2 9.1 9.3 9.0 103 56.5 42.7 43.5 38.4 11.1 10.9 12.1 Chapai Nawabganj 1647521 810218 837303 19.4 968 40.3 42.4 38.3 10.5 10.8 10.3 101 54.0 48.0 49.0 44.3 15.3 13.9 21.1 Netrakona 2229642 1111306 1118336 11.1 798 44.6 46.5 42.7 12.7 12.9 12.5 102 46.9 28.1 28.8 23.8 16.8 17.0 15.0 Nilphamari 1834231 922964 911267 15.8 1186 41.7 43.4 39.9 11.3 11.4 11.2 104 52.1 36.3 39.1 25.5 11.1 11.1 11.0 Noakhali 3108083 1485169 1622914 16.0 843 46.7 49.7 43.9 12.3 13.0 11.6 103 49.7 26.7 27.0 24.9 27.5 28.3 23.1 Pabna 2523179 1262934 1260245 15.4 1062 38.3 40.0 36.6 10.4 10.5 10.3 102 53.9 39.6 40.8 34.3 11.2 11.1 11.9 Panchagarh 987644 496725 490919 9.6 703 40.6 41.9 39.3 11.0 11.1 10.9 104 53.3 31.0 31.6 26.4 10.0 9.9 10.9 Patuakhali 1535854 753441 782413 13.1 477 40.6 43.0 38.3 10.4 10.7 10.2 102 50.7 37.9 38.8 32.8 15.6 16.0 12.8 Pirojpur 1113257 548228 565029 16.4 871 38.9 40.7 37.2 9.6 9.8 9.4 101 51.6 35.7 35.8 35.2 15.3 15.2 15.5 Rajshahi 2595197 1309890 1285307 32.9 1070 34.5 36.1 32.9 8.4 8.4 8.3 103 57.9 37.6 41.2 32.1 11.5 10.8 13.1 Rajbari 1049778 519999 529779 13.0 961 38.6 40.4 36.9 10.0 10.3 9.8 103 52.8 34.9 35.8 29.7 11.6 11.3 13.6 Rangamati 595979 313076 282903 26.8 97 40.6 40.5 40.8 10.5 10.2 10.8 104 52.6 22.3 23.3 20.1 9.8 8.6 13.0 Rangpur 2881086 1443816 1437270 15.4 1200 38.0 39.6 36.3 10.0 10.1 9.8 104 53.8 36.4 39.5 24.4 13.2 13.0 14.2 Shariatpur 1155824 559075 596749 11.3 984 44.3 46.2 42.4 11.3 11.8 10.8 102 48.5 24.8 24.6 26.3 19.4 19.4 19.2 Satkhira 1985959 982777 1003182 10.0 520 35.5 37.3 33.7 8.6 8.8 8.4 103 56.2 40.9 41.4 37.0 12.6 12.7 12.0 Sirajganj 3097489 1551368 1546121 14.1 1290 40.3 42.2 38.4 11.0 11.2 10.9 103 52.3 40.6 41.6 35.7 12.2 12.2 12.5 Sherpur 1358325 676388 681937 13.8 995 41.4 43.7 39.2 11.4 11.6 11.2 102 50.1 39.7 40.6 35.5 13.4 13.6 12.5 Sunamganj 2467968 1236106 1231862 10.4 659 47.6 48.8 46.3 14.4 14.5 14.3 102 46.1 16.4 16.6 14.8 14.9 15.0 13.8 Sylhet 3434188 1726965 1707223 21.9 995 45.3 46.0 44.6 12.2 12.3 12.1 103 50.4 13.5 13.0 15.6 19.3 20.5 15.5 133
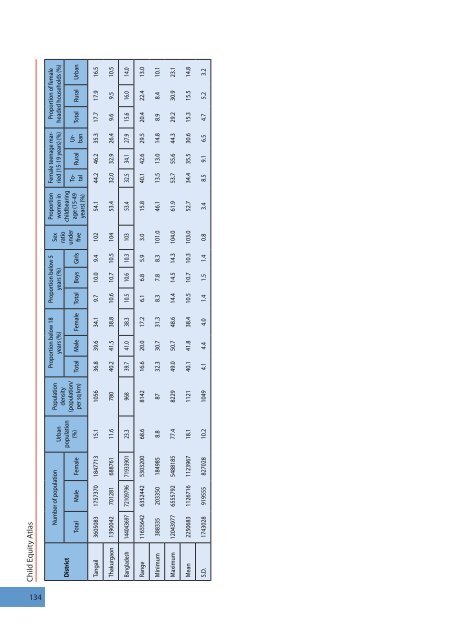
Child Equity Atlas District Number of population Urban population (%) Population density (population/ per sq km) Proportion below 18 years (%) Proportion below 5 years (%) Total Male Female Total Male Female Total Boys Girls Sex ratio under five Proportion women in childbearing age (15-49 years) (%) Female teenage married (15-19 years) (%) Rural Total Urban Proportion of female headed households (%) Total Rural Urban Tangail 3605083 1757370 1847713 15.1 1056 36.8 39.6 34.1 9.7 10.0 9.4 102 54.1 44.2 46.2 35.3 17.7 17.9 16.5 Thakurgaon 1390042 701281 688761 11.6 780 40.2 41.5 38.8 10.6 10.7 10.5 104 53.4 32.0 32.9 26.4 9.6 9.5 10.5 Bangladesh 144043697 72109796 71933901 23.3 968 39.7 41.0 38.3 10.5 10.6 10.3 103 53.4 32.5 34.1 27.9 15.6 16.0 14.0 Range 11655642 6352442 5303200 68.6 8142 16.6 20.0 17.2 6.1 6.8 5.9 3.0 15.8 40.1 42.6 29.5 20.4 22.4 13.0 Minimum 388335 203350 184985 8.8 87 32.3 30.7 31.3 8.3 7.8 8.3 101.0 46.1 13.5 13.0 14.8 8.9 8.4 10.1 Maximum 12043977 6555792 5488185 77.4 8229 49.0 50.7 48.6 14.4 14.5 14.3 104.0 61.9 53.7 55.6 44.3 29.2 30.9 23.1 Mean 2250683 1126716 1123967 18.1 1121 40.1 41.8 38.4 10.5 10.7 10.3 103.0 52.7 34.4 35.5 30.6 15.3 15.5 14.8 S.D. 1743028 919555 827028 10.2 1049 4.1 4.4 4.0 1.4 1.5 1.4 0.8 3.4 8.5 9.1 6.5 4.7 5.2 3.2 134
- Page 96 and 97: Situation in Urban Areas: The Case
- Page 98 and 99: Situation in Urban Areas: The Case
- Page 100 and 101: Situation in Urban Areas: The Case
- Page 102 and 103: Situation in Urban Areas: The Case
- Page 104 and 105: Situation in Urban Areas: The Case
- Page 106 and 107: Situation in Urban Areas: The Case
- Page 108 and 109: Situation in Urban Areas: The Case
- Page 110 and 111: Pockets of Social Deprivation Chapt
- Page 112 and 113: Pockets of Social Deprivation Pocke
- Page 114 and 115: Pockets of Social Deprivation Map 7
- Page 116 and 117: Pockets of Social Deprivation Map 7
- Page 118 and 119: Pockets of Social Deprivation Map 7
- Page 120 and 121: Pockets of Social Deprivation Table
- Page 122 and 123: Pockets of Social Deprivation 7.1.4
- Page 124 and 125: Pockets of Social Deprivation highe
- Page 126 and 127: Pockets of Social Deprivation Map 7
- Page 128 and 129: Chapter Eight Summary and Conclusio
- Page 130 and 131: Summary and Conclusion Summary and
- Page 132 and 133: Summary and Conclusion gap. Dispari
- Page 134 and 135: Summary and Conclusion these areas
- Page 136 and 137: Annexure Photo : Ibrahim Khan Moni
- Page 138 and 139: Annexure ANNEX-1A: List of Indicato
- Page 140 and 141: ANNEX-1C ANNEX-1C: Computing the In
- Page 142 and 143: ANNEX-2: Ranges of Values Used for
- Page 144 and 145: ANNEX-3A ANNEX-3A: Data Tables: Dis
- Page 148 and 149: ANNEX-3A Annex Table 3.1: Literacy
- Page 150 and 151: ANNEX-3A District Youth literacy ra
- Page 152 and 153: ANNEX-3A Annex Table 3.1 (continued
- Page 154 and 155: ANNEX-3A District Proportion out of
- Page 156 and 157: ANNEX-3A District % of real child w
- Page 158 and 159: ANNEX-3A Annex Table 5.1: Types of
- Page 160 and 161: ANNEX-3A District % of households l
- Page 162 and 163: ANNEX-3A Annex Table 6.1: Populatio
- Page 164 and 165: ANNEX-3A DCC Thana Ward Number of p
- Page 166 and 167: ANNEX-3A DCC Thana Ward Number of p
- Page 168 and 169: ANNEX-3A DCC Thana Ward Youth liter
- Page 170 and 171: ANNEX-3A DCC Thana Ward Bangshal, C
- Page 172 and 173: ANNEX-3A Anneax Table 6.2 (continue
- Page 174 and 175: ANNEX-3A DCC Thana Ward Mohammadpur
- Page 176 and 177: ANNEX-3A DCC Thana Ward Proportion
- Page 178 and 179: ANNEX-3A DCC Thana Ward % of real C
- Page 180 and 181: ANNEX-3A DCC Thana Ward % of real C
- Page 182 and 183: ANNEX-3A Annex Table 6.4: Types of
- Page 184 and 185: ANNEX-3A DCC Thana Ward Dhanmondi,
- Page 186 and 187: ANNEX-3A DCC Thana Ward % of househ
- Page 188 and 189: ANNEX-5A: Pockets of Social Depriva
- Page 190 and 191: ANNEX-5B ANNEX-5B: Pockets of Socia
- Page 192 and 193: ANNEX-5B Division District Upazila
- Page 194 and 195: ANNEX-5B Division District Upazila
<strong>Child</strong> <strong>Equity</strong> <strong>Atlas</strong><br />
District<br />
Number of population<br />
Urban<br />
population<br />
(%)<br />
Population<br />
density<br />
(population/<br />
per sq km)<br />
Proportion below 18<br />
years (%)<br />
Proportion below 5<br />
years (%)<br />
Total Male Female Total Male Female Total Boys Girls<br />
Sex<br />
ratio<br />
under<br />
five<br />
Proportion<br />
women in<br />
childbearing<br />
age (15-49<br />
years) (%)<br />
Female teenage married<br />
(15-19 years) (%)<br />
Rural<br />
Total<br />
Urban<br />
Proportion of female<br />
headed households (%)<br />
Total Rural Urban<br />
Tangail 3605083 1757370 1847713 15.1 1056 36.8 39.6 34.1 9.7 10.0 9.4 102 54.1 44.2 46.2 35.3 17.7 17.9 16.5<br />
Thakurgaon 1390042 701281 688761 11.6 780 40.2 41.5 38.8 10.6 10.7 10.5 104 53.4 32.0 32.9 26.4 9.6 9.5 10.5<br />
Bangladesh 144043697 72109796 71933901 23.3 968 39.7 41.0 38.3 10.5 10.6 10.3 103 53.4 32.5 34.1 27.9 15.6 16.0 14.0<br />
Range 11655642 6352442 5303200 68.6 8142 16.6 20.0 17.2 6.1 6.8 5.9 3.0 15.8 40.1 42.6 29.5 20.4 22.4 13.0<br />
Minimum 388335 203350 184985 8.8 87 32.3 30.7 31.3 8.3 7.8 8.3 101.0 46.1 13.5 13.0 14.8 8.9 8.4 10.1<br />
Maximum 12043977 6555792 5488185 77.4 8229 49.0 50.7 48.6 14.4 14.5 14.3 104.0 61.9 53.7 55.6 44.3 29.2 30.9 23.1<br />
Mean 2250683 1126716 1123967 18.1 1121 40.1 41.8 38.4 10.5 10.7 10.3 103.0 52.7 34.4 35.5 30.6 15.3 15.5 14.8<br />
S.D. 1743028 919555 827028 10.2 1049 4.1 4.4 4.0 1.4 1.5 1.4 0.8 3.4 8.5 9.1 6.5 4.7 5.2 3.2<br />
134


