Child Equity Atlas - BIDS
Child Equity Atlas - BIDS
Child Equity Atlas - BIDS

You also want an ePaper? Increase the reach of your titles
YUMPU automatically turns print PDFs into web optimized ePapers that Google loves.
<strong>Child</strong> <strong>Equity</strong> <strong>Atlas</strong><br />
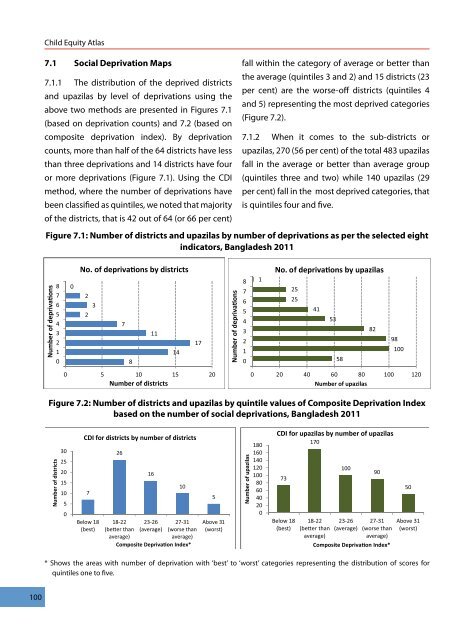
7.1 Social Deprivation Maps<br />
7.1.1 The distribution of the deprived districts<br />
and upazilas by level of deprivations using the<br />
above two methods are presented in Figures 7.1<br />
(based on deprivation counts) and 7.2 (based on<br />
composite deprivation index). By deprivation<br />
counts, more than half of the 64 districts have less<br />
than three deprivations and 14 districts have four<br />
or more deprivations (Figure 7.1). Using the CDI<br />
method, where the number of deprivations have<br />
been classified as quintiles, we noted that majority<br />
of the districts, that is 42 out of 64 (or 66 per cent)<br />
fall within the category of average or better than<br />
the average (quintiles 3 and 2) and 15 districts (23<br />
per cent) are the worse-off districts (quintiles 4<br />
and 5) representing the most deprived categories<br />
(Figure 7.2).<br />
7.1.2 When it comes to the sub-districts or<br />
upazilas, 270 (56 per cent) of the total 483 upazilas<br />
fall in the average or better than average group<br />
(quintiles three and two) while 140 upazilas (29<br />
per cent) fall in the most deprived categories, that<br />
is quintiles four and five.<br />
Figure 7.1: Number of districts and upazilas by number of deprivations as per the selected eight<br />
indicators, Bangladesh 2011<br />
Figure 7.2: Number of districts and upazilas by quintile values of Composite Deprivation Index<br />
based on the number of social deprivations, Bangladesh 2011<br />
* Shows the areas with number of deprivation with ‘best’ to ‘worst’ categories representing the distribution of scores for<br />
quintiles one to five.<br />
100