Child Equity Atlas - BIDS
Child Equity Atlas - BIDS
Child Equity Atlas - BIDS
Create successful ePaper yourself
Turn your PDF publications into a flip-book with our unique Google optimized e-Paper software.
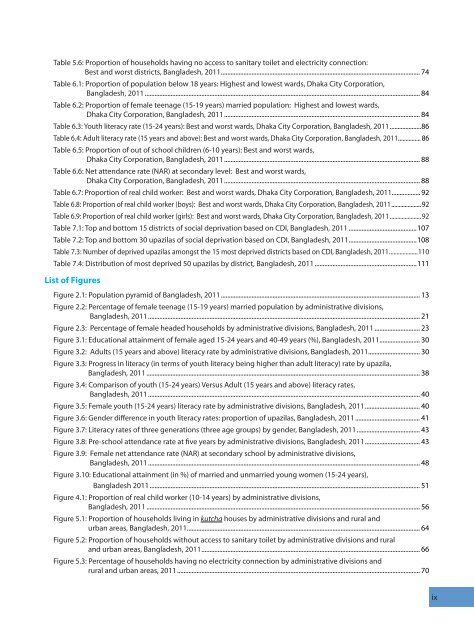
Table 5.6: Proportion of households having no access to sanitary toilet and electricity connection:<br />
Best and worst districts, Bangladesh, 2011............................................................................................................................ 74<br />
Table 6.1: Proportion of population below 18 years: Highest and lowest wards, Dhaka City Corporation,<br />
Bangladesh, 2011........................................................................................................................................................................... 84<br />
Table 6.2: Proportion of female teenage (15-19 years) married population: Highest and lowest wards,<br />
Dhaka City Corporation, Bangladesh, 2011.......................................................................................................................... 84<br />
Table 6.3: Youth literacy rate (15-24 years): Best and worst wards, Dhaka City Corporation, Bangladesh, 2011.....................86<br />
Table 6.4: Adult literacy rate (15 years and above): Best and worst wards, Dhaka City Corporation, Bangladesh, 2011................ 86<br />
Table 6.5: Proportion of out of school children (6-10 years): Best and worst wards,<br />
Dhaka City Corporation, Bangladesh, 2011.......................................................................................................................... 88<br />
Table 6.6: Net attendance rate (NAR) at secondary level: Best and worst wards,<br />
Dhaka City Corporation, Bangladesh, 2011.......................................................................................................................... 88<br />
Table 6.7: Proportion of real child worker: Best and worst wards, Dhaka City Corporation, Bangladesh, 2011................... 92<br />
Table 6.8: Proportion of real child worker (boys): Best and worst wards, Dhaka City Corporation, Bangladesh, 2011.....................92<br />
Table 6.9: Proportion of real child worker (girls): Best and worst wards, Dhaka City Corporation, Bangladesh, 2011......................92<br />
Table 7.1: Top and bottom 15 districts of social deprivation based on CDI, Bangladesh, 2011...........................................107<br />
Table 7.2: Top and bottom 30 upazilas of social deprivation based on CDI, Bangladesh, 2011...........................................108<br />
Table 7.3: Number of deprived upazilas amongst the 15 most deprived districts based on CDI, Bangladesh, 2011....................110<br />
Table 7.4: Distribution of most deprived 50 upazilas by district, Bangladesh, 2011................................................................111<br />
List of Figures<br />
Figure 2.1: Population pyramid of Bangladesh, 2011............................................................................................................................ 13<br />
Figure 2.2: Percentage of female teenage (15-19 years) married population by administrative divisions,<br />
Bangladesh, 2011......................................................................................................................................................................... 21<br />
Figure 2.3: Percentage of female headed households by administrative divisions, Bangladesh, 2011............................. 23<br />
Figure 3.1: Educational attainment of female aged 15-24 years and 40-49 years (%), Bangladesh, 2011.......................... 30<br />
Figure 3.2: Adults (15 years and above) literacy rate by administrative divisions, Bangladesh, 2011................................ 30<br />
Figure 3.3: Progress in literacy (in terms of youth literacy being higher than adult literacy) rate by upazila,<br />
Bangladesh, 2011.......................................................................................................................................................................... 38<br />
Figure 3.4: Comparison of youth (15-24 years) Versus Adult (15 years and above) literacy rates,<br />
Bangladesh, 2011......................................................................................................................................................................... 40<br />
Figure 3.5: Female youth (15-24 years) literacy rate by administrative divisions, Bangladesh, 2011................................... 40<br />
Figure 3.6: Gender difference in youth literacy rates: proportion of upazilas, Bangladesh, 2011......................................... 41<br />
Figure 3.7: Literacy rates of three generations (three age groups) by gender, Bangladesh, 2011........................................ 43<br />
Figure 3.8: Pre-school attendance rate at five years by administrative divisions, Bangladesh, 2011................................... 43<br />
Figure 3.9: Female net attendance rate (NAR) at secondary school by administrative divisions,<br />
Bangladesh, 2011......................................................................................................................................................................... 48<br />
Figure 3.10: Educational attainment (in %) of married and unmarried young women (15-24 years),<br />
Bangladesh 2011........................................................................................................................................................................ 51<br />
Figure 4.1: Proportion of real child worker (10-14 years) by administrative divisions,<br />
Bangladesh, 2011.......................................................................................................................................................................... 56<br />
Figure 5.1: Proportion of households living in kutcha houses by administrative divisions and rural and<br />
urban areas, Bangladesh, 2011................................................................................................................................................ 64<br />
Figure 5.2: Proportion of households without access to sanitary toilet by administrative divisions and rural<br />
and urban areas, Bangladesh, 2011........................................................................................................................................ 66<br />
Figure 5.3: Percentage of households having no electricity connection by administrative divisions and<br />
rural and urban areas, 2011....................................................................................................................................................... 70<br />
ix


