5. RGB conversion (ECI-RGB v1.0) - Impressed
5. RGB conversion (ECI-RGB v1.0) - Impressed
5. RGB conversion (ECI-RGB v1.0) - Impressed

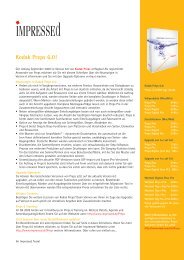
You also want an ePaper? Increase the reach of your titles
YUMPU automatically turns print PDFs into web optimized ePapers that Google loves.
Profile Information<br />
Profile-Test<br />
2012-1-30<br />
Name EP78_PWM_MM_lwc90_0807_310<br />
Path /Library/Application Support/Adobe/.../EP78_PWM_MM_lwc90_0807_310.icc<br />
Size 1062672<br />
Version 2.4<br />
Class prtr<br />
ColorSpace CMYK<br />
PCS Lab<br />
Date 2007-08-23 18:48:47<br />
Rendering 0<br />
Creator LOGO<br />
1. Profile Statistic<br />
The statistic tests the profile integrity and some profile properties.<br />
The profile integrity indicates how precise a profile converts between the color spaces. The integrity values show as<br />
average and maximum deviations.<br />
The DCS to PCS statistic shows how precise the profile matches the measurement data and should be very low.<br />
The black point DCS for <strong>RGB</strong> profiles should be low or 0/0/0<br />
The black point DCS for CMYK+ profiles should match the allowed total amount of ink.<br />
The black point PCS should be dark and approximately neutral.<br />
The white point DCS should match the device white point.<br />
The white point PCS should match Lab-White.<br />
Integrity (DCS) perceptual 1.3/8.8 (CMYK)<br />
Integrity (DCS) relative colorimetric 1.4/7.4 (CMYK)<br />
Integrity (DCS) saturation 1.3/8.8 (CMYK)<br />
Integrity (PCS) perceptual 1.3/8.4 (Lab)<br />
Integrity (PCS) relative colorimetric 1.2/12.7 (Lab)<br />
Integrity (PCS) saturation 1.3/8.4 (Lab)<br />
Precision (DCS-to-PCS) absolute colorimetric 0.4/2.0 (Lab)<br />
BlackPoint (PCS-to-DCS) perceptual 81.28 69.82 63.72 94.79 (CMYK) sum=309.6<br />
BlackPoint (PCS-to-DCS) relative colorimetric 83.64 69.95 56.96 90.85 (CMYK) sum=301.4<br />
BlackPoint (PCS-to-PCS) perceptual 17.55 0.10 0.87 (Lab)<br />
BlackPoint (PCS-to-PCS) relative colorimetric 17.90 0.32 -0.42 (Lab)<br />
WhitePoint (PCS-to-DCS) perceptual 0.25 0.03 0.08 0.00 (CMYK) (Failed)<br />
WhitePoint (PCS-to-DCS) relative colorimetric 0.32 0.06 0.10 0.00 (CMYK) (Failed)<br />
WhitePoint (DCS-to-PCS) perceptual 100.00 0.00 0.00 (Lab)<br />
WhitePoint (DCS-to-PCS) relative colorimetric 100.00 0.00 0.00 (Lab)<br />
WhitePoint (DCS-to-PCS) absolute colorimetric 92.40 -0.32 -2.58 (Lab)
ColorLogic Profile Report 2012-1-30 EP78_PWM_MM_lwc90_0807_310.icc Page 2<br />
2. Gamut<br />
The gamut plot illustrate the maximum gamuts in the a/b-diagram when converting from device color space to Lab.<br />
These plots show the gamut for the different rendering intents.<br />
Typically the perceptual gamut is the largest one and the absolute colorimetric gamut is the smallest.<br />
-100<br />
RelativeColorimetric<br />
b<br />
100<br />
-100<br />
-100<br />
Perceptual<br />
RelativeColorimetric<br />
AbsoluteColorimetric<br />
100<br />
a<br />
b<br />
100<br />
-100<br />
-100<br />
Perceptual<br />
100<br />
a<br />
b<br />
100<br />
-100<br />
100<br />
a
ColorLogic Profile Report 2012-1-30 EP78_PWM_MM_lwc90_0807_310.icc Page 3<br />
3. Gray Balance<br />
The diagram show the curves for the primaries for a neutral Lab-ramp. The curves should be smooth<br />
CMYK<br />
CMYK<br />
CMYK<br />
Perceptual L<br />
Relative+BPC<br />
L<br />
CMYK<br />
RelativeColorimetric L<br />
AbsoluteColorimetric<br />
L
ColorLogic Profile Report 2012-1-30 EP78_PWM_MM_lwc90_0807_310.icc Page 4<br />
4. Separations<br />
Smooth<strong>RGB</strong>.tif<br />
Source profile: Adobe <strong>RGB</strong> (1998)<br />
Original (<strong>RGB</strong>)<br />
Converted (CMYK)
ColorLogic Profile Report 2012-1-30 EP78_PWM_MM_lwc90_0807_310.icc Page 5<br />
CMY<br />
CMYK_K
ColorLogic Profile Report 2012-1-30 EP78_PWM_MM_lwc90_0807_310.icc Page 6<br />
CMYK_C<br />
CMYK_M
ColorLogic Profile Report 2012-1-30 EP78_PWM_MM_lwc90_0807_310.icc Page 7<br />
CMYK_Y
ColorLogic Profile Report 2012-1-30 EP78_PWM_MM_lwc90_0807_310.icc Page 8<br />
CLEdit<strong>RGB</strong>.tif<br />
Source profile: Adobe <strong>RGB</strong> (1998)<br />
Original (<strong>RGB</strong>)
ColorLogic Profile Report 2012-1-30 EP78_PWM_MM_lwc90_0807_310.icc Page 9<br />
Converted (CMYK)
ColorLogic Profile Report 2012-1-30 EP78_PWM_MM_lwc90_0807_310.icc Page 10<br />
<strong>5.</strong> <strong>RGB</strong> <strong>conversion</strong> (<strong>ECI</strong>-<strong>RGB</strong> <strong>v1.0</strong>)<br />
This test converts <strong>RGB</strong> samples with the test profile. For CMYK+ color spaces the K-channel will be shown, too.The<br />
display of the converted data is relative colorimetric to <strong>RGB</strong>.The result should be smooth and color consistent.<br />
Original <strong>RGB</strong>-Test-Patches
ColorLogic Profile Report 2012-1-30 EP78_PWM_MM_lwc90_0807_310.icc Page 11<br />
Perceptual (<strong>RGB</strong>->perceptual->TestProfile->colorimetric-><strong>RGB</strong>)<br />
Black Channel (<strong>RGB</strong>->perceptual->TestProfile)<br />
Samples (Perceptual)<br />
Black 81.3 69.8 63.7 94.8<br />
White 0.2 0.0 0.1 0.0<br />
Red 0.0 6<strong>5.</strong>7 82.0 0.0<br />
Green 67.7 0.0 64.8 0.0<br />
Blue 88.2 54.5 0.0 0.0<br />
Cyan 6<strong>5.</strong>4 0.0 29.1 0.0<br />
Magenta 21.6 56.8 0.1 0.7<br />
Yellow 9.2 0.2 81.4 0.0<br />
Cyan Light 51.7 0.0 22.3 0.0<br />
Magenta Light 14.9 4<strong>5.</strong>5 0.2 0.3<br />
Yellow Light 7.2 0.3 50.9 0.0
ColorLogic Profile Report 2012-1-30 EP78_PWM_MM_lwc90_0807_310.icc Page 12<br />
Colorimetric (<strong>RGB</strong>->colorimetric->TestProfile->colorimetric-><strong>RGB</strong>)<br />
Black Channel (<strong>RGB</strong>->colorimetric->TestProfile)<br />
Samples (Colorimetric)<br />
Black 83.6 69.9 57.0 90.9<br />
White 0.3 0.1 0.1 0.0<br />
Red 0.0 71.9 94.0 0.0<br />
Green 73.9 0.0 68.1 0.0<br />
Blue 81.4 49.4 0.0 0.0<br />
Cyan 74.4 0.0 29.6 0.0<br />
Magenta 26.0 58.0 0.0 0.3<br />
Yellow 14.6 0.0 93.9 0.0<br />
Cyan Light 59.5 0.0 23.2 0.0<br />
Magenta Light 21.3 49.4 0.0 0.1<br />
Yellow Light 9.2 0.1 5<strong>5.</strong>3 0.0
ColorLogic Profile Report 2012-1-30 EP78_PWM_MM_lwc90_0807_310.icc Page 13<br />
Colorimetric (<strong>RGB</strong>->saturation->TestProfile->colorimetric-><strong>RGB</strong>)<br />
Black Channel (<strong>RGB</strong>->saturation->TestProfile)<br />
Samples (saturation)<br />
Black 81.3 69.8 63.7 94.8<br />
White 0.2 0.0 0.1 0.0<br />
Red 0.0 6<strong>5.</strong>7 82.0 0.0<br />
Green 67.7 0.0 64.8 0.0<br />
Blue 88.2 54.5 0.0 0.0<br />
Cyan 6<strong>5.</strong>4 0.0 29.1 0.0<br />
Magenta 21.6 56.8 0.1 0.7<br />
Yellow 9.2 0.2 81.4 0.0<br />
Cyan Light 51.7 0.0 22.3 0.0<br />
Magenta Light 14.9 4<strong>5.</strong>5 0.2 0.3<br />
Yellow Light 7.2 0.3 50.9 0.0
ColorLogic Profile Report 2012-1-30 EP78_PWM_MM_lwc90_0807_310.icc Page 14<br />
6. Hue Samples<br />
On the left side you see the original colors, on the right side the (perceptual) converted colors.
ColorLogic Profile Report 2012-1-30 EP78_PWM_MM_lwc90_0807_310.icc Page 15
ColorLogic Profile Report 2012-1-30 EP78_PWM_MM_lwc90_0807_310.icc Page 16
ColorLogic Profile Report 2012-1-30 EP78_PWM_MM_lwc90_0807_310.icc Page 17
ColorLogic Profile Report 2012-1-30 EP78_PWM_MM_lwc90_0807_310.icc Page 18
ColorLogic Profile Report 2012-1-30 EP78_PWM_MM_lwc90_0807_310.icc Page 19
ColorLogic Profile Report 2012-1-30 EP78_PWM_MM_lwc90_0807_310.icc Page 20<br />
7. Linearity<br />
Note: The dot gain cannot be estimated seriously from colorimetric data, therefore we display the deltaE-76 based<br />
deviation from linear primaries.Unlike density curves a dot gain is not desirably for colorimetric curves. The colorimetry<br />
respects visual distances better than density.<br />
Colorimetric Linearity: The diagram shows the colorimetric linearity of the primaries.Flat curves indicate that the deltaE to<br />
white and solid color is proportional.<br />
50%<br />
0% 100%<br />
-50%<br />
Dot-Gain (CIE-based): The diagram shows the dot gain based on the XYZ data of the primaries.Note: Often these curves<br />
match the density based dot gain curves very good.<br />
50%<br />
0% 100%<br />
-50%
ColorLogic Profile Report 2012-1-30 EP78_PWM_MM_lwc90_0807_310.icc Page 21<br />
8. Dot Gain<br />
The diagram shows the dot gain of the primaries. The calculation is based on the spectral data found in the profile.<br />
50%<br />
0% 100%<br />
-50%