Energy skate park.pdf - PhET
Energy skate park.pdf - PhET
Energy skate park.pdf - PhET

You also want an ePaper? Increase the reach of your titles
YUMPU automatically turns print PDFs into web optimized ePapers that Google loves.
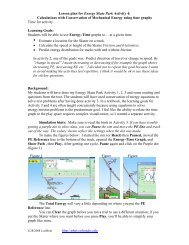
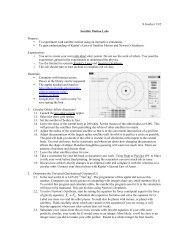
1. Open <strong>Energy</strong> Skate Park. Pause animation. Set <strong>skate</strong>r <br />
to ball. Move ball to top left side of track. <br />
Ask students to predict the motion of the ball when <br />
released. Predict motion diagram (position dots) for <br />
one cycle. <br />
<strong>Energy</strong> Skate Park: <br />
Intro to <strong>Energy</strong> Conservation <br />
Release ball, run a few cycles, then show path for a <br />
single cycle. Discuss. Where is the speed greatest? <br />
How can you tell? Where is it least? <br />
Ask students if friction is present. How can you tell? <br />
Turn on reference line and position at top of motion. <br />
How would the motion be different with friction? <br />
2. Pause animation, clear path dots, reset ball at <br />
starting position, and drag track as shown. <br />
Ask students to predict the motion of the ball now. <br />
Discuss possibilities, then run simulation. <br />
Ask students to compare the speed of the ball at the <br />
bottom of the steep section (moving right) to the <br />
speed of the ball at the bottom of the gentler slope <br />
(moving left). Use the path dots to answer the <br />
question. <br />
Ask students why the ball returns to the starting <br />
height. Does it depend on the path? <br />
3. Use menu to choose “double well roller coaster” <br />
track, pause animation, reselect ball. <br />
Ask students to predict the path of the ball. Run <br />
demo and discuss. <br />
4. Pause animation, reset ball to starting point, and <br />
drag track as shown. <br />
Ask students to predict the motion of the ball. Run <br />
demo. What has changed from the previous demo? <br />
5. Use menu to select loop track, pause animation and <br />
choose ball. Reset ball to starting position. <br />
Ask students to predict the motion of the ball. Run <br />
demo. Ask students: What condition must be met <br />
for the ball to make it over the loop? <br />
Drag loop higher to demonstrate.
6. Reset entire demo to original track, pause simulation, <br />
reselect ball, show reference line, and set line to lowest <br />
position of the track. Start animation on slower speed. <br />
Ask students to describe the condition of the ball as it <br />
moves in terms of energy. Does it start with <br />
gravitational potential energy? Kinetic energy? What <br />
happens as the ball begins to move? Where is the <br />
gravitational potential at a minimum? At this location on <br />
the track describe the kinetic energy. <br />
How would a graph of gravitational potential energy and <br />
ball position look? <br />
Run animation, open the energy-‐position graph, deselect <br />
all but potential, then zoom in to see the graph. Discuss. <br />
How would the kinetic energy-‐position graph look? <br />
Deselect potential and display only kinetic. Discuss. <br />
Is this graph related in any way to the graph of <br />
gravitational potential energy? Display both graphs and <br />
discuss. <br />
How would a graph of the total energy look? Display and <br />
discuss. How is the conservation of energy demonstrated <br />
in the graph? Explain. <br />
How can you tell there is no friction using only the <br />
graph? Display with friction. Why is the total energy <br />
staying the same? Reveal thermal energy and discuss <br />
conservation of energy in terms of all relevant forms. <br />
<br />
Turn off friction and open the animated bar graphs to <br />
give an alternate representation of the energy of the ball. <br />
Have students explain the graphic. Pause the simulation <br />
at various locations and discuss how the conservation of <br />
energy can be demonstrated by the graphs. This can be <br />
used to introduce energy bar graphs for analyzing <br />
energy problems.