You also want an ePaper? Increase the reach of your titles
YUMPU automatically turns print PDFs into web optimized ePapers that Google loves.
On the factors controlling the<br />
surface temperature<br />
and 2-m 2 m air temperature<br />
over the Arctic sea ice in winter<br />
Roberta Pirazzini 1,2 and Timo Vihma 1<br />
1<br />
Finnish Institute of Marine Research<br />
2<br />
University of Helsinki, Finland<br />
Photo: NASA
Which factors control the surface temperature (T S ) and<br />
2-m m air temperature (T 2m ) over sea ice in winter?<br />
1. Lateral advection of heat from lower latitudes;<br />
2. turbulent exchange with the surface and the inversion layer capping the ABL;<br />
3. radiative fluxes.<br />
T S<br />
and T 2m<br />
are are strongly coupled through the sensible heat flux<br />
but<br />
T S<br />
is more directly affected by radiative fluxes than T 2m<br />
.<br />
T 2m<br />
is directly affected by lateral heat advection.<br />
Objective of this study:<br />
To study the relative importance of the factors responsible for the observed<br />
synoptic-scale temperature variations over the Arctic sea ice in winter
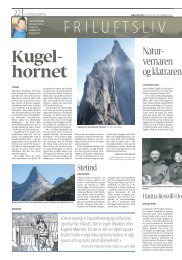
• Winter<br />
cyclon tracks<br />
• Adapted from<br />
Serreze and Barry,<br />
1988.<br />
Photo: Bruce Ramsay
Data<br />
→ From the Russian Ice Stations:<br />
NP-27 (winter 1986-1987)<br />
NP-28 (winters 1986-1987 and 1987-1988)<br />
NP-29 (winter 1987-1988)<br />
NP-30 (winters 1987-1988 and 1989-1990)<br />
we utilised synoptic data (3 hour intervals):<br />
– surface temperature (T S<br />
),<br />
– 2-m air temperature (T 2m<br />
),<br />
– cloud cover (total and low clouds),<br />
– wind speed<br />
– wind direction<br />
– surface pressure<br />
→ From ECMWF re-analyses, ERA-15 (resolution of 1.125° x 1.125°,<br />
pressure levels from 1000 to 600 hPa)<br />
– We calculated the lateral heat advection at the site of each Ice Station once per<br />
day (at 00 UTC).
Methods applied<br />
• We classify the data into various cases, following Walsh and Chapman<br />
(1998):<br />
cloudy skies (N > 7/10) and clear skies (N < 4)<br />
strong winds (so that 33% of cases exceed a high speed threshold)<br />
and weak wind (so that 33% of cases were below a low speed threshold)<br />
• In addition, we study the heat advection. To focus on the direct effect of it,<br />
we analyse the heat advection at 1000 hPa level.<br />
warm advection (so that 33% of cases exceed a warm threshold)<br />
and cold advection (so that 33% of cases were below a cold threshold)<br />
• To simplify the analyses, we study the potential temperature instead of the<br />
temperature<br />
• We study in more detail some single episodes of warm advection.
Monthly mean surface potential temperature θ s (thick lines)<br />
and 2-m 2 m air potential temperature θ 2m (thin lines)<br />
• Strong coupling between surface<br />
and 2-m air potential temperature.<br />
3h change → controlled by cloud<br />
cover and advection<br />
24h change → controlled by<br />
advection<br />
Magnitude → controlled by cloud<br />
cover and wind speed
Monthly mean surface - air<br />
potential temperature difference<br />
θ s - θ 2m<br />
• Cloud fraction is the most important factor.<br />
• In March, θ s<br />
- θ 2m<br />
increases and neither the effects of cloud cover, advection<br />
nor wind speed make much difference.
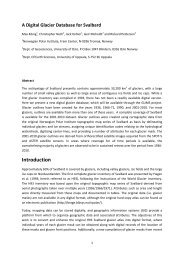
Monthly mean (a) 2-m 2 m air potential temperature and (b) surface - air<br />
potential temperature difference for:<br />
- warm advection (red) - cold advection (blue)<br />
- cloudy skies (solid lines) - clear skies (dashed lines)<br />
- strong winds (thick lines)<br />
- weak winds (thin lines)<br />
• θ 2m : - clear skies + weak winds →θ 2m ~ - 40ºC<br />
- clear skies + strong winds →θ 2m increases ~ 5ºC<br />
- cloudy skies + weak winds →θ 2m increases ~ 5-9ºC<br />
- cloudy skies + strong winds →θ 2m increases ~ 10-20ºC<br />
- to reach the warmest temperatures, also warm advection<br />
is required<br />
• θ s - θ 2m : - cloud fraction is more important than wind speed
6.0<br />
5.0<br />
Temperature advection ( o C/3h)<br />
4.0<br />
3.0<br />
2.0<br />
1.0<br />
0.0<br />
-1.0<br />
-2.0<br />
-3.0<br />
01/01/87<br />
31/12/86<br />
6.0<br />
Temperature advection ( o C/3hours)<br />
5.0<br />
4.0<br />
3.0<br />
2.0<br />
1.0<br />
0.0<br />
-1.0<br />
-2.0<br />
-3.0<br />
01/01/87<br />
31/12/86<br />
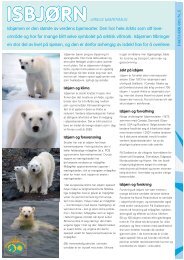
Case studies: warm advection episodes in December 1986<br />
Case studies: warm advection episodes in December 1986<br />
(a) 3 to 4 December (b) 6 to 9 December<br />
(c) 11to 16 December (d) 23 to 26 December<br />
0<br />
NP-27<br />
a) b)<br />
-5<br />
-10<br />
-15<br />
-20<br />
-25<br />
-30<br />
-35<br />
-40<br />
-45<br />
-50<br />
-55<br />
-60<br />
0<br />
-5<br />
-10<br />
-15<br />
-20<br />
-25<br />
-30<br />
-35<br />
-40<br />
-45<br />
NP-28<br />
-50<br />
-55<br />
-60<br />
01/12/86<br />
02/12/86<br />
03/12/86<br />
04/12/86<br />
05/12/86<br />
06/12/86<br />
07/12/86<br />
08/12/86<br />
09/12/86<br />
10/12/86<br />
11/12/86<br />
12/12/86<br />
13/12/86<br />
14/12/86<br />
15/12/86<br />
16/12/86<br />
17/12/86<br />
18/12/86<br />
19/12/86<br />
20/12/86<br />
21/12/86<br />
22/12/86<br />
23/12/86<br />
24/12/86<br />
25/12/86<br />
26/12/86<br />
27/12/86<br />
28/12/86<br />
29/12/86<br />
30/12/86<br />
Air temperature ( o C)<br />
NP-27<br />
NP-28<br />
NP-27<br />
NP-28<br />
a)<br />
Ta (oC)<br />
Advection > 0<br />
Advection < 0<br />
Tair (oC)<br />
Advection > 0<br />
Advection < 0<br />
c)<br />
NP-27<br />
NP-28<br />
d)<br />
NP-27<br />
b)<br />
NP-28<br />
Slp from ECMWF re-analysis (ERA-15)
Acknowledgments<br />
• Russian scientists who collected the data<br />
• ECMWF<br />
• Finnish Cultural Foundation<br />
Photo: NASA