download PDF - Imaging Notes
download PDF - Imaging Notes
download PDF - Imaging Notes

Create successful ePaper yourself
Turn your PDF publications into a flip-book with our unique Google optimized e-Paper software.
EARTH REMOTE SENSING<br />
FOR SECURIT Y<br />
ENERGY AND<br />
THE ENVIRONMENT<br />
Fall 2011<br />
Vol. 26 No.4<br />
about<br />
Software and<br />
HumanGeo<br />
RADAR &<br />
LIDAR<br />
UPDATES<br />
EDITORIAL<br />
SECTION<br />
GEOSPATIAL<br />
LAW
Imagine Your<br />
Imagery Everywhere<br />
Esri’s ArcGIS ® simplifies the next generation of imagery<br />
management and dissemination through on-the-fly<br />
processing, image services, and dynamic mosaicking.<br />
With ArcGIS, your imagery is accessible to more<br />
people in less time.<br />
2<br />
IMAGING NOTES // FALL 2011 // WWW.IMAGINGNOTES.COM<br />
Learn more at esri.com/imagingnotes<br />
Copyright © 2011 Esri. All rights reserved. Imagery courtesy of GeoEye and DigitalGlobe.
Fall 2011<br />
> > Columns<br />
7<br />
> > Features<br />
CONTENTS<br />
Secure World<br />
Foundation Forum<br />
ASTROID FLYBY COMING<br />
19<br />
10 Omar<br />
NGA OPEN SOURCE<br />
INITIATIVE<br />
By Mark Lucas,<br />
RadiantBlue Technologies<br />
14<br />
19<br />
27<br />
Human Terrain<br />
ISEBOX FUSES<br />
GEOSPATIAL DATA<br />
By Abe Usher,<br />
The HumanGeo Group<br />
Processing Point Clouds<br />
LIDAR SOFTWARE PREVIEW<br />
By Matteo Luccio<br />
Applications for Radar<br />
DEFENSE, MARITIME<br />
AND ENGINEERING<br />
By Matteo Luccio<br />
IMAGING NOTES // FALL 2011 // WWW.IMAGINGNOTES.COM<br />
7<br />
10<br />
> > Special section<br />
36<br />
37<br />
40<br />
42<br />
Standards for the<br />
GeoEconomy<br />
THE VALUE OF<br />
SIMPLIFICATION<br />
Food Security<br />
KEY: ACCESS TO LOCAL<br />
INFORMATION<br />
Location Legal Issues<br />
LBx EXECUTIVE INTERVIEW:<br />
Kevin Pomfret, Esq.<br />
Spatial Info R&D<br />
44 in Australia and<br />
New Zealand<br />
LBx EXECUTIVE INTERVIEW:<br />
Peter Woodgate<br />
3
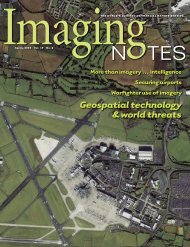
Qom Nuclear<br />
Facility, Iran<br />
COVER IMAGE<br />
Fall 2011 / Vol. 26 / No. 4<br />
Our Mission<br />
<strong>Imaging</strong> <strong>Notes</strong> is the premier publication for commercial, government and academic<br />
remote sensing professionals around the world. It provides objective exclusive in-depth<br />
reporting that demonstrates how remote sensing technologies and spatial information<br />
illuminate the urgent interrelated issues of the environment, energy and security.<br />
COSMO-SkyMed 1-meter<br />
resolution radar image (Spotlight-2 mode)<br />
over the nuclear facility of Qom in the<br />
Iranian desert shows disturbed terrain. The black<br />
and white background image highlights bright<br />
industrial structures and buildings. Dark linear<br />
features represent dirt roads and a track network<br />
around the plant.<br />
When the acquisition of imagery is repeated<br />
after a short time, the coherence of the phase<br />
signals between the two images provides<br />
additional information about the scene. Red<br />
tracks are derived from coherence calculated<br />
over a time span of eight days. They show where<br />
the stable desert terrain was “disturbed” by the<br />
passage of vehicles (both on and off-road) and<br />
even animals (randomly distributed tracks on the<br />
upper right).<br />
Image also appears on page 43, and is<br />
courtesy of e-GEOS S.p.A.<br />
<strong>Imaging</strong> <strong>Notes</strong> has a partnership<br />
with Secure World Foundation<br />
(www.secureworldfoundation.org).<br />
Publisher/Managing Editor<br />
Myrna James Yoo<br />
myrna@imagingnotes.com<br />
Editor<br />
Ray A. Williamson, PhD<br />
ray@imagingnotes.com<br />
Copy Editor<br />
Bette Milleson<br />
Creative Director<br />
Jürgen Mantzke<br />
Enfineitz LLC<br />
jurgen@enfineitz.com<br />
www.enfineitz.com<br />
Editorial Contributions<br />
<strong>Imaging</strong> <strong>Notes</strong> is affiliated with the<br />
Alliance for Earth Observations, a<br />
program of The Institute for Global<br />
Environmental Strategies<br />
(www.strategies.org).<br />
Editorial Advisory Board<br />
Mark E. Brender, GeoEye<br />
Anita Burke<br />
The Catalyst Institute<br />
Nancy Colleton<br />
Institute for Global<br />
Environmental Strategies<br />
William B. Gail, PhD<br />
Microsoft<br />
Anne Hale Miglarese<br />
Booz Allen Hamilton<br />
Kevin Pomfret, Esq.<br />
LeClair Ryan<br />
<strong>Imaging</strong> <strong>Notes</strong> welcomes contributions for feature articles. We publish articles on the<br />
remote sensing industry, including applications, technology, and business. Please see<br />
Contributor’s Guidelines on www.imagingnotes.com, and email proposals to<br />
editor@imagingnotes.com.<br />
Subscriptions<br />
To subscribe or renew, please go to www.imagingnotes.com, and click on ‘subscribe.’<br />
If you are a current subscriber, renew by locating your account<br />
number on your address label to enter the database and update your subscription.<br />
If you cannot go online, you may write to the address below.<br />
<strong>Imaging</strong> <strong>Notes</strong> (ISSN 0896-7091) Copyright © 2011<br />
Blueline Publishing LLC, P.O. Box 11519, Denver, CO 80211, 303-477-5272<br />
All rights reserved. No material may be reproduced or transmitted in any form or by<br />
any means without written permission from the publisher. While every precaution is<br />
taken to ensure accuracy, the publisher and the Alliance for Earth Observations cannot<br />
accept responsibility for the accuracy of information or for any opinions or views<br />
presented in <strong>Imaging</strong> <strong>Notes</strong>.<br />
Although trademark and copyright symbols are not used in this publication, they<br />
are honored.<br />
<strong>Imaging</strong> <strong>Notes</strong> is printed on 20% recycled (10% post-consumer waste) paper.<br />
All inks used contain a percentage of soy base. Our printer meets or<br />
exceeds all federal Resource Conservation Recovery Act (RCRA) Standards.<br />
4<br />
IMAGING NOTES // FALL 2011 // WWW.IMAGINGNOTES.COM
IMAGING NOTES // FALL 2011 // WWW.IMAGINGNOTES.COM<br />
5
34°30’58.07”N<br />
69°10’51.61”E<br />
POSITIONAL ACCURACY:<br />
Big Asteroid Flyby of Earth<br />
OBSERVATION CAMPAIGN SPURRED<br />
SECURE WORLD FOUNDATION FORUM<br />
Circle the day November 8 on your calendars. One of<br />
the largest and potentially most perilous space rocks in the heavens will zoom<br />
by Earth. The unique event will become the object de jour for an armada of<br />
ground observers. An extensive campaign of radar, visual and infrared observations has<br />
been ordered to survey the cosmic intruder.<br />
Asteroid 2005 YU55 is a mini-world that’s roughly 1,300 feet (400 meters) in<br />
diameter. In early November, this asteroid will approach Earth within a scant 0.85 lunar<br />
distance. A lunar distance is the distance from the Earth to the Moon or about 240,000<br />
miles.<br />
In many ways, the chunk of rock serves as yet another wake-up call. It is a reminder<br />
about life here on our sitting duck of a planet. This will be the closest approach to date<br />
by an object this large that we know about in advance.<br />
But don’t worry…too much. Although classified as a potentially hazardous object, 2005<br />
YU55 poses no threat of an Earth collision – for at least the next 100 years!<br />
SS<br />
FIGURE 1. Several years ago, near-Earth asteroid 2005 YU55 was “imaged”<br />
by the Arecibo Radar Telescope in Puerto Rico. In early November, this large<br />
space rock will zip by planet Earth and be surveyed by radar, visual and<br />
infrared equipment. Image credit: NASA/Cornell/Arecibo.<br />
On-call Observations<br />
The 2005 YU55 is unusual since it<br />
is close and big, explains Don Yeomans,<br />
Manager of NASA’s Near-Earth Object<br />
(NEO) Program Office and the Jet<br />
Propulsion Laboratory (JPL) in Pasadena,<br />
California. “On average, one wouldn’t<br />
expect an object this big to pass this<br />
close but every 30 years.”<br />
Yeomans told <strong>Imaging</strong> <strong>Notes</strong> that<br />
scientists see a great opportunity coming,<br />
given the close flyby. On call are groundbased<br />
optical and near-infrared equipment,<br />
as well as high-powered radar.<br />
Collectively, the observations should<br />
paint a fairly complete picture of a large,<br />
potentially hazardous asteroid.<br />
The observations should define the<br />
object’s rotation characteristics, as well<br />
as the asteroid’s surface roughness and<br />
even mineral makeup.<br />
Lance Benner is a research scientist<br />
at JPL and a specialist on radar imaging of<br />
near-Earth objects. He said radar scanning<br />
of the asteroid will be done using the huge<br />
Arecibo dish in Puerto Rico and equipment<br />
at Goldstone, California. “In a real sense,<br />
this will provide imaging resolution comparable<br />
to or even better than a spacecraft<br />
mission flyby,” he points out. “It’s a truly<br />
extraordinary flyby that we hope will reveal<br />
considerably more information than we<br />
currently have about this 400-meter sized,<br />
round, dark, and mysterious little world.”<br />
Using the Goldstone radar operating<br />
in a relatively new “chirp” mode, the<br />
November radar opportunity could result in<br />
a shape model reconstruction of the object<br />
with a resolution as fine as 4 meters.<br />
Early on, the asteroid will be too<br />
close to the Sun and too faint for optical<br />
observers. However, late in the day on<br />
November 8 into the following day, the<br />
IMAGING NOTES // FALL 2011 // WWW.IMAGINGNOTES.COM<br />
7
SECURE WORLD FOUNDATION FORUM<br />
SS<br />
FIGURE 2. An animation prepared by Jon Giorgini of the Jet Propulsion Laboratory shows the<br />
motion of asteroid 2005 YU55 in the vicinity of the Earth and Moon during the flyby. This can be<br />
viewed at http://ssd.jpl.nasa.gov/x/jdg/2005yu55/2005_YU55_approach_movie.gif<br />
Committee on the Peaceful Uses of Outer<br />
Space to develop an appropriate international<br />
agreement for responding to the NEO<br />
threat.<br />
By the way, put in your memory bank<br />
the year 2028. That’s when asteroid 2001<br />
WN5 will pass to within 0.6 lunar distance!<br />
“There are definitely small near-Earth<br />
asteroids in our future, and we must<br />
make sure that when we encounter<br />
one, it is on our terms, not its,” points<br />
out David Morrison, Director of the Carl<br />
Sagan Center for the Study of Life in the<br />
Universe at the SETI Institute in Mountain<br />
View, California.<br />
To see an animation prepared by Jon<br />
Giorgini of the Jet Propulsion Laboratory<br />
that shows the motion of asteroid 2005<br />
YU55 in the vicinity of the Earth and<br />
Moon during the flyby, go to http://ssd.jpl.<br />
nasa.gov/x/jdg/2005yu55/2005_YU55_<br />
approach_movie.gif.<br />
object could reach about 11th magnitude<br />
for several hours before it fades as its<br />
distance from Earth rapidly increases.<br />
But what won’t fade is interest in<br />
keeping an eye on asteroids that may well<br />
have Earth’s address on their space routes.<br />
Planetary Defense<br />
The havoc stemming from an NEO<br />
plowing into the Earth depends on its size<br />
and trajectory. Damage could range from<br />
destruction of an area the size of a city, to<br />
creation of tsunamis, to the extinction of<br />
almost all life on Earth.<br />
In the making is a Planetary Defense<br />
strategy, one that includes finding these<br />
potentially hazardous objects, predicting<br />
their future locations, and providing<br />
warning about future impacts with<br />
the Earth. It also includes missions to<br />
deflect impacting asteroids by changing<br />
their orbit, and disaster preparedness,<br />
management, and recovery on Earth to<br />
mitigate their consequences.<br />
The Secure World Foundation has<br />
focused on how the world might organize<br />
to meet the challenge of mitigating<br />
possible effects of an incoming NEO.<br />
Doing so poses significant policy and<br />
legal challenges, many of which are<br />
common to space situational awareness,<br />
data sharing, collective security, and<br />
shared decision making.<br />
Hence, the Foundation has partnered<br />
with the Association of Space Explorers<br />
and other organizations to assist the U.N.<br />
<br />
BY LEONARD DAVID<br />
Research Associate<br />
Secure World Foundation<br />
www.secureworldfoundation.org<br />
8<br />
IMAGING NOTES // FALL 2011 // WWW.IMAGINGNOTES.COM
SECURE WORLD FOUNDATION FORUM<br />
w<br />
TM<br />
IMAGING NOTES // FALL kadaster 2011 // WWW.IMAGINGNOTES.COM<br />
9<br />
GEOSPATIAL<br />
WORLD
OPEN SOURCE SOFTWARE FOR GEOINT 3.0<br />
1 2<br />
SS<br />
FIGURE 1. A simple Web browser provides the interface to the OMAR<br />
system. The map can be panned and zoomed to identify the area of<br />
interest. Date, time and other fields can be used to filter the desired<br />
search results.<br />
SS<br />
FIGURE 2. Tabbed pages of metadata and an overview thumbnail are<br />
returned from the user’s search request.<br />
<br />
MARK LUCAS<br />
Principal Scientist<br />
RadiantBlue Technologies, Inc.<br />
Melbourne Beach, Fla.<br />
www.radiantblue.com<br />
www.osgeo.org<br />
<br />
EDITOR’S NOTE: See also related<br />
article from The HumanGeo Group by<br />
Abe Usher on page 14.<br />
AT THE GEOINT SYMPOSIUM IN 2010, NATIONAL GEOSPATIAL-<br />
Intelligence Agency (NGA) Director Letitia Long provided a vision for the future<br />
and labeled it GeoInt 3.0. That vision includes remote user access to imagery and<br />
products, collaboration, and manipulation of rapidly evolving agile technologies. Omar,<br />
from RadiantBlue Technologies, is a web-based processing and distribution solution that<br />
addresses many of the GeoInt 3.0 goals.<br />
The solution embodies many of the features and approaches that were eloquently<br />
communicated by Director Long. She stated, “I want to put the power of GeoInt<br />
directly in the hands of our users.”<br />
Today, Omar is deployed on classified networks providing remote access of imagery<br />
and video to the warfighter. Ships at sea, rescue missions, numerous patrols, and<br />
regular service personnel are routinely reporting how these quick looks have assisted<br />
their missions on a daily basis.<br />
10<br />
IMAGING NOTES // FALL 2011 // WWW.IMAGINGNOTES.COM
The way in which this solution was developed and continues to evolve rapidly is<br />
just as interesting as its functionality. OMAR is open source software. It is developed<br />
and maintained in an online, distributed, and unclassified environment. The<br />
only exceptions are modular classified “plug-ins” that are maintained separately<br />
in classified networks. This architecture and approach allows development and<br />
integration at “Internet speed.”<br />
The rapid evolution of this system is made possible through the use of open<br />
source software projects, policies, and procedures led by the Open Source Geospatial<br />
(OSGeo) Foundation. OSGeo is the leading organization for open source software<br />
projects. OSGeo provides governance, standards, practices, code review, automated<br />
testing, and configuration management for leading open source geospatial projects.<br />
These services are managed through a stringent incubation process, project steering<br />
committees, and community peer pressure. Most projects are commercially backed<br />
by companies and consultants. The resulting systems are more efficient, with lower<br />
life-cycle costs; just as important, they are extremely agile. There are now hundreds (if<br />
not thousands) of companies dependent on OSGeo technologies for the services and<br />
value-added products these companies bring to market.<br />
This approach to providing services is in stark contrast to traditional govern-<br />
and practices. As an example, NGA<br />
InnoVision (the NGA division tasked<br />
with implementing new technologies)<br />
recently announced a major initiative<br />
for open source software adoption. The<br />
primary drivers are total cost of ownership<br />
and technical agility. Recently we<br />
have seen the open source model applied<br />
to hardware design, such as the DARPA<br />
vehicleforge.<br />
Companies such as RadiantBlue Technologies<br />
provide professional services<br />
and support for the resulting systems and<br />
bridge the requirements of government<br />
acquisitions to the commercial practices,<br />
domain expertise, and support of open<br />
source business models. These new business<br />
models earn revenue by providing<br />
3 4<br />
SS<br />
FIGURE 3. Views are calculated and presented on the fly with full<br />
orthorectification and precision terrain correction. Data courtesy of<br />
DigitalGlobe Corporation.<br />
SS<br />
FIGURE 4. The inset shows a resampled area of interest without<br />
image enhancements. Simple sharpening and histogram stretch<br />
operations can be applied by the user to bring out detail. Linear and<br />
area measuring, view export to file, band selection, and output to<br />
various streaming protocols are all supported to enhance the user’s<br />
workflow. Data courtesy of DigitalGlobe Corporation.<br />
ment software procurement and development practices. Existing government<br />
procurement practices evolved from large weapons systems and are not appropriate<br />
for rapidly evolving commodity technologies. Historically, government acquisition<br />
led to pre-defined requirements decomposed into tasks and sub-tasks bound by<br />
rigid schedules. Rapid innovation is difficult in that environment.<br />
Modern day open source practices and tools provide automated tracking of<br />
discrepancies and enhancements, self-documenting code structures, unit testing,<br />
continuous builds, and extremely rapid evolution. The Internet and most of the<br />
corporate world now run on open source software and have adopted these practices.<br />
The need for rapid technical evolution and the pressing need to reduce operating<br />
budgets have focused government attention on the open source approach.<br />
Several government agencies are rapidly adopting open source software solutions<br />
value to the customer and flexibility<br />
through rapid sub-contracting with other<br />
open source companies and consultants.<br />
Open standards and interfaces have<br />
allowed these systems to continually<br />
integrate and evolve to meet the operational<br />
challenges of constantly shifting<br />
missions. Significantly, these approaches<br />
allow the data to be manipulated and<br />
viewed remotely — often avoiding bandwidth<br />
limitations and data duplication<br />
that are prominent with “push” architec-<br />
IMAGING NOTES // FALL 2011 // WWW.IMAGINGNOTES.COM<br />
11
tures. The Internet is constantly showing<br />
us new business models and ways to<br />
collaborate; many of these approaches<br />
have been applied in the Omar system.<br />
Key features of the OMAR system are:<br />
››<br />
Remote discovery, viewing, and<br />
manipulation of imagery and<br />
products<br />
››<br />
On-the-fly orthorectification,<br />
precision terrain correction, and<br />
sensor model projection<br />
››<br />
Full Motion Video discovery and<br />
playback<br />
››<br />
ITAR-approved core baseline<br />
››<br />
Operation in both classified and<br />
unclassified systems<br />
››<br />
Standards-based interfaces to<br />
external systems and tools<br />
››<br />
No software installation needed at<br />
the user end<br />
››<br />
No licensing fees for the open<br />
source software system<br />
The user needs only a web browser<br />
and network access to use the system.<br />
The design strategy has been to keep the<br />
interface simple with only a web browser<br />
required on the user’s device. All of the<br />
advanced processing and storage are<br />
managed on the server end where the<br />
data reside. This approach works well<br />
over long distances with limited bandwidth,<br />
providing a simple interface on<br />
the user’s end and concentrating all of<br />
the advanced technology, storage and<br />
processing upstream.<br />
After logging in to the system, the<br />
remote user can interactively pan and<br />
roam through a reference map of the<br />
world to the area of interest. Footprints of<br />
The user needs only a web browser and<br />
network access to use the system . . . All of<br />
the advanced processing and storage are<br />
managed on the server end where the data<br />
reside. This approach works well over long<br />
distances with limited bandwidth, providing<br />
a simple interface on the user’s end and<br />
concentrating all of the advanced technology,<br />
storage and processing upstream.<br />
available datasets are shown on the map,<br />
and results can be filtered based on a wide<br />
range of metadata parameters including<br />
date, time, sensor, target ID or any arbitrary<br />
combination of metadata values.<br />
When the user presses the search<br />
button, a results page is returned. The<br />
results page includes all of the available<br />
datasets that meet the user’s criteria. See<br />
Figure 1.<br />
An overview thumbnail is included<br />
along with a listing of the associated<br />
metadata. Tabs can select additional<br />
information about the dataset and<br />
options for streaming the data. Clicking<br />
the thumbnail allows the user to roam<br />
and zoom into the image or product<br />
at will. Additional controls are available<br />
for image adjustment. The user’s<br />
cursor displays the location readout in<br />
a number of formats. See Figure 2.<br />
Many users of the system are using<br />
these interfaces to stream OMAR data<br />
into Google Earth. The system includes<br />
<strong>download</strong>able network links that automatically<br />
will fetch the latest data as<br />
Google Earth users change their view.<br />
Simple controls for brightness,<br />
contrast, and sharpening can be adjusted.<br />
The resulting view can be saved locally<br />
in a number of formats for use in briefings<br />
or as input to other tools. Additionally<br />
a number of standard web mapping<br />
services allow OMAR views to be fed<br />
directly into other applications. Remote<br />
viewing and manipulation of National<br />
Technical Means (NTM), NGA products,<br />
Commercial Imagery, and Motion<br />
Imagery Standards Board (MISB)-<br />
compliant Full Motion Video (FMV) is<br />
provided by the system. NTM imagery<br />
is orthorectified and precision terrain<br />
corrected on the fly and projected into<br />
the web page view with the addition of a<br />
software plug-in that is separately maintained<br />
in a classified environment.<br />
Once the image is selected, the user<br />
can roam and pan at will through the<br />
full size remote image. See Figure 3.<br />
Most users are simply looking for reference<br />
or recent information in a very small<br />
area of interest. The system has exposed<br />
simple controls for manipulating the view,<br />
reading the coordinates, and taking simple<br />
measurements. The user can also save<br />
that adjusted view locally in a number<br />
of geospatial file formats. The goal was<br />
to put the users in charge and give them<br />
direct access to their area of interest in the<br />
national archives. See Figure 4.<br />
The OMAR system has been<br />
deployed on distributed super-computer<br />
networks, simple servers, and personal<br />
computers. The general concept is to<br />
move the software to the data, not the<br />
data to the software. Continuing evolution<br />
of social networks, standardsbased<br />
protocols, and online technologies<br />
will be integrated into new releases<br />
of the system.<br />
In summary, Omar is a demonstration<br />
of a new approach of software<br />
development and user interaction for<br />
everyday government users. The open<br />
source software development model<br />
and rapid innovation on the Internet<br />
lead to technical agility and dramatically<br />
lower total cost of ownership for<br />
remote manipulation and viewing of<br />
remotely sensed data.<br />
12<br />
IMAGING NOTES // FALL 2011 // WWW.IMAGINGNOTES.COM
OCT. 16-19<br />
San Antonio, Texas<br />
Register NOW<br />
and SAVE!<br />
http://geoint2011.com/registration<br />
The eighth annual GEOINT Symposium returns to San Antonio!<br />
The United States Geospatial Intelligence Foundation invites you to the<br />
Henry B. Gonzalez Convention Center in one of the GEOINT Symposium’s<br />
favorite cities, San Antonio, TX, for GEOINT 2011. The GEOINT Symposium will<br />
capture your interest with intriguing keynotes, panels and breakout tracks<br />
from the Defense, Intelligence and Homeland Security Communities’ most<br />
prominent leaders. In the 100,000-square foot exhibit hall attendees and<br />
exhibitors alike can learn about current trends and innovations. GEOINT 2011<br />
also promises invaluable networking opportunities throughout the<br />
day and during evening reception events. Mark your calendar for<br />
Oct. 16-19 because you won’t want to miss out on this must-attend event.<br />
Attend GEOINT 2011 and hear from these Community leaders …<br />
Gen. Keith B. Alexander, U.S. Army<br />
Commander, U.S. Cyber Command<br />
Director, National Security Agency<br />
Ms. Letitia A. Long<br />
Director, National Geospatial-Intelligence Agency<br />
Mr. Bruce Carlson<br />
Director, National Reconnaissance Office<br />
The Honorable Michael G. “Mike” Vickers<br />
Under Secretary of Defense for Intelligence<br />
The Honorable James R. Clapper Jr.<br />
Director of National Intelligence<br />
Adm. James A. “Sandy” Winnefeld Jr., U.S. Navy<br />
Commander, North American Aerospace Defense Command<br />
Commander, United States Northern Command<br />
Gen. Douglas Fraser, U.S. Air Force<br />
Commander, U.S. Southern Command<br />
Gen. C. Robert “Bob” Kehler, U.S. Air Force<br />
Commander, U.S. Strategic Command<br />
IMAGING NOTES // FALL 2011 // WWW.IMAGINGNOTES.COM<br />
Congressman Mike Rogers<br />
Michigan, 8th District<br />
Congressman<br />
C.A. Dutch Ruppersberger<br />
Maryland, 2nd District<br />
Rep. Rogers, Chairman,<br />
HPSCI, and Rep.<br />
Ruppersberger, Ranking<br />
Member, HPSCI, will provide<br />
a joint keynote. Don’t miss<br />
this opportunity to see two<br />
key decision-makers share<br />
their knowledge. 13<br />
Where Our National Security Begins…<br />
@GEOINTSymposium<br />
www.geoint2011.com<br />
See highlights from GEOINT 2010 at www.geointv.com
ISEBOX<br />
Fuses<br />
Geospatial<br />
Data<br />
NEW METHODS OF HUMAN TERRAIN ANALYSIS<br />
Challenges in Today’s Technology Landscape<br />
IN TODAY’S COMPLEX ENVIRONMENT, PLANNING FOR FUTURE MILITARY<br />
operations requires allocating and moving resources in the geospatial domain.<br />
Military planners and intelligence professionals are challenged to make<br />
sense out of disparate socio-cultural data, collected for different purposes by a<br />
multitude of systems, and at different levels of specificity.<br />
To interpret such data, the military<br />
often turns to Geographic Information<br />
Systems (GIS) as well as statistical<br />
analysis and data mining techniques.<br />
However, these solutions have<br />
drawbacks. GIS solutions are not built<br />
around a user’s workflow and typically<br />
require that users have a significant<br />
understanding of the technology’s<br />
foundational concepts, including<br />
familiarity with the fields of geography,<br />
statistics, cartography, and database<br />
architecture. Intelligence professionals<br />
<br />
BY ABE USHER, CTO<br />
AND ALTAF BAHORA, VICE PRESIDENT<br />
The HumanGeo Group<br />
New York, N.Y. and Herndon, Va.<br />
www.thehumangeo.com<br />
and military planners also need the<br />
technical know-how to phrase questions<br />
correctly to get to the answers or<br />
results they are searching for based on<br />
the differing search query formats and<br />
capabilities provided by each tool.<br />
Statistical analysis and data mining<br />
are frequently used to predict future<br />
activities and events based on indicators<br />
(key information about the people<br />
and environment). Data mining also<br />
helps identify patterns for planners and<br />
analysts. There is a significant difference<br />
between knowing exactly what<br />
you want to look for and allowing<br />
patterns to emerge from the data to<br />
then analyze.<br />
Such a non-parametric approach<br />
of letting the data “be your guide” is<br />
particularly powerful when analysts<br />
14<br />
IMAGING NOTES // FALL 2011 // WWW.IMAGINGNOTES.COM
have simple tools that allow them to<br />
explore data based on their own expert<br />
hypotheses. Although not exact, such<br />
models hold enough precision and accuracy<br />
to be useful in planning scenarios,<br />
but do not provide a complete solution.<br />
New Technology and Methods Are<br />
Needed<br />
For all of these technology advances,<br />
the Department of Defense (DOD) is<br />
still constrained by the variety, quantity,<br />
and structure of data it collects.<br />
There is a large amount of data being<br />
2<br />
1<br />
WW<br />
FIGURE 1. Adding context with the ISEBOX<br />
methodology.<br />
SS<br />
FIGURE 2. ISEBOX (Integrated Socio-<br />
Cultural Environment for Behavior<br />
Observation eXploitation) methodology adds<br />
context. In this image, the boxes and spikes<br />
represent areas with a high number of<br />
violent events around religious facilities.<br />
collected, but the process of extracting<br />
the relevant data is time consuming.<br />
Moreover, the usefulness of the data is<br />
dependent upon the users’ knowledge,<br />
the data they have to work with, and<br />
the context from which they view the<br />
world.<br />
Jeff Jonas, Chief Scientist of IBM<br />
Entity Analytics, notes, “If an organization<br />
cannot evaluate how new<br />
data points relate to its historical data<br />
holding in real time, the organization<br />
will miss opportunities for action.<br />
However, when the ‘data can find the<br />
data,’ there exists an opportunity for<br />
the insight to find the user.” To address<br />
these data challenges, it is necessary to<br />
find ways to collect and fuse non-standard<br />
data sources in order to rapidly<br />
gain understanding of other regions of<br />
the world. When dealing with highly<br />
structured, well-formatted data, it is<br />
relatively easy to “connect the dots”<br />
and understand the associations and<br />
relationships between various data<br />
elements.<br />
Unfortunately, things are much less<br />
clear when examining socio-cultural and<br />
behavioral data. Specifically, some types<br />
of analyses lend themselves to macroanalyses<br />
(e.g., comparing GDP of nations<br />
in the world). Other types of analyses<br />
require very precise data (e.g., understanding<br />
the exact location of a facility<br />
Leveraging this<br />
real-world example<br />
and ISEBOX,<br />
the developers<br />
replicated and<br />
distilled the same<br />
analysis of the<br />
area of interest in<br />
a period of hours,<br />
as opposed to<br />
weeks, and with<br />
a fraction of the<br />
resources needed<br />
with existing tools<br />
and datasets,<br />
to discover<br />
non-obvious<br />
information from<br />
open source sociocultural<br />
data.<br />
IMAGING NOTES // FALL 2011 // WWW.IMAGINGNOTES.COM<br />
15
that might be a safe house for a terror<br />
group).<br />
Analysts are often tempted to interpret<br />
the data in terms of man-made<br />
boundaries such as provinces, states, or<br />
districts, even when such boundaries are<br />
often not at a level of geospatial detail<br />
required for analysis. This problem is<br />
well documented and described as the<br />
Modifiable Areal Unit Problem (MAUP),<br />
which in essence warns that the unit<br />
of analysis selected while performing<br />
geospatial analysis has an overwhelming<br />
influence on the outcome and accuracy<br />
of the analysis (and whether it can be<br />
used again in the future).<br />
are the future of GEOINT,” asserted<br />
Chris Tucker, USGIF Board Member.<br />
ISEBOX ingests the widest range of<br />
open sources of geospatial data (such<br />
as social media, civilian government<br />
sources, NGO data, and communitydriven<br />
data collections) and provides a<br />
means of combining the sources to enable<br />
analysts to detect non-obvious patterns<br />
in the data in order to “tip and cue” planners,<br />
collectors, and analysts to points on<br />
3<br />
The typical DOD analyst currently faces<br />
the burden of inferring and conveying<br />
the resultant precision and uncertainty<br />
of the combined datasets.<br />
SS<br />
FIGURE 3. Fusing data layers for better<br />
insight: The red boxes show areas with high<br />
population density and high violent event<br />
rates, fusing two different datasets to see<br />
areas of concern quickly.<br />
ISEBOX<br />
To enable the military to fuse together<br />
the data at its disposal and make better<br />
decisions, faster, the HumanGeo Group<br />
developed ISEBOX (Integrated Socio-<br />
Cultural Environment for Behavior<br />
Observation Exploitation), a geospatial<br />
threat-forecasting application that allows<br />
data with different spatial resolutions<br />
to be intermixed while preserving the<br />
original data. See Figure 1. ISEBOX identifies<br />
friendly forces, trends, geo-political<br />
activity, and threat indicators to provide<br />
operations planners with critical access<br />
to data required to perform Intelligence<br />
Preparation of the Battlefield (IPB).<br />
ISEBOX uses variable precision data<br />
encodings of location to facilitate nonobvious<br />
pattern detection and predictive<br />
analysis in the geospatial domain. See<br />
Figures 2 and 3.<br />
Multi-Precision Data Fusion<br />
To accomplish this, ISEBOX<br />
employs geospatial hashing algorithms<br />
to encode data. These mathematical<br />
procedures assign unique, compact,<br />
and structured indices to any location<br />
or time to enable the utilization of<br />
data of vastly different geospatial and<br />
temporal resolutions. This encoding<br />
method enables the combination of<br />
datasets to identify regions of threatening<br />
characteristics.<br />
Regions are rapidly refined into grid<br />
patterns to provide planners, operators,<br />
and analysts with geo-rectified collection<br />
and analytic start points to address<br />
emergent operational analytic requirements.<br />
In this way, ISEBOX’s innovative<br />
capabilities allow decision makers<br />
to assess the adequacy of composite<br />
datasets to meet operational needs and<br />
to conduct effective risk analyses.<br />
ISEBOX’s methods of fusing databased<br />
synthetic variables (grids) are a<br />
significant departure from legacy geospatial<br />
science. “Past strategies for fusing<br />
open source data into spatially enabled<br />
mission framework have been insufficient.<br />
The new innovative methods used<br />
for encoding and fusing data in ISEBOX<br />
the ground defined by geography, time,<br />
function, and analytic discipline. Many<br />
commercial geospatial analysis tools<br />
purport to allow geospatial analysts to<br />
combine layers of information, assuming<br />
those layers of information are accurately<br />
registered, and in a common format.<br />
However, the typical DOD analyst faces<br />
the burden of inferring and conveying the<br />
resultant precision and uncertainty of the<br />
combined datasets.<br />
During an informal discussion<br />
about data fusion, Jeff Jonas from IBM<br />
noted, “An organization can only be as<br />
smart as the sum of its perceptions. To<br />
improve, organizations need more data.<br />
16<br />
IMAGING NOTES // FALL 2011 // WWW.IMAGINGNOTES.COM
Capabilities like ISEBOX that increase<br />
observation space by introducing<br />
orthogonal data elements will lead to<br />
leap-ahead improvements.”<br />
Evolution of ISEBOX<br />
In designing and implementing<br />
ISEBOX, there were both technical and<br />
practical challenges. The team, under<br />
the direction of Abe Usher, faced the<br />
challenge of applying and adapting<br />
hashing algorithms (used in cryptography)<br />
to a wide variety of datasets. In<br />
addition, the sheer variety of sources,<br />
formats, and encodings, and the availability<br />
of socio-cultural data presented<br />
challenges in finding and ingesting<br />
relevant data at the desired levels of<br />
granularity.<br />
Operationally, the ISEBOX developers<br />
had to contend with overcoming<br />
perceptions created by the introduction<br />
of so much software for the military<br />
over the past ten years. Hundreds of<br />
software designs have asserted a unique<br />
ability to synthesize data into meaningful<br />
products and reports, yet fail to<br />
understand the requirements of the end<br />
consumers of their information.<br />
Developers have repeatedly claimed<br />
the capability of integrating and fusing<br />
geospatial data, with most falling far<br />
short of their promise to “make sense”<br />
of the data for the warfighter. This<br />
has led to many analysts and planners<br />
pushing back on the introduction of<br />
new software tools due to the time and<br />
effort required for training and integration<br />
of the applications into their often<br />
overburdened workflow.<br />
To overcome these preconceptions<br />
and prove the value of ISEBOX very<br />
quickly, the developers applied ISEBOX<br />
to a vignette on threat actor activity<br />
to demonstrate the technology could<br />
reveal new insights (even just using open<br />
source data). Leveraging this real-world<br />
example and ISEBOX, the developers<br />
replicated and distilled the same analysis<br />
of the area of interest in a period of<br />
hours, as opposed to weeks, and with<br />
a fraction of the resources needed with<br />
existing tools and datasets, to discover<br />
non-obvious information from open<br />
source socio-cultural data. The use of<br />
a concrete real-world example helped to<br />
prove to analysts, planners, and decision<br />
makers that using ISEBOX could help<br />
save both time and money while also<br />
exposing “weak signals” from a combination<br />
of socio-cultural data to identify<br />
specific regions of interest/concern.<br />
The Future of Open Source Socio-<br />
Cultural Information<br />
Initially developed by Mr. Usher<br />
specifically for use by the DOD,<br />
ISEBOX introduces a new and unique<br />
capability to the nation’s geospatial<br />
tradecraft by allowing historical and<br />
general data for geospatial regions to<br />
be integrated with more precise data to<br />
address operational requirements while<br />
minimizing the potential for overgeneralizing<br />
or creating a false sense<br />
of precision. This capability opens the<br />
door to fuse geospatial data with a<br />
much broader range of data types in<br />
supporting analysis – particularly open<br />
source datasets which may have varying<br />
temporal and/or geospatial granularity.<br />
It enables global scale analyses applying<br />
a breadth of sources including community-driven<br />
data collections that could<br />
not be otherwise integrated. ISEBOX<br />
enables the use of open source datasets<br />
to identify unique threat patterns<br />
that can provide purpose and direction<br />
to classified collections. ISEBOX also<br />
challenges current classified paradigms<br />
and the manner in which the classified<br />
sources collect and verify their analysis.<br />
The ISEBOX methodology can<br />
enhance the ability of planners and<br />
leaders in making choices about how<br />
and where to allocate resources for the<br />
future. It provides operational impact<br />
by enabling the incorporation of “near<br />
real-time” analytic overlays into plans<br />
and forecasting tools along with delivering<br />
an inherent ability to assess the<br />
uncertainty of the resultant analyses. It<br />
also holds promise as a way to combine<br />
disparate, weak signals from different<br />
sources of socio-cultural data and<br />
synthesize them to create a detailed<br />
operational picture.<br />
ISEBOX uses variable precision data<br />
encodings of location to facilitate<br />
non-obvious pattern detection and<br />
predictive analysis in the geospatial<br />
domain.<br />
ISEBOX has been nominated by<br />
the Office of the Secretary of Defense,<br />
the Office of Naval Research, and a<br />
DOD Combatant Command for the<br />
the USGIF Industry Award for the<br />
most innovative geospatial software to<br />
be developed in 2011 for DOD. In the<br />
award nomination, the government said<br />
that the mathematical concept and the<br />
team’s “understanding of the necessity<br />
to harvest open source data for illustrative<br />
demonstrations of real-world problems<br />
was the best we (they) had seen in<br />
the previous decade of attempts.”<br />
ISEBOX is currently being deployed<br />
by elements of a Combatant Command<br />
within the DOD, and it will also be<br />
on display at the HumanGeo booth in<br />
the New Member Forum (Booth 203)<br />
at the GEOINT 2011 Symposium in<br />
San Antonio in October. Mr. Usher<br />
will also speak at the GEOINT 2011<br />
Symposium on the Enabling Socio-<br />
Cultural Technologies Panel hosted by<br />
Jeff Jonas from IBM.<br />
IMAGING NOTES // FALL 2011 // WWW.IMAGINGNOTES.COM<br />
17
Image Courtesy of MDL<br />
using their Dynascan<br />
Registration open<br />
Denver, Colorado, USA<br />
DENVER USA<br />
January 23 – 25 2012<br />
Long established as the premier LIDAR event<br />
focused on airborne and bathymetric LIDAR, with<br />
a particular emphasis on mobile mapping systems.<br />
Organized by:<br />
Supported by:<br />
In partnership with:<br />
www.lidarmap.org<br />
Exhibitors include:<br />
18<br />
IMAGING NOTES // FALL 2011 // WWW.IMAGINGNOTES.COM
1 2<br />
Processing<br />
Point Clouds<br />
3D DATA UPDATE<br />
LIKE RASTER AND VECTOR DATA MANY YEARS AGO, 3D CLOUDS OF<br />
billions of LiDAR points — which can be colored and very realistic — are<br />
an exciting new data type. However, they pose many software challenges, and<br />
software vendors are working hard to develop new software to manage, process,<br />
visualize, and extract features from point clouds.<br />
The first challenge posed by LiDAR to computer software and hardware is the<br />
huge size of the files generated by ever more powerful scanners. Often, the limiting<br />
factor is the operating system. For example, the 32-bit operating system can handle<br />
only files of up to a few gigabytes, and most systems are not designed for such large<br />
datasets. Though software providers have made progress in how they handle the<br />
display of point clouds, experts agree that this remains a challenge.<br />
More recently, a new challenge emerged: managing the thousands of files of<br />
point cloud data generated by the explosion in the use of terrestrial LiDAR scanners,<br />
making these files available to users across an organization, and integrating them<br />
SS<br />
FIGURES 1 & 2. E3De creates<br />
<br />
photorealistic 3D representations of<br />
LiDAR data. Using E3De, power lines are<br />
automatically extracted from LiDAR data<br />
with one click. Power line data is then<br />
stored as an independent, portable dataset<br />
for further analysis in a GIS. Point clouds<br />
can not only be represented with RGB values<br />
provided in the raw LAS file, but accurate<br />
digital ortho-images are also derived with<br />
a single click. Using the results from E3De,<br />
it is easy to determine where future trouble<br />
spots will occur by locating the trees that<br />
grow directly under and adjacent to the<br />
power lines.<br />
BY MATTEO LUCCIO<br />
Writer, Portland, Ore.<br />
www.palebluedotllc.com<br />
<br />
EDITOR’S NOTE: This is a preview of the<br />
Winter issue, which will be distributed at<br />
the International Lidar Mapping Forum.<br />
Other lidar processing software and tools,<br />
including open source options, will be<br />
featured there.<br />
IMAGING NOTES // FALL 2011 // WWW.IMAGINGNOTES.COM<br />
19
across different workflows. The final two<br />
challenges are fusing LiDAR point clouds<br />
with data from other remote sensing<br />
devices and further automating measurements<br />
and feature extraction.<br />
Visualizing Lidar Data<br />
Software vendors have taken<br />
different approaches to enabling their<br />
software to visualize LiDAR data.<br />
People want to visualize LiDAR data<br />
as points and they want the ability to<br />
do it in 3D, says Brad Skelton, CTO of<br />
ERDAS. If you simply load all the points<br />
and display them, he explains, you<br />
quickly run out of memory. Enabling<br />
users to perform the tasks they want to<br />
perform with these very large datasets<br />
requires indexing the files and providing<br />
an efficient paging mechanism.<br />
“The conventional solution,” Skelton<br />
says, “is to tile LiDAR datasets into<br />
smaller pieces that will fit into memory<br />
of the company’s industry applications<br />
share the same technologies as MicroStation,<br />
most of the desktop products that<br />
came after MicroStation V8i (SELECTseries<br />
2), released last year, including<br />
Bentley Map, OpenPlant, and Bentley<br />
Architecture, are able to visualize point<br />
3<br />
capabilities for LiDAR, including native<br />
support for LAS,” says Crawford, referring<br />
to the industry standard format for<br />
LiDAR data. “This means LiDAR data<br />
can be managed, viewed, updated, and<br />
shared, all while remaining in its native<br />
format. We’ll be introducing a new data<br />
“We have many tools to make 3D<br />
measurements from imagery that can<br />
be applied to make 3D measurements<br />
from point cloud data,” says Zhang of<br />
BAE Systems<br />
SS<br />
FIGURE 3. ERDAS APOLLO Web Client<br />
displaying LiDAR and imagery data from<br />
the Swiss municipality Romanshorn. The<br />
LiDAR data was collected by a Leica ALS50<br />
along with color imagery from a Leica<br />
ADS40. Other delivery options of data are by<br />
<strong>download</strong> or delivery via web services into<br />
other web client applications. Courtesy of<br />
ERDAS.<br />
and perform your processing in a piecewise<br />
manner. We are trying not to<br />
do piece-wise processing, but instead<br />
provide the user with a single, large<br />
dataset and continuous experience and<br />
still have everything be as fast as it is with<br />
the entire dataset in memory at once.”<br />
The company’s competitive advantage,<br />
he argues, is going to be its ability to deal<br />
with a large dataset, as well as offering<br />
both a server product and a suite of<br />
desktop products that can deal with<br />
LiDAR data. Next year, it will release a<br />
new version of its software that will fully<br />
support LiDAR as a data type.<br />
Bentley began by embedding point<br />
cloud management capability into Micro-<br />
Station, its CAD 3D editing platform, and<br />
ProjectWise Navigator, its tool for collaboration<br />
and design review. Because most<br />
clouds. “We bring point clouds inside our<br />
engineering tools, whether it is generated<br />
by aerial LiDAR or by static or mobile<br />
terrestrial scanners,” says Benoit Fredericque,<br />
a product manager for Bentley.<br />
“For us, it is all about our capability to<br />
handle huge point clouds properly.”<br />
Esri’s ArcGIS desktop and server applications,<br />
all of which share the same underlying<br />
technology, can ingest, process, and<br />
display LiDAR data. The trick, explains<br />
Clayton Crawford, one of the company’s<br />
product engineers, is coming up with an<br />
efficient I/O stream for moving that data<br />
around and accessing it efficiently. “For<br />
some applications, working on thinned<br />
data is OK, while other applications<br />
require full-resolution processing.”<br />
“Our next release, ArcGIS 10.1,<br />
which is already in beta, adds significant<br />
type called a LAS dataset that makes it<br />
easy to access your data quickly. You<br />
just tell it what LAS files belong to a<br />
project and it manages the collection as<br />
one dataset for you.”<br />
“Our Mosaic dataset, which is used<br />
to manage and share imagery,” he adds,<br />
“is being enhanced to read LAS directly.<br />
It will perform fast, on-demand rasterization<br />
of LAS points and can handle many<br />
LAS files from multiple projects. Through<br />
its support of image and elevation services,<br />
the Mosaic dataset can also be used to<br />
publish LiDAR either in source LAS form<br />
or as derivative rasters. It provides a very<br />
effective means of managing large collections<br />
of LiDAR in a way that’s similar to<br />
managing lots of imagery.”<br />
ITT VIS’ flagship image processing<br />
and analysis software product, ENVI,<br />
20<br />
IMAGING NOTES // FALL 2011 // WWW.IMAGINGNOTES.COM
can extract elevation and intensity<br />
values from LiDAR point clouds. IDL,<br />
which is an extensible platform for<br />
ENVI and a programming language,<br />
gives users API access to LiDAR point<br />
cloud data and also has a broad range<br />
of tools to visualize LiDAR data and<br />
process it volumetrically. The company’s<br />
latest product, E3De, scheduled<br />
for release October 14, is completely<br />
specialized for LiDAR data. ITT VIS is<br />
initially releasing it as a full stand-alone<br />
application, but it will ultimately also<br />
serve, optionally, as a module to ENVI,<br />
says Peter McIntosh, the company’s<br />
Manager of Industry Solutions.<br />
from LiDAR, the surface properties that<br />
you get from SAR (synthetic aperture<br />
radar), and the material properties that<br />
you get from optical and hyperspectral.<br />
That overall data fusion is the target and<br />
the goal for the future. Looking forward,<br />
I see the holistic integration of all of the<br />
4<br />
5<br />
SS<br />
FIGURE 4. Visualize<br />
point clouds across or<br />
along track profile view<br />
using IMAGINE Point Cloud<br />
Tool. Courtesy of ERDAS.<br />
WW<br />
FIGURE 5. New Building<br />
Detection using IMAGINE<br />
Objective with multidate<br />
LiDAR data to<br />
show the detection of<br />
new building activity to<br />
determine legality and<br />
tax status. The LiDAR is<br />
shown as a sun-angle<br />
shaded representation<br />
at two dates and the<br />
IMAGINE Objective results<br />
are shown as a vector<br />
overlay on the raw height<br />
data. Courtesy of ERDAS.<br />
Managing Lidar Data<br />
Bentley is now working on the<br />
management of the point cloud on the<br />
server side, for which it plans to use<br />
Bentley ProjectWise. Meanwhile, on the<br />
desktop, it is adding advanced capabilities<br />
related to point clouds inside Bentley<br />
Descartes, which has been used for more<br />
than a decade as a raster editing product<br />
that enhances MicroStation workflows.<br />
“We are also developing applications<br />
to make point cloud data available<br />
on iPads and on the Web,” says Fredericque.<br />
Bentley plans to release in early<br />
2012 ProjectWise V8i (SELECTseries 4),<br />
which will provide new capabilities for<br />
managing point cloud data.<br />
One of the first ERDAS products<br />
to deal with LiDAR data was ERDAS<br />
APOLLO, which is the company’s<br />
enterprise data manager. “A couple of<br />
years ago,” says Skelton, “we added to<br />
ERDAS APOLLO the ability to catalog<br />
and manage LiDAR datasets, so that<br />
it can discover your LiDAR datasets,<br />
extract various pieces of geospatial<br />
metadata from them, put them in<br />
the catalog, and give you a means of<br />
executing spatial and attribute queries<br />
to find the datasets that are pertinent to<br />
the areas on which you are working.”<br />
Fusing Data From Lidar and Other<br />
Sensors<br />
“We are focusing our energies on<br />
integrating LiDAR data with the other<br />
modalities,” says McIntosh, “to create a<br />
holistic and integrated dataset that tells<br />
us the volumetric properties that you get<br />
modalities into a unified resource as the<br />
biggest challenge with LiDAR.”<br />
ITT VIS has worked in the past<br />
several years to integrate ENVI with<br />
the Esri product line, making image<br />
analysis tools available directly from<br />
the Arc environment. The road map for<br />
E3De, McIntosh says, will include the<br />
integration for the GIS user as well. “As<br />
with ENVI, it will also have full API<br />
programmatic access and extensibility.”<br />
BAE Systems is planning to add to<br />
future releases of its SOCET GXP the<br />
IMAGING NOTES // FALL 2011 // WWW.IMAGINGNOTES.COM<br />
21
SS<br />
FIGURE 6. Terrestrial point cloud in Phoenix - visualize<br />
airborne or terrestrial point clouds in 3D. Courtesy of<br />
ERDAS.<br />
capability to register multiple strips of<br />
LIDAR data with each other and LIDAR<br />
data with imagery. It is also working to<br />
fuse imagery and terrestrial LIDAR data<br />
— which, points out Dr. Bingcai Zhang,<br />
an Engineering Fellow with BAE Systems,<br />
are now denser, less expensive, and more<br />
abundant than a few years ago due to<br />
advances in ground sensor hardware.<br />
Not surprisingly, Esri is focusing on<br />
integrating LiDAR data into GIS, so that<br />
it is not being processed in a specialized<br />
application but rather in a more general<br />
purpose, one for dealing with all kinds<br />
of geospatial data. “So we have the integration<br />
of the processing, analysis, and<br />
display of LiDAR data along with other<br />
geospatial data and that brings a lot of<br />
power to the end user,” says Crawford.<br />
Automatic Feature Extraction<br />
To enable users to get the most<br />
out of LiDAR data, software must be<br />
able to extract geometries, features,<br />
and measurements automatically. For<br />
example, it must recognize such 3D<br />
objects as houses, trees, and, if the point<br />
cloud is sufficiently dense, cars. This is<br />
especially valuable for certain industries,<br />
such as transportation and building.<br />
“We have seen very interesting progress<br />
in this automation with aerial LiDAR,<br />
but in other areas of the infrastructure<br />
world, the level of automation is pretty<br />
low,” comments Fredericque.<br />
SOCET GXP v4.0, which BAE Systems<br />
plans to release in early 2012, will include<br />
automatic feature extraction. To increase<br />
efficiency and reduce manual entry for<br />
end users, the underlying algorithm will<br />
automatically compute the dimensional<br />
attributes of a 3D object, for about 20<br />
attributes. This capability builds on the<br />
company’s 16 years of experience in developing<br />
photogrammetric algorithms for<br />
SOCET SET and SOCET GXP. “We have<br />
many tools to make 3D measurements<br />
from imagery that can be applied to make<br />
3D measurements from point cloud data,”<br />
says Zhang. “That is our legacy and our<br />
competitive advantage.”<br />
6<br />
ITT VIS is also adding<br />
tools that automatically extract<br />
information from files of<br />
various data types. “We already<br />
provide tools for the automatic<br />
extraction of building footprints,<br />
trees, power lines, etc.,”<br />
says McIntosh. “We are going<br />
to see more and more automated<br />
tools that span across<br />
industries. So, for example,<br />
someone in agriculture will<br />
say, ‘I want to see crop height<br />
for my corn in July,’ and it is<br />
going to be much more pointand-click,<br />
decision-ready information<br />
out of these. We are going to see<br />
that in forestry, urban planning, etc. —<br />
more and more advanced processing.<br />
LiDAR brings a whole 3D element into<br />
the remote sensing picture, where we<br />
can use things like hill shades — slope,<br />
aspect, elevation. It just gives us yet<br />
another element to discriminate and<br />
identify specific features or information<br />
that people want.”<br />
LPS, ERDAS’ photogrammetry software,<br />
has a very high resolution terrain<br />
extraction component, eATE, which<br />
does optical stereo point extraction. It<br />
allows users to extract point cloud data<br />
at LiDAR densities and output the data<br />
as LAS files. Therefore, Skelton points<br />
out, in addition to ingesting, processing,<br />
and displaying LiDAR data, LPS can also<br />
produce LiDAR-like data.<br />
Beyond Automatic Feature<br />
Extraction<br />
Many people think of a point cloud<br />
only as a kind of intermediate form of<br />
data from which to generate geometry.<br />
While this is a good application area,<br />
Fredericque argues, a point cloud is<br />
also very valuable when used ‘as is.’<br />
“For example,” he says, “you can use<br />
it as a kind of 3D base map or, in some<br />
contexts, as a 3D model. An industrial<br />
plant might not have a 3D model; it<br />
might just want to replace a piece of<br />
equipment. If you consider point clouds<br />
only as an intermediate data type, the<br />
extraction of all the features becomes<br />
a mandatory and demanding process.<br />
Another way to address that challenge<br />
is to use the point cloud ‘as is,’ as a<br />
background 3D model, and use tools<br />
to remove the points that correspond to<br />
the piece of equipment that you plan to<br />
remove. This way, you can manipulate<br />
the point cloud. You can isolate a piece<br />
of equipment and replace it with a new<br />
one. That kind of workflow and usage<br />
is not frequently mentioned or investigated,<br />
but I believe it makes a lot of<br />
sense.”<br />
Clouds of billions of LiDAR points —<br />
often colored and very realistic — bring a<br />
new 3D element into the remote sensing<br />
picture and require new software tools.<br />
Software vendors, already challenged<br />
by the huge size of the point cloud files<br />
created by ever more powerful scanners,<br />
are developing new ways to manage the<br />
thousands of files generated by the explosion<br />
in the use of terrestrial LiDAR scanners,<br />
to make them available to users<br />
across an organization, and to integrate<br />
them into different workflows. They are<br />
also embedding point clouds into engineering<br />
tools and GIS and developing<br />
new ways to automate the extraction of<br />
geometries, features, and measurements.<br />
The ultimate goal is to fuse volumetric<br />
properties derived from LiDAR data,<br />
surface properties derived from radar,<br />
and material properties derived from<br />
optical and hyperspectral data to create<br />
a single, integrated dataset.<br />
22<br />
IMAGING NOTES // FALL 2011 // WWW.IMAGINGNOTES.COM
1-Scan<br />
-High Density Scanning<br />
-Long Range LiDAR Sensor<br />
-360° Digital Image Capture<br />
2-Extract<br />
-Easy automated workflow<br />
-Powerful 3D Visualization<br />
-On Screen 3D Measurement<br />
3-Deliver<br />
-Simple Data Export to CAD/GIS<br />
-One-Source Turnkey Solution<br />
-Increase Productivity,<br />
Reduce Costs<br />
IP-S2<br />
HD<br />
IMAGING NOTES // FALL 2011 // WWW.IMAGINGNOTES.COM<br />
High Density Scanning<br />
23<br />
topconpositioning.com/ips2-hd<br />
For more information, email: mobilemapping@topcon.com
We Get the Point...<br />
24<br />
IMAGING NOTES // FALL 2011 // WWW.IMAGINGNOTES.COM
In Fact, We Get Billions.<br />
Modern laser scanning systems are capable<br />
of creating dense clouds of X, Y and Z<br />
points with associated measurements about<br />
the characteristics of the feature at these<br />
points. LiDAR can be used to map a variety<br />
of features including the ground surface,<br />
vegetation cover, buildings and more.<br />
ERDAS can easily handle your LiDAR data,<br />
enabling you to do more with this valuable<br />
investment, including:<br />
• Performing change detection between<br />
LiDAR data<br />
• Using distributed processing to generate<br />
dense point clouds<br />
• Discovering and serving large volumes<br />
of LiDAR data<br />
Find out what you can do with LiDAR in<br />
ERDAS IMAGINE, LPS and ERDAS APOLLO on<br />
www.erdas.com/lidar. To learn more about<br />
other LiDAR offerings within the Hexagon<br />
family of companies, please also visit the<br />
Leica Geosystems and Intergraph ® websites.<br />
IMAGING NOTES // FALL 2011 // WWW.IMAGINGNOTES.COM<br />
25
23 - 26 January 2012<br />
QEII Conference Centre, London<br />
BRINGING TOGETHER THE<br />
WORLWIDE GEO COMMUNITY<br />
Geospatial Insight for Defence<br />
& Intelligence<br />
Register<br />
Before 2nd<br />
September to save<br />
up to £1,000<br />
KEY FOCUS AREAS FOR 2012<br />
MAPS TO APPS - Focused on delivering online on demand and on time data, information and analysis to each user intheatre<br />
and in HQ.<br />
GIS ARCHITECTURE & MISSION MANAGEMENT - Focus on the challenges GIS professionals have when designing and<br />
modifying their systems and discussing the practical realities of providing information and managing data on a day-to-day<br />
basis.<br />
INTELLIGENCE EXPANSION - Focusing on the current GIS strategies and operational successes in preparation for the<br />
Olympic Games in London, London Transport GIS, anti-terrorism work around the major worldwide cities, use of imagery<br />
and data in border control and crime prevention and many others.<br />
OPERATIONAL FOCUS - DGI is moving away from theory into practical operational case studies, that will focus on current<br />
and latest GIS strategies from war theatres around the globe.<br />
HUMAN GEOGRAPHY - Using not only military force, but intelligence about the local people has proven to be one of the most<br />
effective new strategies in Afghanistan, Lybia and many other in-theatre operations.<br />
GIS IN C4ISR - For the fi rst time ever DGI is aiming to cover the GIS strategies and tools used within C4ISR - The big<br />
strategic capabilities based on GIS or involving GIS.<br />
650<br />
400<br />
42<br />
NATIONS IN<br />
SPONSORS &<br />
HOURS OF<br />
ATTENDEES ORGANISATIONS UNIQUE EVENT<br />
ATTENDANCE<br />
EXHIBITORS<br />
NETWORKING<br />
Col. John Kedar, Chief of Staff<br />
Headquarters Engineer in Chief (Army),<br />
UK MOD<br />
Michael W. Powers, Technical Director<br />
Geospatial Research and Engineering,<br />
US Army<br />
Col Pat Fryer, Section Head Geospatial<br />
Policy & Operations, SHAPE, NATO<br />
Lt. Col. Neil Marks, National Expert,<br />
Council of the European Union<br />
Col. Mark Burrows, Commander, JAGO,<br />
UK MOD<br />
Captain Kjetil Utne, Director, Military<br />
Geographic Service, Norwegian MOD<br />
Created by the community for the community<br />
45<br />
The DGI 2012 Advisory Board & Speakers Already Include:<br />
Vanessa Lawrence, CB Director General<br />
and Chief Executive, Ordnance Survey<br />
Eliza Manningham-Buller, Former Head,<br />
MI5<br />
John Teufert, NC3A Geo-Offi cer, NATO<br />
C3 Agency<br />
Marlene Meyer, Head of Defence,<br />
Geospatial Organisation, Denmark<br />
Col. Babis Paraschou, Chief Geospatial<br />
Offi cer, NATO Deployment Corps,<br />
Greece<br />
Steve Pyatt, Director, GEOINT Policy and<br />
Plans, New Zealand MoD<br />
Susanne Yoakum-Stover, Executive<br />
Director, Institute For Modern<br />
Intelligence<br />
Brig Jim Hockenhull, D ISTAR,<br />
UK MOD<br />
Steven Ramage Executive Director,<br />
Marketing and Communications, Open<br />
Geospatial Consortium (OGC)<br />
Kenneth Pugh, Head of Geo, Navy, MOD<br />
Chile<br />
Frank Colley, Ast. Secretary Defence<br />
GEOINT, Defence Imagery & Geospatial<br />
Organisation (DIGO), Aust. DoD<br />
36<br />
ONE<br />
Ric Diaz, GEOINT Team Leader,<br />
Intelligence Fusion Centre, RAF<br />
Molesworth, UK MOD<br />
Andy Marles, Chief Fire Offi cer, South<br />
Wales Fire & Rescue<br />
Vice Admiral Robert B. Murrett, Dept.<br />
Director, Institute for National<br />
Security and Counterterrorism<br />
(INSCT)<br />
Leendert Bal, Director, European<br />
Maritime Safety Agency<br />
Brig. General (ret) Amnon Sofrin, Head<br />
of The Intelligence Directorate Israeli<br />
Intelligence Service (ISIS)<br />
Principal Sponsor: Associate Sponsor: Premium Sponsor: Sponsors:<br />
26<br />
IMAGING NOTES // FALL 2011 // WWW.IMAGINGNOTES.COM<br />
CONTACT US for your own copy of the latest agenda, to stay up to date with the latest<br />
developments and find out about current preferential rates:<br />
+44 (0) 207 368 9465 dgi@wbr.co.uk www.dgieurope.com
1<br />
APPLICATIONS ABOUND IN DEFENSE, MARITIME AND ENGINEERING<br />
WHETHER USED TO VIEW EARTH’S SURFACE THROUGH CLOUDS OR AT NIGHT, TO MEASURE THE<br />
thickness of polar ice sheets, to map long-abandoned mines, or to monitor<br />
subsidence, synthetic aperture radar (SAR) imaging has become a standard<br />
remote sensing tool. While optical satellites have higher resolution, radar imagery<br />
is better for change detection. Governments and private companies can use SAR<br />
satellites to monitor wide swaths of land or water from relatively low orbits, then<br />
<br />
BY MATTEO LUCCIO<br />
Writer, Portland, Ore.<br />
www.palebluedotllc.com<br />
<br />
EDITOR’S NOTE: The Korea Aerospace<br />
Research Institute and Fugro declined to<br />
be interviewed for this article.<br />
SS<br />
FIGURE 1. Change Detection Image at Port in<br />
Rotterdam, The Netherlands - False color SAR<br />
image with 1-m resolution (Spotlight-2 mode)<br />
was obtained by combining three observations<br />
carried out by different satellites of the COSMO-<br />
SkyMed constellation, with red: COSMO 2 on<br />
29/06/2011; green: COSMO 3 on 30/06/2011; blue:<br />
COSMO 1 on 07/07/2011. All unchanged features<br />
are in black-grey-white color according to their<br />
brightness. Colorful features show changes<br />
along the time span (9 days) of the observation<br />
with ships and boats changing their positions.<br />
Faint color variations reveal changes of the<br />
content in the fuel tanks in the lower part of the<br />
image. Image courtesy of e-Geos.<br />
IMAGING NOTES // FALL 2011 // WWW.IMAGINGNOTES.COM<br />
27
follow up with higher resolution systems<br />
to zoom in on, say, an unidentified<br />
ship approaching a shore. Capacity<br />
continues to grow, as new satellites are<br />
launched. The two biggest challenges<br />
now for this segment of the geospatial<br />
industry are to develop software tuned<br />
to the requirements of specific users<br />
and to train them in using the data.<br />
Status and Trends<br />
Radar is a growing market. “From a<br />
mostly defense and maritime business,”<br />
says Andreas Kern, Director of Business<br />
Division at the Canadian firm<br />
MacDonald Dettwiler and Associates<br />
Ltd. (MDA) — the commercial provider<br />
of RADARSAT-1 data and operator<br />
of RADARSAT-2, a SAR imaging<br />
satellite that was financed primarily<br />
by the Canadian government — has<br />
seen his company’s business increase<br />
significantly in the past 18 months. For<br />
example, he says, Canadian government<br />
agencies have dramatically increased<br />
utilization for maritime monitoring and<br />
surveillance making it a core tool for<br />
fulfilling their operational mandates.<br />
“With regards to change detection,”<br />
Hornsby says, “clients need the tools<br />
to better utilize radar data, and we are<br />
developing them. It has been a challenge<br />
to develop exploitation systems,<br />
because they have to be very tuned to<br />
the requirements of specific users. For<br />
One indicator of the growing recognition<br />
and acceptance of radar imaging<br />
is that the National Geospatial-Intelligence<br />
Agency (NGA) has put in place<br />
contracts with major SAR providers,<br />
as it had previously done with optical<br />
data providers, so as to have a mechanism<br />
to routinely access SAR data.<br />
This is one reason Hornsby expects<br />
to see an increase in utilization. “We<br />
are collaborating with our Italian and<br />
German colleagues to build the utilization<br />
market,” he says. No commercial<br />
U.S. radar system exists currently.<br />
Jack Hild, Vice President for U.S.<br />
Defense Strategy at DigitalGlobe, spent<br />
30 years at the NGA, where he was<br />
continually in charge of operations<br />
in which analysts used radar. While<br />
acknowledging that commercial radar<br />
technology is very good, he says that he<br />
2<br />
SS<br />
FIGURE 2. MDA’s services for the<br />
mining industry identify unstable<br />
areas for repositioning of equipment<br />
or infrastructure to minimize potential<br />
damage and avoid injury. It is also used as<br />
a validation mechanism before costly realtime<br />
monitoring systems are implemented.<br />
This image shows wall integrity, courtesy of<br />
MDA Geospatial Services, Inc., 2010.<br />
3<br />
SS<br />
FIGURE 3. New RADARSAT-2 imaging modes with wider swaths enable broad-area DEMs to<br />
be created using fewer images, reducing the time and cost of production. Courtesy of MDA<br />
Geospatial Services, Inc., 2010.<br />
Development and Sales for the European<br />
company Astrium GEO-Information<br />
Services, which owns TerraSAR-X,<br />
“it has grown 20-25 percent per year<br />
over the last three years, and the variety<br />
of user requests keeps expanding.”<br />
John Hornsby, VP of Geospatial<br />
Strategy of the Geospatial Services<br />
example, agricultural users need to<br />
fully utilize the polarmetric capability<br />
of the imagery, which is complex to<br />
do – to identify particular crop types.<br />
Defense users, on the other hand, are<br />
looking more at changes over time and<br />
require different techniques to fully<br />
exploit the imagery.”<br />
would be surprised to hear that someone<br />
had come up with a striking new use for<br />
radar imaging recently. “I visited all<br />
the major providers within the past few<br />
months and did not see anything new,”<br />
he says. While radar is “a great supplement”<br />
to electro-optical (EO) Earth<br />
observation, he points out, it will not<br />
28<br />
IMAGING NOTES // FALL 2011 // WWW.IMAGINGNOTES.COM
eplace it. “Radar and EO will continue<br />
to grow globally, but I don’t see doubledigit<br />
growth. I do see evolutionary<br />
growth, as more nations see the value of<br />
remote sensing for security and resource<br />
management requirements.”<br />
Neither DigitalGlobe nor GeoEye<br />
have any radar capabilities on current<br />
satellites. “We are looking for a way to<br />
establish partnerships with providers<br />
of radar data,” says Hild. “Depending<br />
on the end use and the customer, we<br />
may want to do the analysis ourselves,<br />
and sometimes we would rely on our<br />
partners for some of the advanced<br />
processing.”<br />
4<br />
Markets and Applications<br />
Sales of radar data are still mostly<br />
business-to-government (B2G) and<br />
business-to-business (B2B); however,<br />
consumer applications are the next<br />
most logical area for growth. “The path<br />
for consumer applications is going to be<br />
longer,” says Kern, “and will require<br />
using multi-source data fusion to create<br />
derived products and solutions.”<br />
Meanwhile, the range of applications<br />
for radar imaging is rapidly expanding.<br />
“I’ve seen some great work in using<br />
radar to monitor subsidence, in conjunction<br />
with autonomous ground sensors,”<br />
says Hild. “It’s also been useful for<br />
monitoring ice movements in maritime<br />
shipping channels and always has a role<br />
to play in weather-related natural disasters,<br />
such as Hurricane Irene.”<br />
Radar is essential to meet imagery<br />
requirements in countries in persistently<br />
cloudy areas, he points out.<br />
“Clouds happen and you can’t always<br />
get the picture that you are hoping to<br />
get with EO data, but customers more<br />
and more have an expectation that<br />
they can get imagery at any time. For<br />
example, for monitoring ships, they<br />
want a guarantee that they will always<br />
be able to report whether or not a ship<br />
is still docked at port.”<br />
One of the most important applications<br />
for radar is maritime surveillance<br />
— called maritime domain awareness<br />
SS<br />
FIGURE 4. Icebergs breaking away from the Antarctic Peninsula on four different dates.<br />
Courtesy of MDA Geospatial Services, Inc., 2010.<br />
in the United States — which involves<br />
monitoring ship traffic over very large<br />
areas. The Canadian Department of<br />
National Defence (DND) has recently<br />
brought into operation two new<br />
stations, on Canada’s east and west<br />
coasts, using radar to produce ship<br />
detection within minutes.<br />
Hornsby points out, “Building on<br />
the strength of the RADARSAT system<br />
for maritime monitoring, we are also<br />
improving ship detection capability<br />
with new operating modes. In this case,<br />
new modes have been created which are<br />
more effective in identifying vessels.<br />
The trade-off is a reduction in appearance<br />
of the overall image but for this<br />
application, that is not important. The<br />
key is getting the ship information.”<br />
Real operational users such as DND<br />
are embracing the capabilities of satellite<br />
radar imaging as performance has<br />
improved to meet their specific needs.<br />
The key concept is the transition<br />
from application to operational service,<br />
argues Luca Pietranera, Head of<br />
COSMO Product Innovation and Technical<br />
Support for the Italian company<br />
e-GEOS S.p.A., the commercial<br />
provider of COSMO-SkyMed constellation<br />
data. This transition means<br />
providing the data in near real-time<br />
to a user, such as a coast guard. “We<br />
can provide a fully integrated system.<br />
Within minutes of when a receiving<br />
station receives an image from a satel-<br />
IMAGING NOTES // FALL 2011 // WWW.IMAGINGNOTES.COM<br />
29
lite, we can process it and integrate<br />
it into the information system of the<br />
end user. We can do this because we<br />
have a fully integrated system, and the<br />
frequent revisit provided by our constellation<br />
is a key factor for the success of<br />
the service.”<br />
SS<br />
FIGURE 5. Gawar, Saudi Arabia Center Pivot Cultivation - The multi-temporal image (in false<br />
colors) shows center pivot cultivation in the Arabian desert. The three Stripmap mode images<br />
(3-m spatial resolution) were collected by different COSMO-SkyMed satellites over one week.<br />
Circular cultivated areas show bright colors indicating changes occurring in both terrain and<br />
vegetation due to agricultural activity (irrigation, plant growth, ploughing . . . ). Image courtesy<br />
of e-GEOS.<br />
Many of these applications are made<br />
possible by the use of interferometric<br />
SAR (InSAR) and interferometry, the<br />
discipline that studies the phase of the<br />
SAR signal and its variations. “The phase<br />
signal can be regarded as an accurate<br />
measurement of the distance between<br />
the satellite and the target,” explains<br />
Pietranera, who develops new fields of<br />
application for radar data, mostly by<br />
exploiting change detection. “When you<br />
compare two images looking just at the<br />
backscatter data, you can see changes in<br />
objects that are one meter wide or bigger<br />
(i.e. wider than the pixel size). However,<br />
if you analyze changes in the phase signal<br />
— the first step is coherence analysis —<br />
you can see whether a change occurred in<br />
objects that are the size of the wavelength<br />
(a few centimeters).”<br />
He continued, “Due to the sensitivity<br />
of imaging radar to artificial structures<br />
and 3D structures with corners, change<br />
detection monitoring can be ‘focused’<br />
on those structures, as illustrated by<br />
the image of the port in Rotterdam,<br />
The Netherlands. The observations can<br />
be repeated very frequently in time and,<br />
on top of this, radar wavelengths are<br />
not affected by changes in observing<br />
conditions (such as atmospheric transmission,<br />
presence of haze, which can<br />
cause ‘spurious effects’ when analyzing<br />
5<br />
change detection in optical imaging).”<br />
“Interferometric processing techniques,<br />
especially when coupled with<br />
COSMO-SkyMed’s high spatial resolution<br />
and frequent revisits,” Pietranera<br />
says, “can provide significant information<br />
for defense and security applications<br />
(by detecting disturbances<br />
created by human activity, such as<br />
the action of wheels on bare terrain),<br />
but also to monitor long term land<br />
stability (subsidence, landslides, or<br />
earthquakes), or even to provide<br />
control on agricultural activities.”<br />
InSAR is particularly useful in<br />
the oil and gas industry (to monitor<br />
oil fields), in civil construction (to<br />
detect potential sinkholes), and in<br />
mining (to monitor subsidence).<br />
Regarding the latter, in the eastern<br />
United States, active mines are being<br />
monitored, and forgotten mines are<br />
being detected using GPS.<br />
Astrium’s most important<br />
vertical markets are defense and the<br />
oil and gas industry. In the past year,<br />
the company has begun to address<br />
the requirements of civil engineers,<br />
for example, by using vertical<br />
measurements to help operators<br />
secure airport safety, and to help<br />
large construction projects monitor<br />
subsidence. It has also developed<br />
methods for collecting from space new<br />
ground control points (GCPs), which<br />
are needed, for example, to orthorectify<br />
satellite imagery. “Thanks to the<br />
extraordinary accuracy of TerraSAR-<br />
X,” says Kern, “we can generate GCPs<br />
by collecting on specific points and then<br />
triangulating with better than 1-meter<br />
XYZ. This is especially cost-effective<br />
when it is too expensive or dangerous to<br />
put people on the ground. Thus, radar<br />
complements terrestrial differential<br />
GPS, though it will not replace it.”<br />
Astrium’s data is often used for<br />
emergency support, Kern points out. For<br />
example, the flood-mapping program<br />
it developed with Trimble, which automatically<br />
derives flood masks and<br />
compares pre- and post-flood data, is<br />
30<br />
IMAGING NOTES // FALL 2011 // WWW.IMAGINGNOTES.COM
used by emergency response authorities,<br />
currently especially in Asia and South<br />
America, but also for insurance claims.<br />
Another key application of radar<br />
data, Pietranera points out, is monitoring<br />
the polar regions — especially<br />
the North Pole, which is becoming more<br />
important strategically, creating a big<br />
demand for monitoring. As ice melts,<br />
new shipping routes are becoming<br />
available. The most famous is the<br />
Northwest Passage through Canada’s<br />
polar islands. “These routes are very<br />
long and very extended in longitude,”<br />
he says. “Therefore, it requires a lot of<br />
satellite capacity to monitor them and<br />
to provide safety information to shipping<br />
companies, to national authorities,<br />
and to vessels going along the route.”<br />
and explain to image analysts what<br />
they are seeing in the radar images and<br />
what the key differences are. It is a new<br />
teaching and learning tool.”<br />
One reason that his company’s radar<br />
images are more difficult to interpret<br />
than those produced by optical satellites,<br />
Kern explains, is that they are typically<br />
in black and white. To help overcome<br />
this problem, Astrium has developed<br />
methodologies to provide color radar<br />
imagery, not only as multi-temporal<br />
imagery but now even with a single<br />
data take at full resolution. “As we do<br />
not need to use polarizations either, we<br />
achieve a top-quality resolution, then<br />
we translate speckle into color coding,<br />
thereby customizing the radar data to<br />
the appearance of the optical image to<br />
be overlaid. Color SAR has good poten-<br />
Helping End Users Interpret<br />
Radar Data<br />
Radar is becoming mainstream<br />
in several communities, such as intelligence,<br />
the military, and agriculture.<br />
However, according to Pietranera, the<br />
organizations that consume the data<br />
have many people who are trained to<br />
interpret optical data, which is simpler<br />
to do, but not enough people trained to<br />
interpret radar data. When it comes to<br />
the latter, “advanced processing tasks<br />
are almost always handed off to specialists,<br />
such as image scientists,” says Hild.<br />
To bring their current and potential<br />
customers up to speed, MDA, e-GEOS,<br />
and Astrium in May formed a Commercial<br />
Synthetic Aperture Radar Satellite<br />
Working Group (CSARS WG), under<br />
the aegis of the United States Geospatial<br />
Intelligence Foundation (USGIF).<br />
They are now producing manuals,<br />
workshops, and exercises to explain the<br />
capabilities and advantages of spacebased<br />
SAR, as well as to provide handson<br />
learning and training for users.<br />
“We have recently released an image<br />
intelligence manual named TIM — the<br />
TerraSAR-X IMINT Manual,” says<br />
Kern. “It compares the TerraSAR high<br />
resolution radar imagery to WorldView<br />
high resolution optical imagery to show<br />
6<br />
SS<br />
FIGURE 6. Disturbed Terrain Around Qom Plant, Iran - COSMO-SkyMed 1-meter resolution image<br />
(Spotlight-2 mode) over the nuclear facility of Qom in Iranian desert. The black and white<br />
background image highlights bright industrial structures and buildings. Dark linear features<br />
represent dirt roads and track network around the plant. When the acquisition is repeated<br />
after a short time, the coherence of the phase signals between the two images provides<br />
additional information about the scene. Red tracks are derived from coherence calculated over<br />
a time span of eight days. They show where the stable desert terrain was “disturbed” by the<br />
passage of vehicles (both on and off-road) and even animals (randomly distributed tracks on<br />
the upper right). This image also appears on the front cover, and is courtesy of e-GEOS.<br />
IMAGING NOTES // FALL 2011 // WWW.IMAGINGNOTES.COM<br />
31
18th William T. Pecora Memorial Remote Sensing Symposium<br />
www.asprs.org/Pecora18<br />
November 14–17, 2011<br />
Hilton Washington Dulles Hotel<br />
Herndon, Virginia<br />
ASPRS Conferences<br />
from Coast to Coast<br />
ASPRS ANNuAl CoNfeReNCe<br />
March 19–23, 2012<br />
32<br />
Sacramento Convention Center<br />
Sacramento, California<br />
www.asprs.org/Annual-Conferences/Sacramento-2012<br />
IMAGING NOTES // FALL 2011 // WWW.IMAGINGNOTES.COM
tial, especially in cloudy areas. You<br />
merge whatever optical data is available<br />
— which is always best for thematic<br />
mapping — with the radar data, and<br />
produce colorized thematic layers.”<br />
Software Development<br />
Techniques to process radar data<br />
developments,” says Kern. “Some of<br />
these products are based on off-the-shelf<br />
software, such as Gamma or Sarscape,<br />
which we adapted to use for our change<br />
detection and surface motion monitoring<br />
services. Sometimes we work<br />
with partners, such as Trimble, with<br />
whom we developed the Flood Mapper,<br />
New Satellite Launches<br />
Astrium recently launched its<br />
second satellite, TanDEM-X, which is<br />
now flying in formation and collecting<br />
global elevation models. The TanDEM-<br />
X mission is currently collecting data<br />
for a global homogeneous elevation<br />
model of an unprecedented quality,<br />
7<br />
8<br />
FIGURE 7. TanDEM-X Digital Elevation Model of Volcano Tunupa and the<br />
edges of the salt lake Salar de Uyuni in Bolivia. The blue and dark blue<br />
colors mark the salt pan as the area with the lowest elevation level.<br />
Courtesy of DLR.<br />
SS<br />
FIGURE 8. TerraSAR-X-based Surface Movement Monitoring<br />
of oil production-related surface displacement phenomena in<br />
Burghan oilfield in Kuwait, demonstrating significant subsidence of<br />
approximately 10mm/year in the main production center visualized by<br />
the orange color scale in the graphic. 16 TerraSAR-X StripMap scenes<br />
at 3-m ground resolution were selected from an available data stack<br />
over the target area covering a time period between January 2008<br />
and February 2011. These datasets were processed using the Small<br />
Baseline Subset (SBAS) radar-interferometric approach. Courtesy of<br />
Astrium Services / Infoterra GmbH.<br />
— developed by both satellite operators<br />
and software companies — are still<br />
on the steep slope of the development<br />
curve. “We develop many applications<br />
for internal company use, as we are a<br />
service provider, and offer value-added<br />
products and services based on our own<br />
and sometimes we also make such tools<br />
available to our customers, who use<br />
them within their own working environments.<br />
Additionally, we also support<br />
software and application developers,<br />
such as ERDAS, with sample data and<br />
joint training activities.”<br />
accuracy, and coverage, says Kern, who<br />
expects the global dataset to be available<br />
in 2014.<br />
The company has recently released<br />
its updated GEO Elevation Suite, which<br />
includes the radar-based Elevation10<br />
product — globally available regional<br />
IMAGING NOTES // FALL 2011 // WWW.IMAGINGNOTES.COM<br />
33
elevation models with up to 5-meter accuracy<br />
at 10-meter grid spacing. Astrium also<br />
recently began phase A (analysis & assessment)<br />
for its follow-on mission, TerraSAR-<br />
X2. “We aim to launch it in 2016,” Kern<br />
says. “It should bring improved collection<br />
capabilities, especially resolution down to<br />
25 centimeters.”<br />
In November 2010, e-GEOS<br />
launched the last of four identical satellites,<br />
all of which orbit at an altitude<br />
of about 620 kilometers. “We now<br />
SS<br />
FIGURE 9. Subset of a Color SAR image (colorized radar image) of Fairbanks, Alaska, U.S.<br />
in comparison to the base TerraSAR-X SpotLight acquisition (1.6-m resolution). Courtesy of<br />
Astrium Services/Infoterra GmbH.<br />
have the full constellation in orbit and<br />
COSMO-SkyMed is at its maximum<br />
capacity,” says Pietranera. “We can<br />
task the satellites separately or use them<br />
together to cover large areas faster or<br />
to revisit the same locations more<br />
frequently. This is very important for<br />
many applications, especially those that<br />
require analyzing change over time.”<br />
Next year, the European Space<br />
Agency (ESA) will launch a new mission,<br />
Sentinel 2, which will be a continuation<br />
9<br />
of its previous, highly successful ERS<br />
and ENVISAT missions. It will use the<br />
C band and will have a resolution in the<br />
tens of meters. This will be very good<br />
for covering large areas, Pietranera<br />
points out, though the imagery will not<br />
be as fine-grained as that generated by<br />
COSMO-SkyMed, which uses the X<br />
band and has a resolution of one meter.<br />
Korea’s Multi-Purpose Satellite-5<br />
(KOMPSAT-5), the country’s first SAR<br />
satellite, will operate in low earth orbit<br />
(LEO) and carry an X-band SAR. Built<br />
and operated by the Korea Aerospace<br />
Research Institute (KARI), its primary<br />
mission is to provide high-resolution<br />
mode SAR images of 1-meter resolution,<br />
standard mode SAR images of 3-meter<br />
resolution, and wide-swath mode SAR<br />
images of 20-meter resolution. During<br />
its five-year mission, it will execute allweather<br />
and all-day observations of the<br />
Korean peninsula. The launch, repeatedly<br />
delayed, is now scheduled for<br />
November 2011 (www.satelliteonthenet.<br />
co.uk/index.php/launch-schedule).<br />
Radar imaging satellites — which<br />
have lower resolution than optical ones,<br />
but are better for change detection —<br />
have become a standard tool for intelligence,<br />
military, agricultural, and other<br />
applications and are essential to meet<br />
imagery requirements in persistently<br />
cloudy regions. Two European companies<br />
recently launched radar satellites<br />
and new ones are under development<br />
in Europe, Korea, Brazil, and China.<br />
Brazil and China are considering the<br />
development of a new family of radar<br />
satellites to monitor deforestation.<br />
Sales of radar data are still mostly<br />
to governments and businesses, but<br />
consumer applications are the next area<br />
for growth. The two biggest challenges<br />
now for this segment of the geospatial<br />
industry are to develop software tuned<br />
to the requirements of specific users —<br />
for example, the different change detection<br />
requirements of agricultural and<br />
military users — and to train them to<br />
interpret radar data, which is harder to<br />
interpret than optical data.<br />
34<br />
IMAGING NOTES // FALL 2011 // WWW.IMAGINGNOTES.COM
IMAGING NOTES // FALL 2011 // WWW.IMAGINGNOTES.COM<br />
35
A Special Excerpt for<br />
<strong>Imaging</strong> <strong>Notes</strong> Readers.<br />
Subscribe at<br />
www.LBxJournal.com.<br />
GeoEconomy Standards<br />
Improving International<br />
Food Security<br />
Spacial Law Update<br />
Scaling Location Data in<br />
Australia and New Zealand
GeoEconomy<br />
Standards<br />
The Value of Simplifying the<br />
Exchange of Geoinformation<br />
In this article we invite you to consider that the global<br />
GeoEconomy, as well as many valuable non-economic activities,<br />
depends on the exchange of geoinformation and that<br />
the cost-efficient exchange of geoinformation depends on<br />
standards, particularly open standards.<br />
By Steven Ramage<br />
Executive Director, Marketing and<br />
Communications<br />
Open Geospatial Consortium (OGC)<br />
TRANSPORTATION AND COMMUNICATIONS TECHNOLOGIES<br />
have ushered in a new global GeoEconomy, making<br />
production networks and trading networks more spatially<br />
distributed, dynamic and complex than ever before.<br />
Geoinformation adds value in any economy (agricultural,<br />
industrial, or information age) because location-based<br />
content and services bring buyers and sellers together and<br />
help assess costs and risks. Geoinformation is thus, in the<br />
GeoEconomy, an increasingly valuable commodity, and is<br />
increasingly bought, sold or given away as infrastructure.<br />
In The Global Shift, Peter Dicken wrote “The geoeconomy…can<br />
be pictured as a geographically uneven,<br />
highly complex and dynamic web of production networks,<br />
economic spaces and places connected together through<br />
threads of flows. Once established, a cluster tends to grow<br />
through a process of cumulative, self-reinforcing development<br />
involving:<br />
<br />
Attraction of linked activities<br />
<br />
Stimulation of entrepreneurship and innovation<br />
<br />
Deepening and widening of the local labor market<br />
<br />
Economic diversification<br />
<br />
Enrichment of the ‘industrial atmosphere’<br />
‘Thickening’ of local institutions<br />
<br />
Intensification of the socio-cultural milieu<br />
<br />
Enhanced physical infrastructures.”<br />
What Is a Geospatial Standard?<br />
Communication means “transmitting or exchanging<br />
through a common system of symbols, signs or behavior.”<br />
Standardization means “agreeing on a common system.”<br />
Information exchange of any kind depends on information<br />
standards such as alphabets, grammars, vocabularies,<br />
number systems and digital encodings.<br />
Simple verbal geo-communication<br />
(“meet me at my house”) is easy.<br />
Exchanging geoinformation between<br />
digital systems (machine to machine) is<br />
more complicated.<br />
The complexity of geoinformation<br />
exchange becomes apparent when you<br />
consider the many different ways we<br />
can encode location, measure distance<br />
and altitude, image the Earth, describe<br />
curves, calculate area, adjust computational<br />
errors, name geographic features,<br />
etc. (See Figure 1 for an illustration of<br />
geoinformation exchange.) As more<br />
devices and digital systems incorporate<br />
geospatial information, the absence of a<br />
Summary<br />
This article discusses the<br />
benefits of geospatial<br />
standards including:<br />
ÆÆ<br />
Cost savings and costeffective<br />
product and<br />
service development<br />
ÆÆ<br />
The ability to share location<br />
data across multiple devices<br />
and software platforms<br />
Æ Æ Increasing the value of the<br />
location data<br />
standardized communication language makes interoperability<br />
between software and devices a challenging and costly<br />
proposition. Some geospatial standards specify whether<br />
latitude or longitude must come first, and whether these<br />
numbers are to be expressed as floating point numbers or<br />
degrees, minutes and seconds. A standard might specify<br />
whether a comma or a colon separates the coordinate pairs<br />
that define the segments in a line.<br />
With such standards, software developers don’t need to<br />
reinvent or even fully understand the interfaces and encodings<br />
that order this kind of communication. These complex-<br />
LBx Journal // 37 // www.lbxjournal.com // Location in the Language of Business // Fall 2011
ities can be hidden from the user, to focus on the end-user<br />
objectives for the use of the geoinformation.<br />
The Value of Sharing Geoinformation<br />
The value of geoinformation is apparent in everyday activities<br />
when delivered via location-specific online ads, in-car<br />
GPS, Web maps, friend-finder apps on cell phones, 911<br />
emergency location services, “Call Before You Dig” services,<br />
etc. The list of familiar and useful applications is long, and<br />
many other applications are less familiar but provide value<br />
in domains such as infrastructure maintenance, hydrology,<br />
urban planning, logistics, fraud management, mobile workforce<br />
management, and so on.<br />
Geoinformation is part of the information that passes<br />
between companies and organizations in a value chain.<br />
Most providers of geographic information systems, Earth<br />
imaging systems, spatial database systems, and some providers<br />
of location-based services implement open standards that enable<br />
their users to query each others’ systems for data and services.<br />
Convergence and Fusion<br />
Open standards enable software to do much of the data<br />
management and manipulation that once had to be done<br />
manually, and this affects workflows. For example, text,<br />
audio and video have converged in Web applications, partly<br />
through the Web’s open standards. Web mapping represents<br />
a convergence of map display technology, mass-market Web<br />
server technology, and Web programming technologies,<br />
and this comes partly through open standards.<br />
Fusion refers generally to the integration of information.<br />
Ç Ç FIGURE 1. This chart illustrates the multiple sources of geospatial<br />
information and exchange of information that takes place to deliver<br />
a geoinformation service to an end user. Courtesy of the Open<br />
Geospatial Consortium.<br />
Ironically, people often recognize the value of sharing geoinformation<br />
after recognizing the value of geoinformation.<br />
Local, subnational and national governments, for example,<br />
have information they would like to share, because they<br />
would like to avoid redundant data collection and be able<br />
to “roll up” data from multiple sources and provide better<br />
information to officials and citizens. Users of messaging<br />
services and social networking services would like to be able<br />
to share location information with others who use different<br />
social networking or messaging platforms. For geospatial<br />
information to have real value, it must be shared and<br />
exchanged.<br />
The simplest location services involve merely accessing a<br />
simple database of geographic points of interest and their<br />
geographic coordinates. More sophisticated services can<br />
involve combining – fusing – geographic features from different<br />
databases, looking for changes in features, selecting<br />
features based on temporal queries, or other operations that<br />
may require accessing external data or services.<br />
Mobile devices that increasingly feature sensors represent<br />
convergence and fusion. Open standards can support<br />
systems that analyze, process and exploit the same or different<br />
types of data or products from multiple sensors to<br />
improve detection, identification, location, and tracking.<br />
The Market-building Value of Open Platforms<br />
The Web is perhaps the most dramatic example of open<br />
standards supporting market growth, but this phenomenon<br />
has been well understood since the advent of commodity<br />
nuts and bolts and standard spacing of railroad rails.<br />
LBx Journal // 38 // www.lbxjournal.com // Location in the Language of Business // Fall 2011
Similarly, open geospatial standards increase the value of<br />
geospatial data because, for example, they enable any data<br />
service that can produce a simple map image to provide that<br />
image to any application via a single http request.<br />
Data for selected geographic regions represented in<br />
complex Earth images and vector files can likewise be delivered<br />
through queries that implement open standards. This<br />
applies as well to simple and complex geoprocessing Web services<br />
and to geolocated sensors and sensor data stores. Both<br />
data and services increase in value with the number of nodes<br />
in the world’s vast network of servers running applications<br />
that implement open geospatial interfaces and encodings.<br />
Not all of the geospatial information products and services<br />
provided via the Web depend on open standards, but many<br />
do. Google brought KML, the application programming interface<br />
for Google Maps and Google Earth, into the OGC to be<br />
maintained as an open standard. Michael Weiss-Malik, Google<br />
KML product manager, explained, “What OGC brings to the<br />
table is…everyone has confidence we won’t take advantage of<br />
the format or change it in a way that will harm anyone... Governments<br />
like to say they can publish to OGC KML instead<br />
of Google KML.” KML is now implemented in Web mapping<br />
applications from other vendors.<br />
Standards for consumer services such as next bus arrival<br />
time, wifi hotspot finder or camera location focus on lightweight<br />
geospatial standards such as very small profiles of<br />
the OGC Geography Markup Language (GML) Encoding<br />
Standard. Other examples include the candidate OGC Open<br />
GeoSMS encoding standard; Geo<strong>PDF</strong> (a candidate OGC<br />
Best Practice); GeoRSS (which includes a GML option);<br />
and GeoJSON, an open format for encoding a variety of geographic<br />
data structures that implements the OGC/EPSG’s<br />
standard way of managing coordinate reference systems.<br />
Most providers of geographic information<br />
systems, Earth imaging systems, spatial<br />
database systems, and some providers of<br />
location-based services implement open<br />
standards that enable their users to query each<br />
others’ systems for data and services.<br />
However, some platform and social networking companies<br />
seeking to capture and keep users may avoid implementing<br />
open geospatial standards in situations where such standards<br />
would enable users to exit easily to other websites. At the same<br />
time, many social media, crowdsourcing and user-generated<br />
content sites chartered to provide societal benefit, such as Ushahidi,<br />
InRelief, Sahana and Haiti SDI VGI implement open<br />
standards to broaden participation by developers and users.<br />
Open platforms are important as a means of integrating<br />
the elements of distributed or federated geospatial datasharing<br />
networks. At all levels of government around the<br />
world, officials want to be able to share maps on the Web<br />
and deliver data to different systems. They want to have<br />
a common language to speak about geospatial data and<br />
SDOs: Finding Value in a Cluster<br />
We live in a highly interconnected world, and inclusive<br />
industry standards development organizations (SDOs)<br />
that develop and promote open standards provide much<br />
of the “glue” that enables the interconnectedness. Standards<br />
enable technology convergence and information<br />
fusion, and they create a common platform for growth of<br />
markets for geospatial data, services and products.<br />
Businesses, government agencies, non-governmental<br />
organizations, universities and research institutes participate<br />
in SDOs because they want to help shape networks.<br />
Members share the cost of developing and maintaining<br />
interfaces and encodings. User organizations avoid<br />
the costs of custom integration, avoid vendor lock-in,<br />
maximize the value of previously purchased software<br />
and data, and pool their market power to influence<br />
the direction of technology development. Universities<br />
and research centers stay at the technology forefront,<br />
develop relationships with businesses and government<br />
agencies, and advance open source applications.<br />
services, and they want all the systems in a data-sharing<br />
network to conform to sometimes complex security rules<br />
relating to geospatial data exchange. Standards-based government<br />
spatial data infrastructures (SDIs) expand markets<br />
for geospatial data, software and services.<br />
Where Would the GeoEconomy Be Without Open<br />
Standards?<br />
Without geospatial standards of some kind, there could<br />
be no communication of geospatial information. Like paved<br />
cow paths, or natural languages, many standards are formalizations<br />
of common usage. Empires are important drivers<br />
for such formalizations. For example, the Prime<br />
Meridian passes through the Observatory at Greenwich<br />
largely because England had dominated the<br />
seas for almost two centuries before the U.S. called<br />
for an International Meridian Conference to establish<br />
a single global standard. In the digital age,<br />
innovation speeds along, constantly creating new<br />
and pathless territory for standardization. Companies<br />
vie for dominance, hoping to establish their<br />
proprietary encodings and interfaces as platforms<br />
for further development that they can control and exploit.<br />
With nothing but proprietary standards, geospatial<br />
information would certainly flow to support the global Geo-<br />
Economy and non-economic activities, and there would be a<br />
market in geoinformation. There would still be technology<br />
convergence, information fusion and growth of markets for<br />
geospatial data, services and products. With open standards,<br />
however, there is more competition and more innovation.<br />
Users can influence technologies’ directions through standards<br />
and they can shop in a more bounteous market. Entrepreneurs<br />
have more reason to hope, and both new and established<br />
businesses have more potential customers. We would<br />
still have a geoeconomy without open standards, but it would<br />
be more constrained by monopolies.<br />
LBx Journal // 39 // www.lbxjournal.com // Location in the Language of Business // Fall 2011
Improving<br />
International Food<br />
Security<br />
The Key is Access to Local Information<br />
By Jindra Cekan, Ph.D.<br />
Summary<br />
This article discusses the<br />
information, infrastructure<br />
and inputs obstacles to improving<br />
food security in the<br />
developing world, and the<br />
promise of enabling access<br />
to local information to align<br />
production and distribution<br />
of food.<br />
AS A PROFESSIONAL IN INTERNATIONAL FOOD SECURITY, I WORK WITH<br />
organizations that support people and communities in generating sufficient<br />
food production and income to meet their food and other basic<br />
needs. Markets, and the information that drives them, are key to international<br />
food security.<br />
In 20 years of working in development programs in Africa and elsewhere, I and<br />
many others believe that information, infrastructure and inputs are weak links<br />
for most smallholder farmers. Many farmers, both female and male, are working<br />
18-hour days with rudimentary tools for small yields, only to have their crops spoil<br />
due to lack of access to the best buyers and markets. Access to timely information<br />
about a range of topics, from seed production comparisons, to market price differences<br />
for goats, to high demand in regional towns, can be key in getting the right<br />
products produced and sold at competitive prices. Such access also helps inform<br />
food and livestock producers on where food and animals are best sold.<br />
International Food Security<br />
Barriers<br />
A West African colleague described<br />
the three barriers to international food<br />
security as:<br />
1. a lack of information on food<br />
availability because many<br />
producers are not integrated<br />
into the network – their<br />
production remains in the local<br />
area where food conservation is<br />
non-existent;<br />
2. a lack of roads, which blocks<br />
global socio-economic<br />
development;<br />
3. a lack of food conservation<br />
infrastructure that reduces<br />
shelf life of food.<br />
4. I would add a lack of knowledge<br />
of the best seeds, tools,<br />
vaccinations, etc., such as the<br />
Google searches and sectoral<br />
listserves we take for granted.<br />
According to Yaya Ba, head of<br />
capacity building of agricultural<br />
enterprises at Burkina Faso’s National<br />
Agency of Export Promotion, we must<br />
develop communication on food availability<br />
throughout the country by<br />
reinforcing the network. To get there,<br />
there is both bad news and good.<br />
LBx Journal // 40 // www.lbxjournal.com // Location in the Language of Business // Fall 2011
The Bad News<br />
Global population will reach 7 billion in the next two years.<br />
Food prices and market volatility continue to push deeper<br />
into hunger the one billion who are now unable consistently<br />
to feed themselves. There are also structural inequities that<br />
information, infrastructure and inputs can address. For<br />
instance, according to the Population Reference Bureau,<br />
the demographics of the developing world indicate that the<br />
population there is becoming younger and younger; 50% of<br />
many African (and some Asian and<br />
Latin American) countries will soon be<br />
under the age of 15, but jobs are scarce.<br />
Globally, it is now understood by<br />
international development professionals<br />
that women produce about half of<br />
the world’s food but own less than 5%<br />
of all property, and widows experience<br />
special discrimination, without<br />
rights to inherit land. Listen to the<br />
Radio Netherlands Interview for more<br />
details at www.rnw.nl/africa/radioshow/land-titles-women-too.<br />
Both women and men, especially<br />
youth, need control over the land, crops<br />
and livestock they manage in order to<br />
invest their precious time, energy and<br />
resources. Investing in these smallscale<br />
subsistence farmers is the critical<br />
way to prevent future hunger crises<br />
and the political unrest that such crises<br />
spark. Geospatial information that links<br />
information about their production with<br />
demands for the crops and animals produced<br />
can be one part of the answer.<br />
The Good News<br />
After the World Bank’s 2008 World<br />
Development report showed that agriculture<br />
was massively under-invested,<br />
and after the food price crises of 2008<br />
and 2011 led to violence, donors and<br />
private funders began re-investing in<br />
farming. According to Secretary of State<br />
Hillary Clinton, six of the world’s 10 fastest-growing<br />
economies in the last decade<br />
are in Sub-Saharan Africa. New seed innovations combined<br />
with massive infrastructure investments that China has been<br />
making across the ‘developing’ world bode well for production<br />
and marketing. A recent UK study showed that improving<br />
infrastructure and management of food could eliminate postharvest<br />
loss by 30-40% 1 , which is staggering considering that<br />
the United Nations Food and Agriculture Organization (FAO)<br />
recently said that one-third of the world’s food is wasted.<br />
Information is increasingly democratizing progress. While<br />
Africa is also the fastest growing market for mobile phones, all<br />
‘developing’ world continents are growing and represent the<br />
majority of 2.4 billion mobile phone users worldwide.<br />
BIO Jindra Cekan has a Ph.D. in<br />
international development from<br />
The Fletcher School ‘94, and 23<br />
years of experience in food security,<br />
livelihoods and knowledge management.<br />
After overseeing worldwide food<br />
programming for Catholic Relief Services<br />
and the American Red Cross, she founded<br />
her consulting firm (www.cekanconsulting.<br />
com) for international development<br />
nonprofits. Her clients have included the<br />
Bill & Melinda Gates Foundation, Mercy<br />
Corps, Lutheran World Relief, World Vision,<br />
Save the Children, CARE and others. Jindra<br />
has worked in 25 countries including 13 in<br />
sub-Saharan Africa, as well as Central<br />
America, Central Asia and the Balkans. She<br />
believes in the power of organizations to<br />
learn from their own best practices,<br />
honouring country-national knowledge for<br />
sustained impact. Jindra can be reached at<br />
jindra@cekanconsulting.com.<br />
Even in 2007, Kenya was a front-runner in mobile innovation.<br />
The Kenya Agricultural Commodity Exchange provided some<br />
crop growers with up-to-date commodity information via text<br />
message (sms). This technology allowed farmers to access daily<br />
fruit and vegetable prices from a dozen markets, which enabled<br />
them to skip the hours-long journey to town and instead rely on<br />
mobile phones for potential buyers and prices; such innovation<br />
has led some to quadruple their earnings. As such coverage<br />
spreads, the benefits could multiply and foreign aid could wane.<br />
New Solutions<br />
A variety of initiatives improve information,<br />
inputs and infrastructure, many<br />
funded by foundations such as Rockefeller<br />
and the Bill and Melinda Gates<br />
Foundation and government agencies<br />
such as USAID and UK’s DIFD. Grants<br />
are filling the gaps that keep producers<br />
impoverished and agriculture value<br />
chains inefficient. For instance, USAID<br />
is piloting information communications<br />
technologies (ICT) applications<br />
that provide market price information to<br />
those within agriculture value chains.<br />
The U.N. World Food Program’s (WFP)<br />
Purchase for Progress (Gates-funded)<br />
links WFP’s demand for food crops (to<br />
be reused as food aid) with partners who<br />
support farmers to produce food surpluses<br />
and sell them at a fair price. By<br />
2013, WFP expects at least half a million<br />
smallholder farmers – mostly women –<br />
will have increased and improved their<br />
agricultural production and earnings.<br />
Yet progress is slow in low-literacy contexts<br />
and few systematic informationsharing<br />
systems exist.<br />
I believe that all of these initiatives<br />
could benefit from geospatial market<br />
information sharing using simple<br />
mobile phones. If buyers knew where<br />
village surpluses were, they could<br />
consolidate purchases and wholesale<br />
them more efficiently. If sellers knew<br />
where the highest market prices were<br />
(as in the Kenya example above), they could direct their<br />
sales there, rather than sell at low profit to local purchasers,<br />
and stem losses from overproduction. If local information<br />
were more effectively shared and distributed through<br />
mobile phones, coupled with better roads, improved seeds,<br />
and food drying and canning to stem losses, food security<br />
would be dramatically improved across Africa, Asia and<br />
Latin America.<br />
FOOTNOTE 1. Watson, Robert. University of East Anglia (U.K.), Highlights<br />
from proceedings at the Global Conference on Agriculture, Food Security<br />
and Climate Change. November 1, 2010, Volume 184, No. 2.<br />
LBx Journal // 41 // www.lbxjournal.com // Location in the Language of Business // Fall 2011
Executive<br />
Interview<br />
Law, Regulations,<br />
and Best Practices<br />
of Location Data<br />
Executive Interview with Kevin Pomfret, Esq.,<br />
Executive Director, Centre for Spatial Law and Policy<br />
BACKGROUND Privacy and security are hot topics relative to the<br />
use of location data. While there are several bills circulating in<br />
Congress, and some initiatives in the Executive Branch, not much<br />
has changed in the U.S. over the last five years because the law and policy<br />
environment is so much more reactive than proactive in the U.S. Unfortunately,<br />
the U.S. is playing catch up with the technologies. Internationally<br />
there are more efforts to regulate certain areas and to regulate location<br />
privacy. For example, in the past couple of years European privacy<br />
regulators have focused on Google Street View, RFID technology and<br />
mobile applications. We were pleased to speak with Kevin Pomfret of the<br />
Centre for Spatial Law and Policy on his perspective of the legal and policy<br />
landscape, the burning issues for providers and users of location, and the<br />
future of best practices and guidelines.<br />
LBX Is there something particularly special about geodata?<br />
POMFRET One unique aspect of geodata is that it is so versatile. It can<br />
be used for a variety of purposes – both positive and negative – which<br />
can create more risks. For example, in an emergency, knowing the exact<br />
locations of individuals can save lives; but that same technology could<br />
also be used to stalk someone without proper controls. From a consumer<br />
perspective, lawmakers are very concerned with the potential of geospatial<br />
technology to stalk people.<br />
However, they are struggling with how to define what privacy is from<br />
a location perspective. Privacy from a location perspective is not as<br />
simple as protecting a social security number or medical records (areas<br />
of privacy law that are already protected). For example, what is it that is<br />
private relative to location? Is it within a few feet or within a zip code? Is<br />
there a temporal component to it? One of the challenges will be defining<br />
what location privacy is in the United States.<br />
LBX Who owns the data of an individual’s location?<br />
POMFRET Some argue that the individual should own the data, determine<br />
how it should be used and give consent to how third parties use<br />
the data. Others believe that whoever collects the data should own it.<br />
However, in either case, the key issue is what<br />
right does a third party have to use the data.<br />
LBX What are the most important concerns for<br />
companies that provide location data?<br />
POMFRET There are three areas of exposure<br />
that providers should pay attention to:<br />
<br />
PRIVACY<br />
It is not always obvious to a company<br />
that a dataset may be subject to privacy concerns<br />
because the provider may view the data as<br />
innocuous or publicly available. However,<br />
companies need to pay attention to the bills<br />
currently before Congress because one of the<br />
issues being addressed is the privacy implications<br />
associated with the aggregation of data and<br />
whether individuals can be identified or targeted.<br />
<br />
INTELLECTUAL PROPERTY<br />
Most geospatial<br />
data products and services are based on<br />
a compilation of various datasets that are<br />
subject to different licensing arrangements.<br />
Often this is not well understood within an<br />
organization beyond a legal department.<br />
It is critical that companies understand the<br />
restrictions and limitations on their right to<br />
use data, and how these impact existing and<br />
future products and services.<br />
<br />
DATA QUALITY<br />
In a world where millions of<br />
people are accessing location information<br />
for a variety of different reasons, providers<br />
of location information must recognize that<br />
the users of their data or applications are<br />
not always experts in geospatial technology.<br />
LBx Journal // 42 // www.lbxjournal.com // Location in the Language of Business // Fall 2011
Moreover, consumers often receive greater<br />
protection under the law than businesses.<br />
Businesses will need to consider various<br />
scenarios in the design of products and<br />
services to mitigate against the consumers’<br />
potential misuse.<br />
community right now. There needs to be attention to how the data will<br />
be used. For example, if the data is being used for navigation purposes<br />
then the provider needs to make sure that the data is not going to be<br />
used in a manner that runs afoul of state or national laws. Providers must<br />
comply with the laws and make sure that the data is not collected in a<br />
way that violates privacy laws.<br />
LBX How do cloud-based services factor into these considerations?<br />
POMFRET The cloud complicates things. There is always increased<br />
complexity when a third party is involved, such as a provider of cloud<br />
services. Whenever there is someone or an organization outside of<br />
your control, there is increased complexity and therefore increased<br />
risk. Location data is inherently multi-dimensional – which also creates<br />
uncertainty.<br />
Usage rights are not fully appreciated<br />
in the community right now.<br />
LBX How does the law treat companies and individuals differently when it<br />
comes to location data and privacy versus security and confidential information?<br />
POMFRET The approach to companies and individuals will be different.<br />
The concerns about individuals using location data are regarding<br />
the ability to track other individuals, especially within a relationship of<br />
concern. In other words, from an individual perspective, the greatest<br />
concern right now is the ability to use location data to stalk another<br />
person. In a business relationship, the concern is the ability to aggregate<br />
datasets and make decisions that impact an individual’s privacy based on<br />
that data – for example, using location information for making decisions<br />
on insurance rates or for personalized advertising. The ability to aggregate<br />
data with a broader range of datasets, integrate it into multiple<br />
applications, and distribute it across multiple technology platforms,<br />
subjects the use of the data to greater uncertainty.<br />
ÇÇ<br />
KEVIN POMFRET, ESQ., Executive Director, Centre for<br />
Spatial Law and Policy<br />
LBX Similarly, what is the most important<br />
concern for users of location data?<br />
POMFRET Business users need to make sure<br />
that they have the rights to use the data. This<br />
means understanding the rights under the<br />
various license agreements under which they<br />
received the data and how terms are defined.<br />
When combining various databases, the first<br />
question a user needs to ask is, “do I have the<br />
right to do this under my license agreements?”<br />
Secondly, understanding the allocation of<br />
risk in every location information transaction<br />
is becoming increasingly important. There is<br />
risk associated with usage and data quality. Is<br />
the dataset being relied upon complete? Is it<br />
sufficient for the intended use of the product<br />
or service, especially if the user is reselling it?<br />
Usage rights are not fully appreciated in the<br />
LBX Are there any best practices in the space?<br />
POMFRET There are a few efforts to develop best practices. For<br />
example, CTIA (The Wireless Association) has developed best practices<br />
for mobile devices; Australia and New Zealand have developed<br />
guidelines for the use of government data. Although these are a couple<br />
of examples of best practices for privacy, they are not necessarily<br />
complete as they reflect a narrow constituency. Nonetheless, they are<br />
starting points and worth reviewing.<br />
LBX What about best practices on the business side?<br />
POMFRET It’s difficult to comment on that as the business situations vary<br />
so much. However, I do believe that we will see geospatial audits in the<br />
near future as a means of ensuring compliance with licensing agreements,<br />
adequate quality control, ensuring that customers are using the data<br />
appropriately, and protecting against foreseeable misuse. My sense is that<br />
its use will evolve depending on the company and the importance of the<br />
respective issues. For example, it may come from the finance office to make<br />
sure that all of the revenue is being collected from customers under license<br />
agreements. As location becomes an important component of products<br />
and services, best practices and legal frameworks will evolve as companies<br />
will require processes to understand all of their location information<br />
transactions, potential liability and privacy implications.<br />
LBx Journal // 43 // www.lbxjournal.com // Location in the Language of Business // Fall 2011
Executive<br />
Interview<br />
Scaling Location<br />
Data in Australia<br />
and New Zealand<br />
The R&D Behind It<br />
Peter Woodgate, CEO, Cooperative<br />
Research Center for Spatial Information<br />
Ç Ç Peter<br />
Woodgate<br />
BACKGROUND Australia and New Zealand have developed a<br />
forward thinking public-private partnership incubator for spatial<br />
information innovation. It’s called the Cooperative Research Center<br />
for Spatial Information (CRCSI). It is a joint venture of 110 organizations – a<br />
combination of private companies, government agencies, and academic<br />
institutions with $160 million under investment to solve and commercialize<br />
solutions to complex spatial research and development issues. Spatial<br />
innovation is critical to Australia and New Zealand’s economic, environmental<br />
and national security. In addition, one of the largest constellations<br />
of Global and Regional Navigation Satellites will in a few short years pass<br />
directly overhead. Australia is uniquely positioned to take advantage of the<br />
enormous potential of these new and emerging technologies.<br />
LBX Tell us a little about CRCSI and why<br />
spatial information is so critical to both the<br />
public and private sectors in Australia and<br />
New Zealand.<br />
WOODGATE The CRCSI has been set<br />
up as a long-term research engine to<br />
tackle grand challenges that can only be<br />
addressed through the unique cooperation<br />
of the private, public and research<br />
sectors.<br />
Spatial technologies and the information<br />
they generate underpin the<br />
Australian economy. Let me give several<br />
examples. Firstly, Australia’s largest<br />
export industry is mining and minerals<br />
exploration, which relies heavily<br />
on spatial technologies. Secondly, all<br />
property transactions rely on detailed<br />
Summary<br />
In this interview, Peter<br />
Woodgate discusses:<br />
ÆÆ<br />
Australia and New Zealand’s<br />
$160 million spatial<br />
incubator<br />
ÆÆ<br />
The vision for a spatial<br />
marketplace<br />
ÆÆ<br />
The role of government,<br />
the private sector and<br />
academia in collectively<br />
developing critical<br />
spatial technologies and<br />
infrastructure to support a<br />
location-referenced world.<br />
ÆÆ<br />
Solving location data<br />
challenges at scale<br />
data found in cadastre files held by government<br />
agencies (these include property boundaries,<br />
titles, ownership, land values, parcel, and location<br />
data). Thirdly, for a more macro example,<br />
Australia is extremely vulnerable to floods,<br />
bushfires, and cyclones. Our ability to rapidly<br />
respond to these natural disasters impacts the<br />
health of the national economy and crucially<br />
depends on a range of data from airborne and<br />
satellite sources.<br />
Tens of thousands of spatial datasets exist,<br />
especially in the public sector, but relatively<br />
few of them are readily available. Through our<br />
research projects we intend to revolutionize the<br />
availability and therefore value of these data.<br />
Moreover Australia has decided to drive<br />
toward the establishment of a National<br />
Positioning Infrastructure (NPI) that will deliver<br />
2-cm accurate positioning anywhere outdoors<br />
in real-time. This can only be accomplished by<br />
taking advantage of the existing GPS system<br />
and the new and emerging systems of Galileo<br />
(EU), GLONASS (Russia), Compass (China), QZSS<br />
(Japan) and IRNSS (India). Australia is uniquely<br />
positioned to take advantage of these constellations<br />
from a research and development<br />
perspective. The CRCSI’s research will underpin<br />
the NPI vision. Economic modeling that we<br />
commissioned suggests that we can add at least<br />
$32 billion to the Australian economy over the<br />
next 20 years with an NPI.<br />
LBx Journal // 44 // www.lbxjournal.com // Location in the Language of Business // Fall 2011
LBX What makes the CRCSI unique<br />
among technology incubator models<br />
around the world?<br />
WOODGATE Well we are not quite<br />
unique. There are similar research<br />
centres in Canada (GEOIDE), Korea<br />
(KLSG), Mexico (CentroGeo),<br />
Sweden (FPX) and Ireland (NCG).<br />
What makes these unique is the collaboration<br />
they engender between<br />
the public, private and research<br />
sectors. They all have significant<br />
resourcing allowing them to tackle<br />
large and complex spatial challenges<br />
in a true spirit of inter-sector<br />
and inter-disciplinary cooperation.<br />
CRCSI and these five other<br />
research centers also have strong<br />
education programs that seek to<br />
grow the much needed skilled<br />
capacity in spatial technology,<br />
thinking, and applications of our<br />
respective nations.<br />
While there are many national mandates around the<br />
world for the use of spatial/geographic data, there are<br />
relatively few committed and coordinated national investment<br />
plans incorporating a comprehensive strategic R&D<br />
roadmap.<br />
LBX There’s no shortage of seed and venture capital going into<br />
location-based technologies, especially on the consumer side.<br />
Why is the CRCSI model so critical to market acceleration?<br />
WOODGATE The CRCSI brings critical mass to the effort to<br />
remove barriers to progress and adoption. For example<br />
no one organization can create a fully functioning marketplace<br />
or a single nationwide, fully integrated positioning<br />
infrastructure. It is a complex task establishing and maintaining<br />
relationships between 110 organizations, spanning<br />
two nations and three sectors (government, private and<br />
research). Gaining consensus on the issues that we should<br />
tackle together, agreement on the considerable co-investment,<br />
explaining the value proposition and sourcing the<br />
best researchers represent the keys to success. There are<br />
institutional barriers that are being overcome because the<br />
partnering organizations have faith in the CRCSI due to its<br />
sheer size and reach.<br />
LBX You mentioned that CRCSI has a well-defined prospective<br />
portfolio and tackles complex spatial research problems. What<br />
are the top three problems CRCSI seeks to solve and commercialize<br />
with its current round of funding?<br />
ÇÇ<br />
FIGURE 1. This chart illustrates the spatial value chain from data capture to applications and the<br />
foundational technologies required to move along the value chain.<br />
WOODGATE The three main focus areas are:<br />
<br />
Resolving signal processing problems: To deliver the 2-cm<br />
positional accuracy I mentioned earlier requires resolving<br />
signal processing problems between all of the satellite<br />
navigation systems referenced. Especially important is<br />
the development of improved integer inference theory<br />
that will enable finer accuracy and subsequent integration<br />
of these new systems, together with the development<br />
of a single network available to all end users to provide<br />
this unprecedented accuracy and real-time positioning<br />
solution.<br />
<br />
Developing a “Spatial Marketplace”: Tens of thousands<br />
of spatial datasets exist, especially in the public sector,<br />
but relatively few of them are readily available. The first<br />
problem to solve is to unlock access to the spatial data<br />
that resides in government agencies. There are a number<br />
of licensing and interoperability issues to resolve, along<br />
with identifying the open source platform requirements.<br />
Australia and New Zealand have decided to set up a spatial<br />
marketplace to facilitate discovery and access to these data<br />
and to encourage the development and use of valueadded<br />
applications and services. The CRCSI’s research will<br />
help underpin the marketplace. We know that the spatial<br />
information industry contributes about $10 billion to<br />
Australia’s GDP and at least $1 billion to New Zealand’s. We<br />
expect that the systematic development of the marketplace<br />
will add several billion dollars more to this figure.<br />
<br />
Enabling data fusion and automated feature extraction of<br />
spatially sourced information in five application areas:<br />
LBx Journal // 45 // www.lbxjournal.com // Location in the Language of Business // Fall 2011
Executive<br />
Interview<br />
<br />
Agriculture and natural resources affected by climate<br />
change<br />
<br />
Defense<br />
<br />
Energy and utilities<br />
<br />
Health<br />
<br />
Sustainable urban planning<br />
LBX How are the projects for funding evaluated?<br />
WOODGATE We have a good understanding of the value<br />
chain. We have developed a detailed impact analysis that<br />
we call a “line of sight” research chain to ensure that the<br />
research idea is traced through the entire research chain to<br />
Tens of thousands of spatial datasets<br />
exist, especially in the public sector,<br />
but relatively few of them are readily<br />
available.<br />
the point of utilization and commercialization. All funded<br />
projects need to be within the context of that value chain<br />
as illustrated in Figure 1. Many companies, researchers, and<br />
engineers have a lack of understanding of the complete<br />
business value chain of these technologies, so this rigorous<br />
process is critical to accelerate market growth and realization<br />
of spatial information benefits. It significantly aids the<br />
understanding of all involved.<br />
LBX There’s a lot of buzz today around a GeoEconomy; what<br />
does that mean to you and how is it related to CRCSI’s focus on<br />
developing a Spatial Marketplace?<br />
WOODGATE There are many issues related to a Spatial Marketplace<br />
from market regulation to structural constraints on<br />
growth to developing viable business models. The industry<br />
has been dominated by the public sector in the past, and<br />
it’s alien for much of the private sector to think about the<br />
fundamentals of the creation of a whole marketplace.<br />
Trading data and spatial services, in the knowledge working<br />
economies of the future is a relatively new concept and<br />
is increasingly happening at scales that traditional spatial<br />
professionals are unaccustomed to. This is why the CRCSI is<br />
so important; it provides some structure and discipline to<br />
help explain what all this means and to help all accelerate<br />
the rate of take up of spatial technologies and products in<br />
existing and new markets.<br />
LBX Is the main focus of the Spatial Marketplace to unlock<br />
government spatial data or all spatial data?<br />
WOODGATE The focus is on all data from any source;<br />
however there is so much information locked up in government<br />
agencies that accessing these data is an important<br />
first step.<br />
LBX Can you share your perspective on the variety of geospatial<br />
data that resides in the government that is relevant to<br />
driving location-based applications?<br />
WOODGATE The data ranges from the traditional and<br />
well-known sources including the cadastre, topography,<br />
aerial and satellite imagery, and environmental data, to the<br />
new and emerging spatially enabled datasets like health.<br />
The pursuit of more accuracy, for example as we drive down<br />
to centimeter precision, means codification of more and<br />
more new data. In addition, as the supply and demand for<br />
data increases with the move to 3D and time-stamped data,<br />
spatial data stores will become phenomenally large.<br />
LBX What is your vision for the Spatial Marketplace? How do<br />
you envision it working for spatial stakeholders such as data<br />
providers, application providers, data users?<br />
WOODGATE My vision for the marketplace is focused on<br />
simplicity; simplicity of discovery, of access and of use. It<br />
will see a single catalogue of dataset descriptions, linked<br />
via a federated data model to the datasets themselves. So<br />
for example, if an analyst needs to put together a map of<br />
agricultural biomass for Australia, instead of toiling across<br />
individual data sources, she can search the marketplace and<br />
find eight agricultural datasets that when joined together<br />
cover the country.<br />
She can then combine these data with the most recent<br />
NOAA AVHRR (advanced very high resolution) satellite data<br />
and run an NDVI (Normalized Difference Vegetation Index)<br />
together with say a new tool that she has developed to<br />
produce a map of biomass based on these data and some<br />
new algorithms they have developed.<br />
The data are sourced via Creative Commons licensing,<br />
that in the case of these particular datasets lets others<br />
distribute, remix and build upon the work, even for commercial<br />
purposes, as long as they credit the original creators<br />
and license any new creations based on the work under<br />
the same terms (known as an Attribution-Share-Alike or CC<br />
BY-SA license). This truly liberates spatial data. Like the data,<br />
the apps that enable easy searchability and creation of maps<br />
are also under a Creative Commons license and are readily<br />
available from the marketplace as well.<br />
Accuracy and authentication are critical to success, so we<br />
will be encouraging a single custodian to act as a steward<br />
for each dataset offering a single point of truth.<br />
Finally, the industry is set to benefit greatly from the<br />
combination of the move to open standards and Creative<br />
Commons licensing, together with high speed broadband<br />
and the increasing availability of open access data.<br />
LBx Journal // 46 // www.lbxjournal.com // Location in the Language of Business // Fall 2011
WHAT IS LOCATION SMARTBRIEF:<br />
BUSINESS GAME CHANGER?<br />
››<br />
A FREE weekly e-mail news briefing<br />
››<br />
Created for professionals interested<br />
in the business impact of location<br />
information, services and technology<br />
››<br />
Sourced from hundreds of top media<br />
outlets<br />
››<br />
Need-to-know news applicable to<br />
many industry verticals<br />
››<br />
It’s FREE!<br />
DID YOU KNOW?<br />
LBx Journal has partnered<br />
with SmartBrief to develop this<br />
customized weekly briefing for the<br />
location intelligence community.<br />
Location in the Language of Business<br />
Location Ecosystem<br />
How mashups brought location intelligence to life<br />
Location intelligence has changed greatly during its brief history, as technological changes<br />
have made location business intelligence more dynamic and interactive. The use of mashups<br />
to combine one location resource with another has greatly increased the utility of location for<br />
businesses by making it more cost-effective, Steve Benner writes. "Today, the mapping,<br />
analytic and spatial content [application programming interfaces] offered by traditional<br />
[geographic information systems] and LI vendors expose more functionality than most<br />
business users can digest," he writes. B-Eye-Network.com 5/19<br />
Location Forum launched!<br />
The first and only industry-owned association to offer executives a<br />
"business lab" environment to learn, network, share ideas and<br />
mitigate risk involved in applying location intelligence as a core<br />
element of their business strategy. Visit www.thelocationforum.org<br />
and become a member today.<br />
Industry Applications<br />
Businesses drive sales, build profiles with Foursquare<br />
Businesses are using the "check in" app Foursquare to promote sales and track the results of<br />
promotions. Companies such as Radio Shack give Foursquare regulars discounts and report<br />
that app users spend 3.5% more per transaction than nonusers. "The real value of<br />
Foursquare is likely to become apparent when companies move beyond pilot tests and<br />
integrate its data into their broader marketing tools and systems for customer-relationship<br />
management," writes Carine Carmy. MIT Technology Review online 5/24<br />
Groupon, Loopt partnership could help merchants manage inventory<br />
Loopt users will soon be getting Groupon alerts about nearby sales and discounts, thanks to a<br />
deal between Groupon and the mobile phone location app. The focus will be on "perishable<br />
inventory," or products and services that don't sell well on certain days. "If technology can help<br />
bring together customers that are getting discounts and local businesses that have perishable<br />
inventory, that's a win for everybody," said Loopt co-founder Sam Altman.<br />
Bloomberg Businessweek 5/20<br />
Business Strategy and Planning<br />
Full-cost accounting needs GIS to be successful<br />
Geographic information systems are being used to track indirect costs as part of full-cost<br />
accounting systems. GIS provides visualization and analysis of business locations and can<br />
help calculate the effects of environmental costs. Full-cost accounting is a holistic approach<br />
that can quantify environmental, societal and economic costs and benefits of business<br />
decisions. V1 Magazine Blog 5/22<br />
Location tools offer insights despite privacy worries<br />
Location-based technologies are valuable to businesses trying to understand their customers,<br />
but concerns about privacy and technological issues persist, says Jason Buchanan of Survey<br />
Sampling International. "We feel as though we are just scraping the tip of the iceberg" in terms<br />
of the technology's potential, he said. Research Magazine 5/2011<br />
Industry Association News<br />
Download the Location Forum's Location Ecosystem Map<br />
Download the Location Forum's Location Ecosystem Map for a comprehensive view of the<br />
location industry value chain. Monitor Japanese earthquake recovery with <strong>Imaging</strong> <strong>Notes</strong>'<br />
Japan Disaster Response Resources<br />
TO BEGIN RECEIVING YOUR FREE SUBSCRIPTION, PLEASE VISIT:<br />
SMARTBRIEF.COM/LBX
The world around us is not flat. You often need a solution that allows you to get information from<br />
more than just two dimensional imagery and data. Introducing E3De, an interactive geospatial<br />
software environment that allows you to extract important situational awareness from three<br />
dimensional data – providing you with more information about an area of interest than ever<br />
before. E3De has advanced tools to utilize raw LiDAR point cloud data and create photorealistic<br />
3D visualizations, extract 3D features from a scene, or produce 3D products and layers.<br />
Derived results can be included in your GIS, fused with 2D data for further analysis, and<br />
more. When you analyze the world in all three dimensions, you discover the full potential of<br />
your data and can make better, more informed decisions. Learn more at www.ittvis.com/E3De.<br />
E3De. Discover the Next Dimension of Your Data.<br />
E3De<br />
Geospatial Systems • Electronic Systems • Information Systems<br />
ITT, the Engineered Blocks, and “Engineered for life” are registered trademarks of ITT Manufacturing Enterprises, Inc., and are used under license. ©2011, ITT Visual Information Solutions