

Economics Markets Strategy - the DBS Vickers Securities Equities ...
Economics Markets Strategy - the DBS Vickers Securities Equities ...
Economics Markets Strategy - the DBS Vickers Securities Equities ...

Create successful ePaper yourself
Turn your PDF publications into a flip-book with our unique Google optimized e-Paper software.
<strong>Economics</strong> – <strong>Markets</strong> – <strong>Strategy</strong> Yield<br />
Chart 3: 2Y UST Yield - FFR vs 10Y UST Yield - FFR<br />
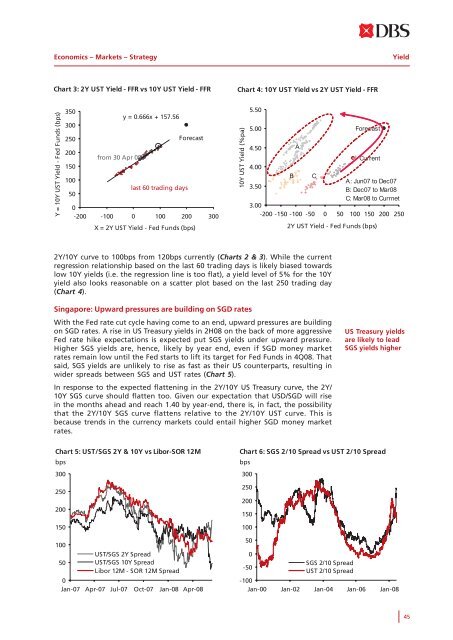
Chart 4: 10Y UST Yield vs 2Y UST Yield - FFR<br />
Y = 10Y UST Yield - Fed Funds (bps)<br />
350<br />
y = 0.666x + 157.56<br />
300<br />
250<br />
Forecast<br />
200<br />
from 30 Apr 08<br />
150<br />
100<br />
last 60 trading days<br />
50<br />
0<br />
-200 -100 0 100 200 300<br />
X = 2Y UST Yield - Fed Funds (bps)<br />
10Y UST Yield (%pa)<br />
5.50<br />
5.00<br />
4.50<br />
A<br />
Forecast<br />
Current<br />
4.00<br />
B C<br />
A: Jun07 to Dec07<br />
3.50<br />
B: Dec07 to Mar08<br />
C: Mar08 to Currnet<br />
3.00<br />
-200 -150 -100 -50 0 50 100 150 200 250<br />
2Y UST Yield - Fed Funds (bps)<br />
2Y/10Y curve to 100bps from 120bps currently (Charts 2 & 3). While <strong>the</strong> current<br />
regression relationship based on <strong>the</strong> last 60 trading days is likely biased towards<br />
low 10Y yields (i.e. <strong>the</strong> regression line is too flat), a yield level of 5% for <strong>the</strong> 10Y<br />
yield also looks reasonable on a scatter plot based on <strong>the</strong> last 250 trading day<br />
(Chart 4).<br />
Singapore: Upward pressures are building on SGD rates<br />
With <strong>the</strong> Fed rate cut cycle having come to an end, upward pressures are building<br />
on SGD rates. A rise in US Treasury yields in 2H08 on <strong>the</strong> back of more aggressive<br />
Fed rate hike expectations is expected put SGS yields under upward pressure.<br />
Higher SGS yields are, hence, likely by year end, even if SGD money market<br />
rates remain low until <strong>the</strong> Fed starts to lift its target for Fed Funds in 4Q08. That<br />
said, SGS yields are unlikely to rise as fast as <strong>the</strong>ir US counterparts, resulting in<br />
wider spreads between SGS and UST rates (Chart 5).<br />
In response to <strong>the</strong> expected flattening in <strong>the</strong> 2Y/10Y US Treasury curve, <strong>the</strong> 2Y/<br />
10Y SGS curve should flatten too. Given our expectation that USD/SGD will rise<br />
in <strong>the</strong> months ahead and reach 1.40 by year-end, <strong>the</strong>re is, in fact, <strong>the</strong> possibility<br />
that <strong>the</strong> 2Y/10Y SGS curve flattens relative to <strong>the</strong> 2Y/10Y UST curve. This is<br />
because trends in <strong>the</strong> currency markets could entail higher SGD money market<br />
rates.<br />
US Treasury yields<br />
are likely to lead<br />
SGS yields higher<br />
Chart 5: UST/SGS 2Y & 10Y vs Libor-SOR 12M<br />
bps<br />
300<br />
250<br />
200<br />
150<br />
100<br />
50<br />
UST/SGS 2Y Spread<br />
UST/SGS 10Y Spread<br />
Libor 12M - SOR 12M Spread<br />
0<br />
Jan-07 Apr-07 Jul-07 Oct-07 Jan-08 Apr-08<br />
Chart 6: SGS 2/10 Spread vs UST 2/10 Spread<br />
bps<br />
300<br />
250<br />
200<br />
150<br />
100<br />
50<br />
0<br />
-50<br />
SGS 2/10 Spread<br />
UST 2/10 Spread<br />
-100<br />
Jan-00 Jan-02 Jan-04 Jan-06 Jan-08<br />
45


